Kiowa County, OK Map & Demographics
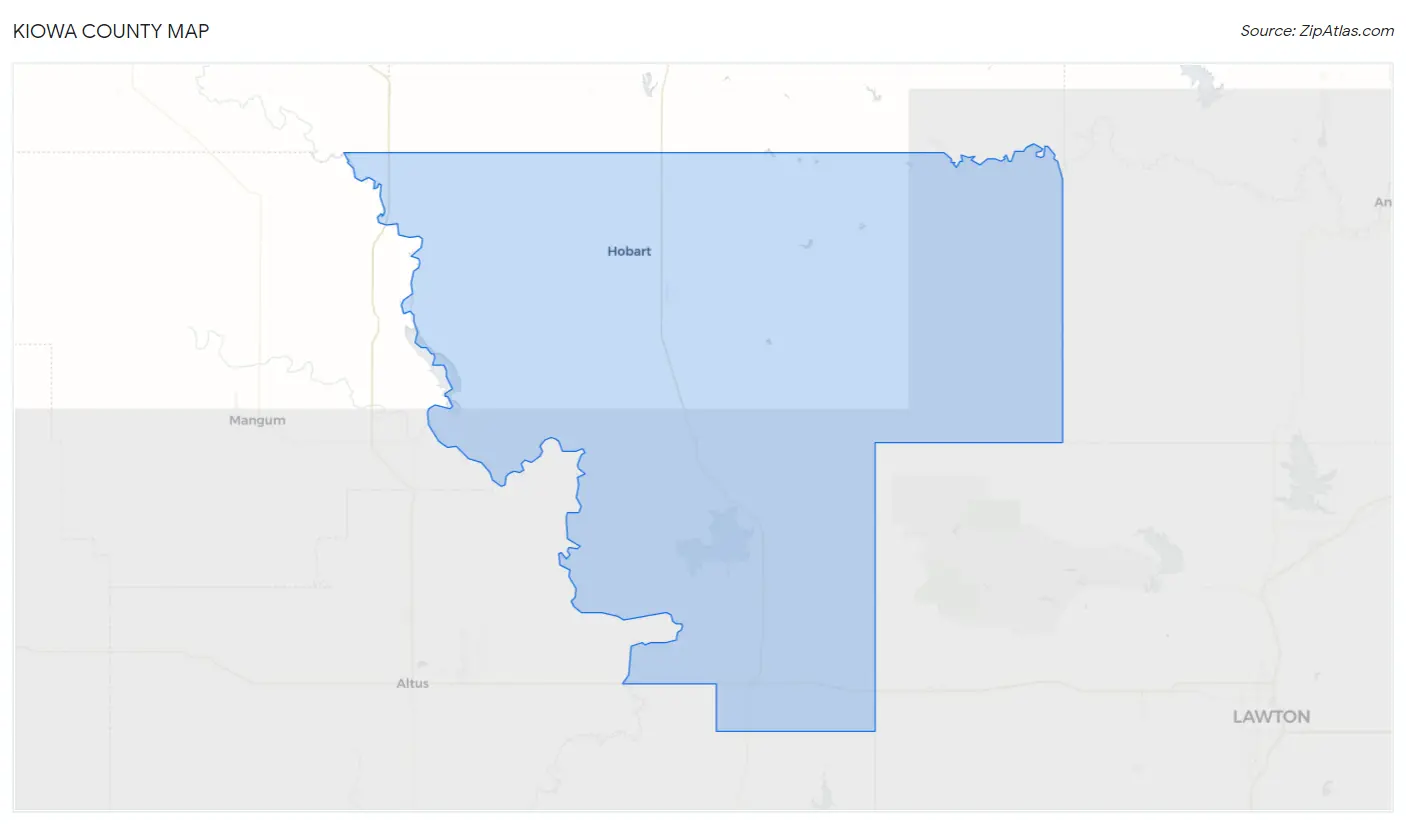
Kiowa County Map
Kiowa County Overview
$23,548
PER CAPITA INCOME
$59,394
AVG FAMILY INCOME
$42,679
AVG HOUSEHOLD INCOME
14.8%
WAGE / INCOME GAP [ % ]
85.2¢/ $1
WAGE / INCOME GAP [ $ ]
$13,448
FAMILY INCOME DEFICIT
0.44
INEQUALITY / GINI INDEX
8,446
TOTAL POPULATION
4,035
MALE POPULATION
4,411
FEMALE POPULATION
91.48
MALES / 100 FEMALES
109.32
FEMALES / 100 MALES
41.6
MEDIAN AGE
3.0
AVG FAMILY SIZE
2.5
AVG HOUSEHOLD SIZE
3,535
LABOR FORCE [ PEOPLE ]
53.5%
PERCENT IN LABOR FORCE
4.4%
UNEMPLOYMENT RATE
Kiowa County Area Codes
Income in Kiowa County
Income Overview in Kiowa County
Per Capita Income in Kiowa County is $23,548, while median incomes of families and households are $59,394 and $42,679 respectively.
| Characteristic | Number | Measure |
| Per Capita Income | 8,446 | $23,548 |
| Median Family Income | 2,272 | $59,394 |
| Mean Family Income | 2,272 | $69,183 |
| Median Household Income | 3,294 | $42,679 |
| Mean Household Income | 3,294 | $58,103 |
| Income Deficit | 2,272 | $13,448 |
| Wage / Income Gap (%) | 8,446 | 14.83% |
| Wage / Income Gap ($) | 8,446 | 85.17¢ per $1 |
| Gini / Inequality Index | 8,446 | 0.44 |
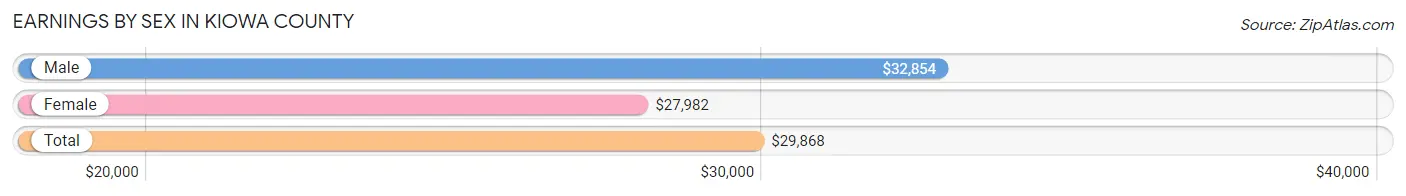
Earnings by Sex in Kiowa County
Average Earnings in Kiowa County are $29,868, $32,854 for men and $27,982 for women, a difference of 14.8%.
| Sex | Number | Average Earnings |
| Male | 1,941 (52.9%) | $32,854 |
| Female | 1,731 (47.1%) | $27,982 |
| Total | 3,672 (100.0%) | $29,868 |
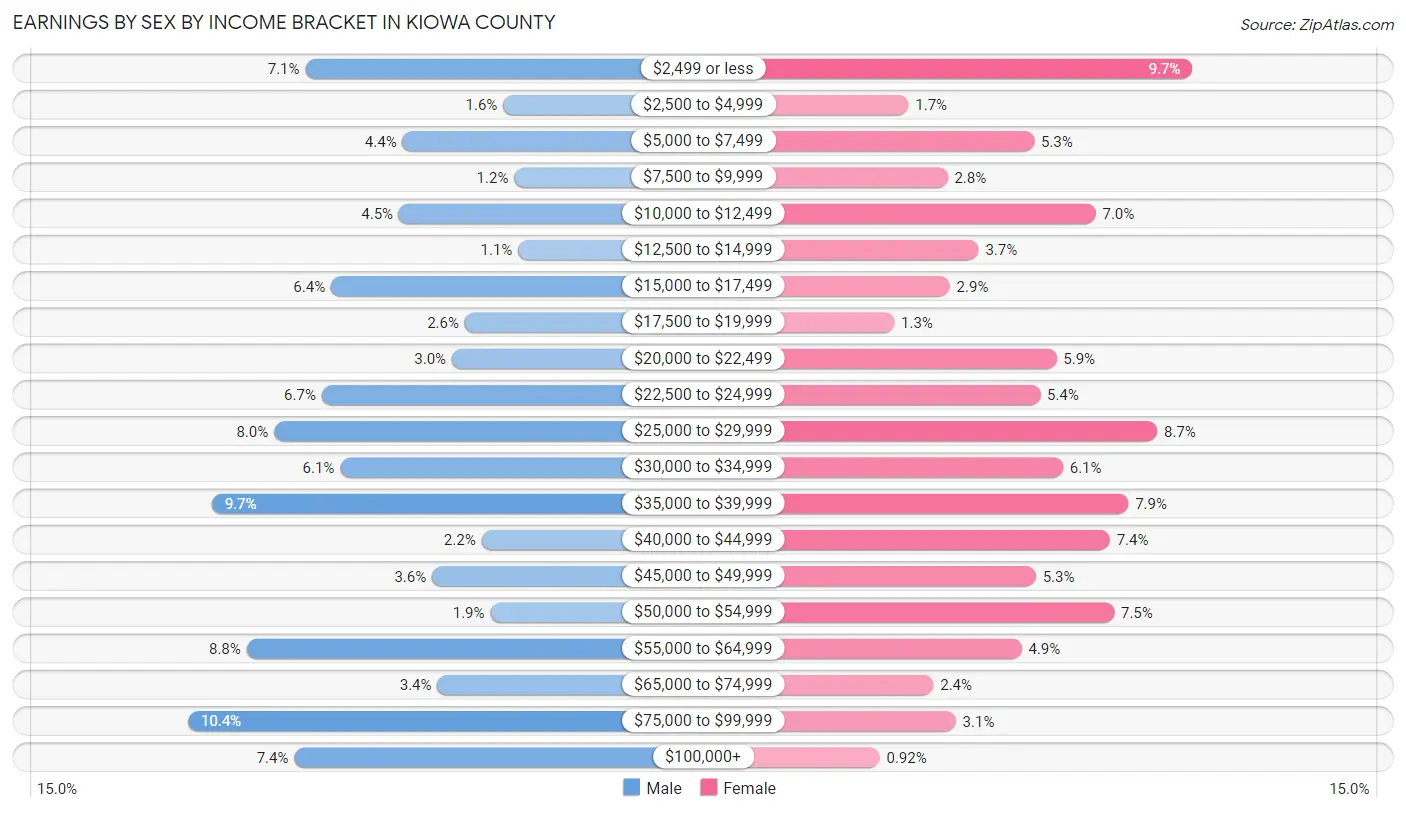
Earnings by Sex by Income Bracket in Kiowa County
The most common earnings brackets in Kiowa County are $75,000 to $99,999 for men (202 | 10.4%) and $2,499 or less for women (168 | 9.7%).
| Income | Male | Female |
| $2,499 or less | 138 (7.1%) | 168 (9.7%) |
| $2,500 to $4,999 | 30 (1.5%) | 30 (1.7%) |
| $5,000 to $7,499 | 85 (4.4%) | 91 (5.3%) |
| $7,500 to $9,999 | 24 (1.2%) | 49 (2.8%) |
| $10,000 to $12,499 | 87 (4.5%) | 121 (7.0%) |
| $12,500 to $14,999 | 22 (1.1%) | 64 (3.7%) |
| $15,000 to $17,499 | 124 (6.4%) | 50 (2.9%) |
| $17,500 to $19,999 | 51 (2.6%) | 23 (1.3%) |
| $20,000 to $22,499 | 58 (3.0%) | 102 (5.9%) |
| $22,500 to $24,999 | 129 (6.7%) | 94 (5.4%) |
| $25,000 to $29,999 | 155 (8.0%) | 151 (8.7%) |
| $30,000 to $34,999 | 119 (6.1%) | 105 (6.1%) |
| $35,000 to $39,999 | 189 (9.7%) | 137 (7.9%) |
| $40,000 to $44,999 | 42 (2.2%) | 128 (7.4%) |
| $45,000 to $49,999 | 69 (3.5%) | 92 (5.3%) |
| $50,000 to $54,999 | 37 (1.9%) | 130 (7.5%) |
| $55,000 to $64,999 | 170 (8.8%) | 85 (4.9%) |
| $65,000 to $74,999 | 66 (3.4%) | 42 (2.4%) |
| $75,000 to $99,999 | 202 (10.4%) | 53 (3.1%) |
| $100,000+ | 144 (7.4%) | 16 (0.9%) |
| Total | 1,941 (100.0%) | 1,731 (100.0%) |
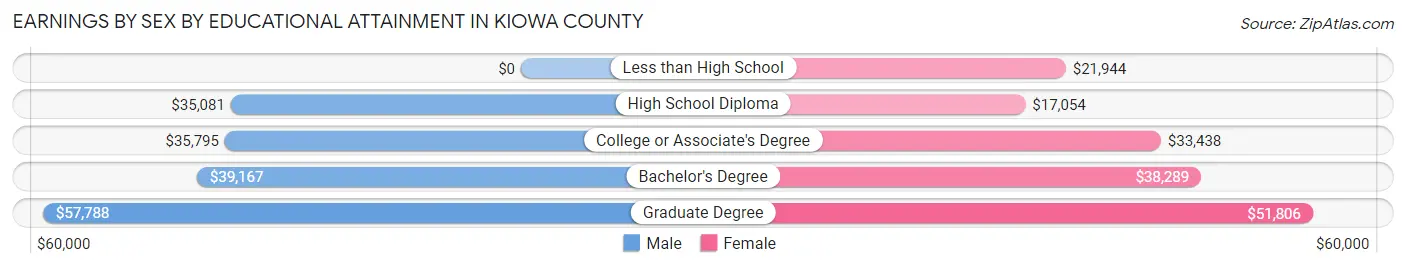
Earnings by Sex by Educational Attainment in Kiowa County
Average earnings in Kiowa County are $35,333 for men and $30,357 for women, a difference of 14.1%. Men with an educational attainment of graduate degree enjoy the highest average annual earnings of $57,788, while those with high school diploma education earn the least with $35,081. Women with an educational attainment of graduate degree earn the most with the average annual earnings of $51,806, while those with high school diploma education have the smallest earnings of $17,054.
| Educational Attainment | Male Income | Female Income |
| Less than High School | - | - |
| High School Diploma | $35,081 | $17,054 |
| College or Associate's Degree | $35,795 | $33,438 |
| Bachelor's Degree | $39,167 | $38,289 |
| Graduate Degree | $57,788 | $51,806 |
| Total | $35,333 | $30,357 |
Family Income in Kiowa County
Family Income Brackets in Kiowa County
According to the Kiowa County family income data, there are 441 families falling into the $75,000 to $99,999 income range, which is the most common income bracket and makes up 19.4% of all families. Conversely, the $200,000+ income bracket is the least frequent group with only 43 families (1.9%) belonging to this category.
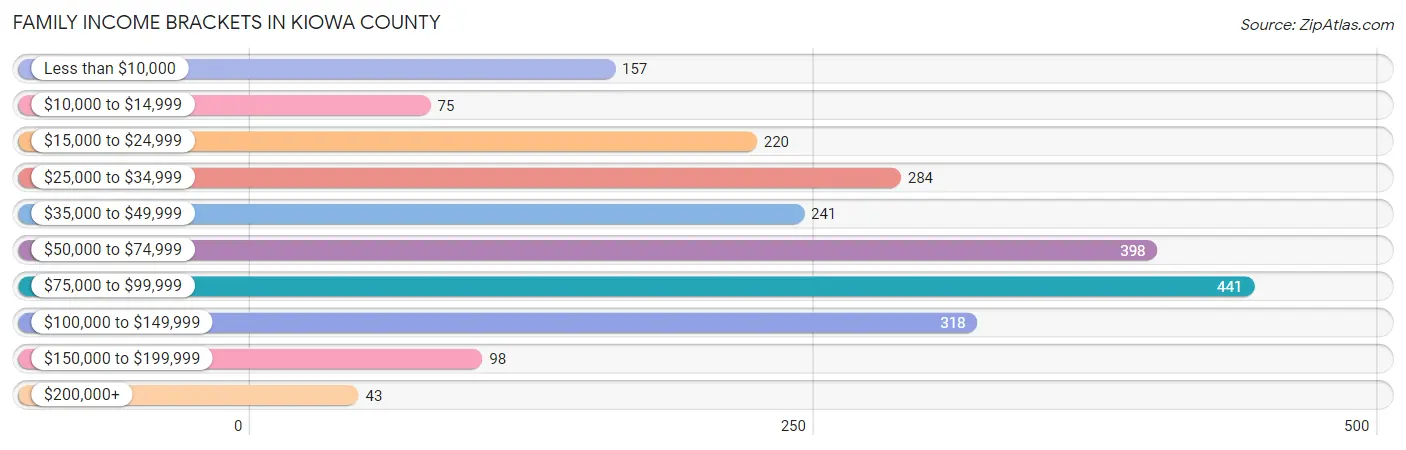
| Income Bracket | # Families | % Families |
| Less than $10,000 | 157 | 6.9% |
| $10,000 to $14,999 | 75 | 3.3% |
| $15,000 to $24,999 | 220 | 9.7% |
| $25,000 to $34,999 | 284 | 12.5% |
| $35,000 to $49,999 | 241 | 10.6% |
| $50,000 to $74,999 | 398 | 17.5% |
| $75,000 to $99,999 | 441 | 19.4% |
| $100,000 to $149,999 | 318 | 14.0% |
| $150,000 to $199,999 | 98 | 4.3% |
| $200,000+ | 43 | 1.9% |
Family Income by Famaliy Size in Kiowa County
5-person families (158 | 7.0%) account for the highest median family income in Kiowa County with $77,500 per family, while 2-person families (1,047 | 46.1%) have the highest median income of $26,466 per family member.
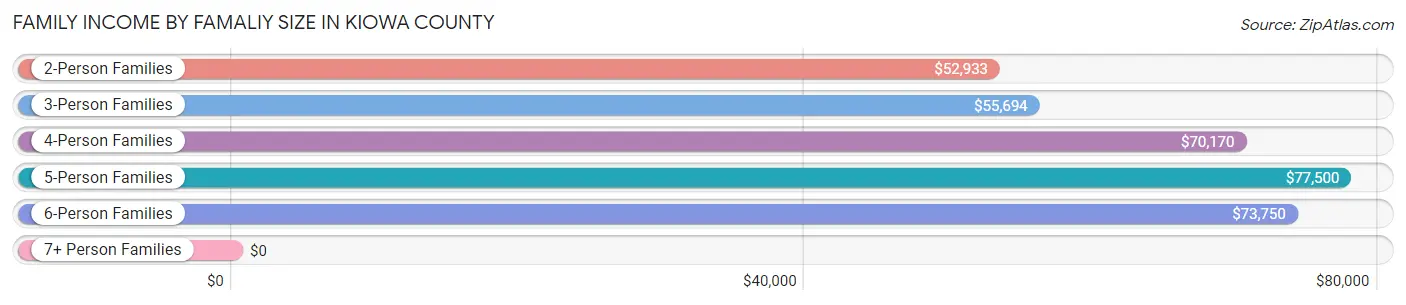
| Income Bracket | # Families | Median Income |
| 2-Person Families | 1,047 (46.1%) | $52,933 |
| 3-Person Families | 539 (23.7%) | $55,694 |
| 4-Person Families | 417 (18.3%) | $70,170 |
| 5-Person Families | 158 (7.0%) | $77,500 |
| 6-Person Families | 32 (1.4%) | $73,750 |
| 7+ Person Families | 79 (3.5%) | $0 |
| Total | 2,272 (100.0%) | $59,394 |
Family Income by Number of Earners in Kiowa County
The median family income in Kiowa County is $59,394, with families comprising 3+ earners (205) having the highest median family income of $97,417, while families with 1 earner (890) have the lowest median family income of $34,107, accounting for 9.0% and 39.2% of families, respectively.
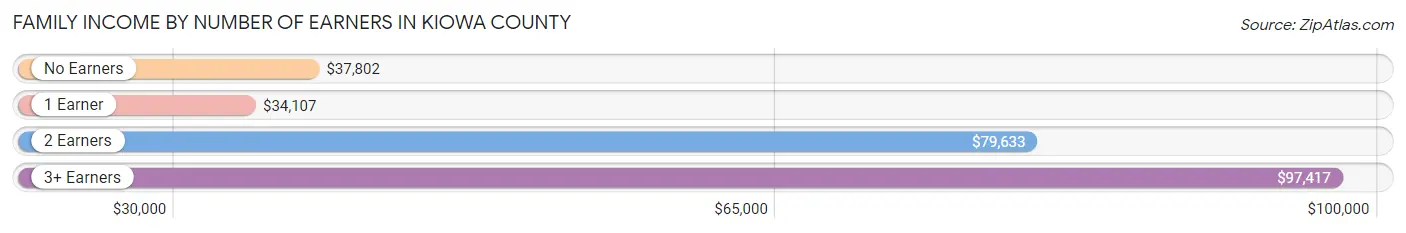
| Number of Earners | # Families | Median Income |
| No Earners | 448 (19.7%) | $37,802 |
| 1 Earner | 890 (39.2%) | $34,107 |
| 2 Earners | 729 (32.1%) | $79,633 |
| 3+ Earners | 205 (9.0%) | $97,417 |
| Total | 2,272 (100.0%) | $59,394 |
Household Income in Kiowa County
Household Income Brackets in Kiowa County
With 520 households falling in the category, the $50,000 to $74,999 income range is the most frequent in Kiowa County, accounting for 15.8% of all households. In contrast, only 43 households (1.3%) fall into the $200,000+ income bracket, making it the least populous group.
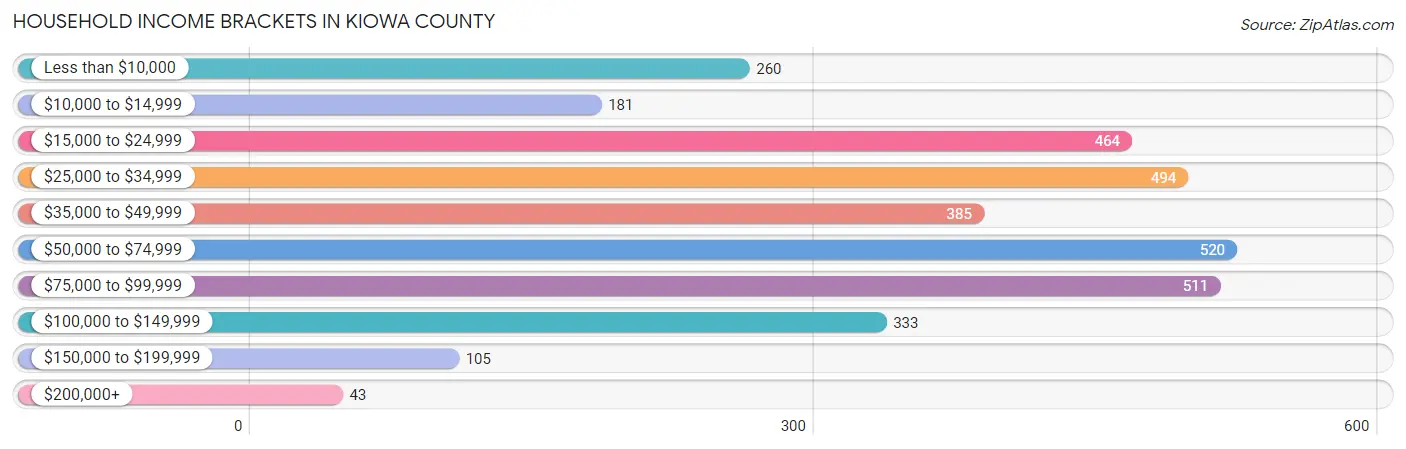
| Income Bracket | # Households | % Households |
| Less than $10,000 | 260 | 7.9% |
| $10,000 to $14,999 | 181 | 5.5% |
| $15,000 to $24,999 | 464 | 14.1% |
| $25,000 to $34,999 | 494 | 15.0% |
| $35,000 to $49,999 | 385 | 11.7% |
| $50,000 to $74,999 | 520 | 15.8% |
| $75,000 to $99,999 | 511 | 15.5% |
| $100,000 to $149,999 | 333 | 10.1% |
| $150,000 to $199,999 | 105 | 3.2% |
| $200,000+ | 43 | 1.3% |
Household Income by Householder Age in Kiowa County
The median household income in Kiowa County is $42,679, with the highest median household income of $55,048 found in the 45 to 64 years age bracket for the primary householder. A total of 1,181 households (35.8%) fall into this category. Meanwhile, the 15 to 24 years age bracket for the primary householder has the lowest median household income of $28,839, with 79 households (2.4%) in this group.
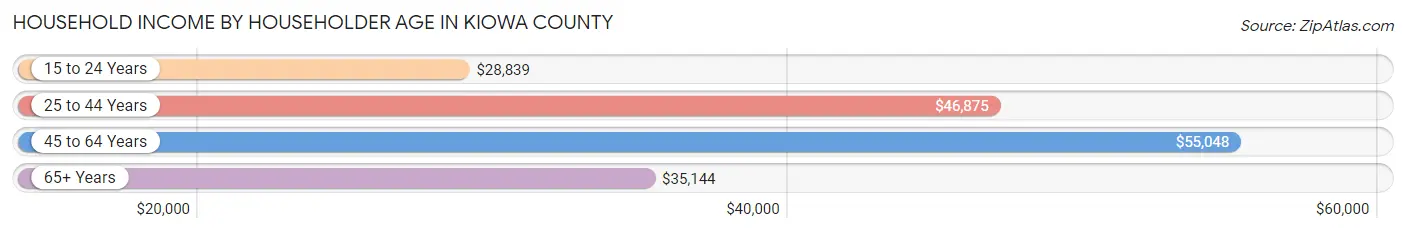
| Income Bracket | # Households | Median Income |
| 15 to 24 Years | 79 (2.4%) | $28,839 |
| 25 to 44 Years | 921 (28.0%) | $46,875 |
| 45 to 64 Years | 1,181 (35.8%) | $55,048 |
| 65+ Years | 1,113 (33.8%) | $35,144 |
| Total | 3,294 (100.0%) | $42,679 |
Poverty in Kiowa County
Income Below Poverty by Sex and Age in Kiowa County
With 21.1% poverty level for males and 25.0% for females among the residents of Kiowa County, under 5 year old males and 16 and 17 year old females are the most vulnerable to poverty, with 88 males (38.8%) and 62 females (71.3%) in their respective age groups living below the poverty level.
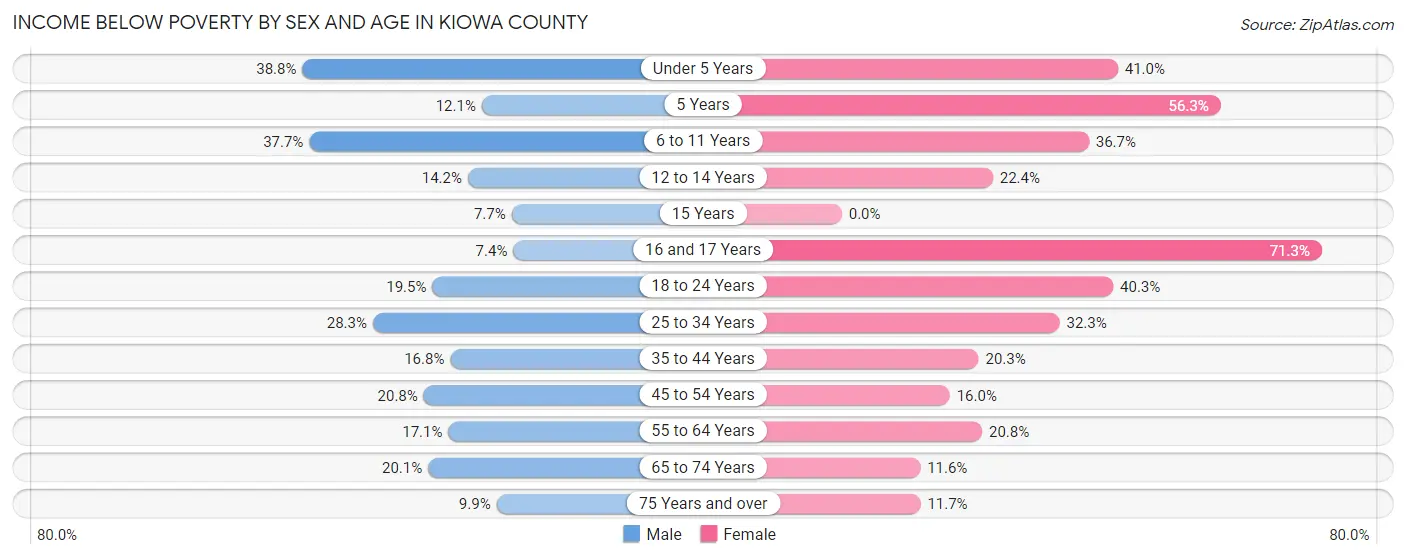
| Age Bracket | Male | Female |
| Under 5 Years | 88 (38.8%) | 134 (41.0%) |
| 5 Years | 4 (12.1%) | 36 (56.2%) |
| 6 to 11 Years | 117 (37.7%) | 117 (36.7%) |
| 12 to 14 Years | 22 (14.2%) | 63 (22.4%) |
| 15 Years | 4 (7.7%) | 0 (0.0%) |
| 16 and 17 Years | 9 (7.4%) | 62 (71.3%) |
| 18 to 24 Years | 50 (19.5%) | 137 (40.3%) |
| 25 to 34 Years | 135 (28.3%) | 129 (32.3%) |
| 35 to 44 Years | 84 (16.8%) | 92 (20.3%) |
| 45 to 54 Years | 88 (20.7%) | 75 (16.0%) |
| 55 to 64 Years | 103 (17.1%) | 141 (20.8%) |
| 65 to 74 Years | 94 (20.1%) | 59 (11.6%) |
| 75 Years and over | 29 (9.9%) | 43 (11.7%) |
| Total | 827 (21.1%) | 1,088 (25.0%) |
Income Above Poverty by Sex and Age in Kiowa County
According to the poverty statistics in Kiowa County, males aged 16 and 17 years and females aged 15 years are the age groups that are most secure financially, with 92.6% of males and 100.0% of females in these age groups living above the poverty line.
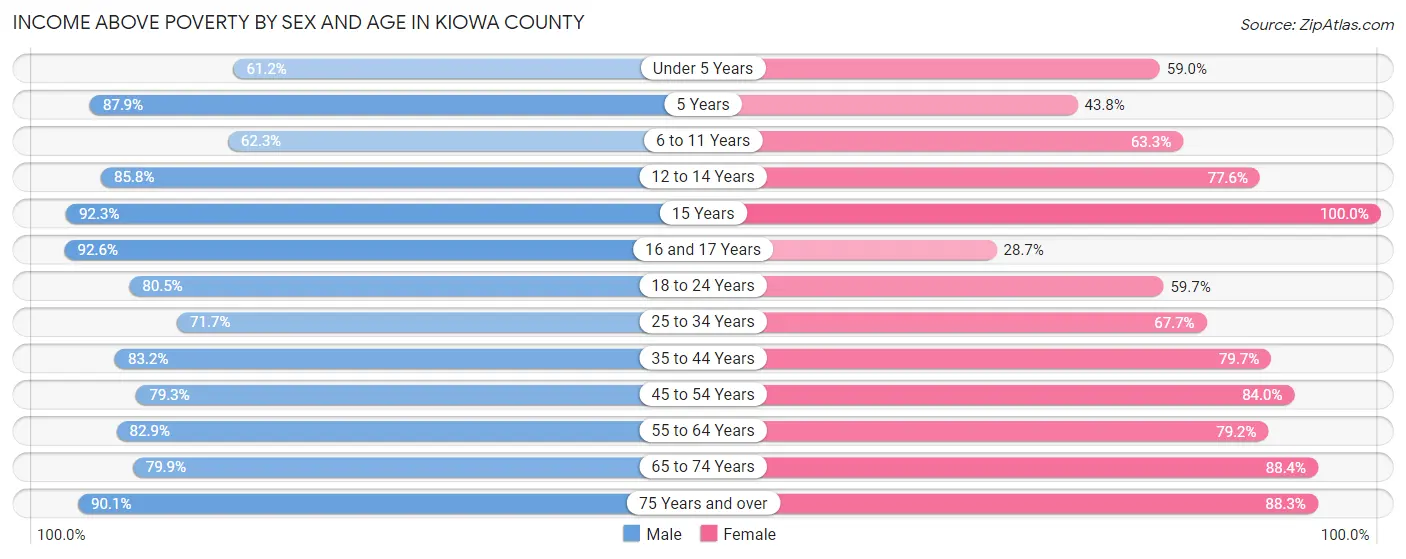
| Age Bracket | Male | Female |
| Under 5 Years | 139 (61.2%) | 193 (59.0%) |
| 5 Years | 29 (87.9%) | 28 (43.8%) |
| 6 to 11 Years | 193 (62.3%) | 202 (63.3%) |
| 12 to 14 Years | 133 (85.8%) | 218 (77.6%) |
| 15 Years | 48 (92.3%) | 58 (100.0%) |
| 16 and 17 Years | 112 (92.6%) | 25 (28.7%) |
| 18 to 24 Years | 207 (80.5%) | 203 (59.7%) |
| 25 to 34 Years | 342 (71.7%) | 270 (67.7%) |
| 35 to 44 Years | 416 (83.2%) | 361 (79.7%) |
| 45 to 54 Years | 336 (79.2%) | 393 (84.0%) |
| 55 to 64 Years | 500 (82.9%) | 536 (79.2%) |
| 65 to 74 Years | 374 (79.9%) | 448 (88.4%) |
| 75 Years and over | 263 (90.1%) | 325 (88.3%) |
| Total | 3,092 (78.9%) | 3,260 (75.0%) |
Income Below Poverty Among Married-Couple Families in Kiowa County
The poverty statistics for married-couple families in Kiowa County show that 9.0% or 143 of the total 1,585 families live below the poverty line. Families with 5 or more children have the highest poverty rate of 75.0%, comprising of 3 families. On the other hand, families with no children have the lowest poverty rate of 6.5%, which includes 62 families.
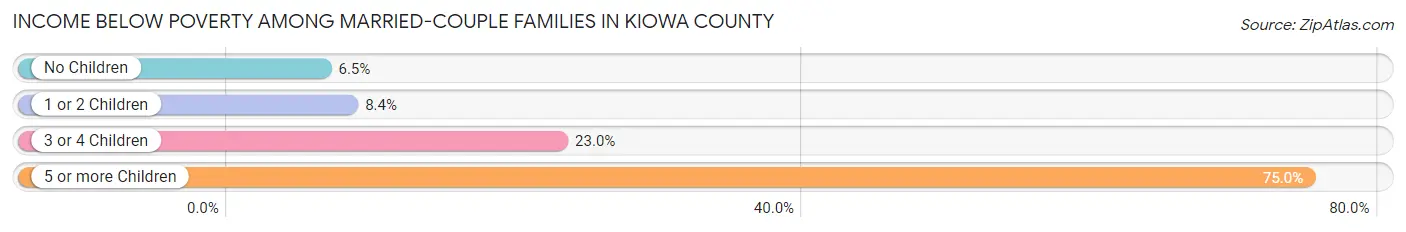
| Children | Above Poverty | Below Poverty |
| No Children | 891 (93.5%) | 62 (6.5%) |
| 1 or 2 Children | 416 (91.6%) | 38 (8.4%) |
| 3 or 4 Children | 134 (77.0%) | 40 (23.0%) |
| 5 or more Children | 1 (25.0%) | 3 (75.0%) |
| Total | 1,442 (91.0%) | 143 (9.0%) |
Income Below Poverty Among Single-Parent Households in Kiowa County
According to the poverty data in Kiowa County, 52.3% or 139 single-father households and 31.8% or 134 single-mother households are living below the poverty line. Among single-father households, those with 3 or 4 children have the highest poverty rate, with 59 households (90.8%) experiencing poverty. Likewise, among single-mother households, those with 3 or 4 children have the highest poverty rate, with 68 households (81.9%) falling below the poverty line.
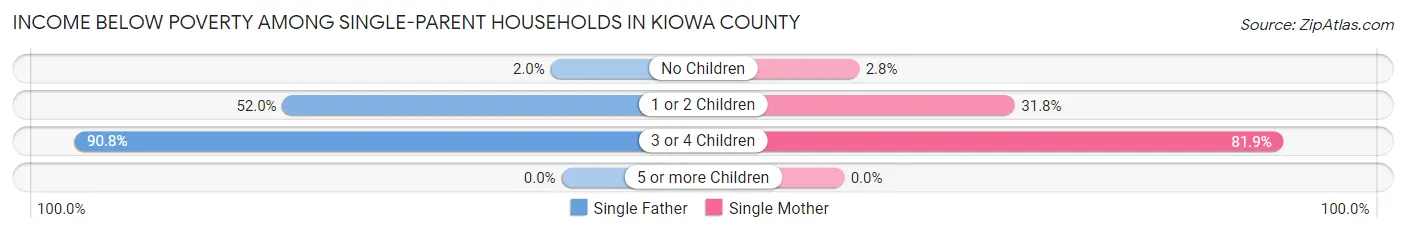
| Children | Single Father | Single Mother |
| No Children | 1 (2.0%) | 4 (2.8%) |
| 1 or 2 Children | 79 (52.0%) | 62 (31.8%) |
| 3 or 4 Children | 59 (90.8%) | 68 (81.9%) |
| 5 or more Children | 0 (0.0%) | 0 (0.0%) |
| Total | 139 (52.3%) | 134 (31.8%) |
Income Below Poverty Among Married-Couple vs Single-Parent Households in Kiowa County
The poverty data for Kiowa County shows that 143 of the married-couple family households (9.0%) and 273 of the single-parent households (39.7%) are living below the poverty level. Within the married-couple family households, those with 5 or more children have the highest poverty rate, with 3 households (75.0%) falling below the poverty line. Among the single-parent households, those with 3 or 4 children have the highest poverty rate, with 127 household (85.8%) living below poverty.
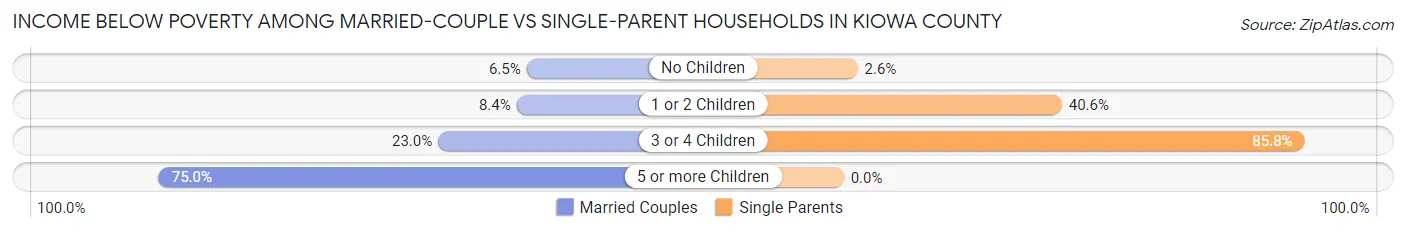
| Children | Married-Couple Families | Single-Parent Households |
| No Children | 62 (6.5%) | 5 (2.6%) |
| 1 or 2 Children | 38 (8.4%) | 141 (40.6%) |
| 3 or 4 Children | 40 (23.0%) | 127 (85.8%) |
| 5 or more Children | 3 (75.0%) | 0 (0.0%) |
| Total | 143 (9.0%) | 273 (39.7%) |
Race in Kiowa County
The most populous races in Kiowa County are White / Caucasian (6,789 | 80.4%), Hispanic or Latino (1,020 | 12.1%), and Two or more Races (785 | 9.3%).
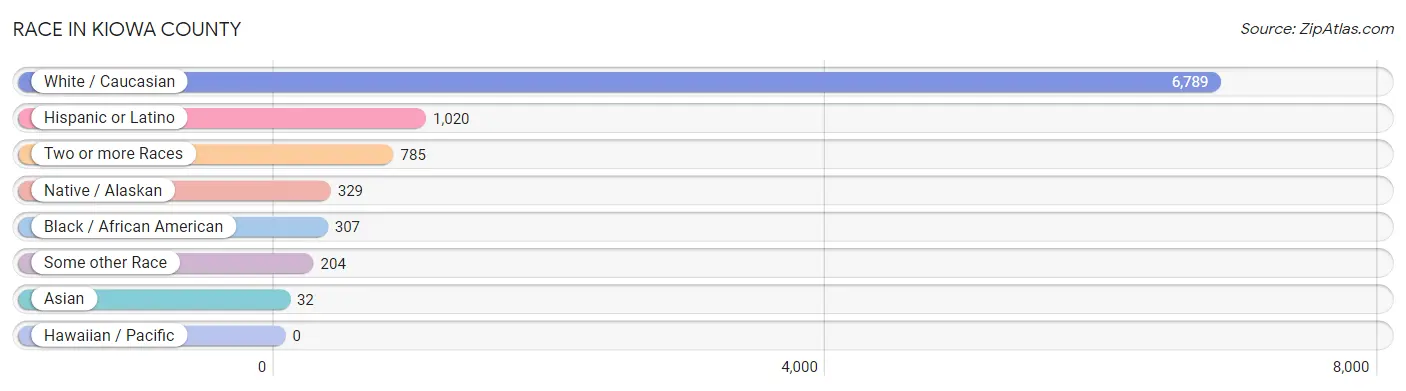
| Race | # Population | % Population |
| Asian | 32 | 0.4% |
| Black / African American | 307 | 3.6% |
| Hawaiian / Pacific | 0 | 0.0% |
| Hispanic or Latino | 1,020 | 12.1% |
| Native / Alaskan | 329 | 3.9% |
| White / Caucasian | 6,789 | 80.4% |
| Two or more Races | 785 | 9.3% |
| Some other Race | 204 | 2.4% |
| Total | 8,446 | 100.0% |
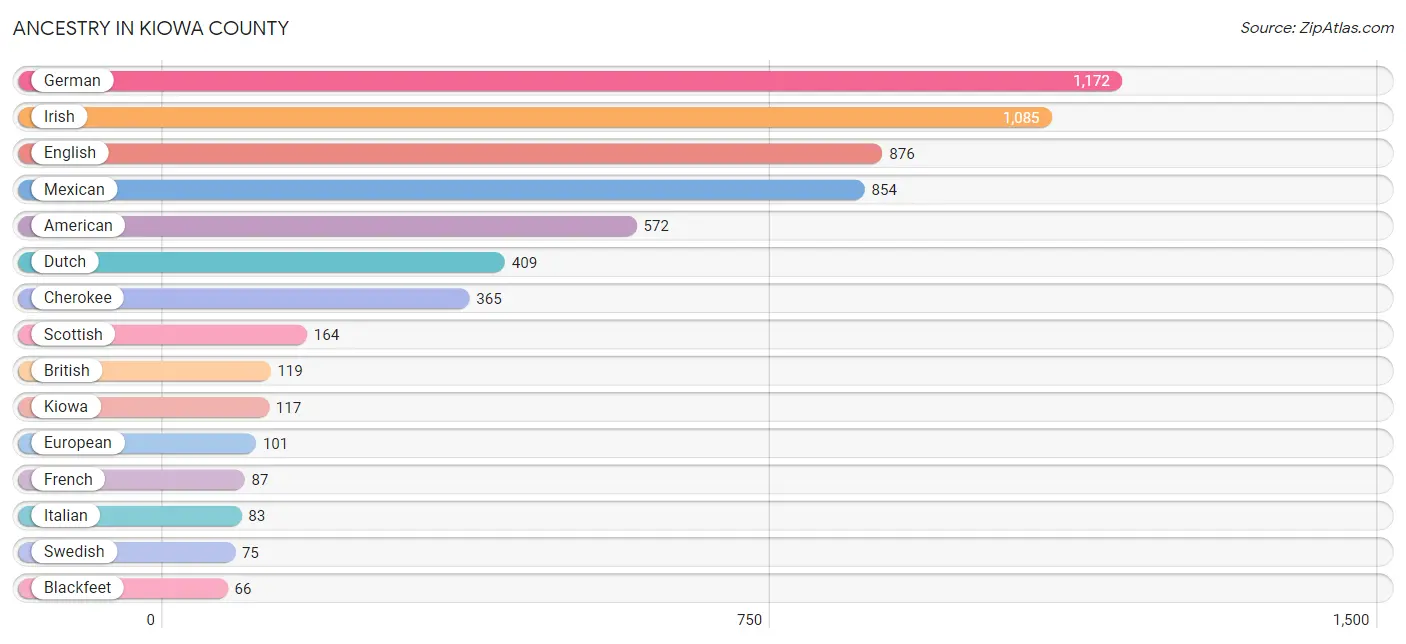
Ancestry in Kiowa County
The most populous ancestries reported in Kiowa County are German (1,172 | 13.9%), Irish (1,085 | 12.9%), English (876 | 10.4%), Mexican (854 | 10.1%), and American (572 | 6.8%), together accounting for 54.0% of all Kiowa County residents.
| Ancestry | # Population | % Population |
| American | 572 | 6.8% |
| Apache | 17 | 0.2% |
| Australian | 22 | 0.3% |
| Austrian | 3 | 0.0% |
| Blackfeet | 66 | 0.8% |
| British | 119 | 1.4% |
| Burmese | 26 | 0.3% |
| Central American | 5 | 0.1% |
| Central American Indian | 2 | 0.0% |
| Cherokee | 365 | 4.3% |
| Chippewa | 28 | 0.3% |
| Choctaw | 64 | 0.8% |
| Comanche | 39 | 0.5% |
| Creek | 5 | 0.1% |
| Czech | 9 | 0.1% |
| Danish | 8 | 0.1% |
| Delaware | 29 | 0.3% |
| Dutch | 409 | 4.8% |
| Dutch West Indian | 27 | 0.3% |
| Eastern European | 16 | 0.2% |
| English | 876 | 10.4% |
| European | 101 | 1.2% |
| French | 87 | 1.0% |
| French Canadian | 16 | 0.2% |
| German | 1,172 | 13.9% |
| Guamanian / Chamorro | 8 | 0.1% |
| Hungarian | 13 | 0.2% |
| Indian (Asian) | 9 | 0.1% |
| Irish | 1,085 | 12.9% |
| Iroquois | 28 | 0.3% |
| Italian | 83 | 1.0% |
| Kiowa | 117 | 1.4% |
| Korean | 16 | 0.2% |
| Mexican | 854 | 10.1% |
| Native Hawaiian | 9 | 0.1% |
| Norwegian | 29 | 0.3% |
| Pakistani | 20 | 0.2% |
| Polish | 22 | 0.3% |
| Portuguese | 3 | 0.0% |
| Potawatomi | 4 | 0.1% |
| Puerto Rican | 36 | 0.4% |
| Russian | 17 | 0.2% |
| Salvadoran | 5 | 0.1% |
| Samoan | 8 | 0.1% |
| Scandinavian | 5 | 0.1% |
| Scotch-Irish | 46 | 0.5% |
| Scottish | 164 | 1.9% |
| Seminole | 7 | 0.1% |
| Slovak | 1 | 0.0% |
| Spaniard | 17 | 0.2% |
| Spanish | 29 | 0.3% |
| Sri Lankan | 12 | 0.1% |
| Swedish | 75 | 0.9% |
| Swiss | 22 | 0.3% |
| Thai | 9 | 0.1% |
| Welsh | 35 | 0.4% |
| Yugoslavian | 1 | 0.0% | View All 57 Rows |
Immigrants in Kiowa County
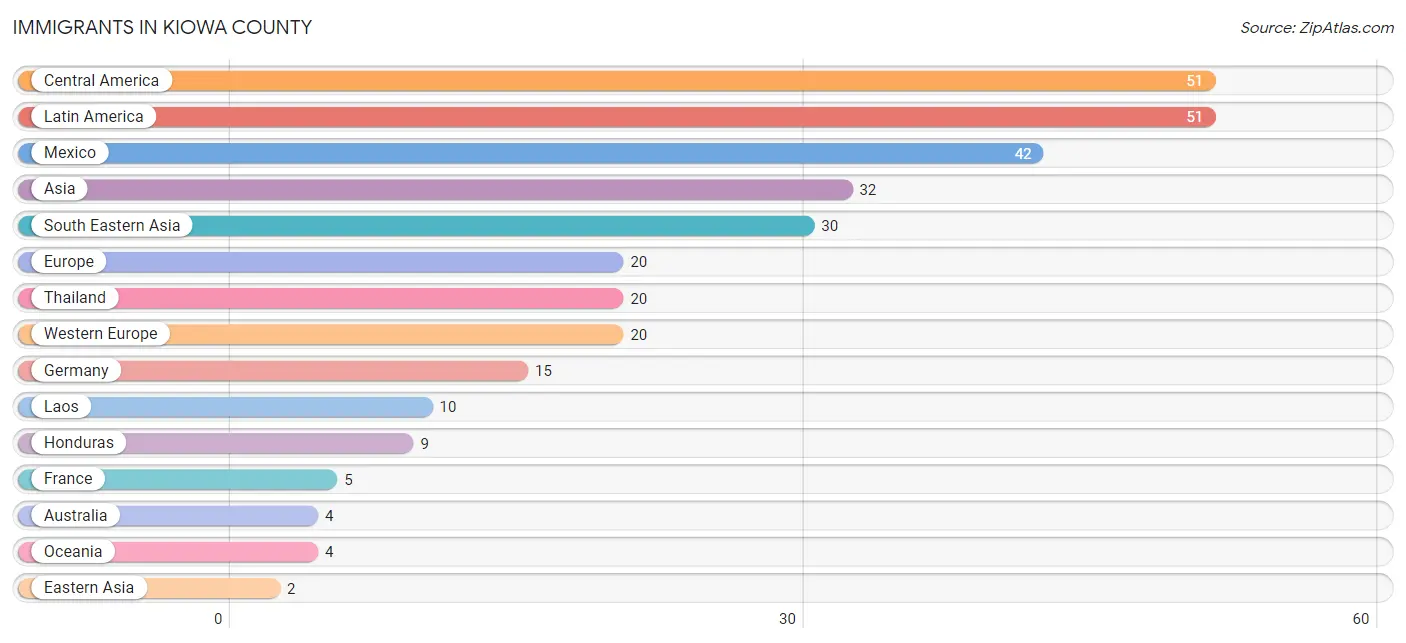
The most numerous immigrant groups reported in Kiowa County came from Central America (51 | 0.6%), Latin America (51 | 0.6%), Mexico (42 | 0.5%), Asia (32 | 0.4%), and South Eastern Asia (30 | 0.4%), together accounting for 2.4% of all Kiowa County residents.
| Immigration Origin | # Population | % Population |
| Asia | 32 | 0.4% |
| Australia | 4 | 0.1% |
| Central America | 51 | 0.6% |
| Eastern Asia | 2 | 0.0% |
| Europe | 20 | 0.2% |
| France | 5 | 0.1% |
| Germany | 15 | 0.2% |
| Honduras | 9 | 0.1% |
| Japan | 2 | 0.0% |
| Laos | 10 | 0.1% |
| Latin America | 51 | 0.6% |
| Mexico | 42 | 0.5% |
| Oceania | 4 | 0.1% |
| South Eastern Asia | 30 | 0.4% |
| Thailand | 20 | 0.2% |
| Western Europe | 20 | 0.2% | View All 16 Rows |
Sex and Age in Kiowa County
Sex and Age in Kiowa County
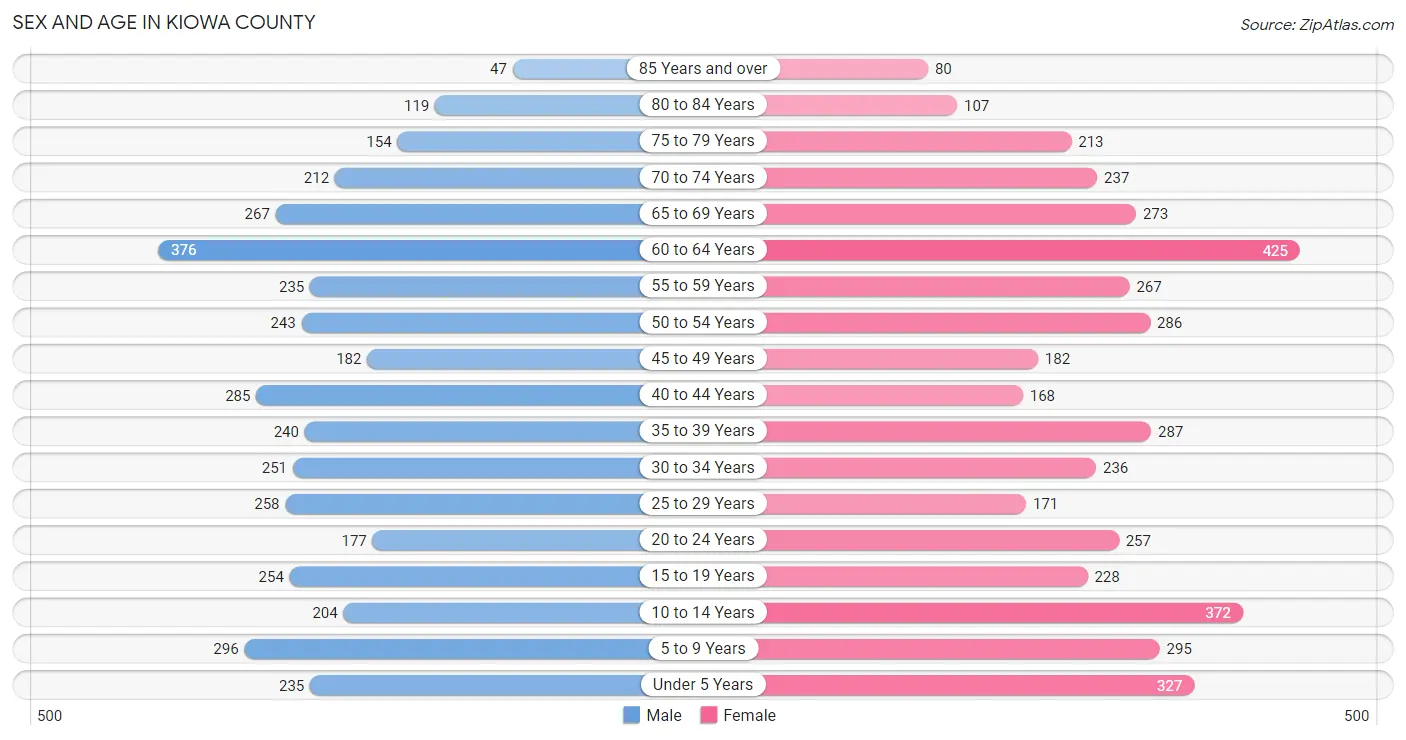
The most populous age groups in Kiowa County are 60 to 64 Years (376 | 9.3%) for men and 60 to 64 Years (425 | 9.6%) for women.
| Age Bracket | Male | Female |
| Under 5 Years | 235 (5.8%) | 327 (7.4%) |
| 5 to 9 Years | 296 (7.3%) | 295 (6.7%) |
| 10 to 14 Years | 204 (5.1%) | 372 (8.4%) |
| 15 to 19 Years | 254 (6.3%) | 228 (5.2%) |
| 20 to 24 Years | 177 (4.4%) | 257 (5.8%) |
| 25 to 29 Years | 258 (6.4%) | 171 (3.9%) |
| 30 to 34 Years | 251 (6.2%) | 236 (5.3%) |
| 35 to 39 Years | 240 (5.9%) | 287 (6.5%) |
| 40 to 44 Years | 285 (7.1%) | 168 (3.8%) |
| 45 to 49 Years | 182 (4.5%) | 182 (4.1%) |
| 50 to 54 Years | 243 (6.0%) | 286 (6.5%) |
| 55 to 59 Years | 235 (5.8%) | 267 (6.0%) |
| 60 to 64 Years | 376 (9.3%) | 425 (9.6%) |
| 65 to 69 Years | 267 (6.6%) | 273 (6.2%) |
| 70 to 74 Years | 212 (5.2%) | 237 (5.4%) |
| 75 to 79 Years | 154 (3.8%) | 213 (4.8%) |
| 80 to 84 Years | 119 (2.9%) | 107 (2.4%) |
| 85 Years and over | 47 (1.2%) | 80 (1.8%) |
| Total | 4,035 (100.0%) | 4,411 (100.0%) |
Families and Households in Kiowa County
Median Family Size in Kiowa County
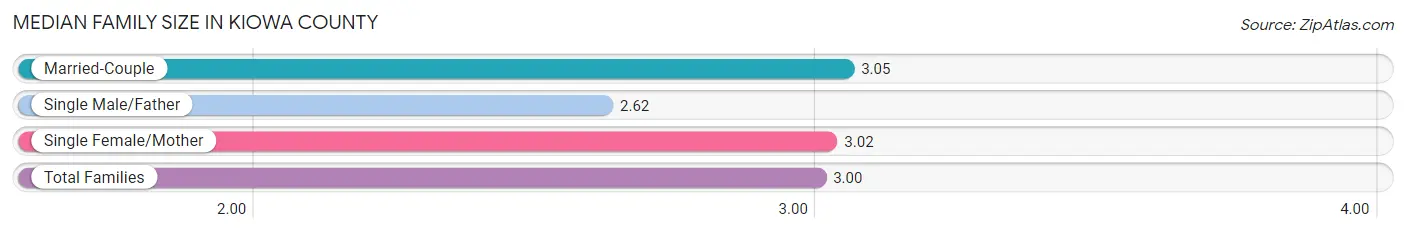
The median family size in Kiowa County is 3.00 persons per family, with married-couple families (1,585 | 69.8%) accounting for the largest median family size of 3.05 persons per family. On the other hand, single male/father families (266 | 11.7%) represent the smallest median family size with 2.62 persons per family.
| Family Type | # Families | Family Size |
| Married-Couple | 1,585 (69.8%) | 3.05 |
| Single Male/Father | 266 (11.7%) | 2.62 |
| Single Female/Mother | 421 (18.5%) | 3.02 |
| Total Families | 2,272 (100.0%) | 3.00 |
Median Household Size in Kiowa County
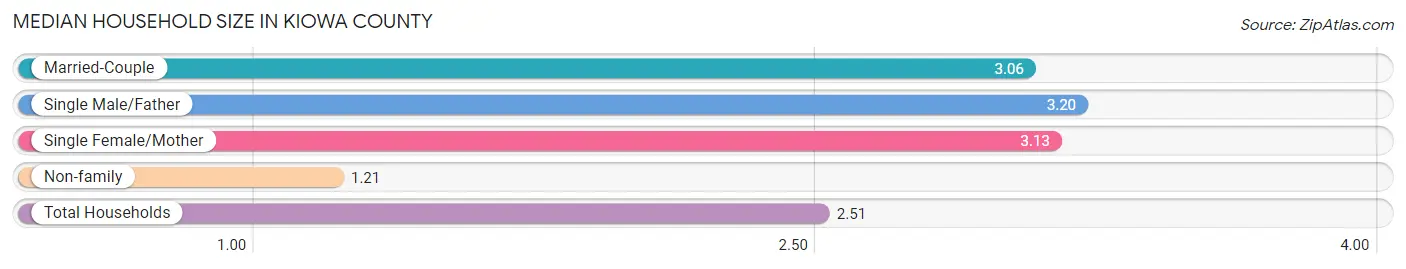
The median household size in Kiowa County is 2.51 persons per household, with single male/father households (266 | 8.1%) accounting for the largest median household size of 3.2 persons per household. non-family households (1,022 | 31.0%) represent the smallest median household size with 1.21 persons per household.
| Household Type | # Households | Household Size |
| Married-Couple | 1,585 (48.1%) | 3.06 |
| Single Male/Father | 266 (8.1%) | 3.20 |
| Single Female/Mother | 421 (12.8%) | 3.13 |
| Non-family | 1,022 (31.0%) | 1.21 |
| Total Households | 3,294 (100.0%) | 2.51 |
Household Size by Marriage Status in Kiowa County
Out of a total of 3,294 households in Kiowa County, 2,272 (69.0%) are family households, while 1,022 (31.0%) are nonfamily households. The most numerous type of family households are 2-person households, comprising 1,028, and the most common type of nonfamily households are 1-person households, comprising 877.
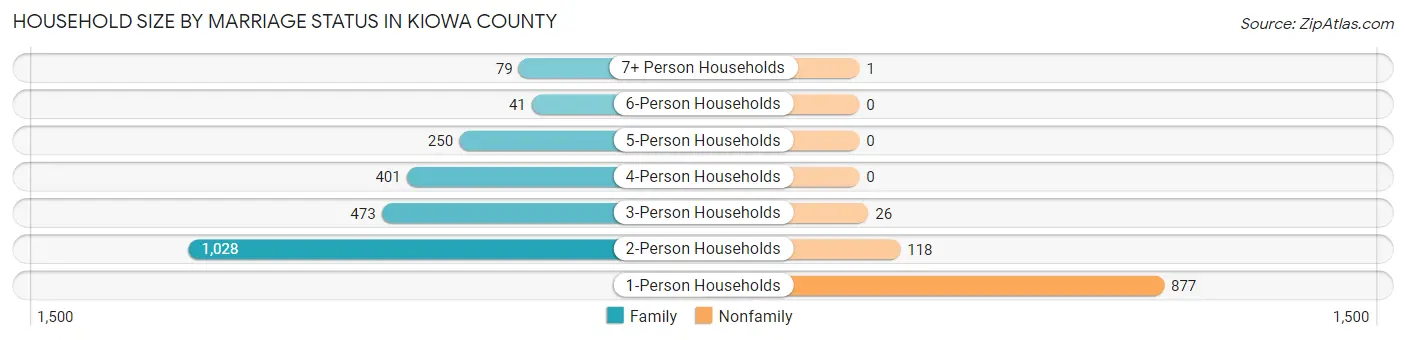
| Household Size | Family Households | Nonfamily Households |
| 1-Person Households | - | 877 (26.6%) |
| 2-Person Households | 1,028 (31.2%) | 118 (3.6%) |
| 3-Person Households | 473 (14.4%) | 26 (0.8%) |
| 4-Person Households | 401 (12.2%) | 0 (0.0%) |
| 5-Person Households | 250 (7.6%) | 0 (0.0%) |
| 6-Person Households | 41 (1.2%) | 0 (0.0%) |
| 7+ Person Households | 79 (2.4%) | 1 (0.0%) |
| Total | 2,272 (69.0%) | 1,022 (31.0%) |
Female Fertility in Kiowa County
Fertility by Age in Kiowa County
Average fertility rate in Kiowa County is 88.0 births per 1,000 women. Women in the age bracket of 20 to 34 years have the highest fertility rate with 123.0 births per 1,000 women. Women in the age bracket of 20 to 34 years acount for 59.9% of all women with births.
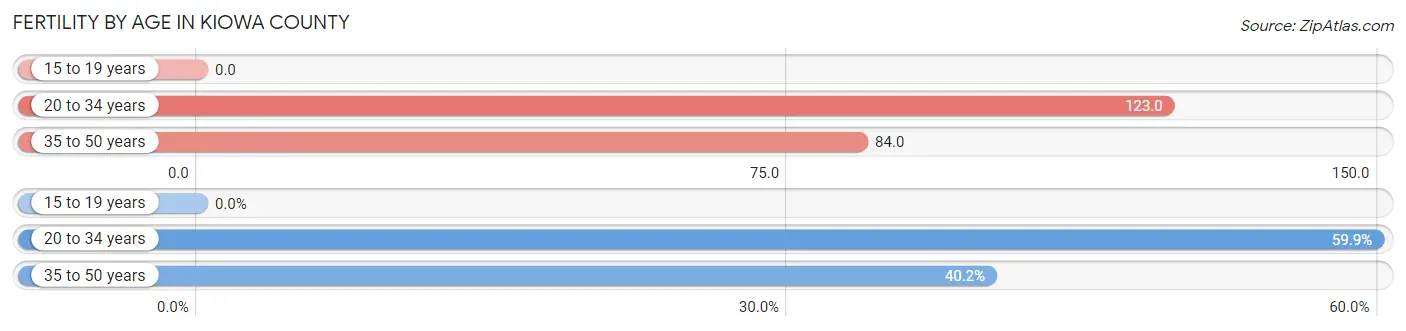
| Age Bracket | Women with Births | Births / 1,000 Women |
| 15 to 19 years | 0 (0.0%) | 0.0 |
| 20 to 34 years | 82 (59.9%) | 123.0 |
| 35 to 50 years | 55 (40.2%) | 84.0 |
| Total | 137 (100.0%) | 88.0 |
Fertility by Age by Marriage Status in Kiowa County
97.1% of women with births (137) in Kiowa County are married. The highest percentage of unmarried women with births falls into 20 to 34 years age bracket with 4.9% of them unmarried at the time of birth, while the lowest percentage of unmarried women with births belong to 35 to 50 years age bracket with 0.0% of them unmarried.
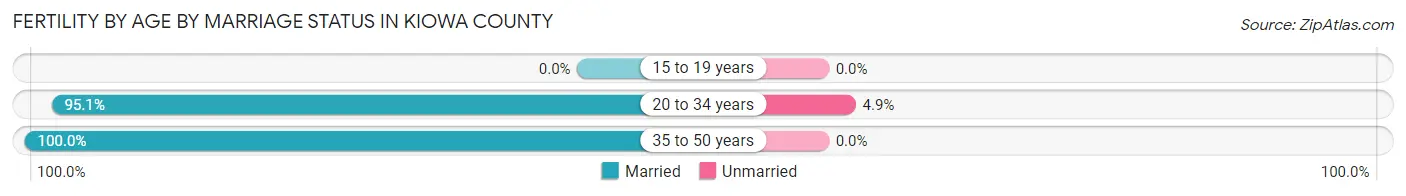
| Age Bracket | Married | Unmarried |
| 15 to 19 years | 0 (0.0%) | 0 (0.0%) |
| 20 to 34 years | 78 (95.1%) | 4 (4.9%) |
| 35 to 50 years | 55 (100.0%) | 0 (0.0%) |
| Total | 133 (97.1%) | 4 (2.9%) |
Fertility by Education in Kiowa County
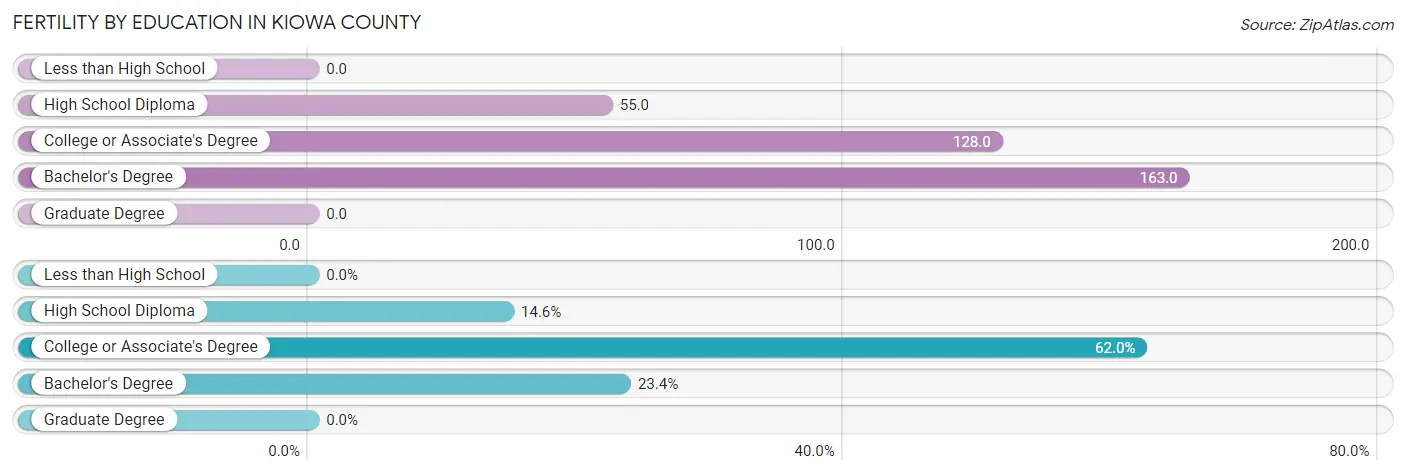
| Educational Attainment | Women with Births | Births / 1,000 Women |
| Less than High School | 0 (0.0%) | 0.0 |
| High School Diploma | 20 (14.6%) | 55.0 |
| College or Associate's Degree | 85 (62.0%) | 128.0 |
| Bachelor's Degree | 32 (23.4%) | 163.0 |
| Graduate Degree | 0 (0.0%) | 0.0 |
| Total | 137 (100.0%) | 88.0 |
Fertility by Education by Marriage Status in Kiowa County
2.9% of women with births in Kiowa County are unmarried. Women with the educational attainment of college or associate's degree are most likely to be married with 100.0% of them married at childbirth, while women with the educational attainment of high school diploma are least likely to be married with 20.0% of them unmarried at childbirth.
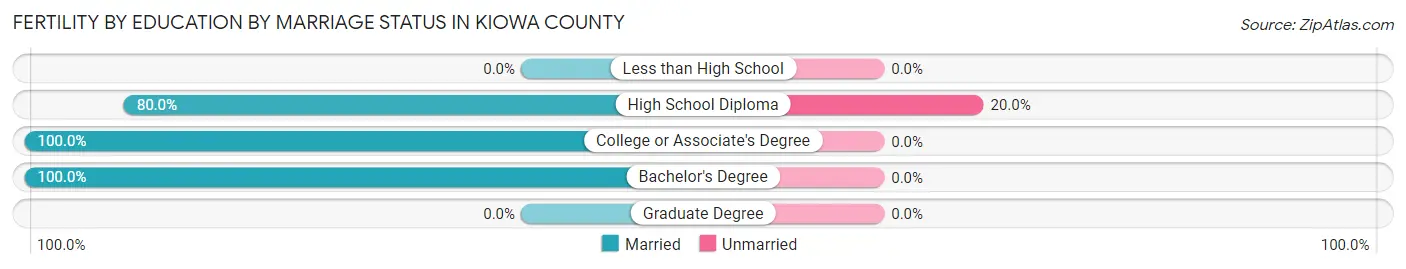
| Educational Attainment | Married | Unmarried |
| Less than High School | 0 (0.0%) | 0 (0.0%) |
| High School Diploma | 16 (80.0%) | 4 (20.0%) |
| College or Associate's Degree | 85 (100.0%) | 0 (0.0%) |
| Bachelor's Degree | 32 (100.0%) | 0 (0.0%) |
| Graduate Degree | 0 (0.0%) | 0 (0.0%) |
| Total | 133 (97.1%) | 4 (2.9%) |
Employment Characteristics in Kiowa County
Employment by Class of Employer in Kiowa County
Among the 3,253 employed individuals in Kiowa County, private company employees (1,834 | 56.4%), self-employed (not incorporated) (348 | 10.7%), and local government employees (287 | 8.8%) make up the most common classes of employment.
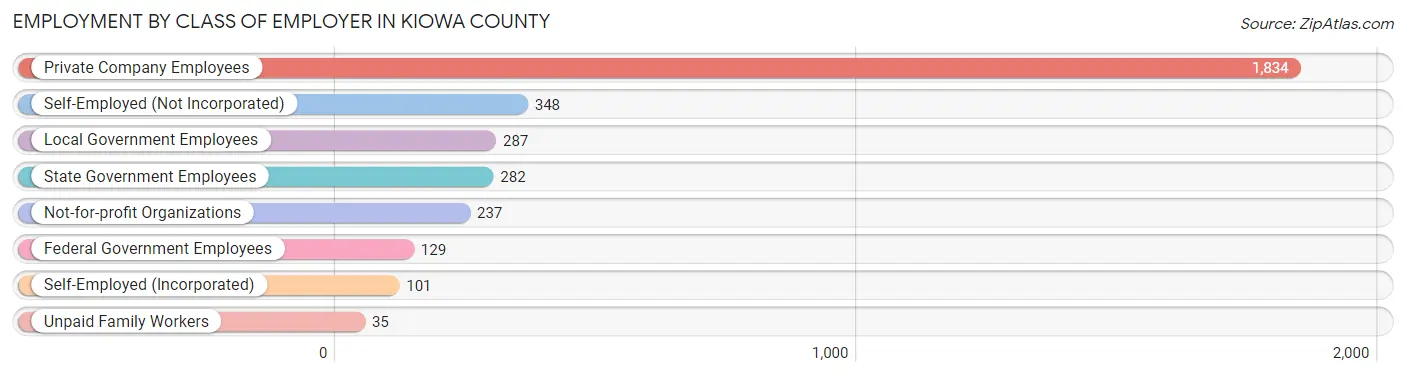
| Employer Class | # Employees | % Employees |
| Private Company Employees | 1,834 | 56.4% |
| Self-Employed (Incorporated) | 101 | 3.1% |
| Self-Employed (Not Incorporated) | 348 | 10.7% |
| Not-for-profit Organizations | 237 | 7.3% |
| Local Government Employees | 287 | 8.8% |
| State Government Employees | 282 | 8.7% |
| Federal Government Employees | 129 | 4.0% |
| Unpaid Family Workers | 35 | 1.1% |
| Total | 3,253 | 100.0% |
Employment Status by Age in Kiowa County
According to the labor force statistics for Kiowa County, out of the total population over 16 years of age (6,607), 53.5% or 3,535 individuals are in the labor force, with 4.4% or 156 of them unemployed. The age group with the highest labor force participation rate is 25 to 29 years, with 79.7% or 342 individuals in the labor force. Within the labor force, the 20 to 24 years age range has the highest percentage of unemployed individuals, with 23.3% or 48 of them being unemployed.
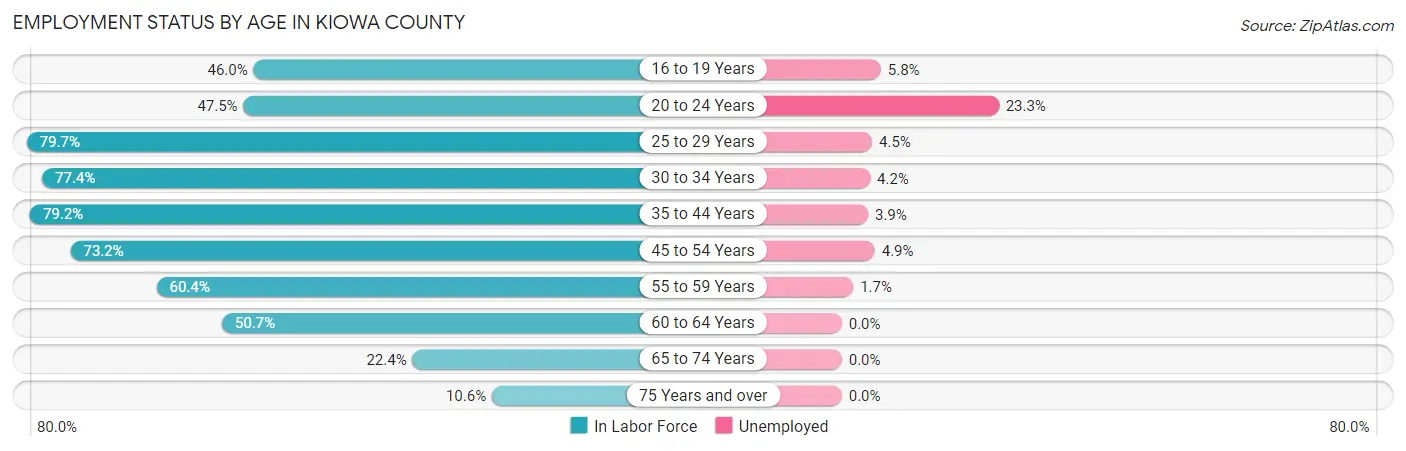
| Age Bracket | In Labor Force | Unemployed |
| 16 to 19 Years | 171 (46.0%) | 10 (5.8%) |
| 20 to 24 Years | 206 (47.5%) | 48 (23.3%) |
| 25 to 29 Years | 342 (79.7%) | 15 (4.5%) |
| 30 to 34 Years | 377 (77.4%) | 16 (4.2%) |
| 35 to 44 Years | 776 (79.2%) | 30 (3.9%) |
| 45 to 54 Years | 654 (73.2%) | 32 (4.9%) |
| 55 to 59 Years | 303 (60.4%) | 5 (1.7%) |
| 60 to 64 Years | 406 (50.7%) | 0 (0.0%) |
| 65 to 74 Years | 222 (22.4%) | 0 (0.0%) |
| 75 Years and over | 76 (10.6%) | 0 (0.0%) |
| Total | 3,535 (53.5%) | 156 (4.4%) |
Employment Status by Educational Attainment in Kiowa County
According to labor force statistics for Kiowa County, 69.8% of individuals (2,856) out of the total population between 25 and 64 years of age (4,092) are in the labor force, with 3.4% or 97 of them being unemployed. The group with the highest labor force participation rate are those with the educational attainment of bachelor's degree or higher, with 88.2% or 652 individuals in the labor force. Within the labor force, individuals with less than high school education have the highest percentage of unemployment, with 5.6% or 8 of them being unemployed.
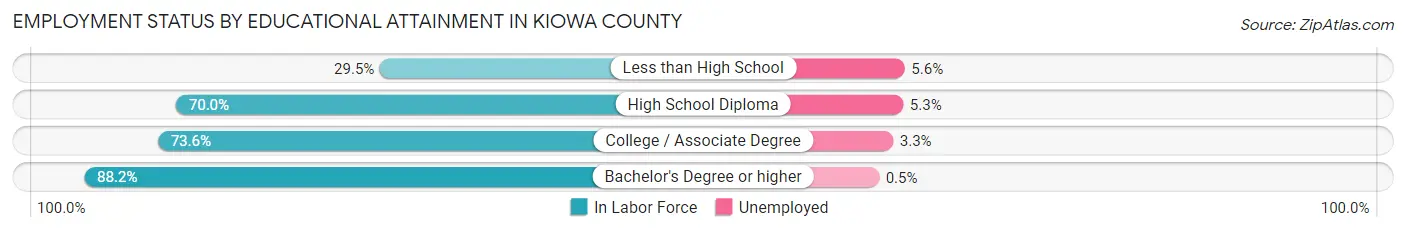
| Educational Attainment | In Labor Force | Unemployed |
| Less than High School | 142 (29.5%) | 27 (5.6%) |
| High School Diploma | 951 (70.0%) | 72 (5.3%) |
| College / Associate Degree | 1,113 (73.6%) | 50 (3.3%) |
| Bachelor's Degree or higher | 652 (88.2%) | 4 (0.5%) |
| Total | 2,856 (69.8%) | 139 (3.4%) |
Employment Occupations by Sex in Kiowa County
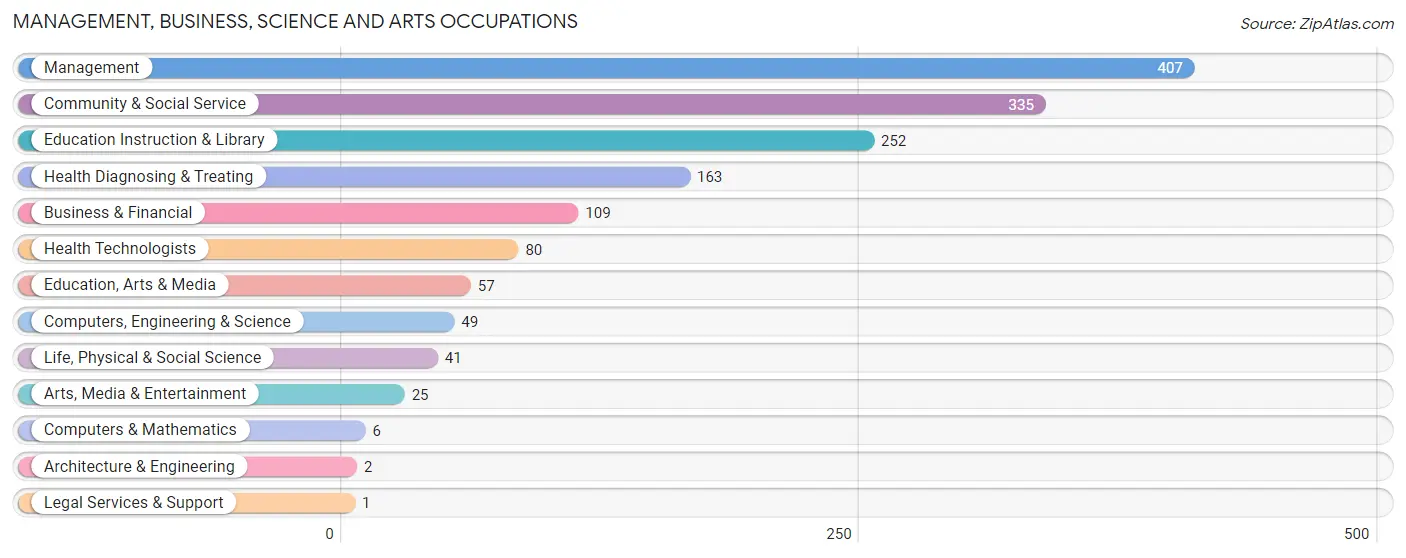
Management, Business, Science and Arts Occupations
The most common Management, Business, Science and Arts occupations in Kiowa County are Management (407 | 12.1%), Community & Social Service (335 | 9.9%), Education Instruction & Library (252 | 7.5%), Health Diagnosing & Treating (163 | 4.8%), and Business & Financial (109 | 3.2%).
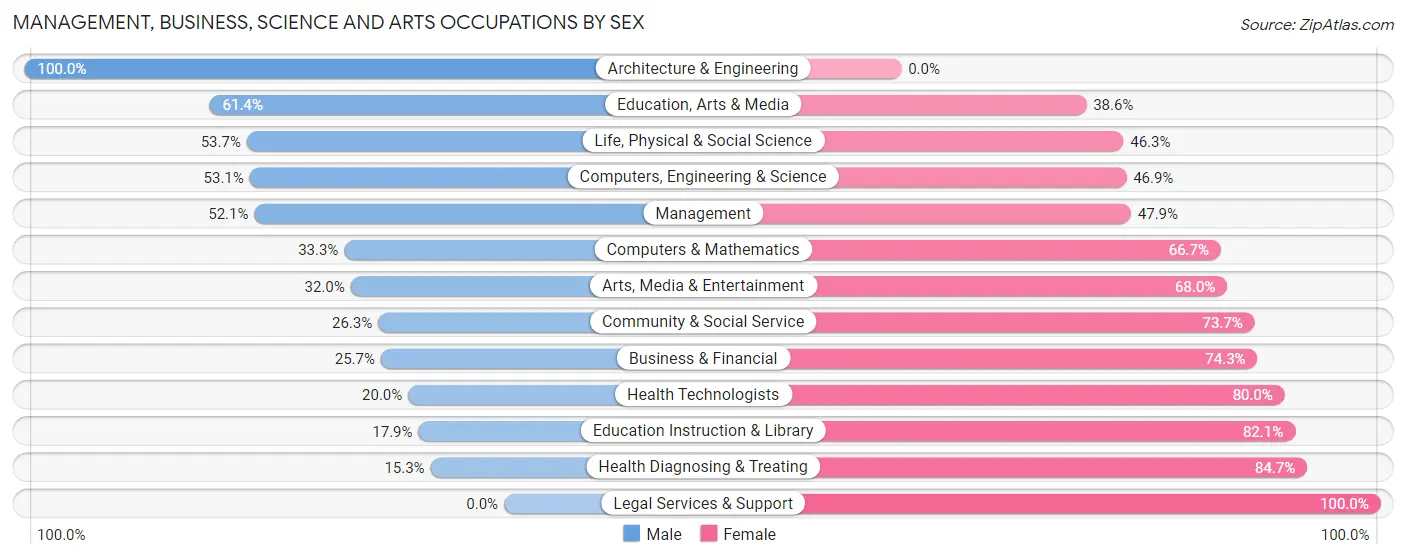
Management, Business, Science and Arts Occupations by Sex
Within the Management, Business, Science and Arts occupations in Kiowa County, the most male-oriented occupations are Architecture & Engineering (100.0%), Education, Arts & Media (61.4%), and Life, Physical & Social Science (53.7%), while the most female-oriented occupations are Legal Services & Support (100.0%), Health Diagnosing & Treating (84.7%), and Education Instruction & Library (82.1%).
| Occupation | Male | Female |
| Management | 212 (52.1%) | 195 (47.9%) |
| Business & Financial | 28 (25.7%) | 81 (74.3%) |
| Computers, Engineering & Science | 26 (53.1%) | 23 (46.9%) |
| Computers & Mathematics | 2 (33.3%) | 4 (66.7%) |
| Architecture & Engineering | 2 (100.0%) | 0 (0.0%) |
| Life, Physical & Social Science | 22 (53.7%) | 19 (46.3%) |
| Community & Social Service | 88 (26.3%) | 247 (73.7%) |
| Education, Arts & Media | 35 (61.4%) | 22 (38.6%) |
| Legal Services & Support | 0 (0.0%) | 1 (100.0%) |
| Education Instruction & Library | 45 (17.9%) | 207 (82.1%) |
| Arts, Media & Entertainment | 8 (32.0%) | 17 (68.0%) |
| Health Diagnosing & Treating | 25 (15.3%) | 138 (84.7%) |
| Health Technologists | 16 (20.0%) | 64 (80.0%) |
| Total (Category) | 379 (35.6%) | 684 (64.3%) |
| Total (Overall) | 1,804 (53.5%) | 1,567 (46.5%) |
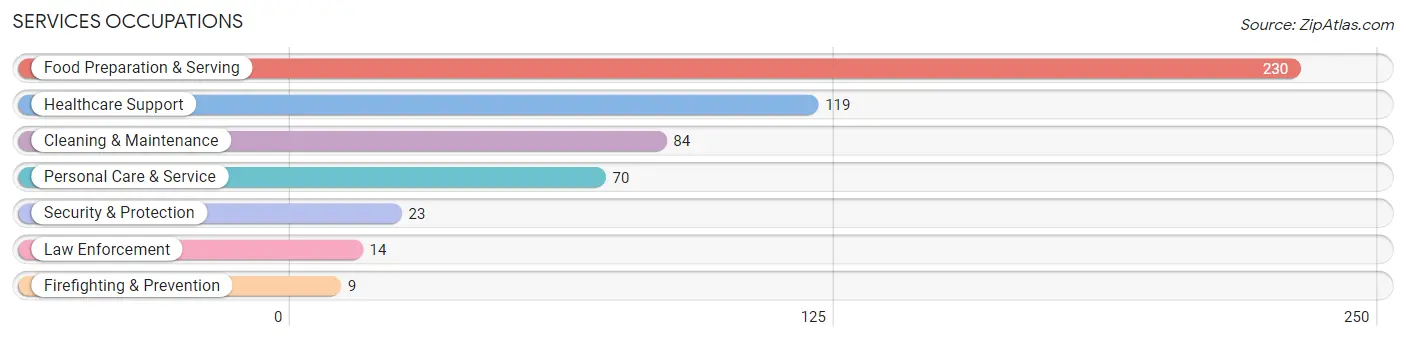
Services Occupations
The most common Services occupations in Kiowa County are Food Preparation & Serving (230 | 6.8%), Healthcare Support (119 | 3.5%), Cleaning & Maintenance (84 | 2.5%), Personal Care & Service (70 | 2.1%), and Security & Protection (23 | 0.7%).
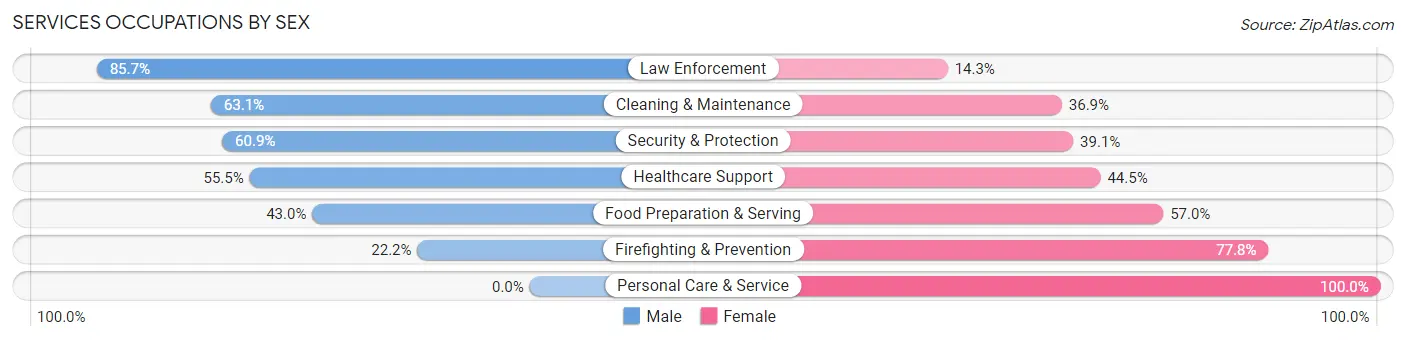
Services Occupations by Sex
Within the Services occupations in Kiowa County, the most male-oriented occupations are Law Enforcement (85.7%), Cleaning & Maintenance (63.1%), and Security & Protection (60.9%), while the most female-oriented occupations are Personal Care & Service (100.0%), Firefighting & Prevention (77.8%), and Food Preparation & Serving (57.0%).
| Occupation | Male | Female |
| Healthcare Support | 66 (55.5%) | 53 (44.5%) |
| Security & Protection | 14 (60.9%) | 9 (39.1%) |
| Firefighting & Prevention | 2 (22.2%) | 7 (77.8%) |
| Law Enforcement | 12 (85.7%) | 2 (14.3%) |
| Food Preparation & Serving | 99 (43.0%) | 131 (57.0%) |
| Cleaning & Maintenance | 53 (63.1%) | 31 (36.9%) |
| Personal Care & Service | 0 (0.0%) | 70 (100.0%) |
| Total (Category) | 232 (44.1%) | 294 (55.9%) |
| Total (Overall) | 1,804 (53.5%) | 1,567 (46.5%) |
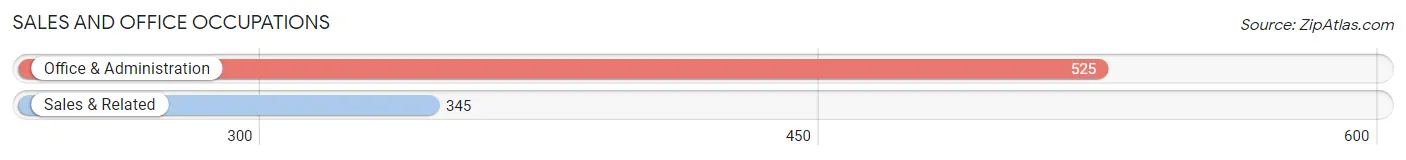
Sales and Office Occupations
The most common Sales and Office occupations in Kiowa County are Office & Administration (525 | 15.6%), and Sales & Related (345 | 10.2%).
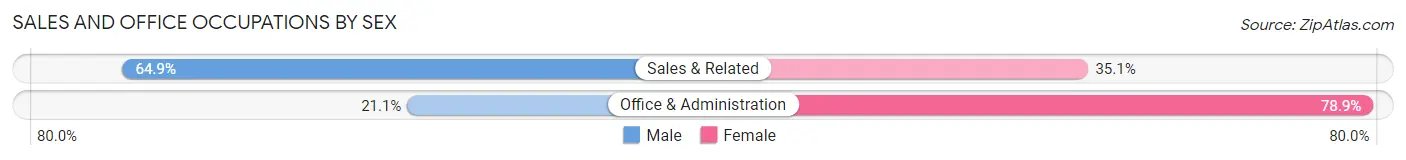
Sales and Office Occupations by Sex
| Occupation | Male | Female |
| Sales & Related | 224 (64.9%) | 121 (35.1%) |
| Office & Administration | 111 (21.1%) | 414 (78.9%) |
| Total (Category) | 335 (38.5%) | 535 (61.5%) |
| Total (Overall) | 1,804 (53.5%) | 1,567 (46.5%) |
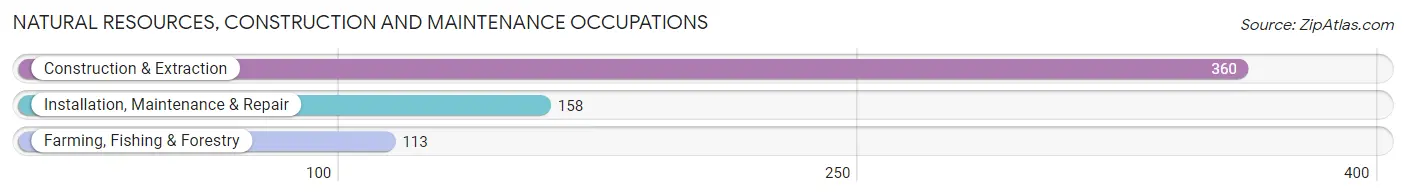
Natural Resources, Construction and Maintenance Occupations
The most common Natural Resources, Construction and Maintenance occupations in Kiowa County are Construction & Extraction (360 | 10.7%), Installation, Maintenance & Repair (158 | 4.7%), and Farming, Fishing & Forestry (113 | 3.4%).
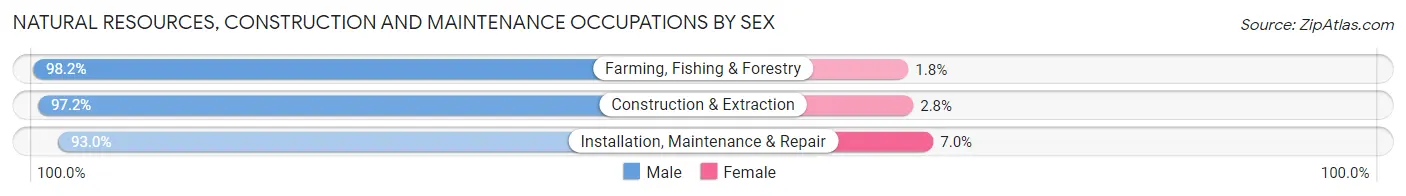
Natural Resources, Construction and Maintenance Occupations by Sex
| Occupation | Male | Female |
| Farming, Fishing & Forestry | 111 (98.2%) | 2 (1.8%) |
| Construction & Extraction | 350 (97.2%) | 10 (2.8%) |
| Installation, Maintenance & Repair | 147 (93.0%) | 11 (7.0%) |
| Total (Category) | 608 (96.4%) | 23 (3.6%) |
| Total (Overall) | 1,804 (53.5%) | 1,567 (46.5%) |
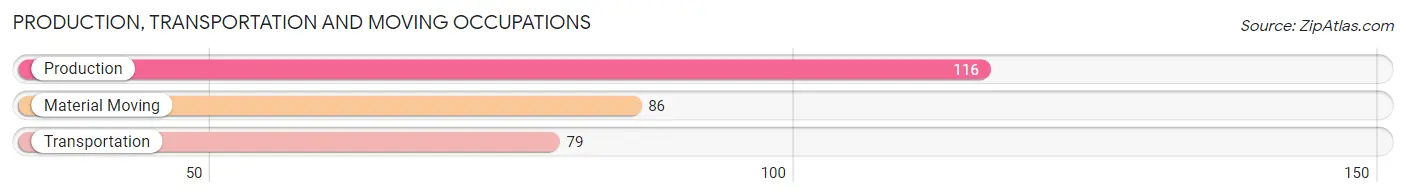
Production, Transportation and Moving Occupations
The most common Production, Transportation and Moving occupations in Kiowa County are Production (116 | 3.4%), Material Moving (86 | 2.5%), and Transportation (79 | 2.3%).
Production, Transportation and Moving Occupations by Sex
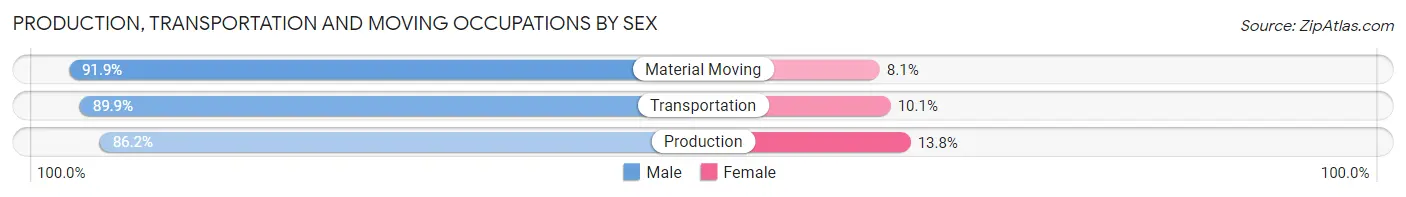
| Occupation | Male | Female |
| Production | 100 (86.2%) | 16 (13.8%) |
| Transportation | 71 (89.9%) | 8 (10.1%) |
| Material Moving | 79 (91.9%) | 7 (8.1%) |
| Total (Category) | 250 (89.0%) | 31 (11.0%) |
| Total (Overall) | 1,804 (53.5%) | 1,567 (46.5%) |
Employment Industries by Sex in Kiowa County
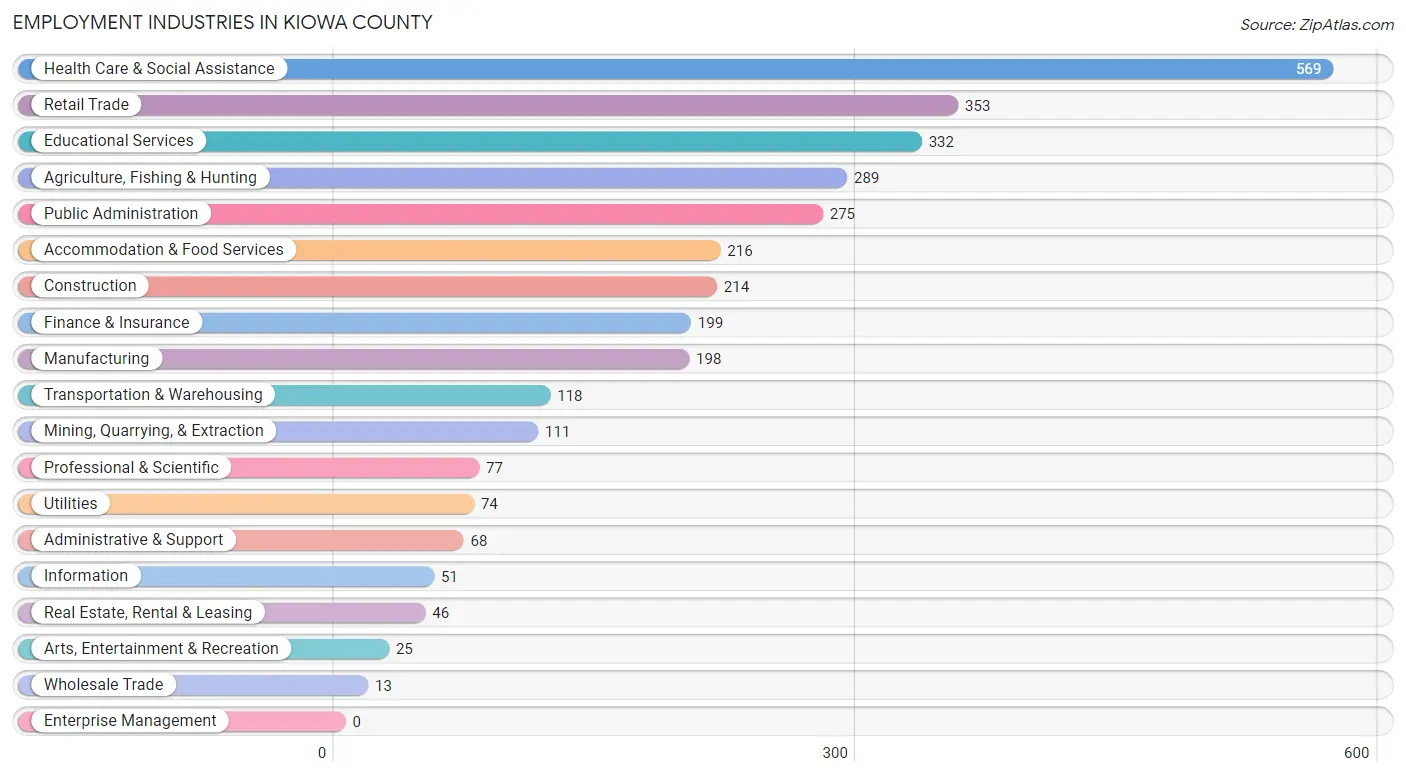
Employment Industries in Kiowa County
The major employment industries in Kiowa County include Health Care & Social Assistance (569 | 16.9%), Retail Trade (353 | 10.5%), Educational Services (332 | 9.9%), Agriculture, Fishing & Hunting (289 | 8.6%), and Public Administration (275 | 8.2%).
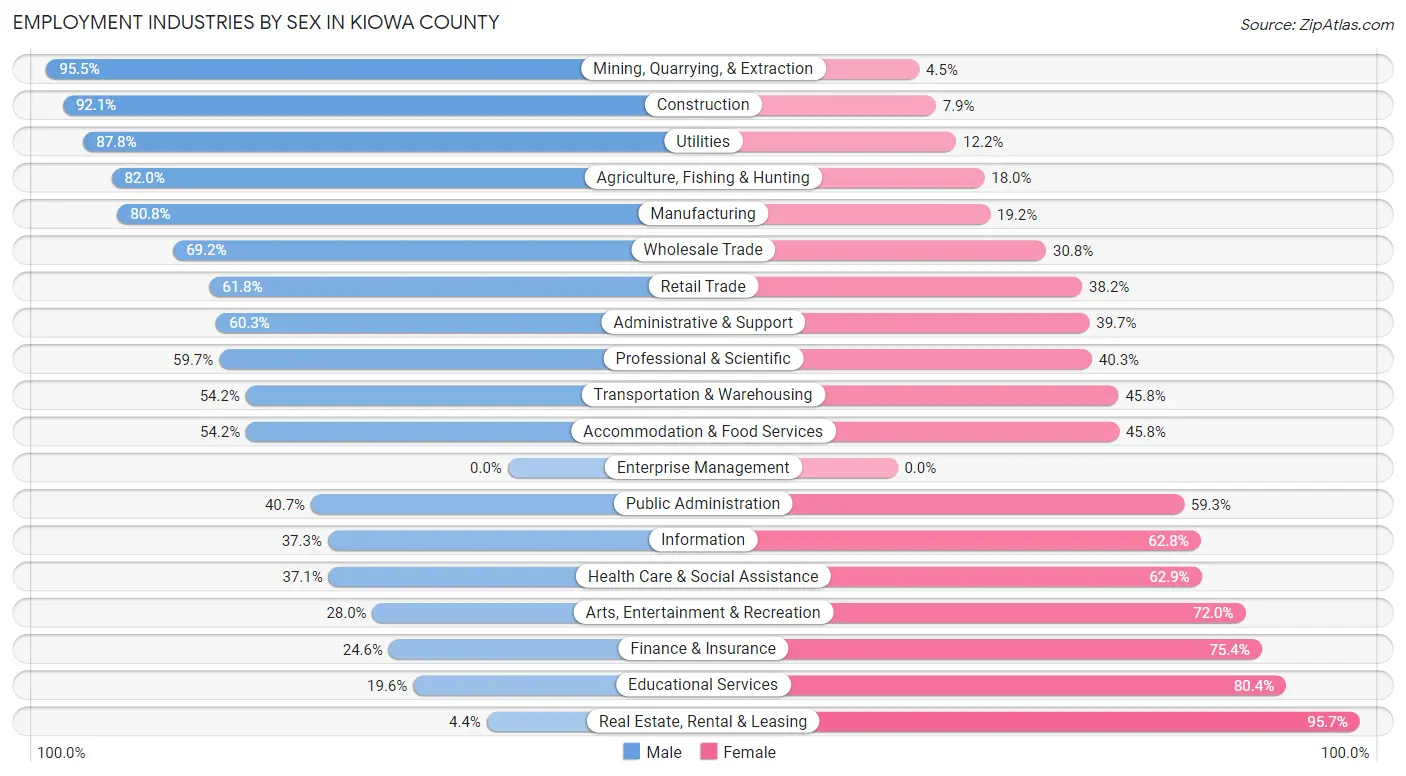
Employment Industries by Sex in Kiowa County
The Kiowa County industries that see more men than women are Mining, Quarrying, & Extraction (95.5%), Construction (92.1%), and Utilities (87.8%), whereas the industries that tend to have a higher number of women are Real Estate, Rental & Leasing (95.7%), Educational Services (80.4%), and Finance & Insurance (75.4%).
| Industry | Male | Female |
| Agriculture, Fishing & Hunting | 237 (82.0%) | 52 (18.0%) |
| Mining, Quarrying, & Extraction | 106 (95.5%) | 5 (4.5%) |
| Construction | 197 (92.1%) | 17 (7.9%) |
| Manufacturing | 160 (80.8%) | 38 (19.2%) |
| Wholesale Trade | 9 (69.2%) | 4 (30.8%) |
| Retail Trade | 218 (61.8%) | 135 (38.2%) |
| Transportation & Warehousing | 64 (54.2%) | 54 (45.8%) |
| Utilities | 65 (87.8%) | 9 (12.2%) |
| Information | 19 (37.2%) | 32 (62.7%) |
| Finance & Insurance | 49 (24.6%) | 150 (75.4%) |
| Real Estate, Rental & Leasing | 2 (4.3%) | 44 (95.7%) |
| Professional & Scientific | 46 (59.7%) | 31 (40.3%) |
| Enterprise Management | 0 (0.0%) | 0 (0.0%) |
| Administrative & Support | 41 (60.3%) | 27 (39.7%) |
| Educational Services | 65 (19.6%) | 267 (80.4%) |
| Health Care & Social Assistance | 211 (37.1%) | 358 (62.9%) |
| Arts, Entertainment & Recreation | 7 (28.0%) | 18 (72.0%) |
| Accommodation & Food Services | 117 (54.2%) | 99 (45.8%) |
| Public Administration | 112 (40.7%) | 163 (59.3%) |
| Total | 1,804 (53.5%) | 1,567 (46.5%) |
Education in Kiowa County
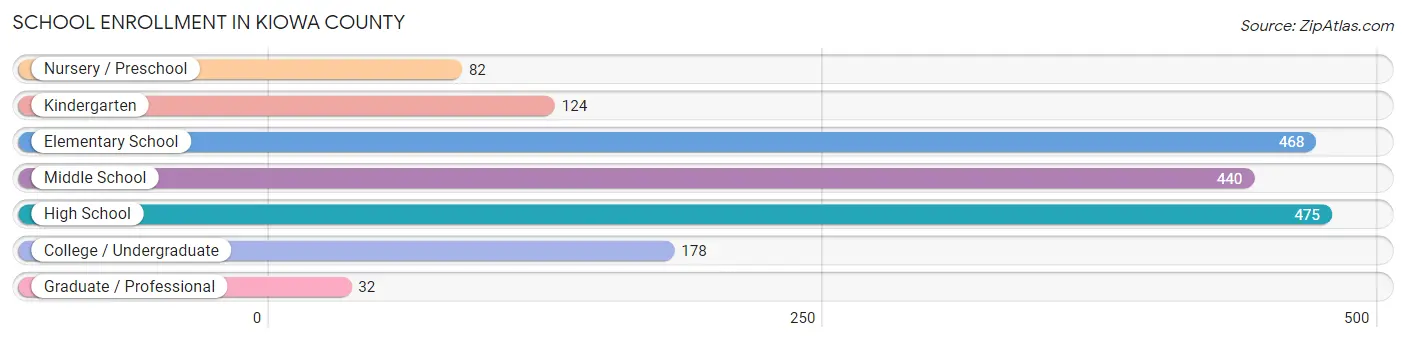
School Enrollment in Kiowa County
The most common levels of schooling among the 1,799 students in Kiowa County are high school (475 | 26.4%), elementary school (468 | 26.0%), and middle school (440 | 24.5%).
| School Level | # Students | % Students |
| Nursery / Preschool | 82 | 4.6% |
| Kindergarten | 124 | 6.9% |
| Elementary School | 468 | 26.0% |
| Middle School | 440 | 24.5% |
| High School | 475 | 26.4% |
| College / Undergraduate | 178 | 9.9% |
| Graduate / Professional | 32 | 1.8% |
| Total | 1,799 | 100.0% |
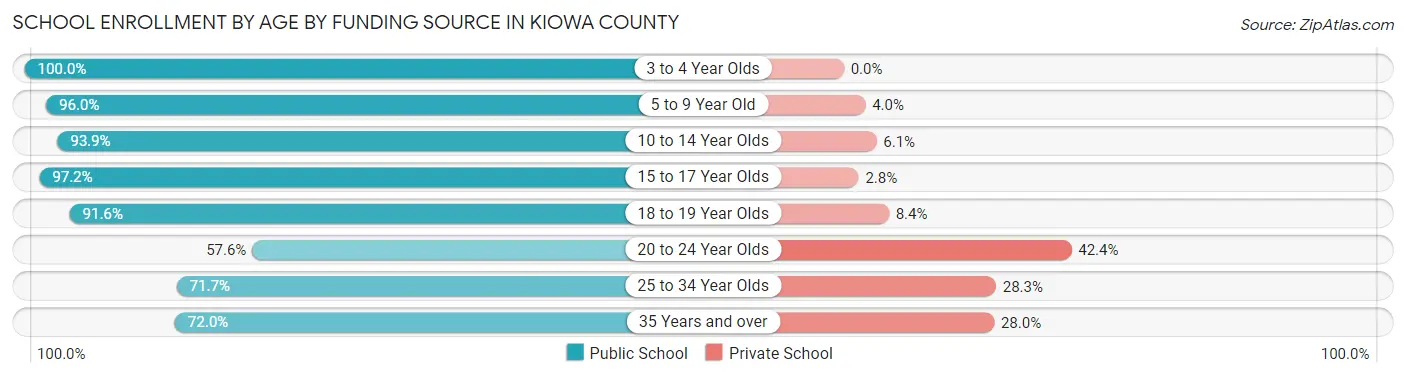
School Enrollment by Age by Funding Source in Kiowa County
Out of a total of 1,799 students who are enrolled in schools in Kiowa County, 140 (7.8%) attend a private institution, while the remaining 1,659 (92.2%) are enrolled in public schools. The age group of 20 to 24 year olds has the highest likelihood of being enrolled in private schools, with 39 (42.4% in the age bracket) enrolled. Conversely, the age group of 3 to 4 year olds has the lowest likelihood of being enrolled in a private school, with 57 (100.0% in the age bracket) attending a public institution.
| Age Bracket | Public School | Private School |
| 3 to 4 Year Olds | 57 (100.0%) | 0 (0.0%) |
| 5 to 9 Year Old | 551 (96.0%) | 23 (4.0%) |
| 10 to 14 Year Olds | 524 (93.9%) | 34 (6.1%) |
| 15 to 17 Year Olds | 282 (97.2%) | 8 (2.8%) |
| 18 to 19 Year Olds | 131 (91.6%) | 12 (8.4%) |
| 20 to 24 Year Olds | 53 (57.6%) | 39 (42.4%) |
| 25 to 34 Year Olds | 43 (71.7%) | 17 (28.3%) |
| 35 Years and over | 18 (72.0%) | 7 (28.0%) |
| Total | 1,659 (92.2%) | 140 (7.8%) |
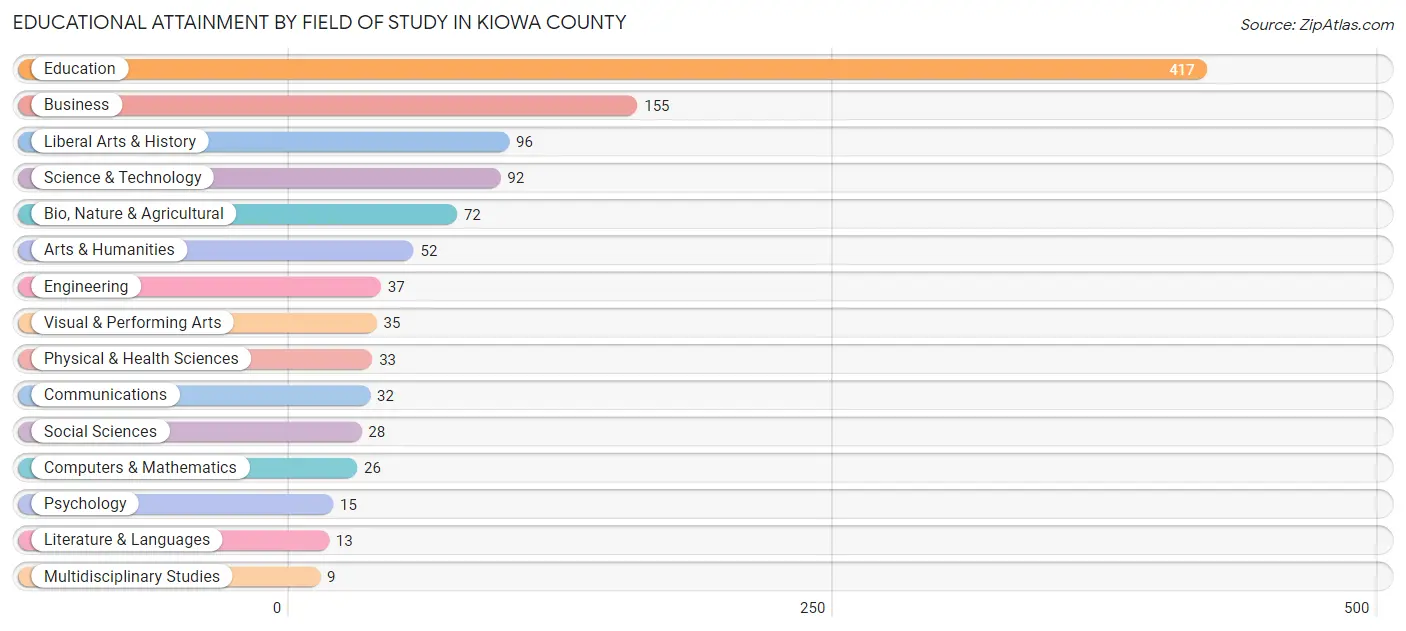
Educational Attainment by Field of Study in Kiowa County
Education (417 | 37.5%), business (155 | 13.9%), liberal arts & history (96 | 8.6%), science & technology (92 | 8.3%), and bio, nature & agricultural (72 | 6.5%) are the most common fields of study among 1,112 individuals in Kiowa County who have obtained a bachelor's degree or higher.
| Field of Study | # Graduates | % Graduates |
| Computers & Mathematics | 26 | 2.3% |
| Bio, Nature & Agricultural | 72 | 6.5% |
| Physical & Health Sciences | 33 | 3.0% |
| Psychology | 15 | 1.3% |
| Social Sciences | 28 | 2.5% |
| Engineering | 37 | 3.3% |
| Multidisciplinary Studies | 9 | 0.8% |
| Science & Technology | 92 | 8.3% |
| Business | 155 | 13.9% |
| Education | 417 | 37.5% |
| Literature & Languages | 13 | 1.2% |
| Liberal Arts & History | 96 | 8.6% |
| Visual & Performing Arts | 35 | 3.2% |
| Communications | 32 | 2.9% |
| Arts & Humanities | 52 | 4.7% |
| Total | 1,112 | 100.0% |
Transportation & Commute in Kiowa County
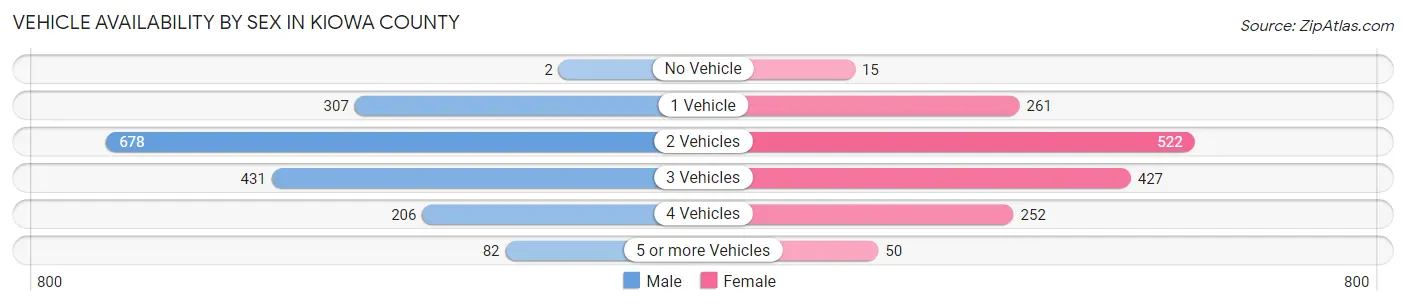
Vehicle Availability by Sex in Kiowa County
The most prevalent vehicle ownership categories in Kiowa County are males with 2 vehicles (678, accounting for 39.7%) and females with 2 vehicles (522, making up 44.4%).
| Vehicles Available | Male | Female |
| No Vehicle | 2 (0.1%) | 15 (1.0%) |
| 1 Vehicle | 307 (18.0%) | 261 (17.1%) |
| 2 Vehicles | 678 (39.7%) | 522 (34.2%) |
| 3 Vehicles | 431 (25.3%) | 427 (28.0%) |
| 4 Vehicles | 206 (12.1%) | 252 (16.5%) |
| 5 or more Vehicles | 82 (4.8%) | 50 (3.3%) |
| Total | 1,706 (100.0%) | 1,527 (100.0%) |
Commute Time in Kiowa County
The most frequently occuring commute durations in Kiowa County are 5 to 9 minutes (694 commuters, 23.0%), less than 5 minutes (386 commuters, 12.8%), and 10 to 14 minutes (363 commuters, 12.0%).
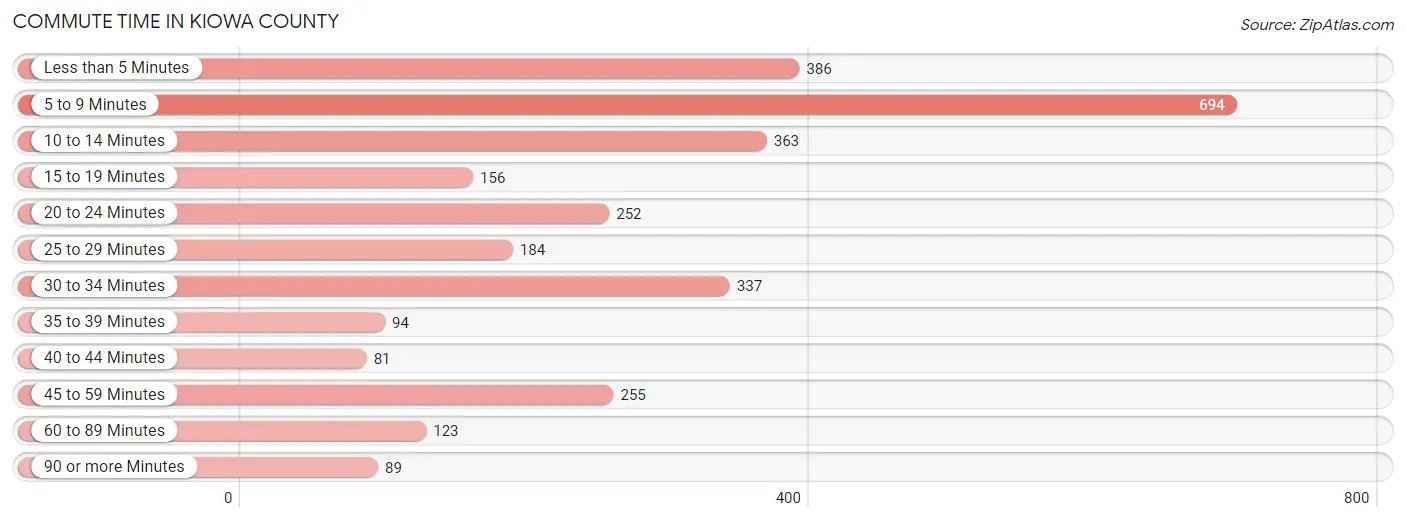
| Commute Time | # Commuters | % Commuters |
| Less than 5 Minutes | 386 | 12.8% |
| 5 to 9 Minutes | 694 | 23.0% |
| 10 to 14 Minutes | 363 | 12.0% |
| 15 to 19 Minutes | 156 | 5.2% |
| 20 to 24 Minutes | 252 | 8.4% |
| 25 to 29 Minutes | 184 | 6.1% |
| 30 to 34 Minutes | 337 | 11.2% |
| 35 to 39 Minutes | 94 | 3.1% |
| 40 to 44 Minutes | 81 | 2.7% |
| 45 to 59 Minutes | 255 | 8.5% |
| 60 to 89 Minutes | 123 | 4.1% |
| 90 or more Minutes | 89 | 2.9% |
Commute Time by Sex in Kiowa County
The most common commute times in Kiowa County are 5 to 9 minutes (423 commuters, 27.2%) for males and 5 to 9 minutes (271 commuters, 18.6%) for females.
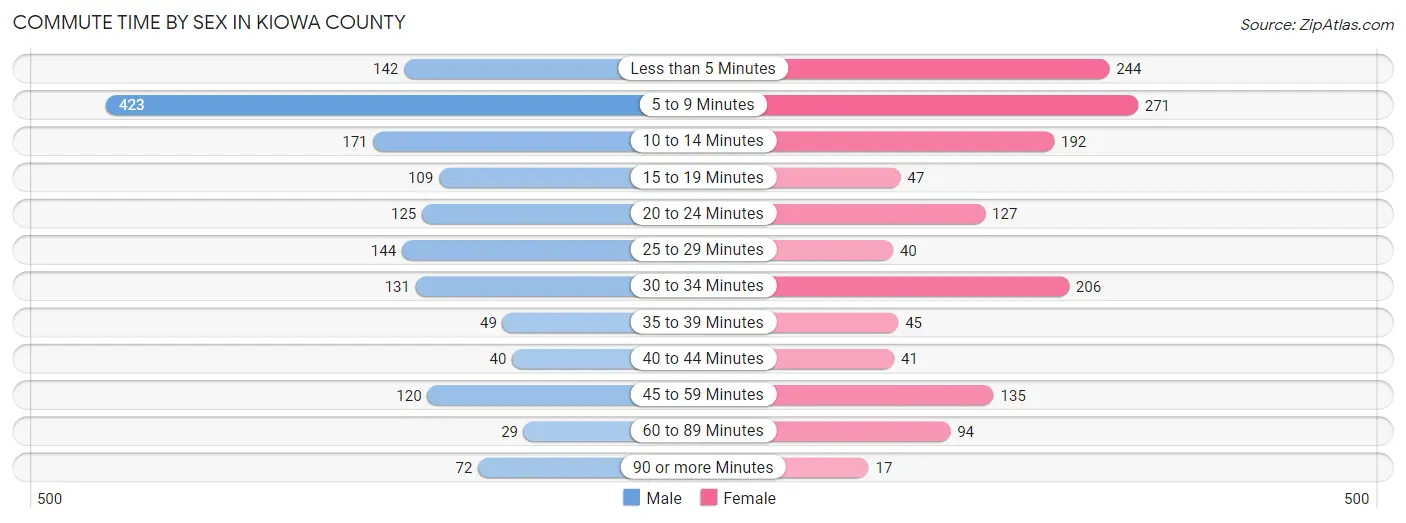
| Commute Time | Male | Female |
| Less than 5 Minutes | 142 (9.1%) | 244 (16.7%) |
| 5 to 9 Minutes | 423 (27.2%) | 271 (18.6%) |
| 10 to 14 Minutes | 171 (11.0%) | 192 (13.2%) |
| 15 to 19 Minutes | 109 (7.0%) | 47 (3.2%) |
| 20 to 24 Minutes | 125 (8.0%) | 127 (8.7%) |
| 25 to 29 Minutes | 144 (9.3%) | 40 (2.7%) |
| 30 to 34 Minutes | 131 (8.4%) | 206 (14.1%) |
| 35 to 39 Minutes | 49 (3.2%) | 45 (3.1%) |
| 40 to 44 Minutes | 40 (2.6%) | 41 (2.8%) |
| 45 to 59 Minutes | 120 (7.7%) | 135 (9.2%) |
| 60 to 89 Minutes | 29 (1.9%) | 94 (6.4%) |
| 90 or more Minutes | 72 (4.6%) | 17 (1.2%) |
Time of Departure to Work by Sex in Kiowa County
The most frequent times of departure to work in Kiowa County are 7:30 AM to 7:59 AM (273, 17.6%) for males and 7:00 AM to 7:29 AM (408, 28.0%) for females.
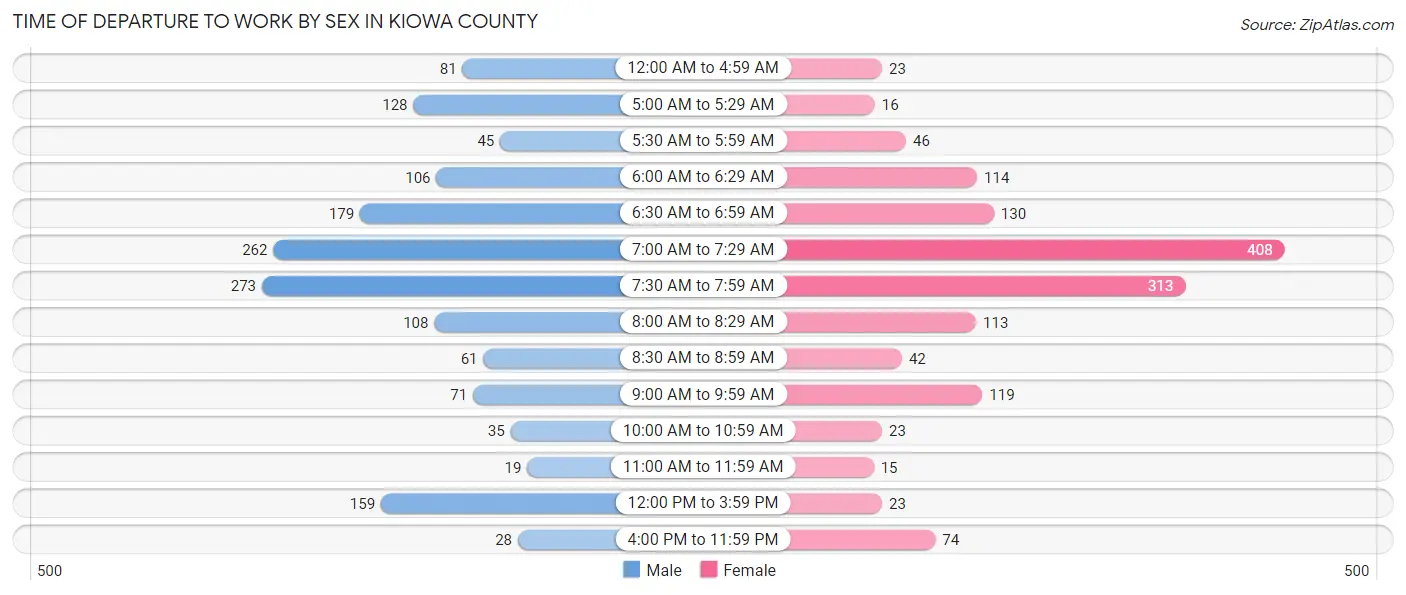
| Time of Departure | Male | Female |
| 12:00 AM to 4:59 AM | 81 (5.2%) | 23 (1.6%) |
| 5:00 AM to 5:29 AM | 128 (8.2%) | 16 (1.1%) |
| 5:30 AM to 5:59 AM | 45 (2.9%) | 46 (3.2%) |
| 6:00 AM to 6:29 AM | 106 (6.8%) | 114 (7.8%) |
| 6:30 AM to 6:59 AM | 179 (11.5%) | 130 (8.9%) |
| 7:00 AM to 7:29 AM | 262 (16.9%) | 408 (28.0%) |
| 7:30 AM to 7:59 AM | 273 (17.6%) | 313 (21.4%) |
| 8:00 AM to 8:29 AM | 108 (7.0%) | 113 (7.7%) |
| 8:30 AM to 8:59 AM | 61 (3.9%) | 42 (2.9%) |
| 9:00 AM to 9:59 AM | 71 (4.6%) | 119 (8.2%) |
| 10:00 AM to 10:59 AM | 35 (2.2%) | 23 (1.6%) |
| 11:00 AM to 11:59 AM | 19 (1.2%) | 15 (1.0%) |
| 12:00 PM to 3:59 PM | 159 (10.2%) | 23 (1.6%) |
| 4:00 PM to 11:59 PM | 28 (1.8%) | 74 (5.1%) |
| Total | 1,555 (100.0%) | 1,459 (100.0%) |
Housing Occupancy in Kiowa County
Occupancy by Ownership in Kiowa County
Of the total 3,294 dwellings in Kiowa County, owner-occupied units account for 2,444 (74.2%), while renter-occupied units make up 850 (25.8%).
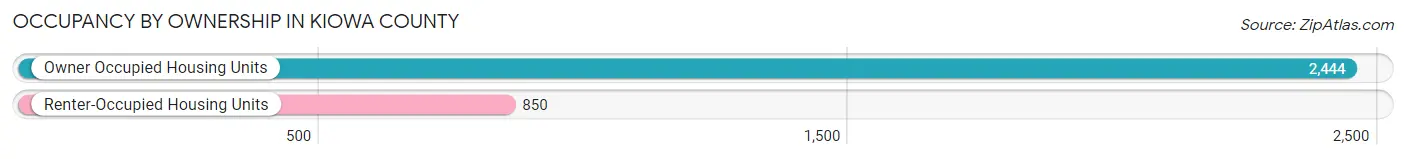
| Occupancy | # Housing Units | % Housing Units |
| Owner Occupied Housing Units | 2,444 | 74.2% |
| Renter-Occupied Housing Units | 850 | 25.8% |
| Total Occupied Housing Units | 3,294 | 100.0% |
Occupancy by Household Size in Kiowa County
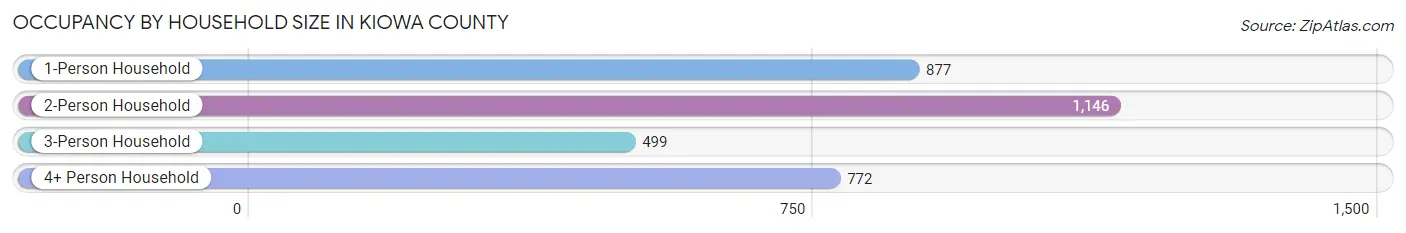
| Household Size | # Housing Units | % Housing Units |
| 1-Person Household | 877 | 26.6% |
| 2-Person Household | 1,146 | 34.8% |
| 3-Person Household | 499 | 15.1% |
| 4+ Person Household | 772 | 23.4% |
| Total Housing Units | 3,294 | 100.0% |
Occupancy by Ownership by Household Size in Kiowa County
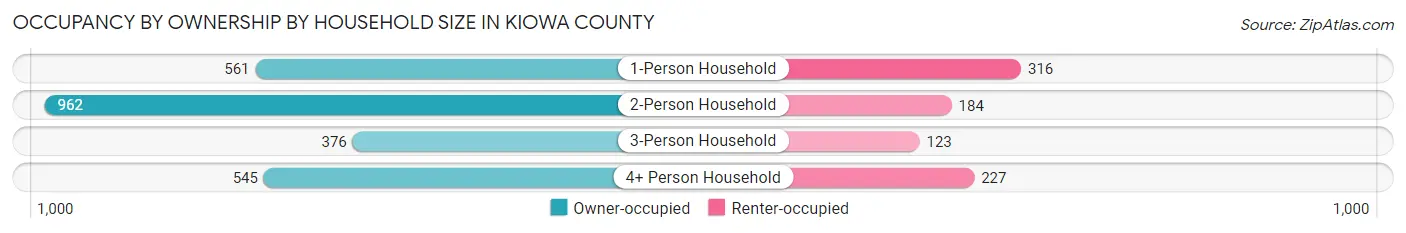
| Household Size | Owner-occupied | Renter-occupied |
| 1-Person Household | 561 (64.0%) | 316 (36.0%) |
| 2-Person Household | 962 (83.9%) | 184 (16.1%) |
| 3-Person Household | 376 (75.3%) | 123 (24.6%) |
| 4+ Person Household | 545 (70.6%) | 227 (29.4%) |
| Total Housing Units | 2,444 (74.2%) | 850 (25.8%) |
Occupancy by Educational Attainment in Kiowa County
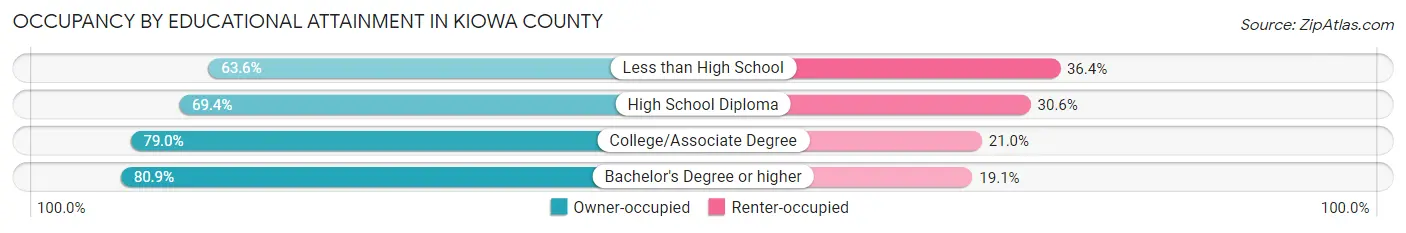
| Household Size | Owner-occupied | Renter-occupied |
| Less than High School | 307 (63.6%) | 176 (36.4%) |
| High School Diploma | 698 (69.4%) | 308 (30.6%) |
| College/Associate Degree | 909 (79.0%) | 241 (21.0%) |
| Bachelor's Degree or higher | 530 (80.9%) | 125 (19.1%) |
Occupancy by Age of Householder in Kiowa County
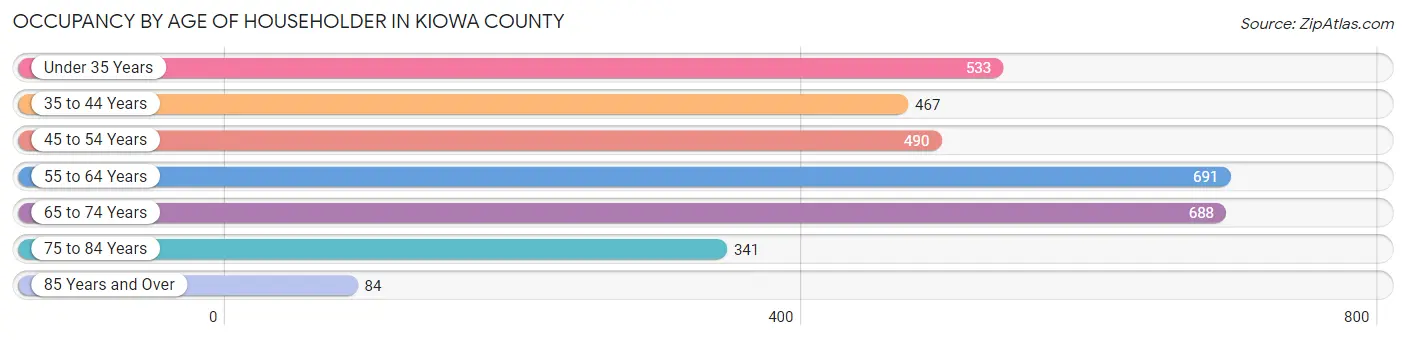
| Age Bracket | # Households | % Households |
| Under 35 Years | 533 | 16.2% |
| 35 to 44 Years | 467 | 14.2% |
| 45 to 54 Years | 490 | 14.9% |
| 55 to 64 Years | 691 | 21.0% |
| 65 to 74 Years | 688 | 20.9% |
| 75 to 84 Years | 341 | 10.3% |
| 85 Years and Over | 84 | 2.5% |
| Total | 3,294 | 100.0% |
Housing Finances in Kiowa County
Median Income by Occupancy in Kiowa County
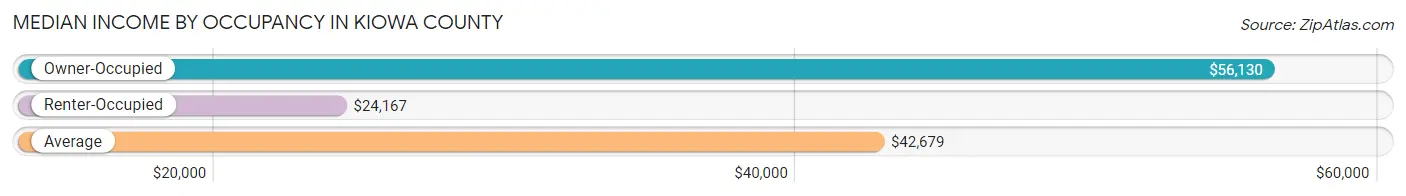
| Occupancy Type | # Households | Median Income |
| Owner-Occupied | 2,444 (74.2%) | $56,130 |
| Renter-Occupied | 850 (25.8%) | $24,167 |
| Average | 3,294 (100.0%) | $42,679 |
Occupancy by Householder Income Bracket in Kiowa County
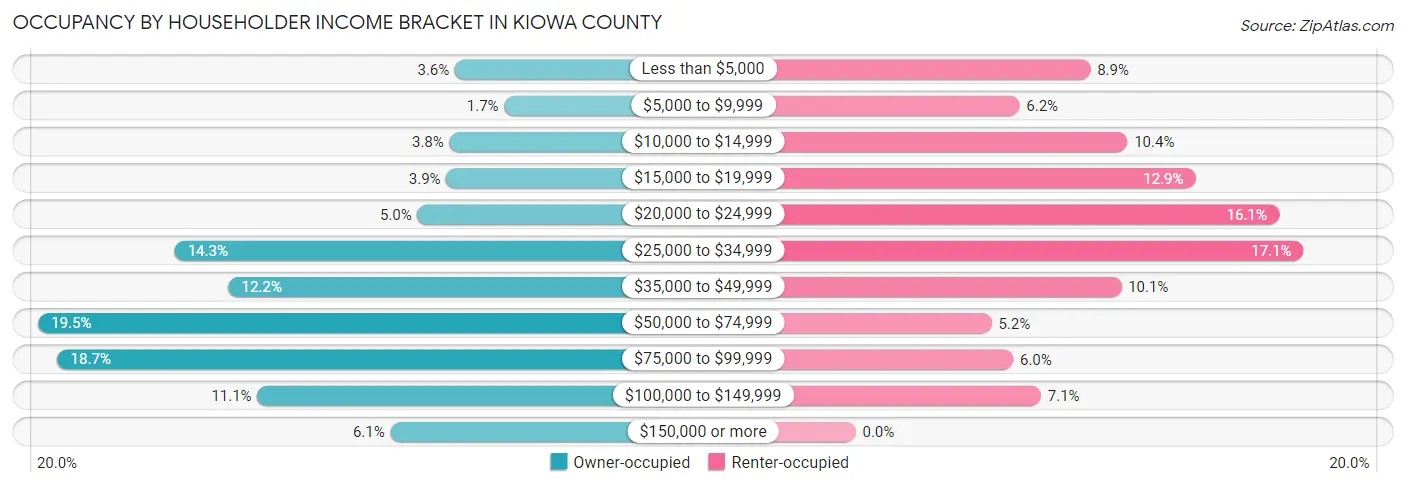
| Income Bracket | Owner-occupied | Renter-occupied |
| Less than $5,000 | 88 (3.6%) | 76 (8.9%) |
| $5,000 to $9,999 | 42 (1.7%) | 53 (6.2%) |
| $10,000 to $14,999 | 93 (3.8%) | 88 (10.3%) |
| $15,000 to $19,999 | 96 (3.9%) | 110 (12.9%) |
| $20,000 to $24,999 | 123 (5.0%) | 137 (16.1%) |
| $25,000 to $34,999 | 349 (14.3%) | 145 (17.1%) |
| $35,000 to $49,999 | 299 (12.2%) | 86 (10.1%) |
| $50,000 to $74,999 | 476 (19.5%) | 44 (5.2%) |
| $75,000 to $99,999 | 458 (18.7%) | 51 (6.0%) |
| $100,000 to $149,999 | 272 (11.1%) | 60 (7.1%) |
| $150,000 or more | 148 (6.1%) | 0 (0.0%) |
| Total | 2,444 (100.0%) | 850 (100.0%) |
Monthly Housing Cost Tiers in Kiowa County
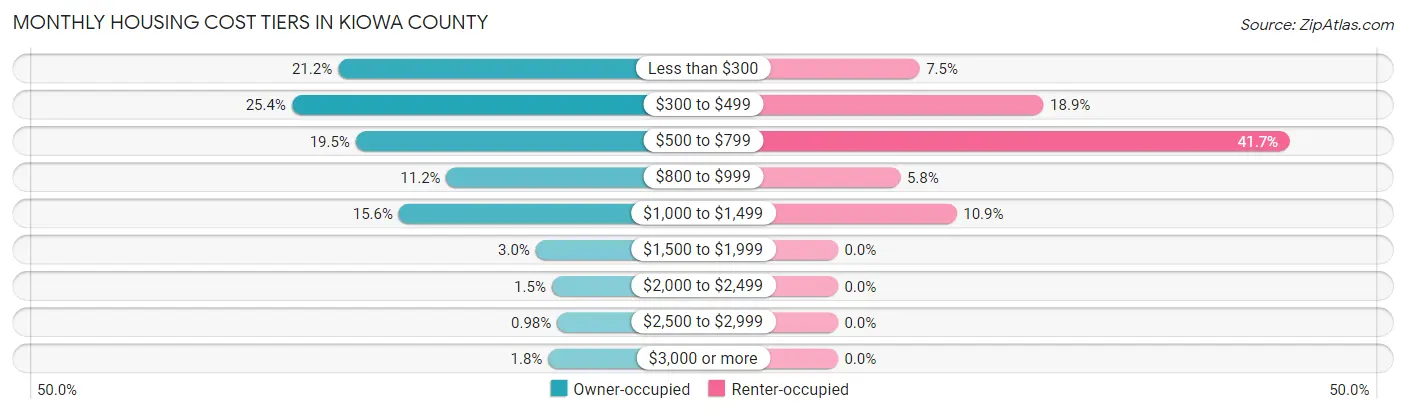
| Monthly Cost | Owner-occupied | Renter-occupied |
| Less than $300 | 517 (21.1%) | 64 (7.5%) |
| $300 to $499 | 621 (25.4%) | 161 (18.9%) |
| $500 to $799 | 477 (19.5%) | 354 (41.6%) |
| $800 to $999 | 273 (11.2%) | 49 (5.8%) |
| $1,000 to $1,499 | 380 (15.5%) | 93 (10.9%) |
| $1,500 to $1,999 | 72 (2.9%) | 0 (0.0%) |
| $2,000 to $2,499 | 36 (1.5%) | 0 (0.0%) |
| $2,500 to $2,999 | 24 (1.0%) | 0 (0.0%) |
| $3,000 or more | 44 (1.8%) | 0 (0.0%) |
| Total | 2,444 (100.0%) | 850 (100.0%) |
Physical Housing Characteristics in Kiowa County
Housing Structures in Kiowa County
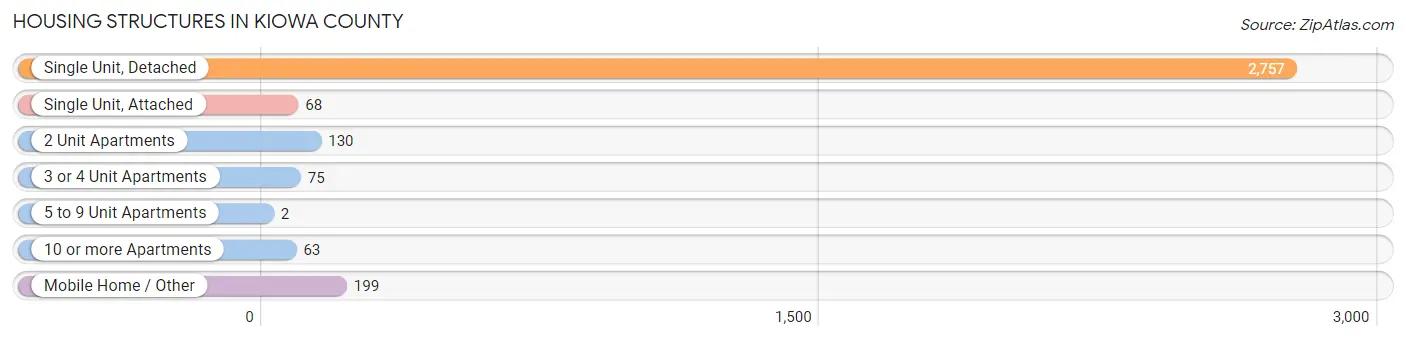
| Structure Type | # Housing Units | % Housing Units |
| Single Unit, Detached | 2,757 | 83.7% |
| Single Unit, Attached | 68 | 2.1% |
| 2 Unit Apartments | 130 | 4.0% |
| 3 or 4 Unit Apartments | 75 | 2.3% |
| 5 to 9 Unit Apartments | 2 | 0.1% |
| 10 or more Apartments | 63 | 1.9% |
| Mobile Home / Other | 199 | 6.0% |
| Total | 3,294 | 100.0% |
Housing Structures by Occupancy in Kiowa County
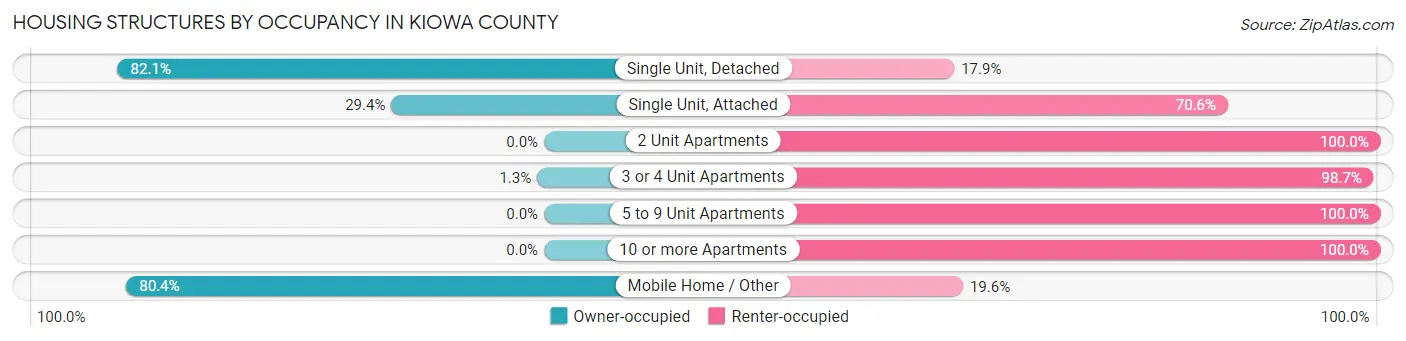
| Structure Type | Owner-occupied | Renter-occupied |
| Single Unit, Detached | 2,263 (82.1%) | 494 (17.9%) |
| Single Unit, Attached | 20 (29.4%) | 48 (70.6%) |
| 2 Unit Apartments | 0 (0.0%) | 130 (100.0%) |
| 3 or 4 Unit Apartments | 1 (1.3%) | 74 (98.7%) |
| 5 to 9 Unit Apartments | 0 (0.0%) | 2 (100.0%) |
| 10 or more Apartments | 0 (0.0%) | 63 (100.0%) |
| Mobile Home / Other | 160 (80.4%) | 39 (19.6%) |
| Total | 2,444 (74.2%) | 850 (25.8%) |
Housing Structures by Number of Rooms in Kiowa County
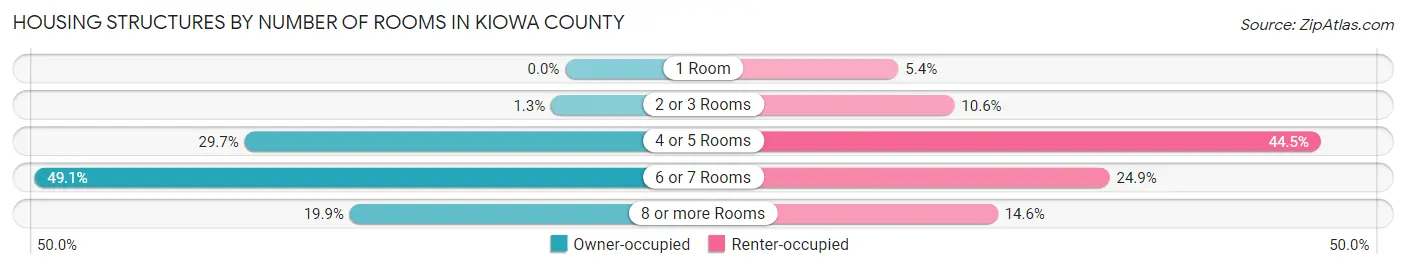
| Number of Rooms | Owner-occupied | Renter-occupied |
| 1 Room | 0 (0.0%) | 46 (5.4%) |
| 2 or 3 Rooms | 32 (1.3%) | 90 (10.6%) |
| 4 or 5 Rooms | 725 (29.7%) | 378 (44.5%) |
| 6 or 7 Rooms | 1,200 (49.1%) | 212 (24.9%) |
| 8 or more Rooms | 487 (19.9%) | 124 (14.6%) |
| Total | 2,444 (100.0%) | 850 (100.0%) |
Housing Structure by Heating Type in Kiowa County
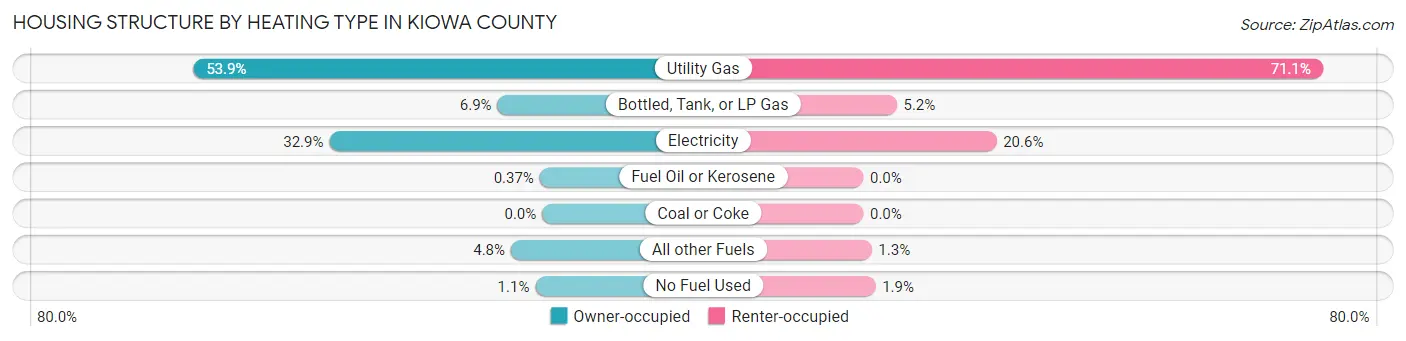
| Heating Type | Owner-occupied | Renter-occupied |
| Utility Gas | 1,318 (53.9%) | 604 (71.1%) |
| Bottled, Tank, or LP Gas | 169 (6.9%) | 44 (5.2%) |
| Electricity | 804 (32.9%) | 175 (20.6%) |
| Fuel Oil or Kerosene | 9 (0.4%) | 0 (0.0%) |
| Coal or Coke | 0 (0.0%) | 0 (0.0%) |
| All other Fuels | 118 (4.8%) | 11 (1.3%) |
| No Fuel Used | 26 (1.1%) | 16 (1.9%) |
| Total | 2,444 (100.0%) | 850 (100.0%) |
Household Vehicle Usage in Kiowa County
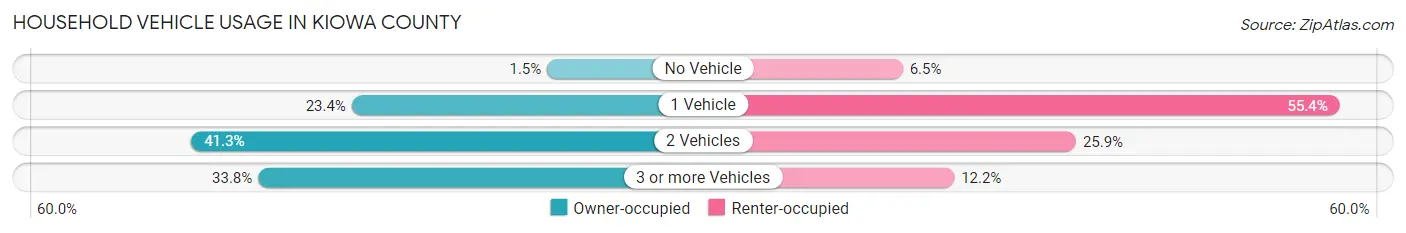
| Vehicles per Household | Owner-occupied | Renter-occupied |
| No Vehicle | 36 (1.5%) | 55 (6.5%) |
| 1 Vehicle | 571 (23.4%) | 471 (55.4%) |
| 2 Vehicles | 1,010 (41.3%) | 220 (25.9%) |
| 3 or more Vehicles | 827 (33.8%) | 104 (12.2%) |
| Total | 2,444 (100.0%) | 850 (100.0%) |
Real Estate & Mortgages in Kiowa County
Real Estate and Mortgage Overview in Kiowa County
| Characteristic | Without Mortgage | With Mortgage |
| Housing Units | 1,535 | 909 |
| Median Property Value | $56,500 | $108,100 |
| Median Household Income | $44,922 | $80 |
| Monthly Housing Costs | $357 | $44 |
| Real Estate Taxes | $367 | $53 |
Property Value by Mortgage Status in Kiowa County
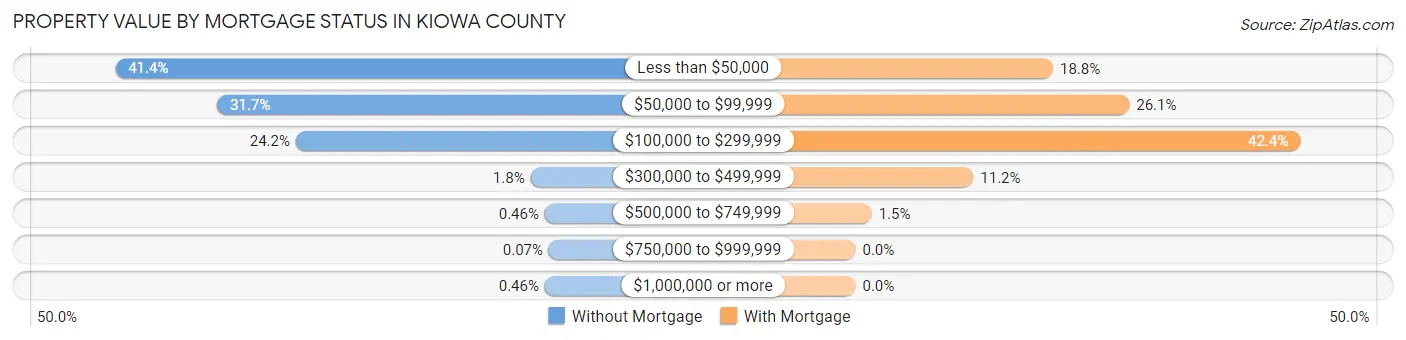
| Property Value | Without Mortgage | With Mortgage |
| Less than $50,000 | 635 (41.4%) | 171 (18.8%) |
| $50,000 to $99,999 | 486 (31.7%) | 237 (26.1%) |
| $100,000 to $299,999 | 371 (24.2%) | 385 (42.3%) |
| $300,000 to $499,999 | 28 (1.8%) | 102 (11.2%) |
| $500,000 to $749,999 | 7 (0.5%) | 14 (1.5%) |
| $750,000 to $999,999 | 1 (0.1%) | 0 (0.0%) |
| $1,000,000 or more | 7 (0.5%) | 0 (0.0%) |
| Total | 1,535 (100.0%) | 909 (100.0%) |
Household Income by Mortgage Status in Kiowa County
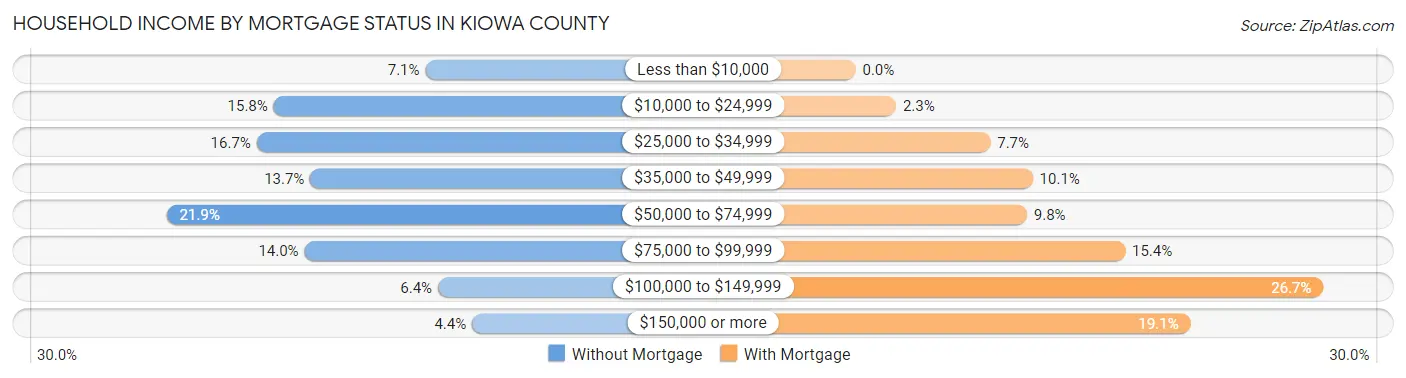
| Household Income | Without Mortgage | With Mortgage |
| Less than $10,000 | 109 (7.1%) | 0 (0.0%) |
| $10,000 to $24,999 | 242 (15.8%) | 21 (2.3%) |
| $25,000 to $34,999 | 257 (16.7%) | 70 (7.7%) |
| $35,000 to $49,999 | 210 (13.7%) | 92 (10.1%) |
| $50,000 to $74,999 | 336 (21.9%) | 89 (9.8%) |
| $75,000 to $99,999 | 215 (14.0%) | 140 (15.4%) |
| $100,000 to $149,999 | 98 (6.4%) | 243 (26.7%) |
| $150,000 or more | 68 (4.4%) | 174 (19.1%) |
| Total | 1,535 (100.0%) | 909 (100.0%) |
Property Value to Household Income Ratio in Kiowa County
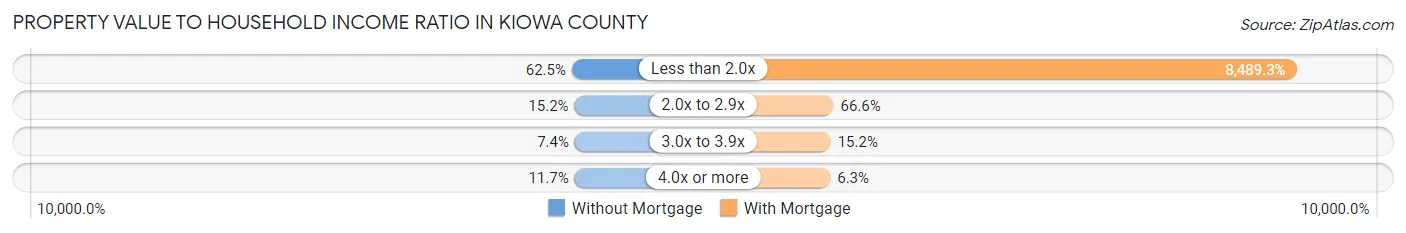
| Value-to-Income Ratio | Without Mortgage | With Mortgage |
| Less than 2.0x | 960 (62.5%) | 77,168 (8,489.3%) |
| 2.0x to 2.9x | 234 (15.2%) | 605 (66.6%) |
| 3.0x to 3.9x | 113 (7.4%) | 138 (15.2%) |
| 4.0x or more | 180 (11.7%) | 57 (6.3%) |
| Total | 1,535 (100.0%) | 909 (100.0%) |
Real Estate Taxes by Mortgage Status in Kiowa County
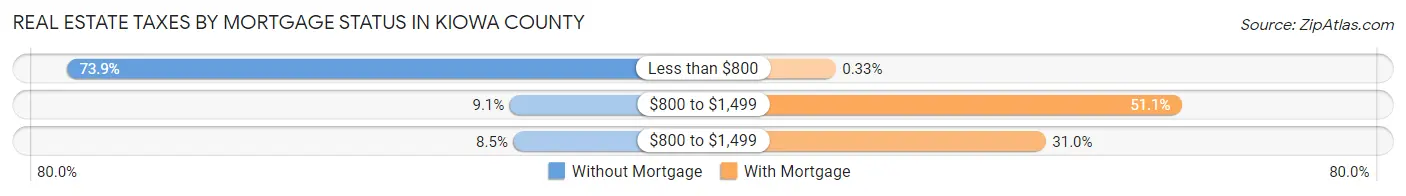
| Property Taxes | Without Mortgage | With Mortgage |
| Less than $800 | 1,134 (73.9%) | 3 (0.3%) |
| $800 to $1,499 | 139 (9.1%) | 464 (51.0%) |
| $800 to $1,499 | 131 (8.5%) | 282 (31.0%) |
| Total | 1,535 (100.0%) | 909 (100.0%) |
Health & Disability in Kiowa County
Health Insurance Coverage by Age in Kiowa County
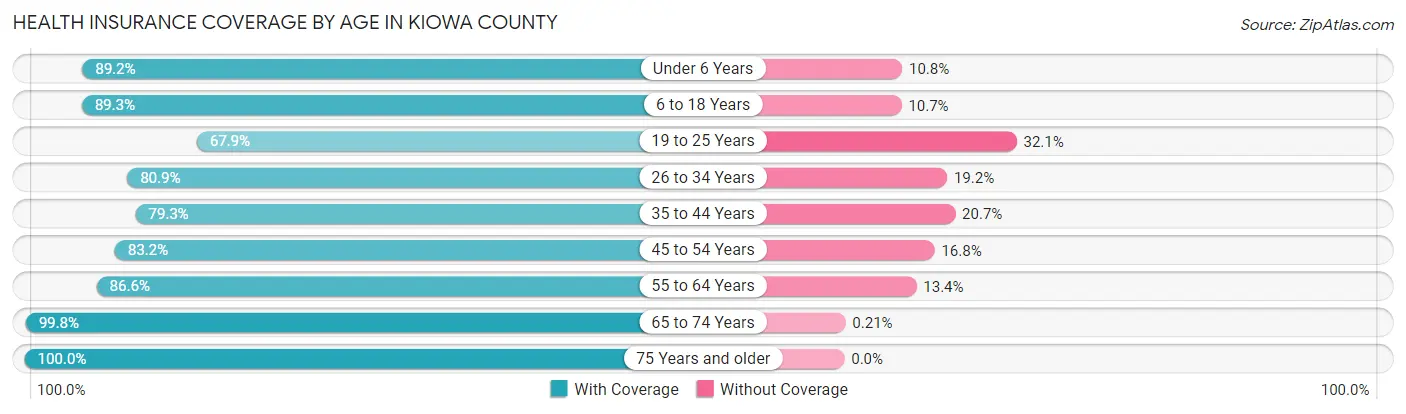
| Age Bracket | With Coverage | Without Coverage |
| Under 6 Years | 588 (89.2%) | 71 (10.8%) |
| 6 to 18 Years | 1,349 (89.3%) | 161 (10.7%) |
| 19 to 25 Years | 353 (67.9%) | 167 (32.1%) |
| 26 to 34 Years | 667 (80.8%) | 158 (19.2%) |
| 35 to 44 Years | 756 (79.3%) | 197 (20.7%) |
| 45 to 54 Years | 742 (83.2%) | 150 (16.8%) |
| 55 to 64 Years | 1,108 (86.6%) | 172 (13.4%) |
| 65 to 74 Years | 973 (99.8%) | 2 (0.2%) |
| 75 Years and older | 660 (100.0%) | 0 (0.0%) |
| Total | 7,196 (87.0%) | 1,078 (13.0%) |
Health Insurance Coverage by Citizenship Status in Kiowa County
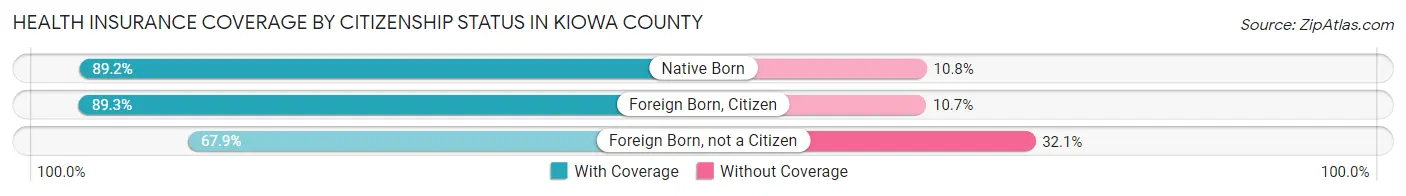
| Citizenship Status | With Coverage | Without Coverage |
| Native Born | 588 (89.2%) | 71 (10.8%) |
| Foreign Born, Citizen | 1,349 (89.3%) | 161 (10.7%) |
| Foreign Born, not a Citizen | 353 (67.9%) | 167 (32.1%) |
Health Insurance Coverage by Household Income in Kiowa County
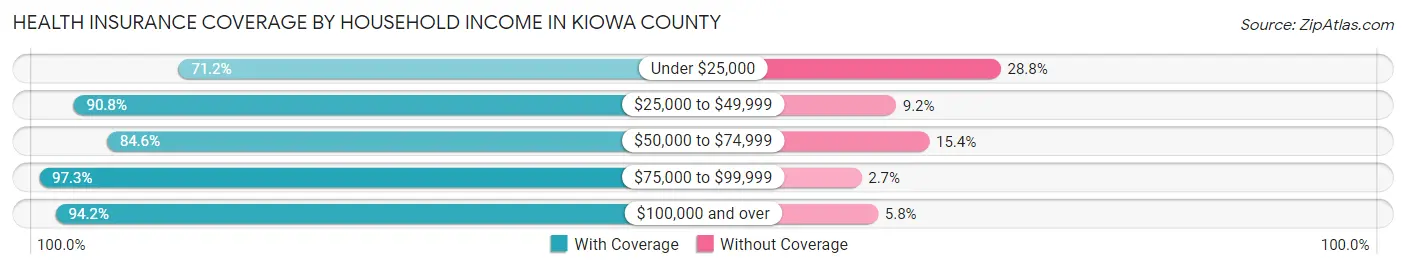
| Household Income | With Coverage | Without Coverage |
| Under $25,000 | 1,414 (71.2%) | 572 (28.8%) |
| $25,000 to $49,999 | 1,613 (90.8%) | 163 (9.2%) |
| $50,000 to $74,999 | 1,092 (84.6%) | 199 (15.4%) |
| $75,000 to $99,999 | 1,510 (97.3%) | 42 (2.7%) |
| $100,000 and over | 1,553 (94.2%) | 96 (5.8%) |
Public vs Private Health Insurance Coverage by Age in Kiowa County
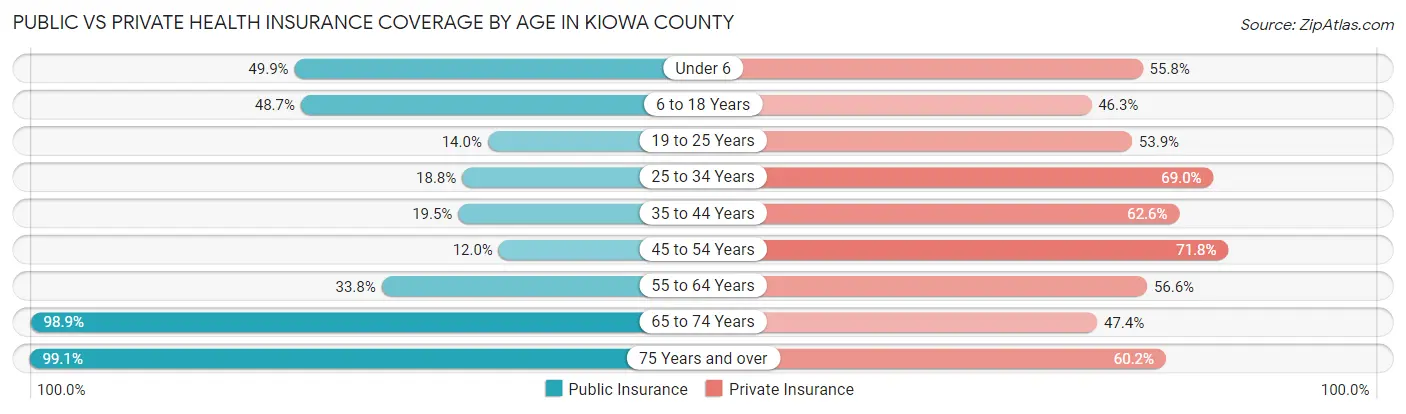
| Age Bracket | Public Insurance | Private Insurance |
| Under 6 | 329 (49.9%) | 368 (55.8%) |
| 6 to 18 Years | 736 (48.7%) | 699 (46.3%) |
| 19 to 25 Years | 73 (14.0%) | 280 (53.8%) |
| 25 to 34 Years | 155 (18.8%) | 569 (69.0%) |
| 35 to 44 Years | 186 (19.5%) | 597 (62.6%) |
| 45 to 54 Years | 107 (12.0%) | 640 (71.8%) |
| 55 to 64 Years | 432 (33.8%) | 725 (56.6%) |
| 65 to 74 Years | 964 (98.9%) | 462 (47.4%) |
| 75 Years and over | 654 (99.1%) | 397 (60.2%) |
| Total | 3,636 (43.9%) | 4,737 (57.3%) |
Disability Status by Sex by Age in Kiowa County
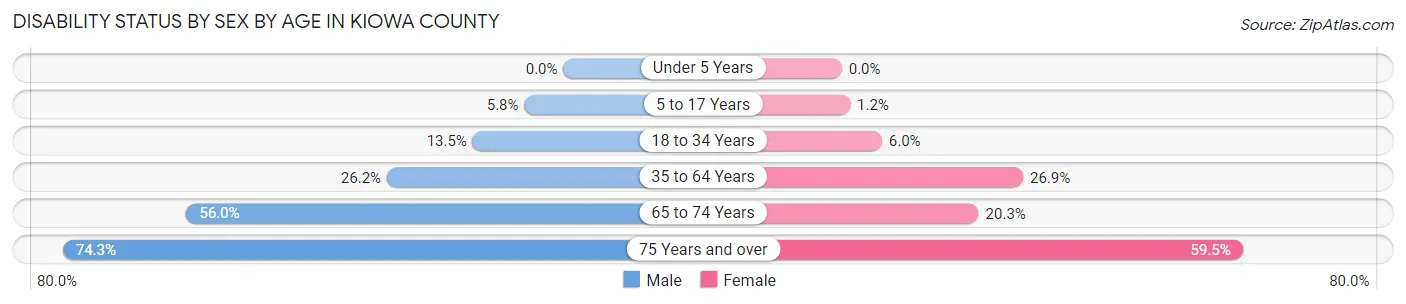
| Age Bracket | Male | Female |
| Under 5 Years | 0 (0.0%) | 0 (0.0%) |
| 5 to 17 Years | 39 (5.8%) | 10 (1.2%) |
| 18 to 34 Years | 98 (13.5%) | 44 (5.9%) |
| 35 to 64 Years | 400 (26.2%) | 430 (26.9%) |
| 65 to 74 Years | 262 (56.0%) | 103 (20.3%) |
| 75 Years and over | 217 (74.3%) | 219 (59.5%) |
Disability Class by Sex by Age in Kiowa County
Disability Class: Hearing Difficulty
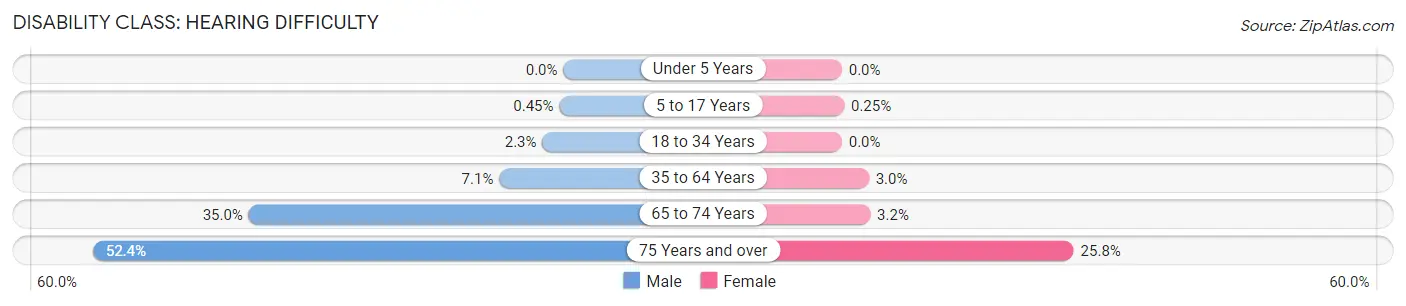
| Age Bracket | Male | Female |
| Under 5 Years | 0 (0.0%) | 0 (0.0%) |
| 5 to 17 Years | 3 (0.4%) | 2 (0.3%) |
| 18 to 34 Years | 17 (2.3%) | 0 (0.0%) |
| 35 to 64 Years | 109 (7.1%) | 48 (3.0%) |
| 65 to 74 Years | 164 (35.0%) | 16 (3.2%) |
| 75 Years and over | 153 (52.4%) | 95 (25.8%) |
Disability Class: Vision Difficulty
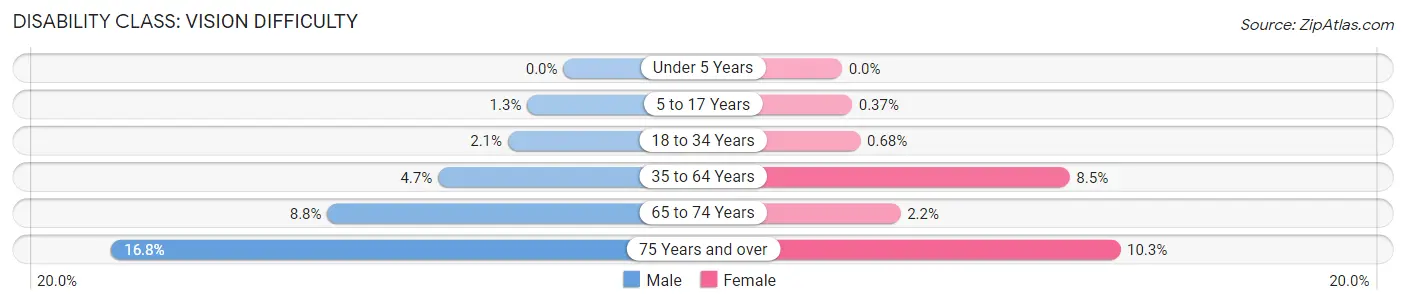
| Age Bracket | Male | Female |
| Under 5 Years | 0 (0.0%) | 0 (0.0%) |
| 5 to 17 Years | 9 (1.3%) | 3 (0.4%) |
| 18 to 34 Years | 15 (2.1%) | 5 (0.7%) |
| 35 to 64 Years | 71 (4.6%) | 135 (8.5%) |
| 65 to 74 Years | 41 (8.8%) | 11 (2.2%) |
| 75 Years and over | 49 (16.8%) | 38 (10.3%) |
Disability Class: Cognitive Difficulty
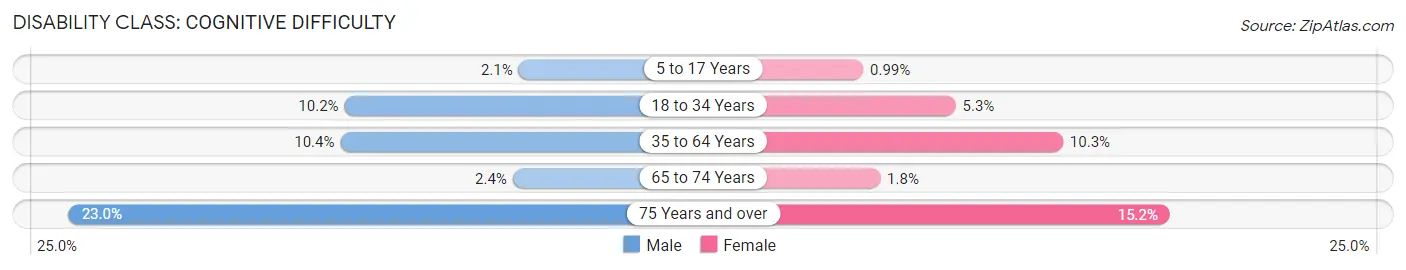
| Age Bracket | Male | Female |
| 5 to 17 Years | 14 (2.1%) | 8 (1.0%) |
| 18 to 34 Years | 74 (10.2%) | 39 (5.3%) |
| 35 to 64 Years | 158 (10.3%) | 164 (10.3%) |
| 65 to 74 Years | 11 (2.4%) | 9 (1.8%) |
| 75 Years and over | 67 (23.0%) | 56 (15.2%) |
Disability Class: Ambulatory Difficulty
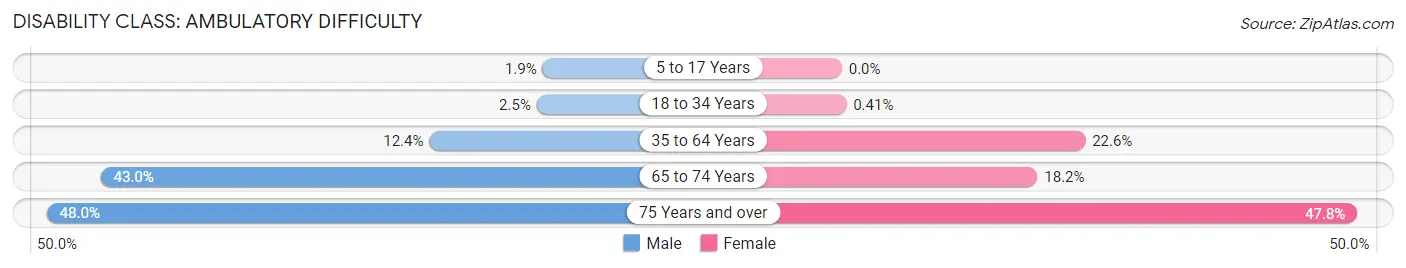
| Age Bracket | Male | Female |
| 5 to 17 Years | 13 (1.9%) | 0 (0.0%) |
| 18 to 34 Years | 18 (2.5%) | 3 (0.4%) |
| 35 to 64 Years | 190 (12.4%) | 361 (22.6%) |
| 65 to 74 Years | 201 (42.9%) | 92 (18.1%) |
| 75 Years and over | 140 (47.9%) | 176 (47.8%) |
Disability Class: Self-Care Difficulty
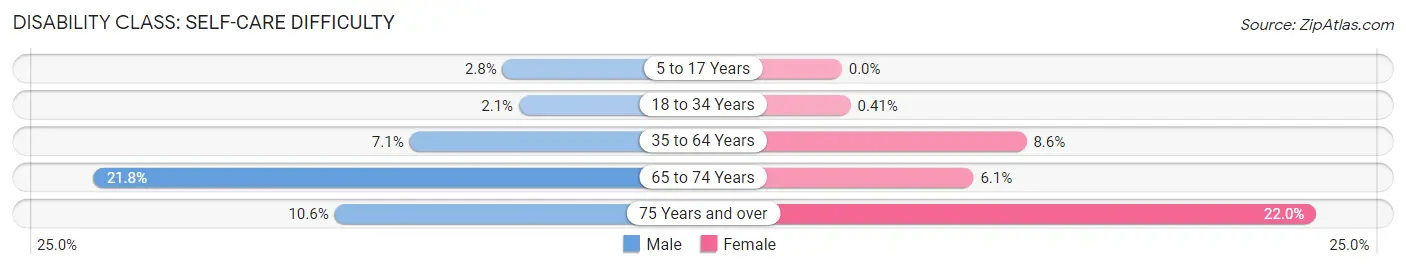
| Age Bracket | Male | Female |
| 5 to 17 Years | 19 (2.8%) | 0 (0.0%) |
| 18 to 34 Years | 15 (2.1%) | 3 (0.4%) |
| 35 to 64 Years | 109 (7.1%) | 137 (8.6%) |
| 65 to 74 Years | 102 (21.8%) | 31 (6.1%) |
| 75 Years and over | 31 (10.6%) | 81 (22.0%) |
Technology Access in Kiowa County
Computing Device Access in Kiowa County
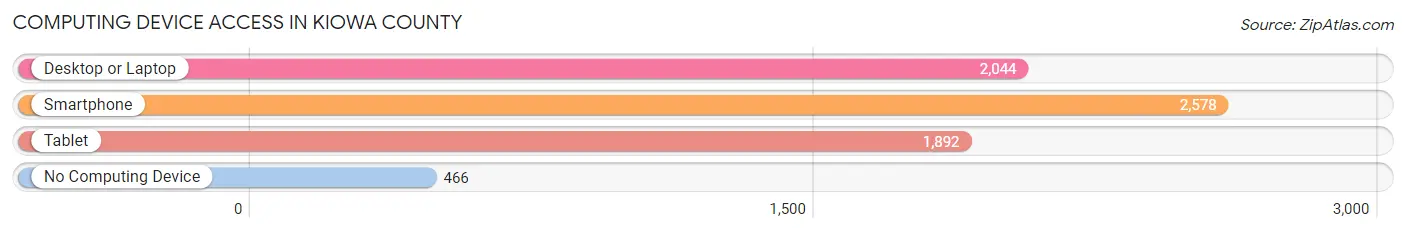
| Device Type | # Households | % Households |
| Desktop or Laptop | 2,044 | 62.1% |
| Smartphone | 2,578 | 78.3% |
| Tablet | 1,892 | 57.4% |
| No Computing Device | 466 | 14.1% |
| Total | 3,294 | 100.0% |
Internet Access in Kiowa County
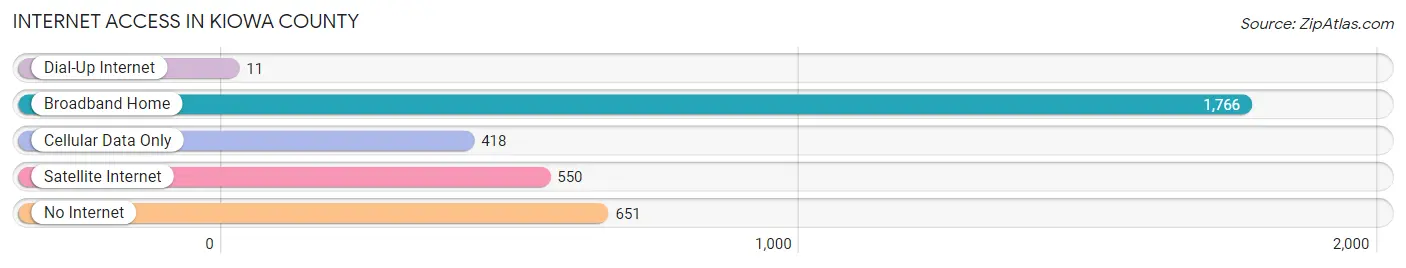
| Internet Type | # Households | % Households |
| Dial-Up Internet | 11 | 0.3% |
| Broadband Home | 1,766 | 53.6% |
| Cellular Data Only | 418 | 12.7% |
| Satellite Internet | 550 | 16.7% |
| No Internet | 651 | 19.8% |
| Total | 3,294 | 100.0% |
Kiowa County Summary
Kiowa County is located in southwestern Oklahoma, and is part of the Lawton-Fort Sill Metropolitan Statistical Area. The county was created in 1901 and named after the Kiowa people, who were the original inhabitants of the area. As of the 2010 census, the population was 9,446, making it the second-least populous county in Oklahoma.
Geography
Kiowa County covers an area of 1,092 square miles, making it the fourth-largest county in Oklahoma. The county is located in the Gypsum Hills region of the state, and is mostly covered by rolling hills and prairies. The Washita River runs through the county, and there are several small lakes and reservoirs in the area. The county is bordered by Caddo County to the north, Comanche County to the east, Tillman County to the south, and Beckham County to the west.
Economy
Kiowa County has a largely agricultural economy, with the majority of the population employed in farming and ranching. The county is home to several large cattle ranches, and the area is known for its production of wheat, sorghum, and hay. Oil and gas production is also an important part of the local economy, and there are several small oil and gas fields in the county.
Demographics
As of the 2010 census, there were 9,446 people living in Kiowa County. The population was spread out with a median age of 38.7 years. The racial makeup of the county was 87.2% White, 8.2% Native American, 0.7% Black or African American, 0.3% Asian, 0.1% Pacific Islander, and 2.5% from two or more races. The largest ancestry groups in the county were German (25.2%), Irish (13.2%), English (12.2%), and Native American (8.2%).
The median household income in Kiowa County was $37,917, and the median family income was $45,938. The per capita income was $18,945. About 14.2% of the population was below the poverty line.
Conclusion
Kiowa County is a rural county located in southwestern Oklahoma. The county has a largely agricultural economy, and is known for its production of wheat, sorghum, and hay. Oil and gas production is also an important part of the local economy. As of the 2010 census, the population was 9,446, and the median household income was $37,917. The county is home to several large cattle ranches, and is bordered by Caddo County to the north, Comanche County to the east, Tillman County to the south, and Beckham County to the west.
Common Questions
What is Per Capita Income in Kiowa County?
Per Capita income in Kiowa County is $23,548.
What is the Median Family Income in Kiowa County?
Median Family Income in Kiowa County is $59,394.
What is the Median Household income in Kiowa County?
Median Household Income in Kiowa County is $42,679.
What is Income or Wage Gap in Kiowa County?
Income or Wage Gap in Kiowa County is 14.8%.
Women in Kiowa County earn 85.2 cents for every dollar earned by a man.
What is Family Income Deficit in Kiowa County?
Family Income Deficit in Kiowa County is $13,448.
Families that are below poverty line in Kiowa County earn $13,448 less on average than the poverty threshold level.
What is Inequality or Gini Index in Kiowa County?
Inequality or Gini Index in Kiowa County is 0.44.
What is the Total Population of Kiowa County?
Total Population of Kiowa County is 8,446.
What is the Total Male Population of Kiowa County?
Total Male Population of Kiowa County is 4,035.
What is the Total Female Population of Kiowa County?
Total Female Population of Kiowa County is 4,411.
What is the Ratio of Males per 100 Females in Kiowa County?
There are 91.48 Males per 100 Females in Kiowa County.
What is the Ratio of Females per 100 Males in Kiowa County?
There are 109.32 Females per 100 Males in Kiowa County.
What is the Median Population Age in Kiowa County?
Median Population Age in Kiowa County is 41.6 Years.
What is the Average Family Size in Kiowa County
Average Family Size in Kiowa County is 3.0 People.
What is the Average Household Size in Kiowa County
Average Household Size in Kiowa County is 2.5 People.
How Large is the Labor Force in Kiowa County?
There are 3,535 People in the Labor Forcein in Kiowa County.
What is the Percentage of People in the Labor Force in Kiowa County?
53.5% of People are in the Labor Force in Kiowa County.
What is the Unemployment Rate in Kiowa County?
Unemployment Rate in Kiowa County is 4.4%.