Johnston County, OK Map & Demographics
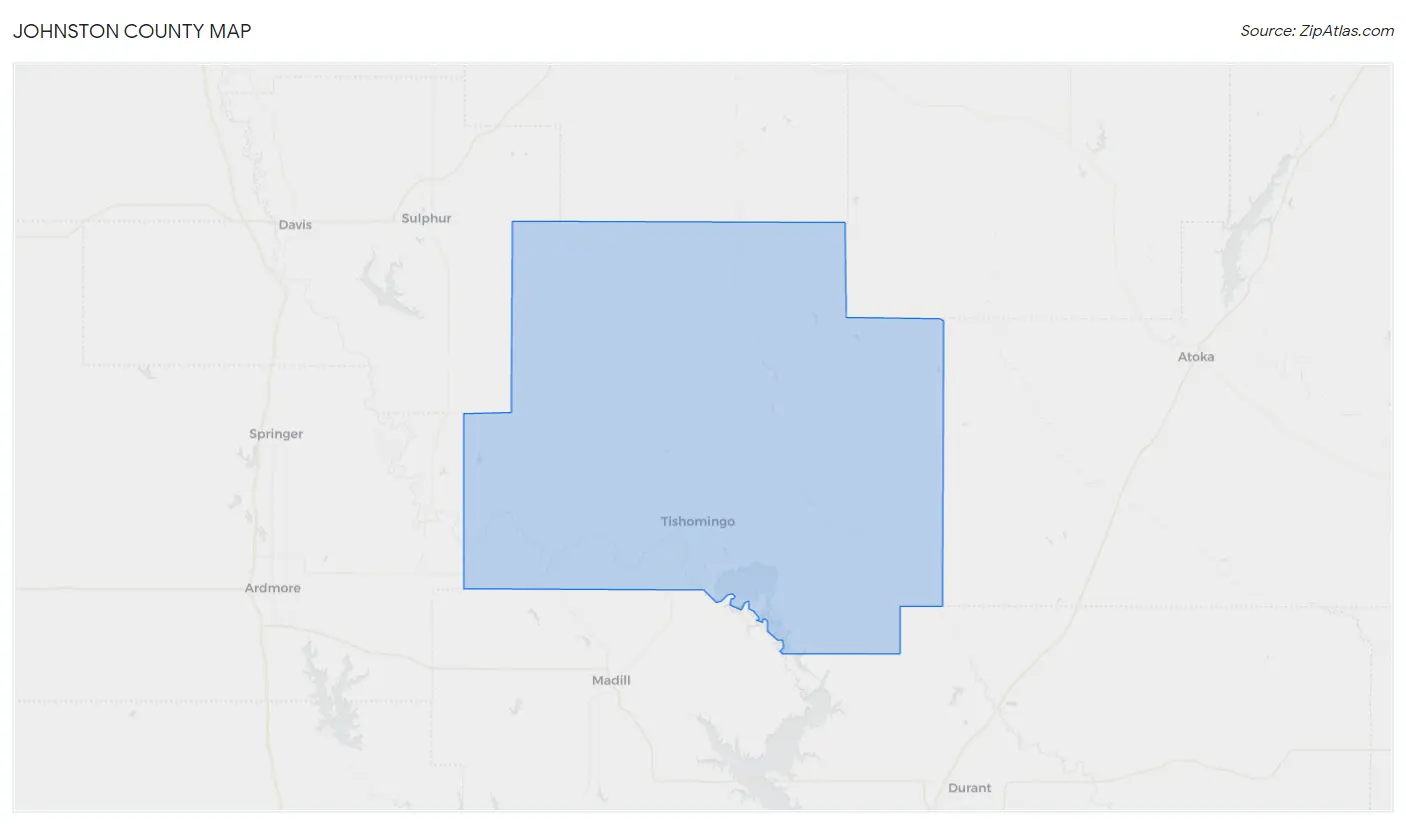
Johnston County Map
Johnston County Overview
$24,457
PER CAPITA INCOME
$56,875
AVG FAMILY INCOME
$48,476
AVG HOUSEHOLD INCOME
26.6%
WAGE / INCOME GAP [ % ]
73.4¢/ $1
WAGE / INCOME GAP [ $ ]
$12,358
FAMILY INCOME DEFICIT
0.44
INEQUALITY / GINI INDEX
10,410
TOTAL POPULATION
5,254
MALE POPULATION
5,156
FEMALE POPULATION
101.90
MALES / 100 FEMALES
98.13
FEMALES / 100 MALES
39.5
MEDIAN AGE
3.1
AVG FAMILY SIZE
2.6
AVG HOUSEHOLD SIZE
4,037
LABOR FORCE [ PEOPLE ]
49.1%
PERCENT IN LABOR FORCE
5.5%
UNEMPLOYMENT RATE
Johnston County Area Codes
Income in Johnston County
Income Overview in Johnston County
Per Capita Income in Johnston County is $24,457, while median incomes of families and households are $56,875 and $48,476 respectively.
| Characteristic | Number | Measure |
| Per Capita Income | 10,410 | $24,457 |
| Median Family Income | 2,657 | $56,875 |
| Mean Family Income | 2,657 | $68,779 |
| Median Household Income | 3,889 | $48,476 |
| Mean Household Income | 3,889 | $61,719 |
| Income Deficit | 2,657 | $12,358 |
| Wage / Income Gap (%) | 10,410 | 26.64% |
| Wage / Income Gap ($) | 10,410 | 73.36¢ per $1 |
| Gini / Inequality Index | 10,410 | 0.44 |
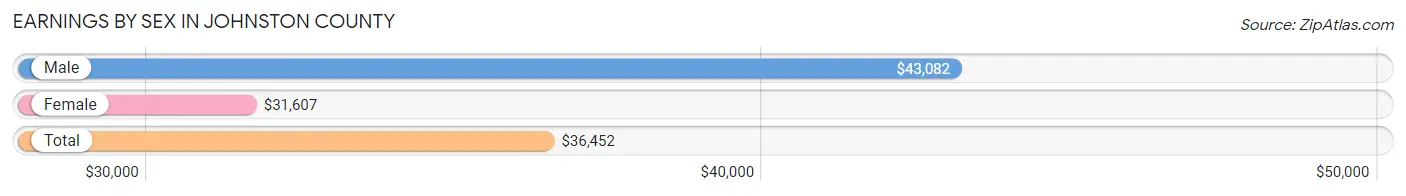
Earnings by Sex in Johnston County
Average Earnings in Johnston County are $36,452, $43,082 for men and $31,607 for women, a difference of 26.6%.
| Sex | Number | Average Earnings |
| Male | 2,365 (56.1%) | $43,082 |
| Female | 1,851 (43.9%) | $31,607 |
| Total | 4,216 (100.0%) | $36,452 |
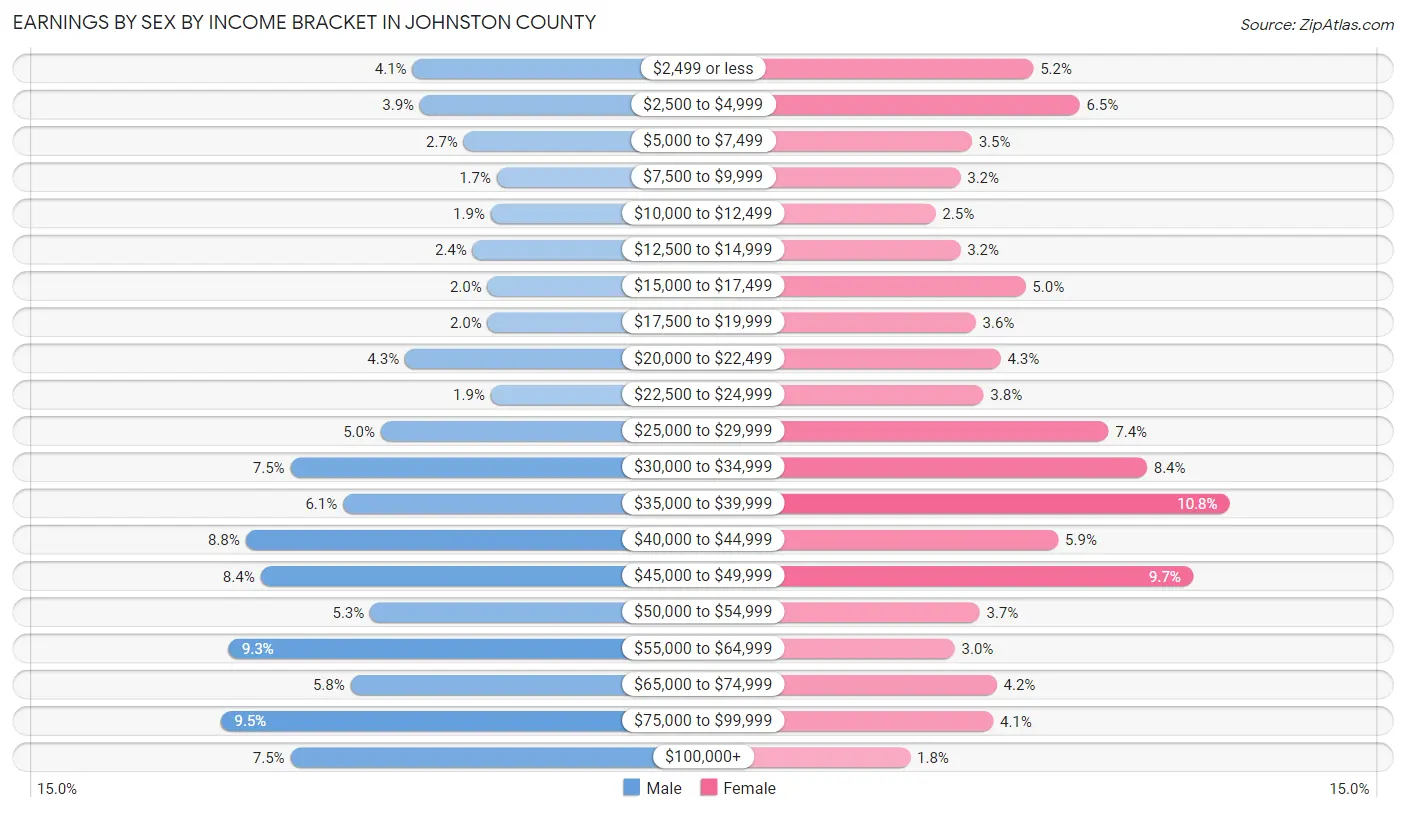
Earnings by Sex by Income Bracket in Johnston County
The most common earnings brackets in Johnston County are $75,000 to $99,999 for men (224 | 9.5%) and $35,000 to $39,999 for women (199 | 10.7%).
| Income | Male | Female |
| $2,499 or less | 97 (4.1%) | 97 (5.2%) |
| $2,500 to $4,999 | 92 (3.9%) | 121 (6.5%) |
| $5,000 to $7,499 | 63 (2.7%) | 65 (3.5%) |
| $7,500 to $9,999 | 41 (1.7%) | 59 (3.2%) |
| $10,000 to $12,499 | 45 (1.9%) | 46 (2.5%) |
| $12,500 to $14,999 | 57 (2.4%) | 59 (3.2%) |
| $15,000 to $17,499 | 47 (2.0%) | 93 (5.0%) |
| $17,500 to $19,999 | 47 (2.0%) | 67 (3.6%) |
| $20,000 to $22,499 | 102 (4.3%) | 80 (4.3%) |
| $22,500 to $24,999 | 45 (1.9%) | 71 (3.8%) |
| $25,000 to $29,999 | 118 (5.0%) | 136 (7.3%) |
| $30,000 to $34,999 | 178 (7.5%) | 156 (8.4%) |
| $35,000 to $39,999 | 143 (6.0%) | 199 (10.7%) |
| $40,000 to $44,999 | 208 (8.8%) | 110 (5.9%) |
| $45,000 to $49,999 | 198 (8.4%) | 180 (9.7%) |
| $50,000 to $54,999 | 125 (5.3%) | 69 (3.7%) |
| $55,000 to $64,999 | 219 (9.3%) | 56 (3.0%) |
| $65,000 to $74,999 | 138 (5.8%) | 78 (4.2%) |
| $75,000 to $99,999 | 224 (9.5%) | 76 (4.1%) |
| $100,000+ | 178 (7.5%) | 33 (1.8%) |
| Total | 2,365 (100.0%) | 1,851 (100.0%) |
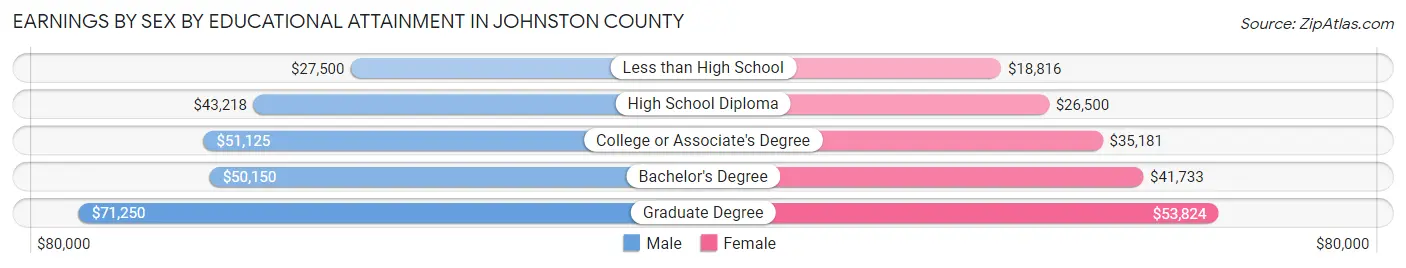
Earnings by Sex by Educational Attainment in Johnston County
Average earnings in Johnston County are $44,819 for men and $35,065 for women, a difference of 21.8%. Men with an educational attainment of graduate degree enjoy the highest average annual earnings of $71,250, while those with less than high school education earn the least with $27,500. Women with an educational attainment of graduate degree earn the most with the average annual earnings of $53,824, while those with less than high school education have the smallest earnings of $18,816.
| Educational Attainment | Male Income | Female Income |
| Less than High School | $27,500 | $18,816 |
| High School Diploma | $43,218 | $26,500 |
| College or Associate's Degree | $51,125 | $35,181 |
| Bachelor's Degree | $50,150 | $41,733 |
| Graduate Degree | $71,250 | $53,824 |
| Total | $44,819 | $35,065 |
Family Income in Johnston County
Family Income Brackets in Johnston County
According to the Johnston County family income data, there are 518 families falling into the $50,000 to $74,999 income range, which is the most common income bracket and makes up 19.5% of all families. Conversely, the $200,000+ income bracket is the least frequent group with only 69 families (2.6%) belonging to this category.
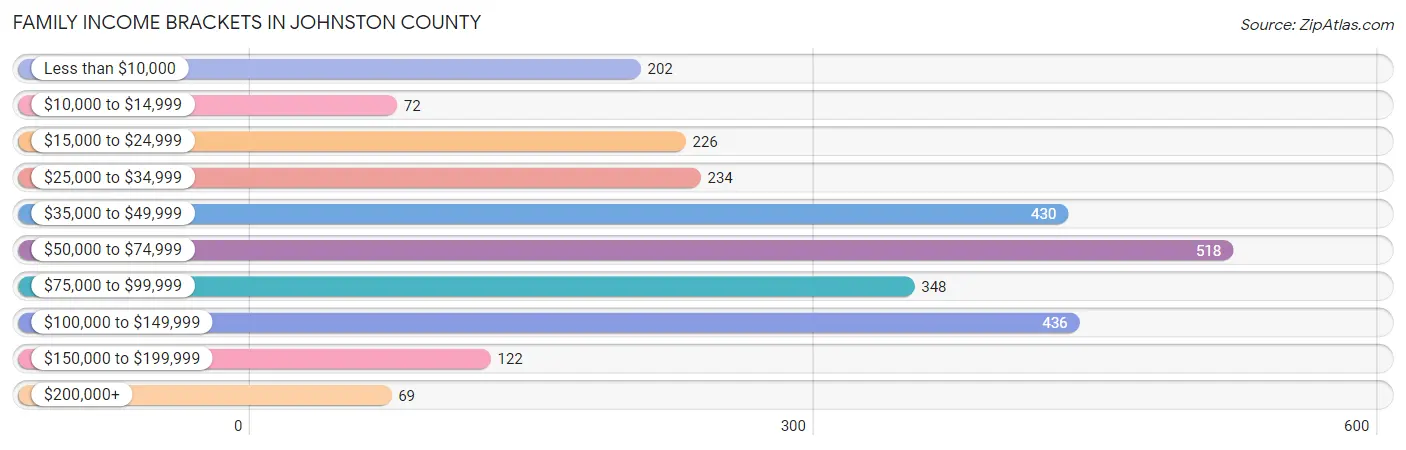
| Income Bracket | # Families | % Families |
| Less than $10,000 | 202 | 7.6% |
| $10,000 to $14,999 | 72 | 2.7% |
| $15,000 to $24,999 | 226 | 8.5% |
| $25,000 to $34,999 | 234 | 8.8% |
| $35,000 to $49,999 | 430 | 16.2% |
| $50,000 to $74,999 | 518 | 19.5% |
| $75,000 to $99,999 | 348 | 13.1% |
| $100,000 to $149,999 | 436 | 16.4% |
| $150,000 to $199,999 | 122 | 4.6% |
| $200,000+ | 69 | 2.6% |
Family Income by Famaliy Size in Johnston County
5-person families (192 | 7.2%) account for the highest median family income in Johnston County with $92,222 per family, while 2-person families (1,306 | 49.1%) have the highest median income of $24,881 per family member.
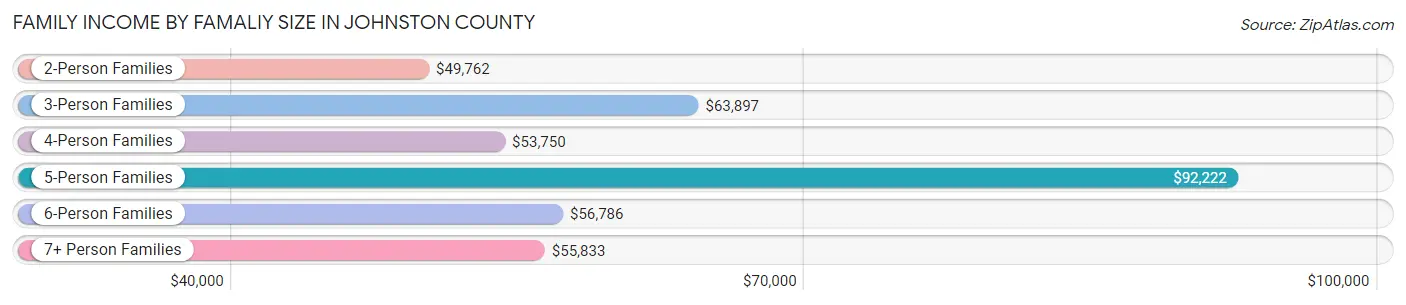
| Income Bracket | # Families | Median Income |
| 2-Person Families | 1,306 (49.1%) | $49,762 |
| 3-Person Families | 605 (22.8%) | $63,897 |
| 4-Person Families | 382 (14.4%) | $53,750 |
| 5-Person Families | 192 (7.2%) | $92,222 |
| 6-Person Families | 128 (4.8%) | $56,786 |
| 7+ Person Families | 44 (1.7%) | $55,833 |
| Total | 2,657 (100.0%) | $56,875 |
Family Income by Number of Earners in Johnston County
The median family income in Johnston County is $56,875, with families comprising 3+ earners (162) having the highest median family income of $116,250, while families with no earners (638) have the lowest median family income of $25,000, accounting for 6.1% and 24.0% of families, respectively.
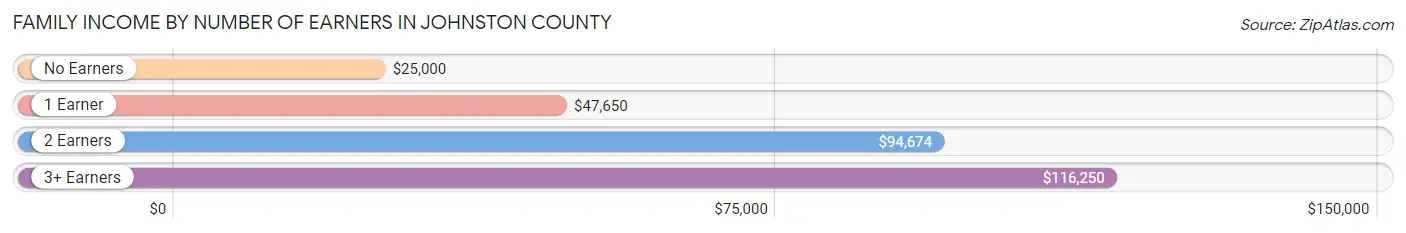
| Number of Earners | # Families | Median Income |
| No Earners | 638 (24.0%) | $25,000 |
| 1 Earner | 1,029 (38.7%) | $47,650 |
| 2 Earners | 828 (31.2%) | $94,674 |
| 3+ Earners | 162 (6.1%) | $116,250 |
| Total | 2,657 (100.0%) | $56,875 |
Household Income in Johnston County
Household Income Brackets in Johnston County
With 719 households falling in the category, the $50,000 to $74,999 income range is the most frequent in Johnston County, accounting for 18.5% of all households. In contrast, only 78 households (2.0%) fall into the $200,000+ income bracket, making it the least populous group.
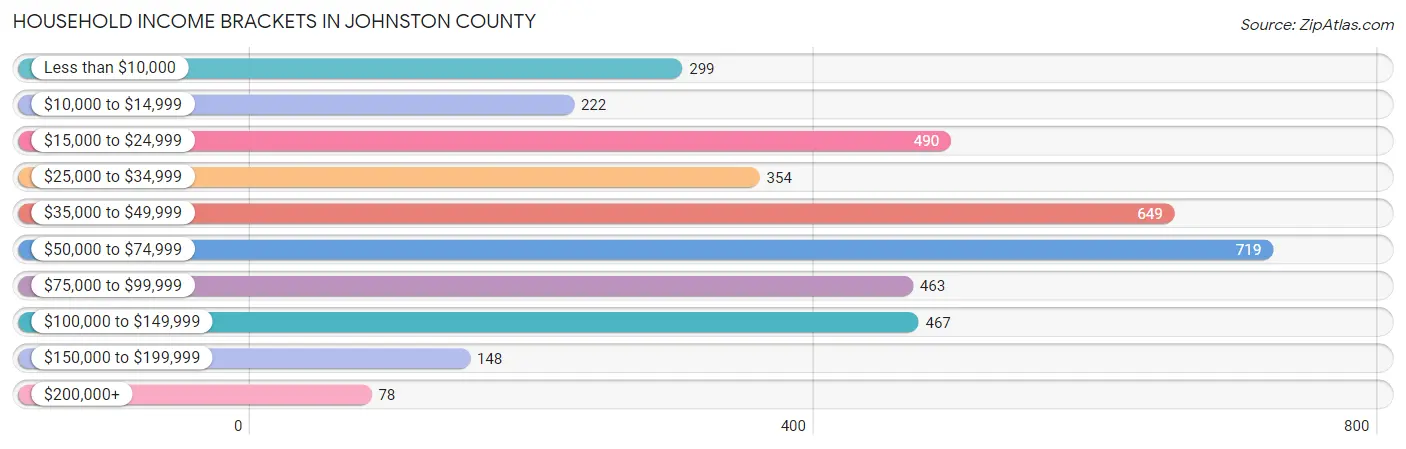
| Income Bracket | # Households | % Households |
| Less than $10,000 | 299 | 7.7% |
| $10,000 to $14,999 | 222 | 5.7% |
| $15,000 to $24,999 | 490 | 12.6% |
| $25,000 to $34,999 | 354 | 9.1% |
| $35,000 to $49,999 | 649 | 16.7% |
| $50,000 to $74,999 | 719 | 18.5% |
| $75,000 to $99,999 | 463 | 11.9% |
| $100,000 to $149,999 | 467 | 12.0% |
| $150,000 to $199,999 | 148 | 3.8% |
| $200,000+ | 78 | 2.0% |
Household Income by Householder Age in Johnston County
The median household income in Johnston County is $48,476, with the highest median household income of $62,679 found in the 25 to 44 years age bracket for the primary householder. A total of 1,044 households (26.8%) fall into this category. Meanwhile, the 65+ years age bracket for the primary householder has the lowest median household income of $42,031, with 1,311 households (33.7%) in this group.
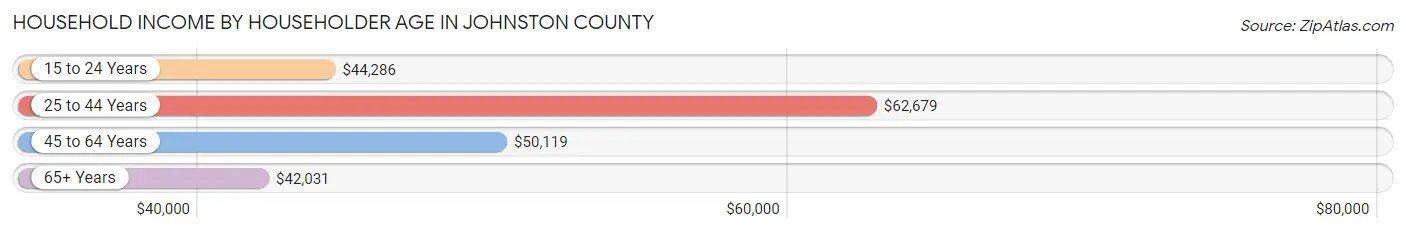
| Income Bracket | # Households | Median Income |
| 15 to 24 Years | 92 (2.4%) | $44,286 |
| 25 to 44 Years | 1,044 (26.8%) | $62,679 |
| 45 to 64 Years | 1,442 (37.1%) | $50,119 |
| 65+ Years | 1,311 (33.7%) | $42,031 |
| Total | 3,889 (100.0%) | $48,476 |
Poverty in Johnston County
Income Below Poverty by Sex and Age in Johnston County
With 20.5% poverty level for males and 25.3% for females among the residents of Johnston County, 5 year old males and 6 to 11 year old females are the most vulnerable to poverty, with 32 males (53.3%) and 191 females (46.0%) in their respective age groups living below the poverty level.
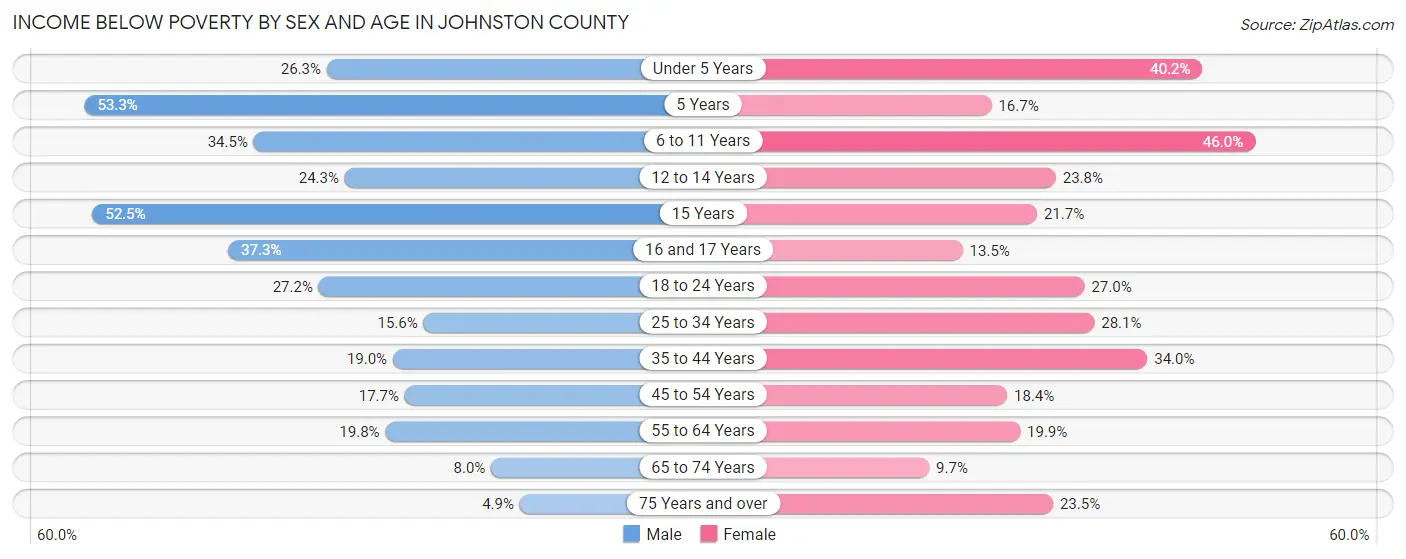
| Age Bracket | Male | Female |
| Under 5 Years | 69 (26.3%) | 104 (40.2%) |
| 5 Years | 32 (53.3%) | 8 (16.7%) |
| 6 to 11 Years | 150 (34.5%) | 191 (46.0%) |
| 12 to 14 Years | 55 (24.3%) | 51 (23.8%) |
| 15 Years | 32 (52.5%) | 20 (21.7%) |
| 16 and 17 Years | 56 (37.3%) | 14 (13.5%) |
| 18 to 24 Years | 140 (27.2%) | 93 (27.0%) |
| 25 to 34 Years | 90 (15.6%) | 160 (28.1%) |
| 35 to 44 Years | 108 (19.0%) | 197 (34.0%) |
| 45 to 54 Years | 113 (17.7%) | 102 (18.4%) |
| 55 to 64 Years | 132 (19.8%) | 137 (19.9%) |
| 65 to 74 Years | 43 (8.0%) | 57 (9.7%) |
| 75 Years and over | 18 (4.9%) | 103 (23.5%) |
| Total | 1,038 (20.5%) | 1,237 (25.3%) |
Income Above Poverty by Sex and Age in Johnston County
According to the poverty statistics in Johnston County, males aged 75 years and over and females aged 65 to 74 years are the age groups that are most secure financially, with 95.2% of males and 90.3% of females in these age groups living above the poverty line.
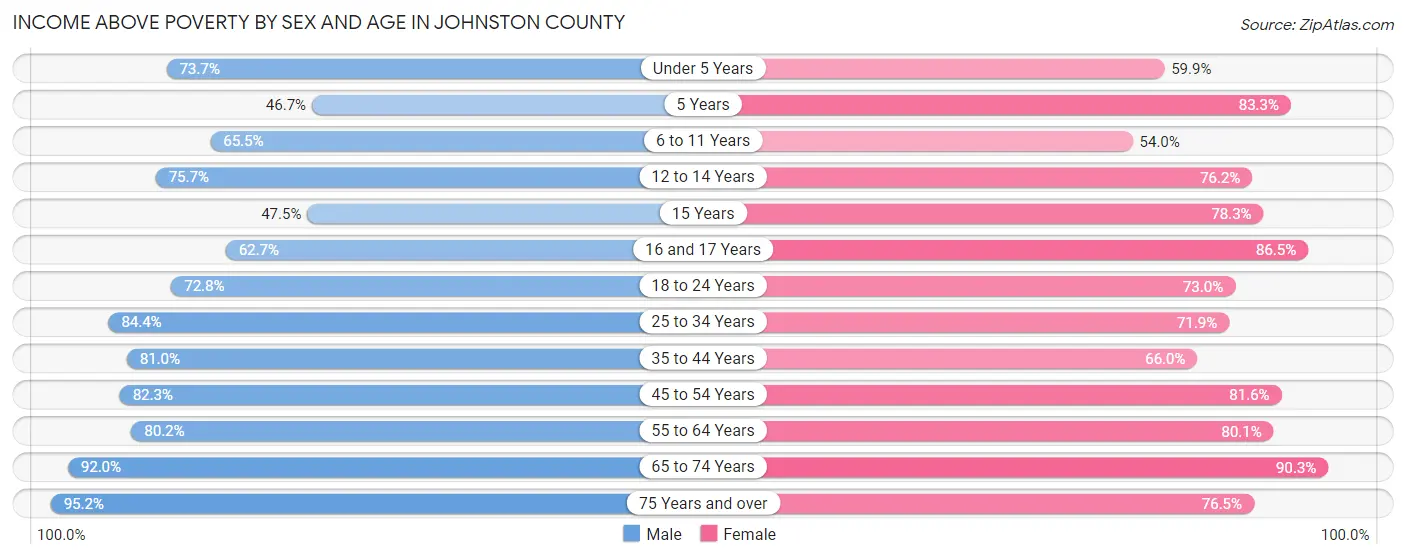
| Age Bracket | Male | Female |
| Under 5 Years | 193 (73.7%) | 155 (59.9%) |
| 5 Years | 28 (46.7%) | 40 (83.3%) |
| 6 to 11 Years | 285 (65.5%) | 224 (54.0%) |
| 12 to 14 Years | 171 (75.7%) | 163 (76.2%) |
| 15 Years | 29 (47.5%) | 72 (78.3%) |
| 16 and 17 Years | 94 (62.7%) | 90 (86.5%) |
| 18 to 24 Years | 374 (72.8%) | 251 (73.0%) |
| 25 to 34 Years | 488 (84.4%) | 409 (71.9%) |
| 35 to 44 Years | 461 (81.0%) | 382 (66.0%) |
| 45 to 54 Years | 527 (82.3%) | 452 (81.6%) |
| 55 to 64 Years | 534 (80.2%) | 553 (80.1%) |
| 65 to 74 Years | 492 (92.0%) | 529 (90.3%) |
| 75 Years and over | 353 (95.2%) | 335 (76.5%) |
| Total | 4,029 (79.5%) | 3,655 (74.7%) |
Income Below Poverty Among Married-Couple Families in Johnston County
The poverty statistics for married-couple families in Johnston County show that 8.3% or 146 of the total 1,758 families live below the poverty line. Families with 3 or 4 children have the highest poverty rate of 29.0%, comprising of 42 families. On the other hand, families with no children have the lowest poverty rate of 5.3%, which includes 58 families.
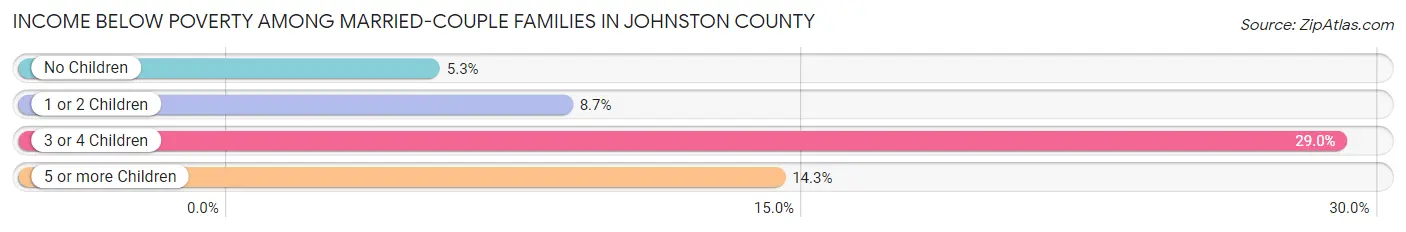
| Children | Above Poverty | Below Poverty |
| No Children | 1,042 (94.7%) | 58 (5.3%) |
| 1 or 2 Children | 449 (91.3%) | 43 (8.7%) |
| 3 or 4 Children | 103 (71.0%) | 42 (29.0%) |
| 5 or more Children | 18 (85.7%) | 3 (14.3%) |
| Total | 1,612 (91.7%) | 146 (8.3%) |
Income Below Poverty Among Single-Parent Households in Johnston County
According to the poverty data in Johnston County, 25.0% or 78 single-father households and 41.6% or 244 single-mother households are living below the poverty line. Among single-father households, those with 3 or 4 children have the highest poverty rate, with 13 households (72.2%) experiencing poverty. Likewise, among single-mother households, those with 5 or more children have the highest poverty rate, with 15 households (88.2%) falling below the poverty line.
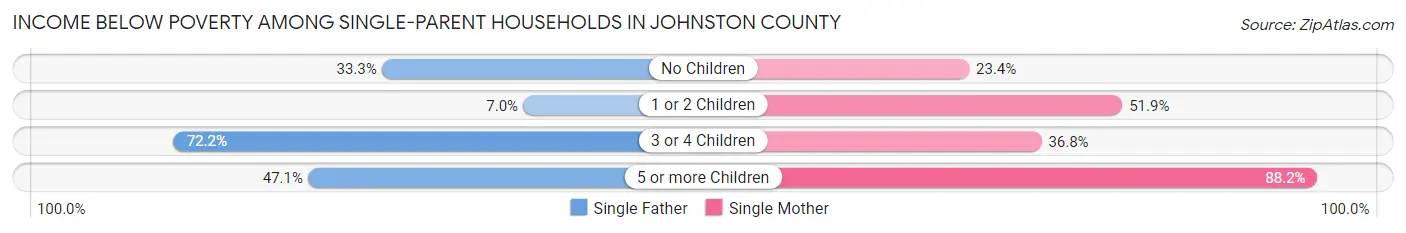
| Children | Single Father | Single Mother |
| No Children | 39 (33.3%) | 43 (23.4%) |
| 1 or 2 Children | 10 (7.0%) | 151 (51.9%) |
| 3 or 4 Children | 13 (72.2%) | 35 (36.8%) |
| 5 or more Children | 16 (47.1%) | 15 (88.2%) |
| Total | 78 (25.0%) | 244 (41.6%) |
Income Below Poverty Among Married-Couple vs Single-Parent Households in Johnston County
The poverty data for Johnston County shows that 146 of the married-couple family households (8.3%) and 322 of the single-parent households (35.8%) are living below the poverty level. Within the married-couple family households, those with 3 or 4 children have the highest poverty rate, with 42 households (29.0%) falling below the poverty line. Among the single-parent households, those with 5 or more children have the highest poverty rate, with 31 household (60.8%) living below poverty.
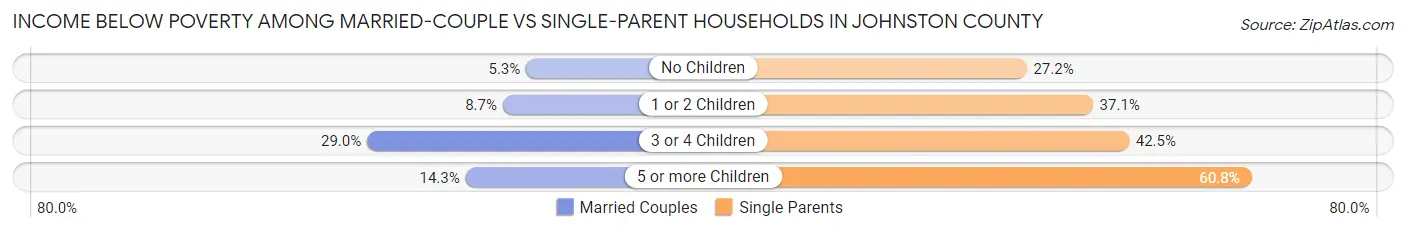
| Children | Married-Couple Families | Single-Parent Households |
| No Children | 58 (5.3%) | 82 (27.2%) |
| 1 or 2 Children | 43 (8.7%) | 161 (37.1%) |
| 3 or 4 Children | 42 (29.0%) | 48 (42.5%) |
| 5 or more Children | 3 (14.3%) | 31 (60.8%) |
| Total | 146 (8.3%) | 322 (35.8%) |
Race in Johnston County
The most populous races in Johnston County are White / Caucasian (7,160 | 68.8%), Two or more Races (1,725 | 16.6%), and Native / Alaskan (1,023 | 9.8%).
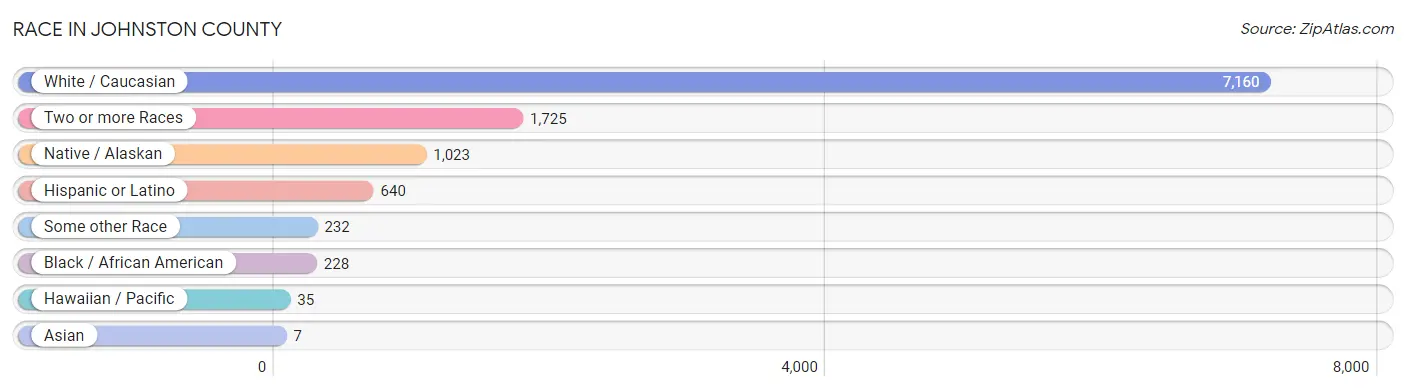
| Race | # Population | % Population |
| Asian | 7 | 0.1% |
| Black / African American | 228 | 2.2% |
| Hawaiian / Pacific | 35 | 0.3% |
| Hispanic or Latino | 640 | 6.1% |
| Native / Alaskan | 1,023 | 9.8% |
| White / Caucasian | 7,160 | 68.8% |
| Two or more Races | 1,725 | 16.6% |
| Some other Race | 232 | 2.2% |
| Total | 10,410 | 100.0% |
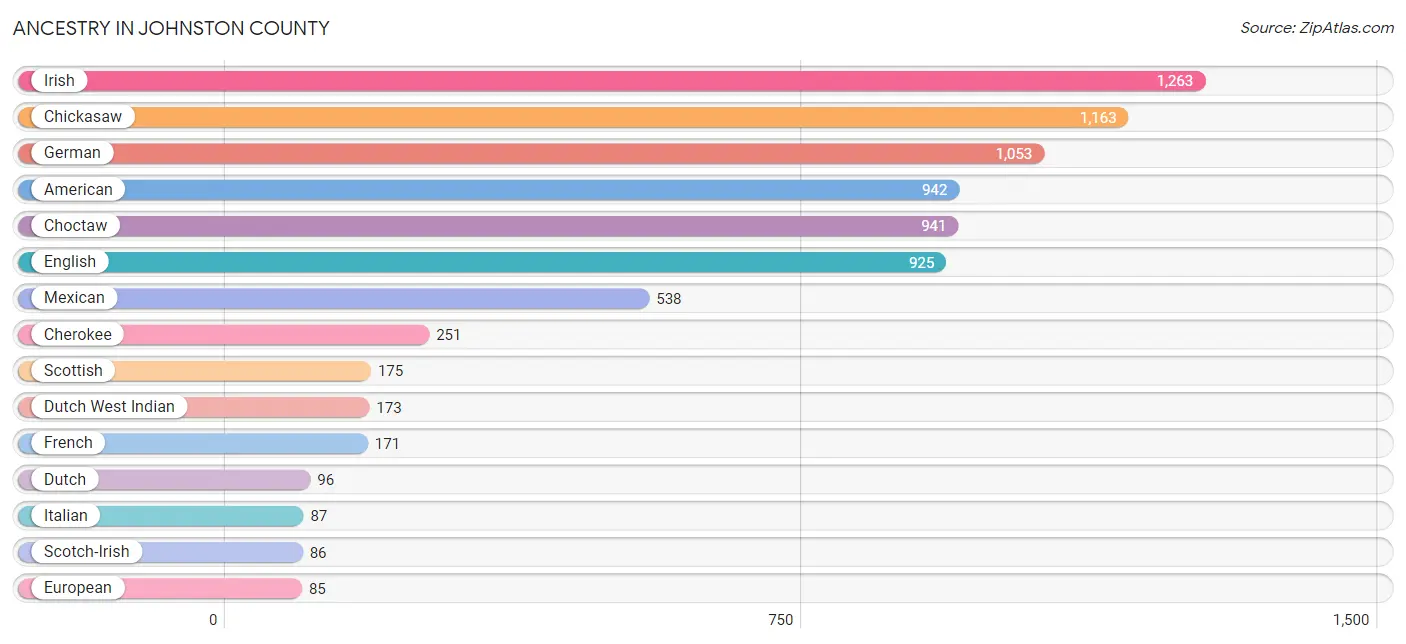
Ancestry in Johnston County
The most populous ancestries reported in Johnston County are Irish (1,263 | 12.1%), Chickasaw (1,163 | 11.2%), German (1,053 | 10.1%), American (942 | 9.0%), and Choctaw (941 | 9.0%), together accounting for 51.5% of all Johnston County residents.
| Ancestry | # Population | % Population |
| Alaska Native | 3 | 0.0% |
| American | 942 | 9.0% |
| Apache | 12 | 0.1% |
| Arab | 2 | 0.0% |
| Austrian | 4 | 0.0% |
| Basque | 12 | 0.1% |
| Blackfeet | 2 | 0.0% |
| British | 41 | 0.4% |
| Cajun | 27 | 0.3% |
| Canadian | 2 | 0.0% |
| Central American | 8 | 0.1% |
| Cherokee | 251 | 2.4% |
| Chickasaw | 1,163 | 11.2% |
| Choctaw | 941 | 9.0% |
| Comanche | 30 | 0.3% |
| Creek | 33 | 0.3% |
| Crow | 3 | 0.0% |
| Cuban | 41 | 0.4% |
| Czech | 10 | 0.1% |
| Danish | 3 | 0.0% |
| Delaware | 19 | 0.2% |
| Dutch | 96 | 0.9% |
| Dutch West Indian | 173 | 1.7% |
| Eastern European | 12 | 0.1% |
| Ecuadorian | 2 | 0.0% |
| English | 925 | 8.9% |
| European | 85 | 0.8% |
| Finnish | 5 | 0.1% |
| French | 171 | 1.6% |
| French Canadian | 1 | 0.0% |
| German | 1,053 | 10.1% |
| Indian (Asian) | 2 | 0.0% |
| Irish | 1,263 | 12.1% |
| Italian | 87 | 0.8% |
| Korean | 4 | 0.0% |
| Mexican | 538 | 5.2% |
| Mexican American Indian | 3 | 0.0% |
| Mongolian | 2 | 0.0% |
| Native Hawaiian | 43 | 0.4% |
| Northern European | 32 | 0.3% |
| Norwegian | 82 | 0.8% |
| Polish | 38 | 0.4% |
| Portuguese | 3 | 0.0% |
| Potawatomi | 8 | 0.1% |
| Russian | 7 | 0.1% |
| Salvadoran | 8 | 0.1% |
| Scandinavian | 8 | 0.1% |
| Scotch-Irish | 86 | 0.8% |
| Scottish | 175 | 1.7% |
| Seminole | 42 | 0.4% |
| Sioux | 9 | 0.1% |
| Slavic | 4 | 0.0% |
| South African | 2 | 0.0% |
| South American | 13 | 0.1% |
| Spaniard | 30 | 0.3% |
| Spanish | 9 | 0.1% |
| Sri Lankan | 5 | 0.1% |
| Subsaharan African | 10 | 0.1% |
| Swedish | 50 | 0.5% |
| Swiss | 30 | 0.3% |
| Venezuelan | 11 | 0.1% |
| Welsh | 35 | 0.3% |
| Yugoslavian | 2 | 0.0% | View All 63 Rows |
Immigrants in Johnston County
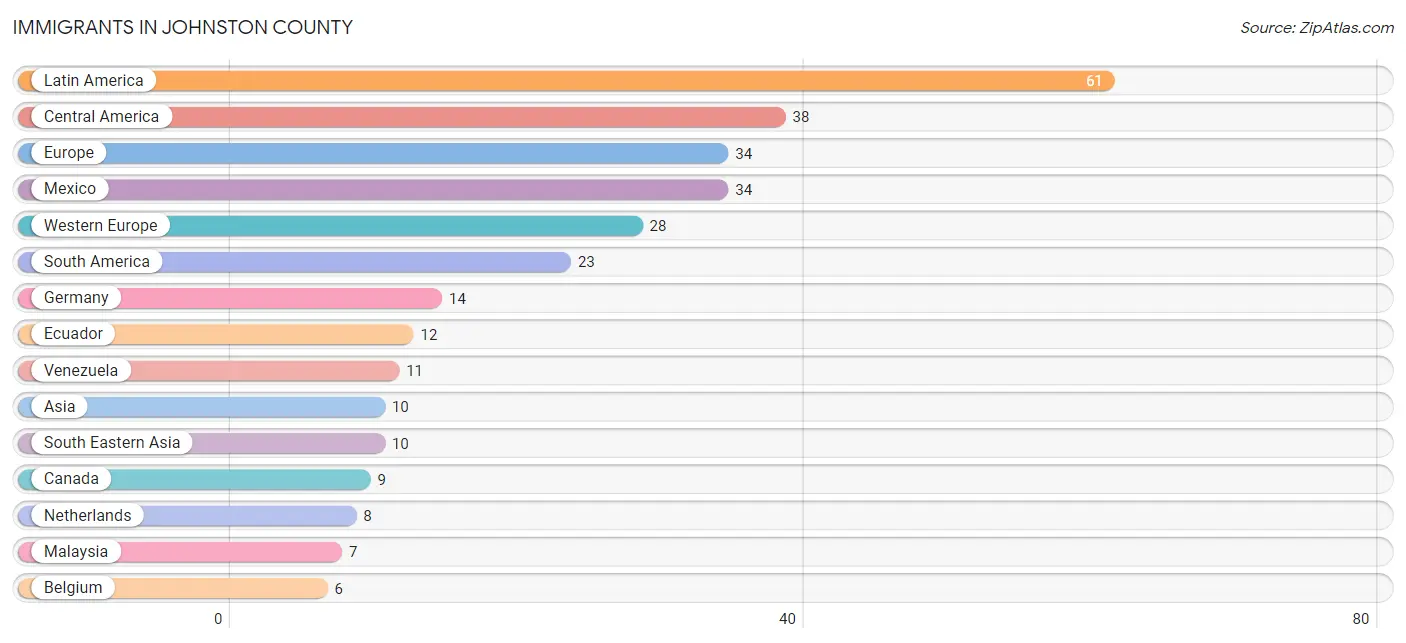
The most numerous immigrant groups reported in Johnston County came from Latin America (61 | 0.6%), Central America (38 | 0.4%), Europe (34 | 0.3%), Mexico (34 | 0.3%), and Western Europe (28 | 0.3%), together accounting for 1.9% of all Johnston County residents.
| Immigration Origin | # Population | % Population |
| Africa | 4 | 0.0% |
| Asia | 10 | 0.1% |
| Belgium | 6 | 0.1% |
| Canada | 9 | 0.1% |
| Central America | 38 | 0.4% |
| Eastern Africa | 2 | 0.0% |
| Ecuador | 12 | 0.1% |
| El Salvador | 4 | 0.0% |
| England | 1 | 0.0% |
| Europe | 34 | 0.3% |
| Germany | 14 | 0.1% |
| Indonesia | 3 | 0.0% |
| Latin America | 61 | 0.6% |
| Malaysia | 7 | 0.1% |
| Mexico | 34 | 0.3% |
| Netherlands | 8 | 0.1% |
| Northern Europe | 6 | 0.1% |
| South Africa | 2 | 0.0% |
| South America | 23 | 0.2% |
| South Eastern Asia | 10 | 0.1% |
| Venezuela | 11 | 0.1% |
| Western Europe | 28 | 0.3% | View All 22 Rows |
Sex and Age in Johnston County
Sex and Age in Johnston County
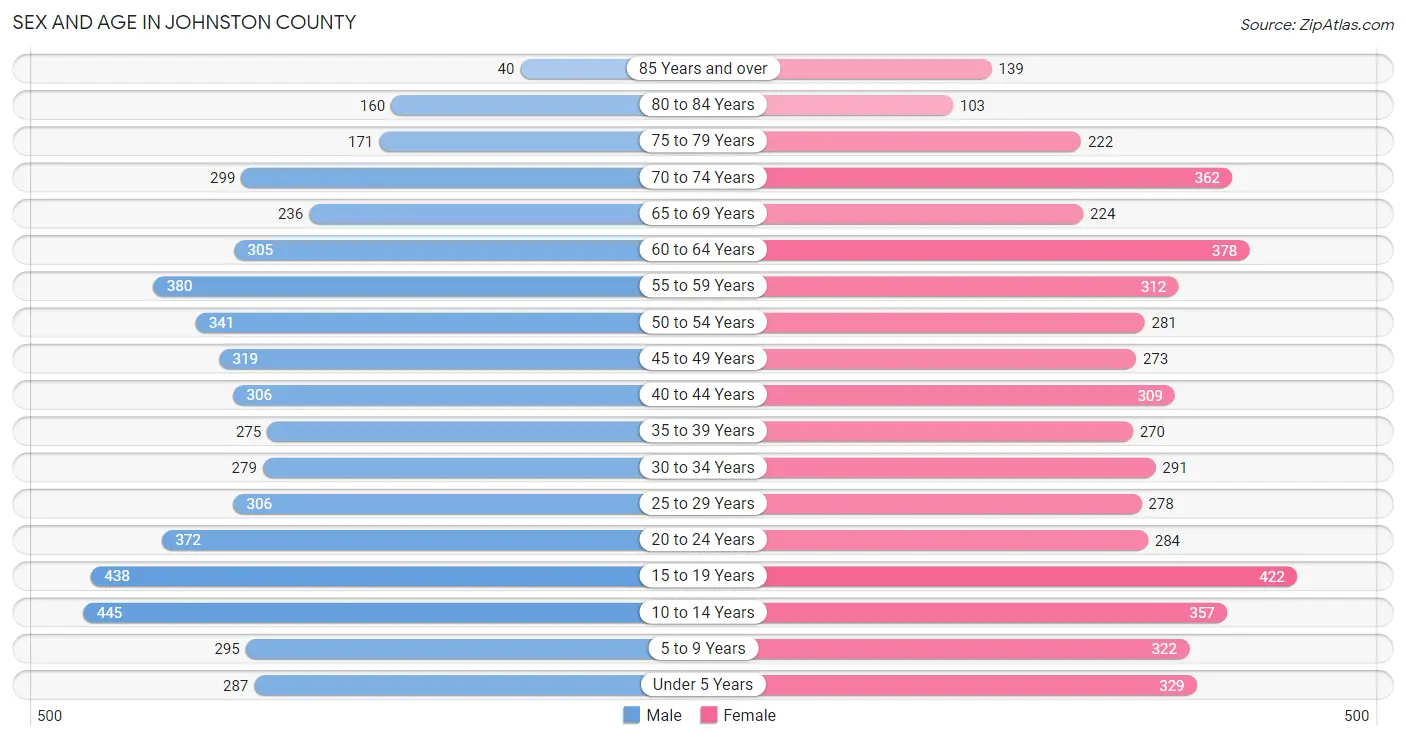
The most populous age groups in Johnston County are 10 to 14 Years (445 | 8.5%) for men and 15 to 19 Years (422 | 8.2%) for women.
| Age Bracket | Male | Female |
| Under 5 Years | 287 (5.5%) | 329 (6.4%) |
| 5 to 9 Years | 295 (5.6%) | 322 (6.2%) |
| 10 to 14 Years | 445 (8.5%) | 357 (6.9%) |
| 15 to 19 Years | 438 (8.3%) | 422 (8.2%) |
| 20 to 24 Years | 372 (7.1%) | 284 (5.5%) |
| 25 to 29 Years | 306 (5.8%) | 278 (5.4%) |
| 30 to 34 Years | 279 (5.3%) | 291 (5.6%) |
| 35 to 39 Years | 275 (5.2%) | 270 (5.2%) |
| 40 to 44 Years | 306 (5.8%) | 309 (6.0%) |
| 45 to 49 Years | 319 (6.1%) | 273 (5.3%) |
| 50 to 54 Years | 341 (6.5%) | 281 (5.4%) |
| 55 to 59 Years | 380 (7.2%) | 312 (6.0%) |
| 60 to 64 Years | 305 (5.8%) | 378 (7.3%) |
| 65 to 69 Years | 236 (4.5%) | 224 (4.3%) |
| 70 to 74 Years | 299 (5.7%) | 362 (7.0%) |
| 75 to 79 Years | 171 (3.3%) | 222 (4.3%) |
| 80 to 84 Years | 160 (3.0%) | 103 (2.0%) |
| 85 Years and over | 40 (0.8%) | 139 (2.7%) |
| Total | 5,254 (100.0%) | 5,156 (100.0%) |
Families and Households in Johnston County
Median Family Size in Johnston County
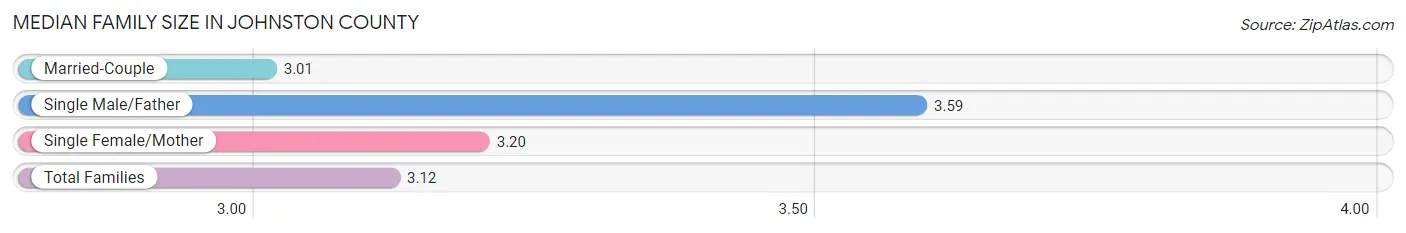
The median family size in Johnston County is 3.12 persons per family, with single male/father families (312 | 11.7%) accounting for the largest median family size of 3.59 persons per family. On the other hand, married-couple families (1,758 | 66.2%) represent the smallest median family size with 3.01 persons per family.
| Family Type | # Families | Family Size |
| Married-Couple | 1,758 (66.2%) | 3.01 |
| Single Male/Father | 312 (11.7%) | 3.59 |
| Single Female/Mother | 587 (22.1%) | 3.20 |
| Total Families | 2,657 (100.0%) | 3.12 |
Median Household Size in Johnston County
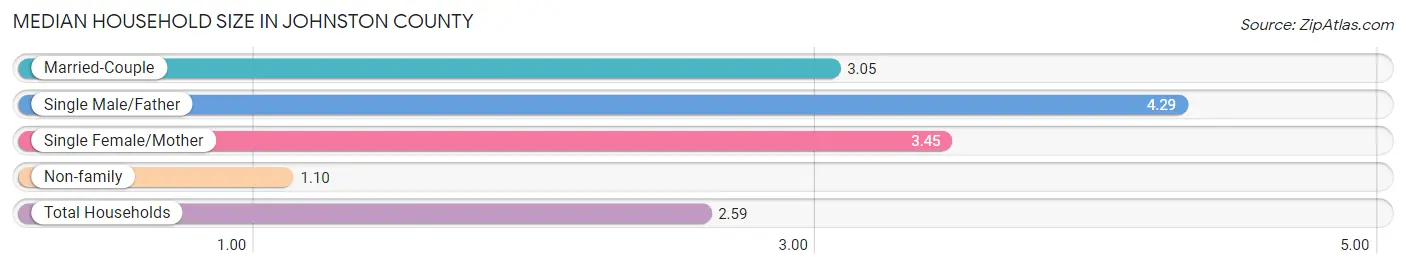
The median household size in Johnston County is 2.59 persons per household, with single male/father households (312 | 8.0%) accounting for the largest median household size of 4.29 persons per household. non-family households (1,232 | 31.7%) represent the smallest median household size with 1.10 persons per household.
| Household Type | # Households | Household Size |
| Married-Couple | 1,758 (45.2%) | 3.05 |
| Single Male/Father | 312 (8.0%) | 4.29 |
| Single Female/Mother | 587 (15.1%) | 3.45 |
| Non-family | 1,232 (31.7%) | 1.10 |
| Total Households | 3,889 (100.0%) | 2.59 |
Household Size by Marriage Status in Johnston County
Out of a total of 3,889 households in Johnston County, 2,657 (68.3%) are family households, while 1,232 (31.7%) are nonfamily households. The most numerous type of family households are 2-person households, comprising 1,241, and the most common type of nonfamily households are 1-person households, comprising 1,126.
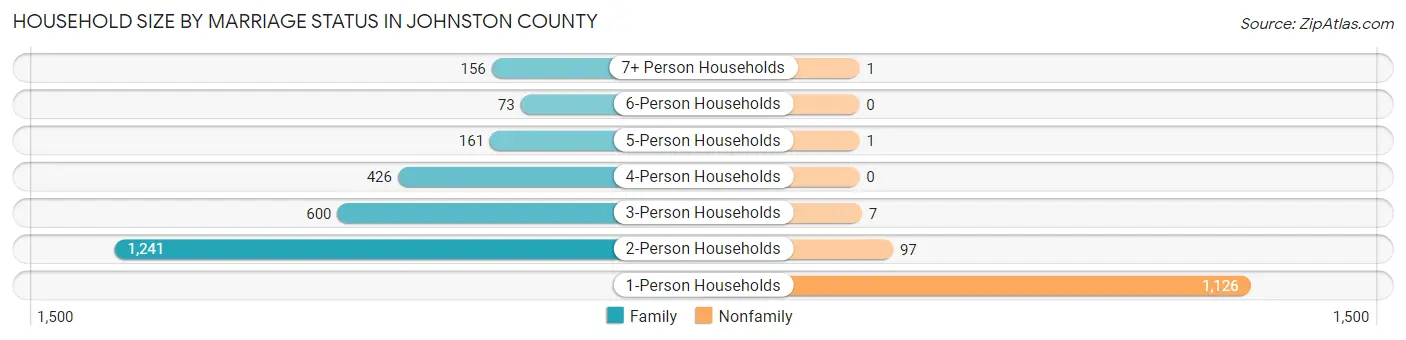
| Household Size | Family Households | Nonfamily Households |
| 1-Person Households | - | 1,126 (28.9%) |
| 2-Person Households | 1,241 (31.9%) | 97 (2.5%) |
| 3-Person Households | 600 (15.4%) | 7 (0.2%) |
| 4-Person Households | 426 (11.0%) | 0 (0.0%) |
| 5-Person Households | 161 (4.1%) | 1 (0.0%) |
| 6-Person Households | 73 (1.9%) | 0 (0.0%) |
| 7+ Person Households | 156 (4.0%) | 1 (0.0%) |
| Total | 2,657 (68.3%) | 1,232 (31.7%) |
Female Fertility in Johnston County
Fertility by Age in Johnston County
Average fertility rate in Johnston County is 34.0 births per 1,000 women. Women in the age bracket of 20 to 34 years have the highest fertility rate with 66.0 births per 1,000 women. Women in the age bracket of 20 to 34 years acount for 75.7% of all women with births.
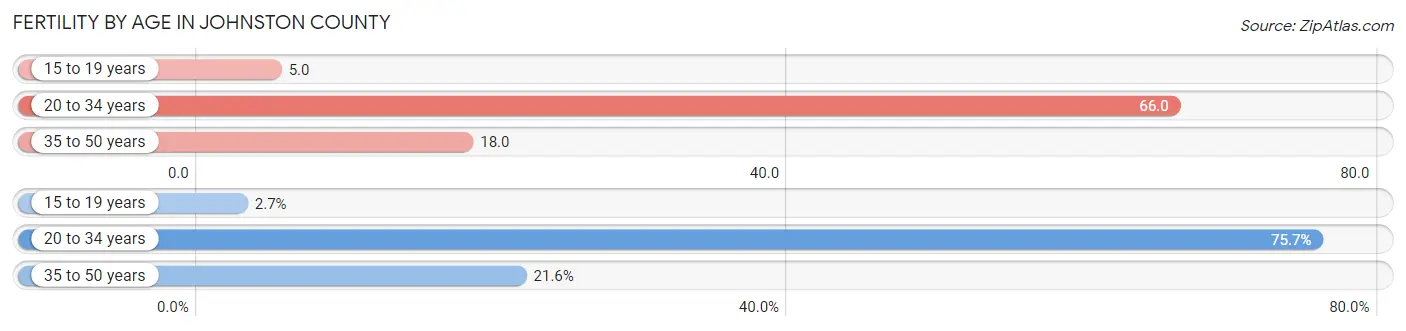
| Age Bracket | Women with Births | Births / 1,000 Women |
| 15 to 19 years | 2 (2.7%) | 5.0 |
| 20 to 34 years | 56 (75.7%) | 66.0 |
| 35 to 50 years | 16 (21.6%) | 18.0 |
| Total | 74 (100.0%) | 34.0 |
Fertility by Age by Marriage Status in Johnston County
51.4% of women with births (74) in Johnston County are married. The highest percentage of unmarried women with births falls into 15 to 19 years age bracket with 100.0% of them unmarried at the time of birth, while the lowest percentage of unmarried women with births belong to 35 to 50 years age bracket with 12.5% of them unmarried.
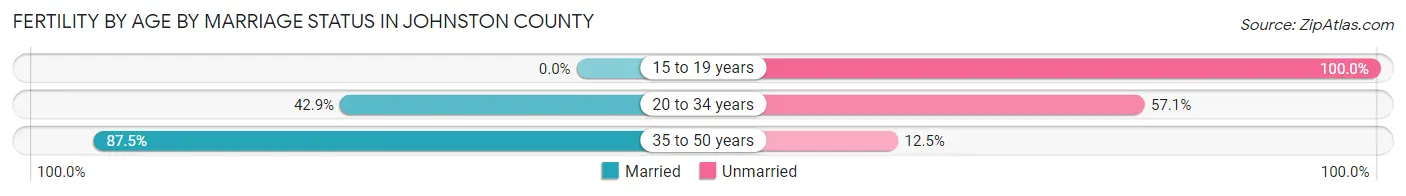
| Age Bracket | Married | Unmarried |
| 15 to 19 years | 0 (0.0%) | 2 (100.0%) |
| 20 to 34 years | 24 (42.9%) | 32 (57.1%) |
| 35 to 50 years | 14 (87.5%) | 2 (12.5%) |
| Total | 38 (51.3%) | 36 (48.6%) |
Fertility by Education in Johnston County
Average fertility rate in Johnston County is 34.0 births per 1,000 women. Women with the education attainment of graduate degree have the highest fertility rate of 78.0 births per 1,000 women, while women with the education attainment of less than high school have the lowest fertility at 7.0 births per 1,000 women. Women with the education attainment of high school diploma represent 41.9% of all women with births.
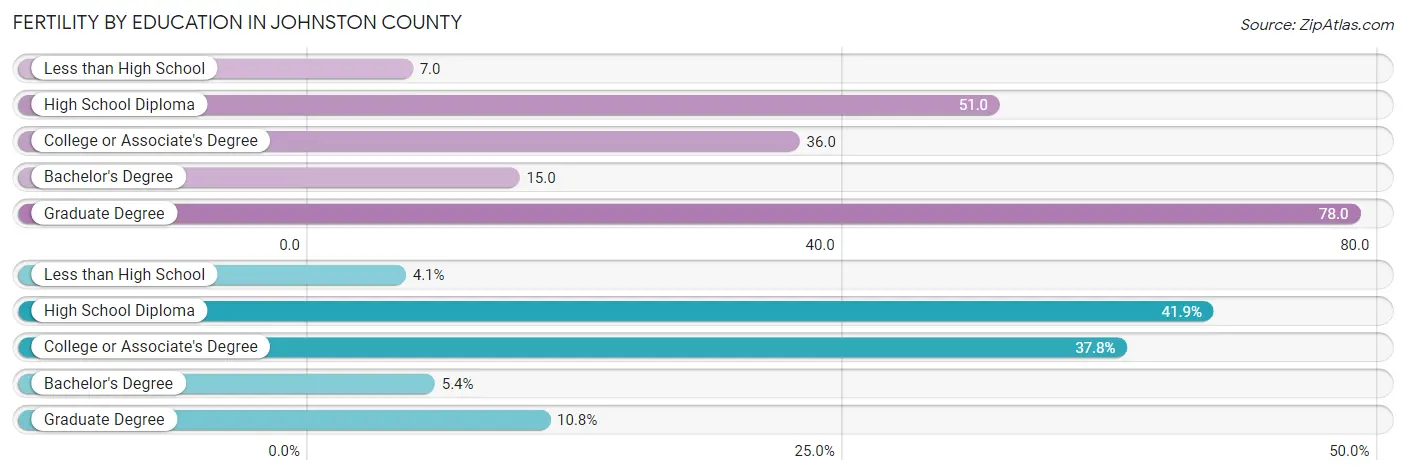
| Educational Attainment | Women with Births | Births / 1,000 Women |
| Less than High School | 3 (4.1%) | 7.0 |
| High School Diploma | 31 (41.9%) | 51.0 |
| College or Associate's Degree | 28 (37.8%) | 36.0 |
| Bachelor's Degree | 4 (5.4%) | 15.0 |
| Graduate Degree | 8 (10.8%) | 78.0 |
| Total | 74 (100.0%) | 34.0 |
Fertility by Education by Marriage Status in Johnston County
48.6% of women with births in Johnston County are unmarried. Women with the educational attainment of bachelor's degree are most likely to be married with 100.0% of them married at childbirth, while women with the educational attainment of less than high school are least likely to be married with 100.0% of them unmarried at childbirth.
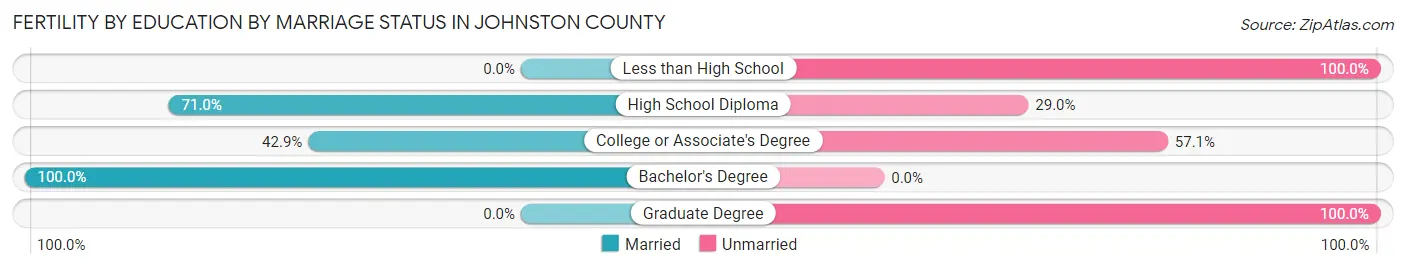
| Educational Attainment | Married | Unmarried |
| Less than High School | 0 (0.0%) | 3 (100.0%) |
| High School Diploma | 22 (71.0%) | 9 (29.0%) |
| College or Associate's Degree | 12 (42.9%) | 16 (57.1%) |
| Bachelor's Degree | 4 (100.0%) | 0 (0.0%) |
| Graduate Degree | 0 (0.0%) | 8 (100.0%) |
| Total | 38 (51.3%) | 36 (48.6%) |
Employment Characteristics in Johnston County
Employment by Class of Employer in Johnston County
Among the 3,736 employed individuals in Johnston County, private company employees (2,346 | 62.8%), state government employees (412 | 11.0%), and local government employees (368 | 9.9%) make up the most common classes of employment.
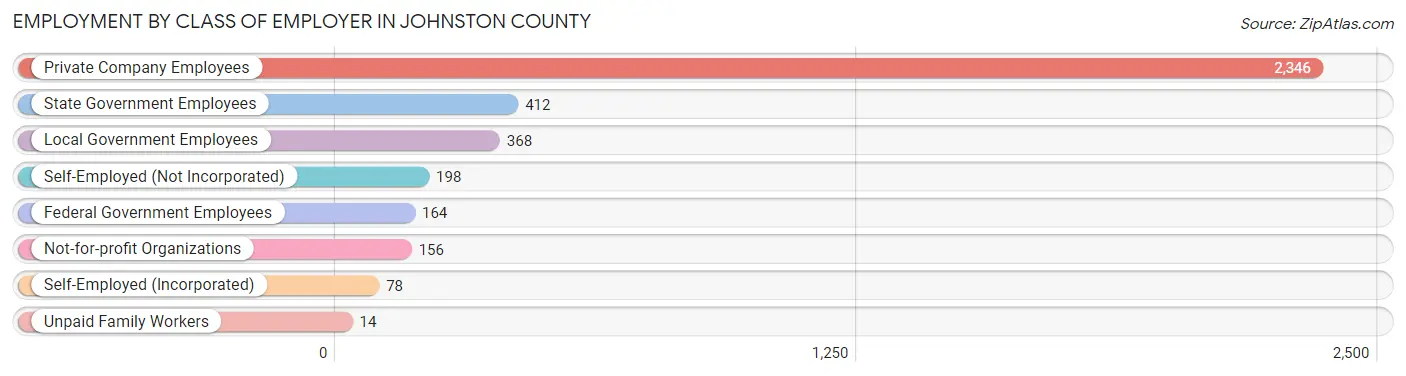
| Employer Class | # Employees | % Employees |
| Private Company Employees | 2,346 | 62.8% |
| Self-Employed (Incorporated) | 78 | 2.1% |
| Self-Employed (Not Incorporated) | 198 | 5.3% |
| Not-for-profit Organizations | 156 | 4.2% |
| Local Government Employees | 368 | 9.9% |
| State Government Employees | 412 | 11.0% |
| Federal Government Employees | 164 | 4.4% |
| Unpaid Family Workers | 14 | 0.4% |
| Total | 3,736 | 100.0% |
Employment Status by Age in Johnston County
According to the labor force statistics for Johnston County, out of the total population over 16 years of age (8,222), 49.1% or 4,037 individuals are in the labor force, with 5.5% or 222 of them unemployed. The age group with the highest labor force participation rate is 30 to 34 years, with 77.2% or 440 individuals in the labor force. Within the labor force, the 16 to 19 years age range has the highest percentage of unemployed individuals, with 12.2% or 23 of them being unemployed.
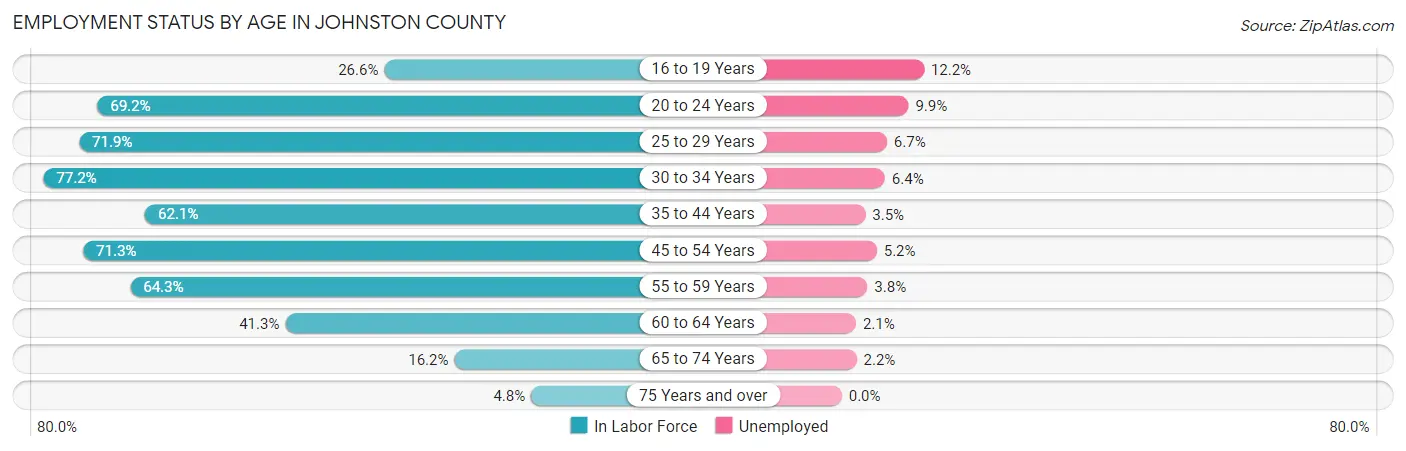
| Age Bracket | In Labor Force | Unemployed |
| 16 to 19 Years | 188 (26.6%) | 23 (12.2%) |
| 20 to 24 Years | 454 (69.2%) | 45 (9.9%) |
| 25 to 29 Years | 420 (71.9%) | 28 (6.7%) |
| 30 to 34 Years | 440 (77.2%) | 28 (6.4%) |
| 35 to 44 Years | 720 (62.1%) | 25 (3.5%) |
| 45 to 54 Years | 866 (71.3%) | 45 (5.2%) |
| 55 to 59 Years | 445 (64.3%) | 17 (3.8%) |
| 60 to 64 Years | 282 (41.3%) | 6 (2.1%) |
| 65 to 74 Years | 182 (16.2%) | 4 (2.2%) |
| 75 Years and over | 40 (4.8%) | 0 (0.0%) |
| Total | 4,037 (49.1%) | 222 (5.5%) |
Employment Status by Educational Attainment in Johnston County
According to labor force statistics for Johnston County, 64.7% of individuals (3,172) out of the total population between 25 and 64 years of age (4,903) are in the labor force, with 4.7% or 149 of them being unemployed. The group with the highest labor force participation rate are those with the educational attainment of bachelor's degree or higher, with 74.9% or 742 individuals in the labor force. Within the labor force, individuals with less than high school education have the highest percentage of unemployment, with 11.6% or 23 of them being unemployed.
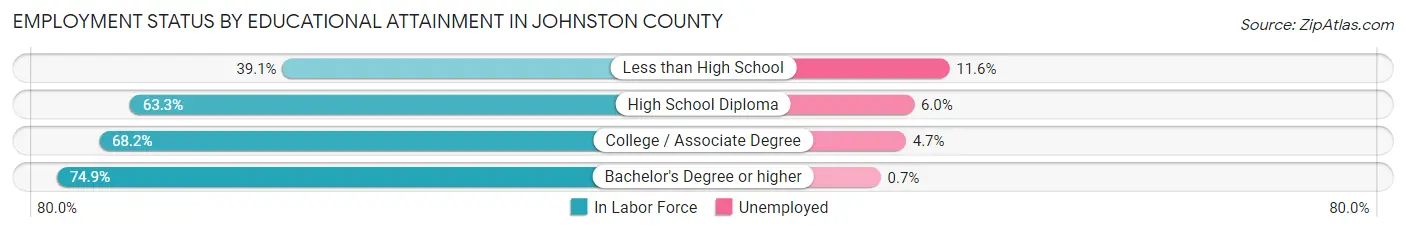
| Educational Attainment | In Labor Force | Unemployed |
| Less than High School | 198 (39.1%) | 59 (11.6%) |
| High School Diploma | 1,175 (63.3%) | 111 (6.0%) |
| College / Associate Degree | 1,056 (68.2%) | 73 (4.7%) |
| Bachelor's Degree or higher | 742 (74.9%) | 7 (0.7%) |
| Total | 3,172 (64.7%) | 230 (4.7%) |
Employment Occupations by Sex in Johnston County
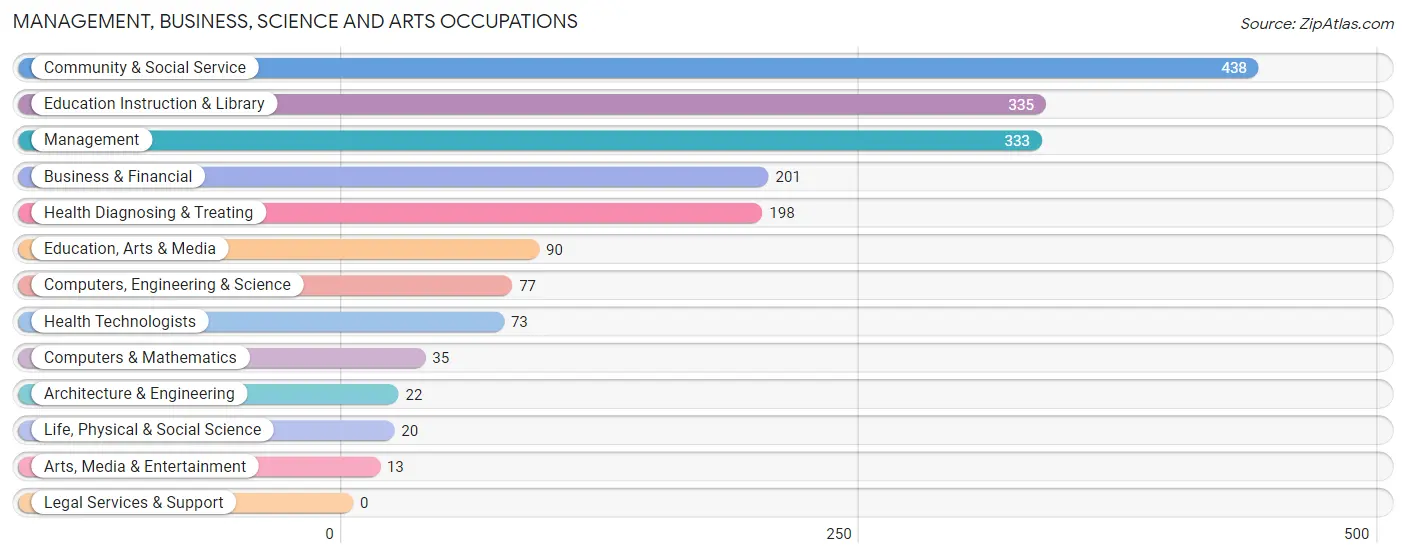
Management, Business, Science and Arts Occupations
The most common Management, Business, Science and Arts occupations in Johnston County are Community & Social Service (438 | 11.5%), Education Instruction & Library (335 | 8.8%), Management (333 | 8.7%), Business & Financial (201 | 5.3%), and Health Diagnosing & Treating (198 | 5.2%).
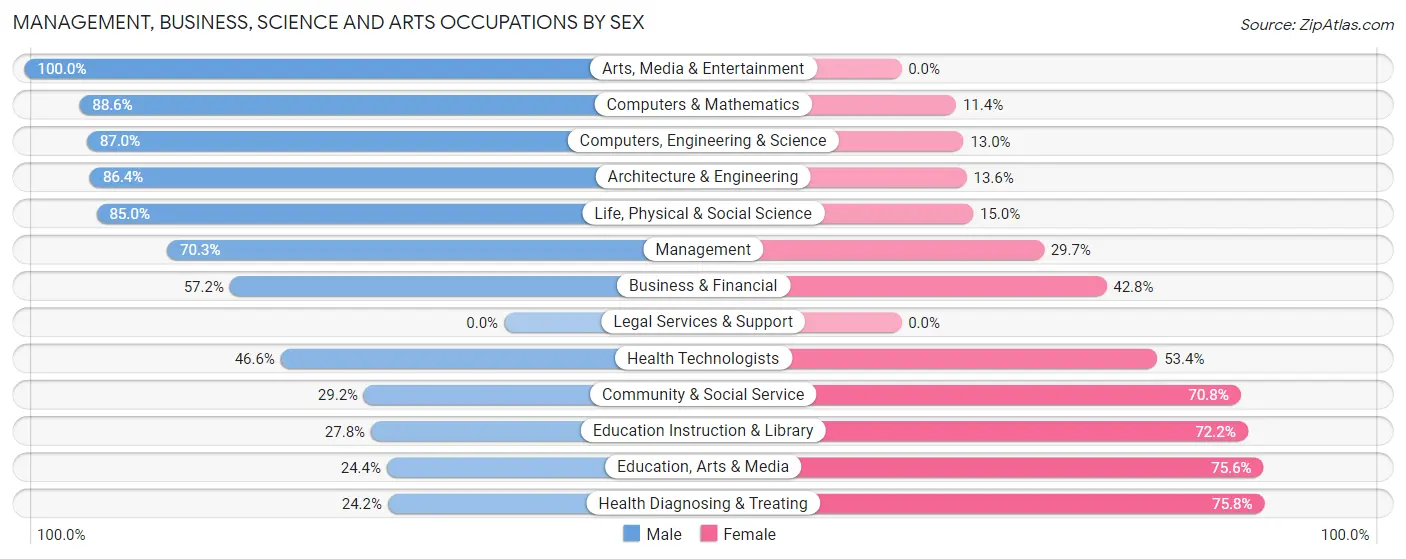
Management, Business, Science and Arts Occupations by Sex
Within the Management, Business, Science and Arts occupations in Johnston County, the most male-oriented occupations are Arts, Media & Entertainment (100.0%), Computers & Mathematics (88.6%), and Computers, Engineering & Science (87.0%), while the most female-oriented occupations are Health Diagnosing & Treating (75.8%), Education, Arts & Media (75.6%), and Education Instruction & Library (72.2%).
| Occupation | Male | Female |
| Management | 234 (70.3%) | 99 (29.7%) |
| Business & Financial | 115 (57.2%) | 86 (42.8%) |
| Computers, Engineering & Science | 67 (87.0%) | 10 (13.0%) |
| Computers & Mathematics | 31 (88.6%) | 4 (11.4%) |
| Architecture & Engineering | 19 (86.4%) | 3 (13.6%) |
| Life, Physical & Social Science | 17 (85.0%) | 3 (15.0%) |
| Community & Social Service | 128 (29.2%) | 310 (70.8%) |
| Education, Arts & Media | 22 (24.4%) | 68 (75.6%) |
| Legal Services & Support | 0 (0.0%) | 0 (0.0%) |
| Education Instruction & Library | 93 (27.8%) | 242 (72.2%) |
| Arts, Media & Entertainment | 13 (100.0%) | 0 (0.0%) |
| Health Diagnosing & Treating | 48 (24.2%) | 150 (75.8%) |
| Health Technologists | 34 (46.6%) | 39 (53.4%) |
| Total (Category) | 592 (47.5%) | 655 (52.5%) |
| Total (Overall) | 2,158 (56.6%) | 1,657 (43.4%) |
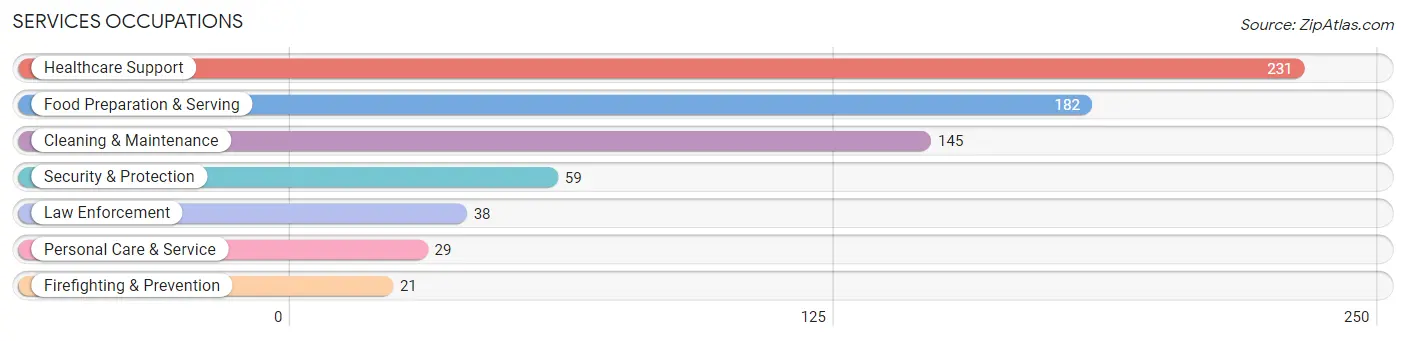
Services Occupations
The most common Services occupations in Johnston County are Healthcare Support (231 | 6.1%), Food Preparation & Serving (182 | 4.8%), Cleaning & Maintenance (145 | 3.8%), Security & Protection (59 | 1.5%), and Law Enforcement (38 | 1.0%).
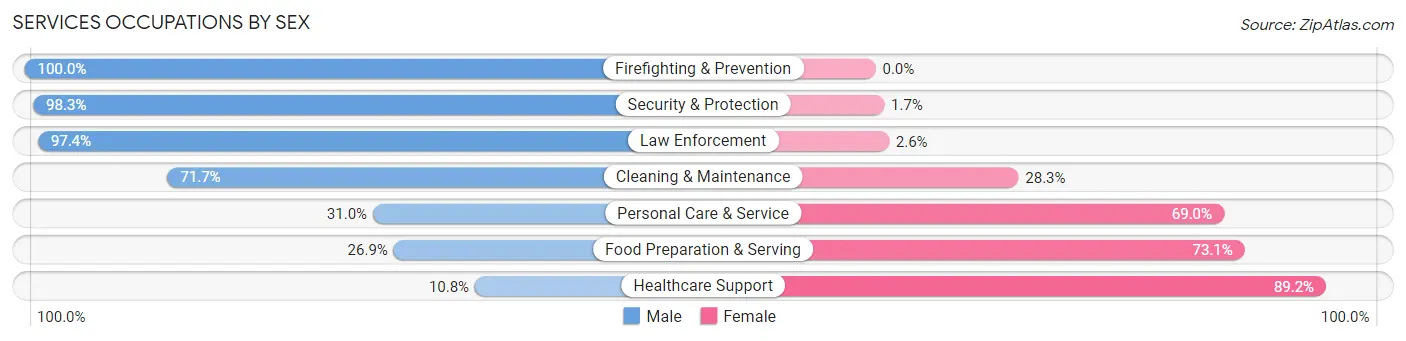
Services Occupations by Sex
Within the Services occupations in Johnston County, the most male-oriented occupations are Firefighting & Prevention (100.0%), Security & Protection (98.3%), and Law Enforcement (97.4%), while the most female-oriented occupations are Healthcare Support (89.2%), Food Preparation & Serving (73.1%), and Personal Care & Service (69.0%).
| Occupation | Male | Female |
| Healthcare Support | 25 (10.8%) | 206 (89.2%) |
| Security & Protection | 58 (98.3%) | 1 (1.7%) |
| Firefighting & Prevention | 21 (100.0%) | 0 (0.0%) |
| Law Enforcement | 37 (97.4%) | 1 (2.6%) |
| Food Preparation & Serving | 49 (26.9%) | 133 (73.1%) |
| Cleaning & Maintenance | 104 (71.7%) | 41 (28.3%) |
| Personal Care & Service | 9 (31.0%) | 20 (69.0%) |
| Total (Category) | 245 (37.9%) | 401 (62.1%) |
| Total (Overall) | 2,158 (56.6%) | 1,657 (43.4%) |
Sales and Office Occupations
The most common Sales and Office occupations in Johnston County are Office & Administration (323 | 8.5%), and Sales & Related (271 | 7.1%).
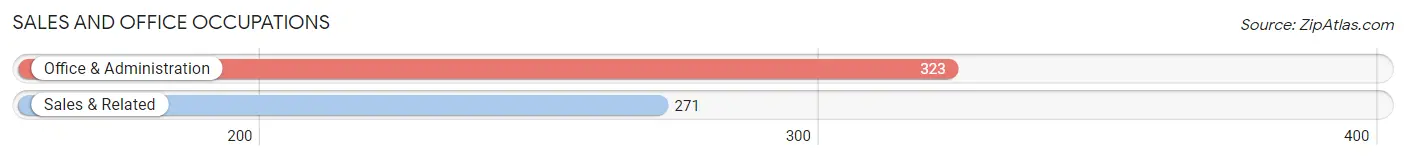
Sales and Office Occupations by Sex
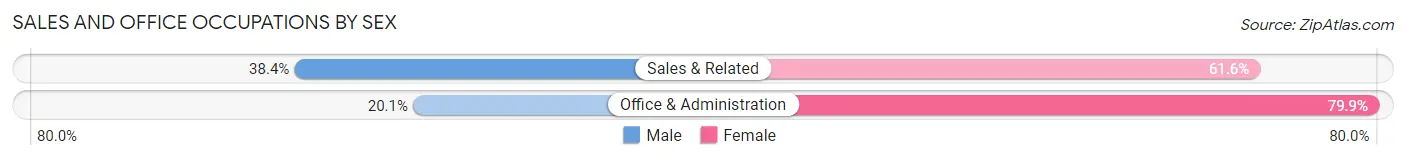
| Occupation | Male | Female |
| Sales & Related | 104 (38.4%) | 167 (61.6%) |
| Office & Administration | 65 (20.1%) | 258 (79.9%) |
| Total (Category) | 169 (28.4%) | 425 (71.6%) |
| Total (Overall) | 2,158 (56.6%) | 1,657 (43.4%) |
Natural Resources, Construction and Maintenance Occupations
The most common Natural Resources, Construction and Maintenance occupations in Johnston County are Construction & Extraction (194 | 5.1%), Installation, Maintenance & Repair (139 | 3.6%), and Farming, Fishing & Forestry (108 | 2.8%).
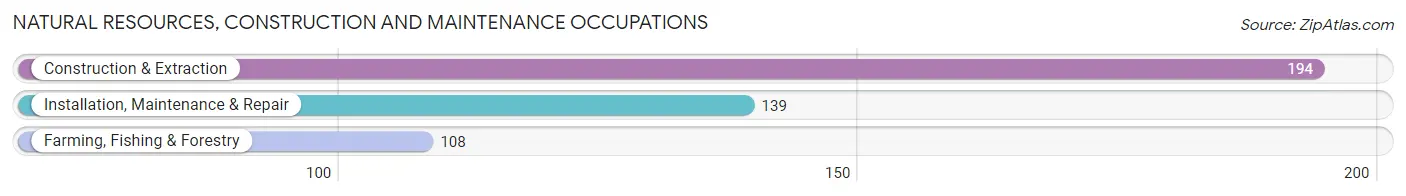
Natural Resources, Construction and Maintenance Occupations by Sex
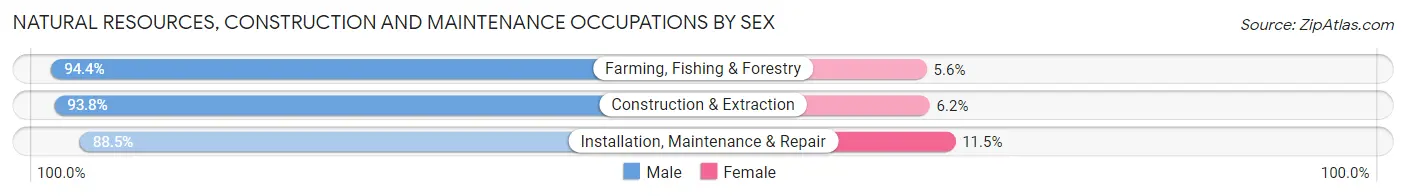
| Occupation | Male | Female |
| Farming, Fishing & Forestry | 102 (94.4%) | 6 (5.6%) |
| Construction & Extraction | 182 (93.8%) | 12 (6.2%) |
| Installation, Maintenance & Repair | 123 (88.5%) | 16 (11.5%) |
| Total (Category) | 407 (92.3%) | 34 (7.7%) |
| Total (Overall) | 2,158 (56.6%) | 1,657 (43.4%) |
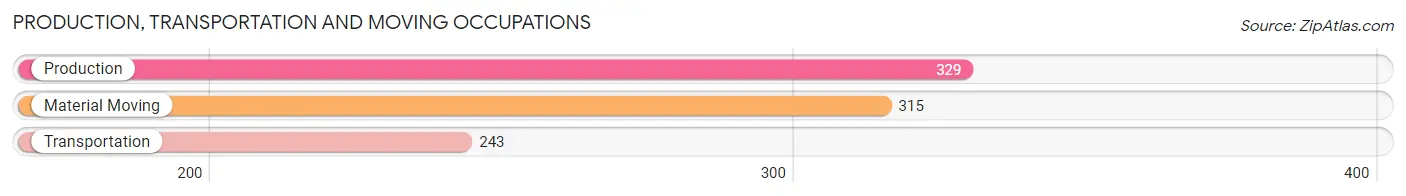
Production, Transportation and Moving Occupations
The most common Production, Transportation and Moving occupations in Johnston County are Production (329 | 8.6%), Material Moving (315 | 8.3%), and Transportation (243 | 6.4%).
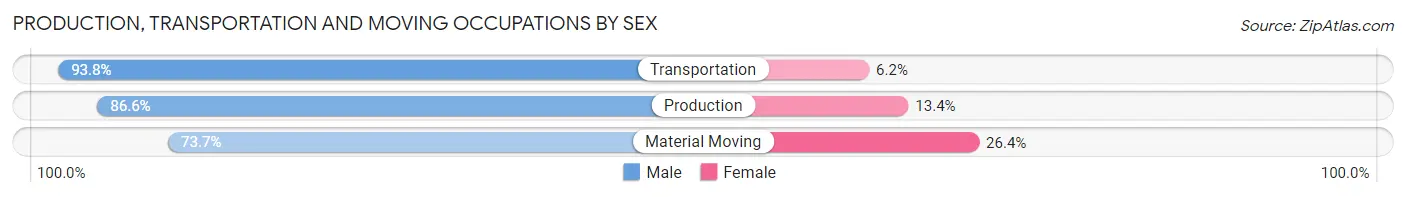
Production, Transportation and Moving Occupations by Sex
| Occupation | Male | Female |
| Production | 285 (86.6%) | 44 (13.4%) |
| Transportation | 228 (93.8%) | 15 (6.2%) |
| Material Moving | 232 (73.7%) | 83 (26.4%) |
| Total (Category) | 745 (84.0%) | 142 (16.0%) |
| Total (Overall) | 2,158 (56.6%) | 1,657 (43.4%) |
Employment Industries by Sex in Johnston County
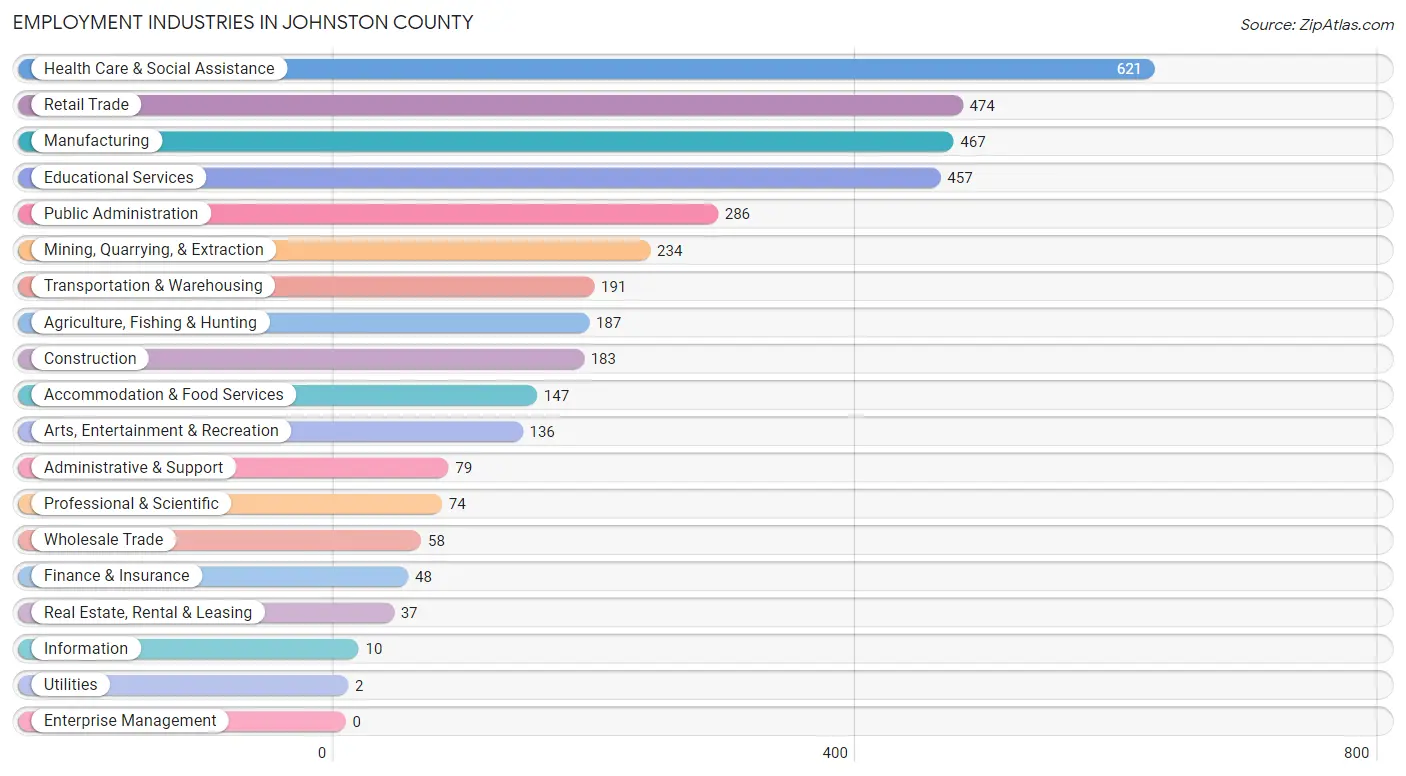
Employment Industries in Johnston County
The major employment industries in Johnston County include Health Care & Social Assistance (621 | 16.3%), Retail Trade (474 | 12.4%), Manufacturing (467 | 12.2%), Educational Services (457 | 12.0%), and Public Administration (286 | 7.5%).
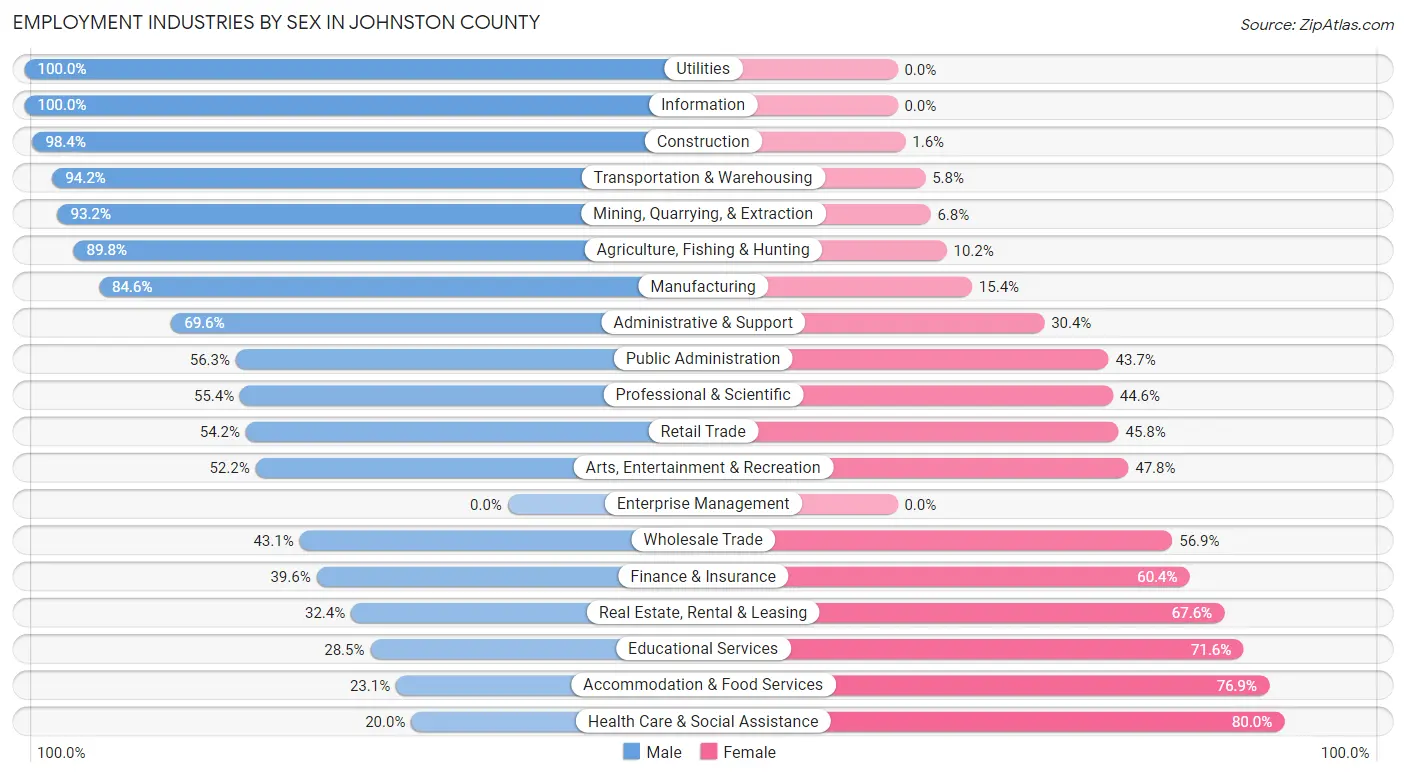
Employment Industries by Sex in Johnston County
The Johnston County industries that see more men than women are Utilities (100.0%), Information (100.0%), and Construction (98.4%), whereas the industries that tend to have a higher number of women are Health Care & Social Assistance (80.0%), Accommodation & Food Services (76.9%), and Educational Services (71.6%).
| Industry | Male | Female |
| Agriculture, Fishing & Hunting | 168 (89.8%) | 19 (10.2%) |
| Mining, Quarrying, & Extraction | 218 (93.2%) | 16 (6.8%) |
| Construction | 180 (98.4%) | 3 (1.6%) |
| Manufacturing | 395 (84.6%) | 72 (15.4%) |
| Wholesale Trade | 25 (43.1%) | 33 (56.9%) |
| Retail Trade | 257 (54.2%) | 217 (45.8%) |
| Transportation & Warehousing | 180 (94.2%) | 11 (5.8%) |
| Utilities | 2 (100.0%) | 0 (0.0%) |
| Information | 10 (100.0%) | 0 (0.0%) |
| Finance & Insurance | 19 (39.6%) | 29 (60.4%) |
| Real Estate, Rental & Leasing | 12 (32.4%) | 25 (67.6%) |
| Professional & Scientific | 41 (55.4%) | 33 (44.6%) |
| Enterprise Management | 0 (0.0%) | 0 (0.0%) |
| Administrative & Support | 55 (69.6%) | 24 (30.4%) |
| Educational Services | 130 (28.4%) | 327 (71.6%) |
| Health Care & Social Assistance | 124 (20.0%) | 497 (80.0%) |
| Arts, Entertainment & Recreation | 71 (52.2%) | 65 (47.8%) |
| Accommodation & Food Services | 34 (23.1%) | 113 (76.9%) |
| Public Administration | 161 (56.3%) | 125 (43.7%) |
| Total | 2,158 (56.6%) | 1,657 (43.4%) |
Education in Johnston County
School Enrollment in Johnston County
The most common levels of schooling among the 2,570 students in Johnston County are middle school (590 | 23.0%), elementary school (552 | 21.5%), and college / undergraduate (503 | 19.6%).
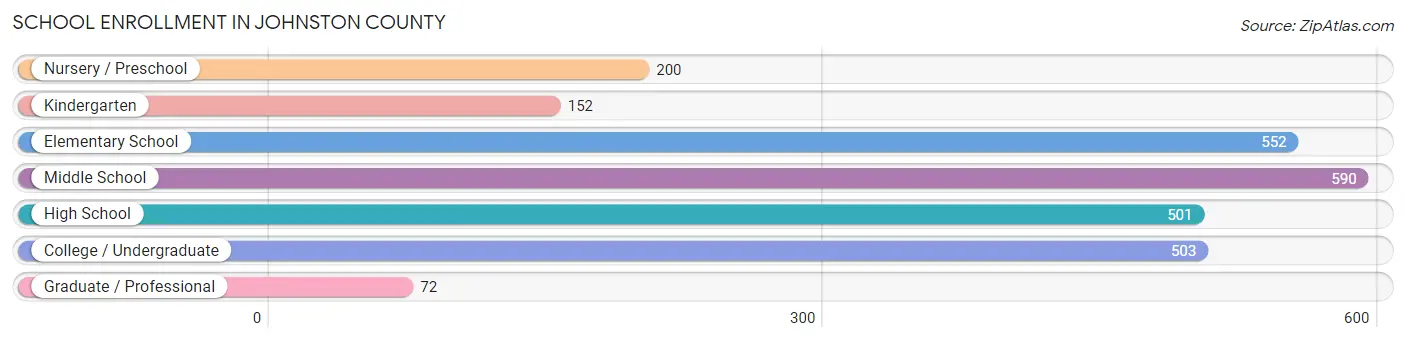
| School Level | # Students | % Students |
| Nursery / Preschool | 200 | 7.8% |
| Kindergarten | 152 | 5.9% |
| Elementary School | 552 | 21.5% |
| Middle School | 590 | 23.0% |
| High School | 501 | 19.5% |
| College / Undergraduate | 503 | 19.6% |
| Graduate / Professional | 72 | 2.8% |
| Total | 2,570 | 100.0% |
School Enrollment by Age by Funding Source in Johnston County
Out of a total of 2,570 students who are enrolled in schools in Johnston County, 67 (2.6%) attend a private institution, while the remaining 2,503 (97.4%) are enrolled in public schools. The age group of 35 years and over has the highest likelihood of being enrolled in private schools, with 28 (22.6% in the age bracket) enrolled. Conversely, the age group of 18 to 19 year olds has the lowest likelihood of being enrolled in a private school, with 286 (100.0% in the age bracket) attending a public institution.
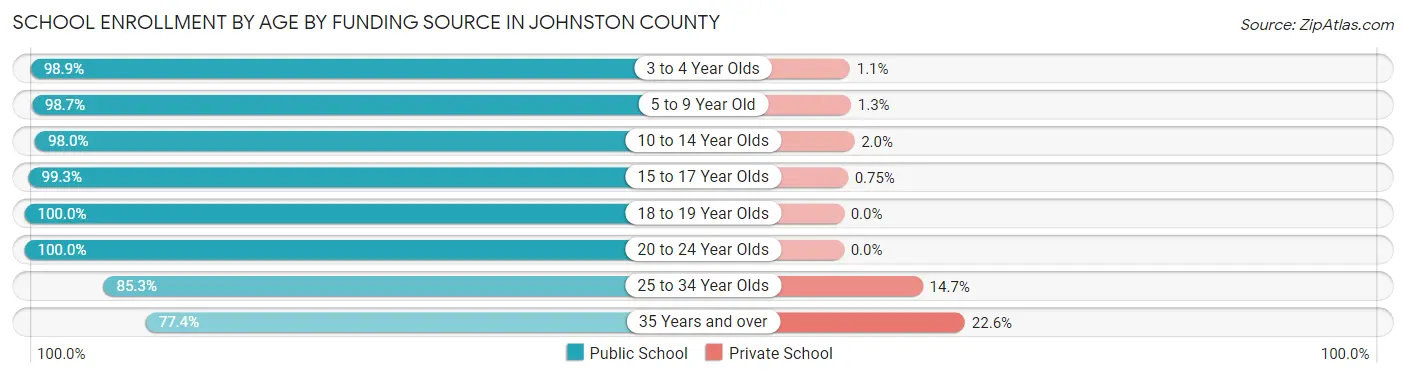
| Age Bracket | Public School | Private School |
| 3 to 4 Year Olds | 173 (98.9%) | 2 (1.1%) |
| 5 to 9 Year Old | 588 (98.7%) | 8 (1.3%) |
| 10 to 14 Year Olds | 745 (98.0%) | 15 (2.0%) |
| 15 to 17 Year Olds | 396 (99.3%) | 3 (0.7%) |
| 18 to 19 Year Olds | 286 (100.0%) | 0 (0.0%) |
| 20 to 24 Year Olds | 162 (100.0%) | 0 (0.0%) |
| 25 to 34 Year Olds | 58 (85.3%) | 10 (14.7%) |
| 35 Years and over | 96 (77.4%) | 28 (22.6%) |
| Total | 2,503 (97.4%) | 67 (2.6%) |
Educational Attainment by Field of Study in Johnston County
Education (487 | 33.0%), business (237 | 16.1%), science & technology (169 | 11.5%), bio, nature & agricultural (129 | 8.7%), and arts & humanities (121 | 8.2%) are the most common fields of study among 1,474 individuals in Johnston County who have obtained a bachelor's degree or higher.
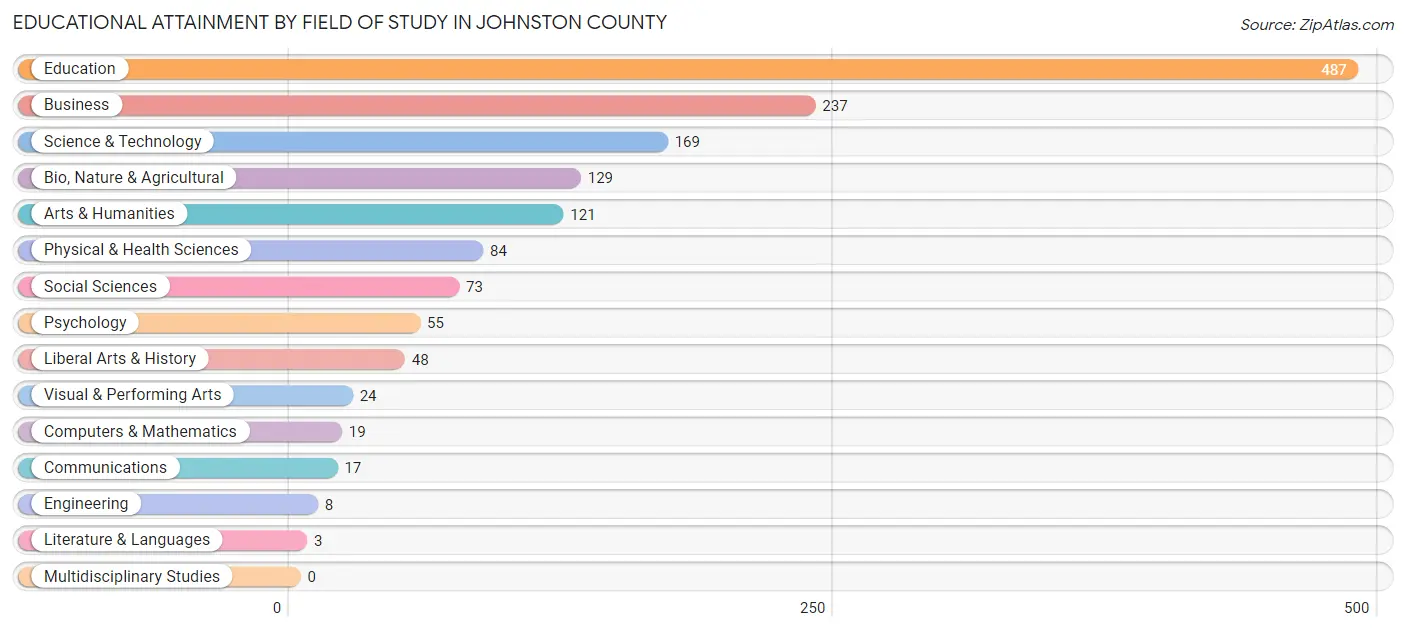
| Field of Study | # Graduates | % Graduates |
| Computers & Mathematics | 19 | 1.3% |
| Bio, Nature & Agricultural | 129 | 8.7% |
| Physical & Health Sciences | 84 | 5.7% |
| Psychology | 55 | 3.7% |
| Social Sciences | 73 | 5.0% |
| Engineering | 8 | 0.5% |
| Multidisciplinary Studies | 0 | 0.0% |
| Science & Technology | 169 | 11.5% |
| Business | 237 | 16.1% |
| Education | 487 | 33.0% |
| Literature & Languages | 3 | 0.2% |
| Liberal Arts & History | 48 | 3.3% |
| Visual & Performing Arts | 24 | 1.6% |
| Communications | 17 | 1.1% |
| Arts & Humanities | 121 | 8.2% |
| Total | 1,474 | 100.0% |
Transportation & Commute in Johnston County
Vehicle Availability by Sex in Johnston County
The most prevalent vehicle ownership categories in Johnston County are males with 2 vehicles (864, accounting for 41.0%) and females with 2 vehicles (735, making up 53.3%).
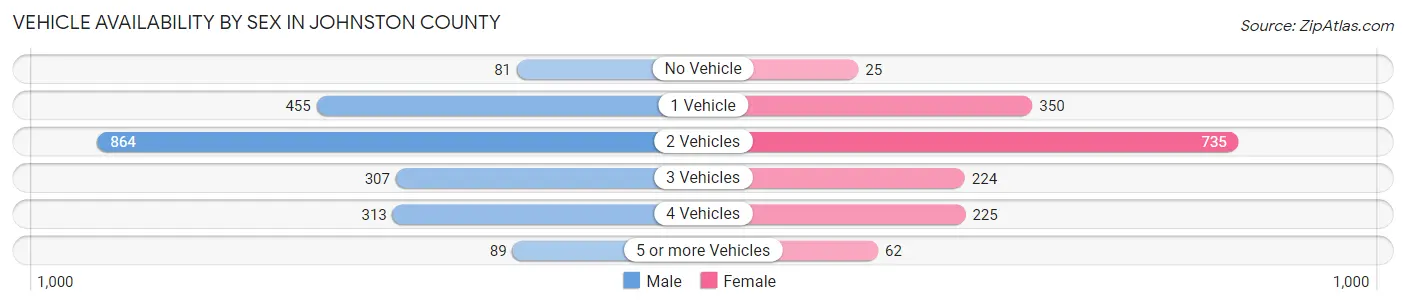
| Vehicles Available | Male | Female |
| No Vehicle | 81 (3.8%) | 25 (1.5%) |
| 1 Vehicle | 455 (21.6%) | 350 (21.6%) |
| 2 Vehicles | 864 (41.0%) | 735 (45.3%) |
| 3 Vehicles | 307 (14.6%) | 224 (13.8%) |
| 4 Vehicles | 313 (14.8%) | 225 (13.9%) |
| 5 or more Vehicles | 89 (4.2%) | 62 (3.8%) |
| Total | 2,109 (100.0%) | 1,621 (100.0%) |
Commute Time in Johnston County
The most frequently occuring commute durations in Johnston County are 30 to 34 minutes (577 commuters, 16.2%), 5 to 9 minutes (517 commuters, 14.5%), and 10 to 14 minutes (505 commuters, 14.2%).
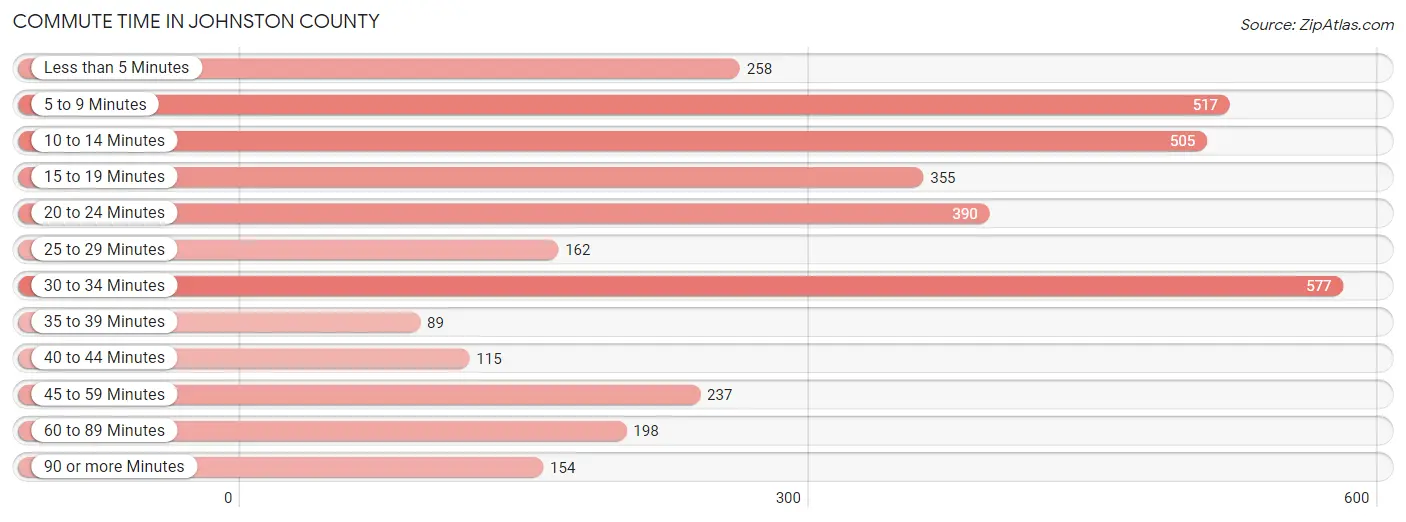
| Commute Time | # Commuters | % Commuters |
| Less than 5 Minutes | 258 | 7.2% |
| 5 to 9 Minutes | 517 | 14.5% |
| 10 to 14 Minutes | 505 | 14.2% |
| 15 to 19 Minutes | 355 | 10.0% |
| 20 to 24 Minutes | 390 | 11.0% |
| 25 to 29 Minutes | 162 | 4.5% |
| 30 to 34 Minutes | 577 | 16.2% |
| 35 to 39 Minutes | 89 | 2.5% |
| 40 to 44 Minutes | 115 | 3.2% |
| 45 to 59 Minutes | 237 | 6.7% |
| 60 to 89 Minutes | 198 | 5.6% |
| 90 or more Minutes | 154 | 4.3% |
Commute Time by Sex in Johnston County
The most common commute times in Johnston County are 30 to 34 minutes (325 commuters, 16.1%) for males and 30 to 34 minutes (252 commuters, 16.4%) for females.
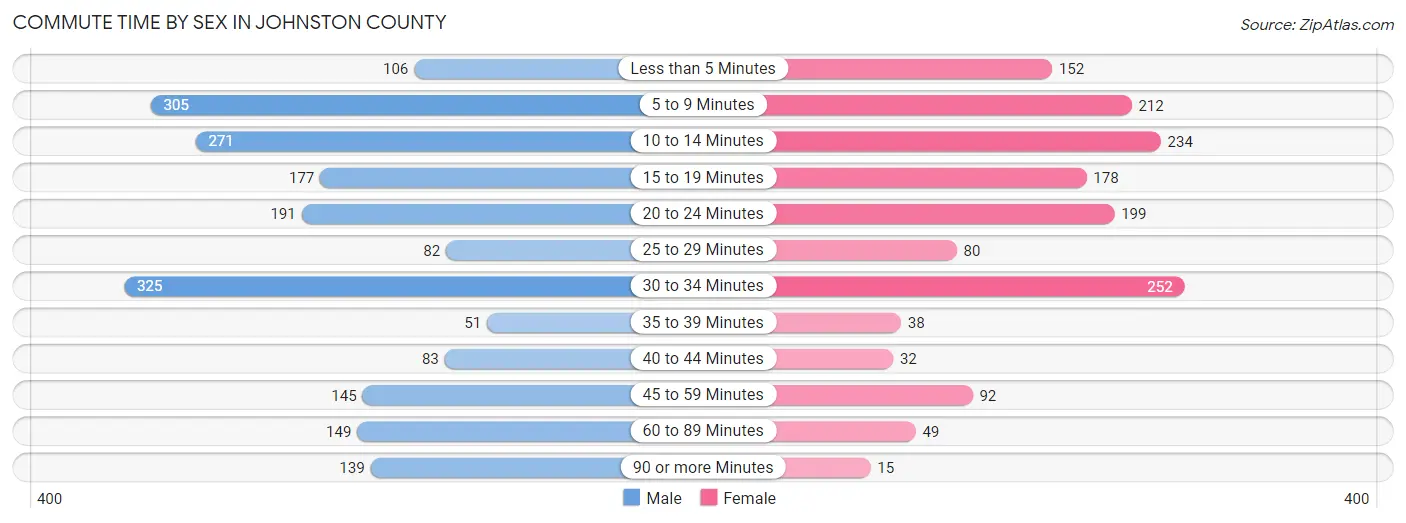
| Commute Time | Male | Female |
| Less than 5 Minutes | 106 (5.2%) | 152 (9.9%) |
| 5 to 9 Minutes | 305 (15.1%) | 212 (13.8%) |
| 10 to 14 Minutes | 271 (13.4%) | 234 (15.3%) |
| 15 to 19 Minutes | 177 (8.7%) | 178 (11.6%) |
| 20 to 24 Minutes | 191 (9.4%) | 199 (13.0%) |
| 25 to 29 Minutes | 82 (4.1%) | 80 (5.2%) |
| 30 to 34 Minutes | 325 (16.1%) | 252 (16.4%) |
| 35 to 39 Minutes | 51 (2.5%) | 38 (2.5%) |
| 40 to 44 Minutes | 83 (4.1%) | 32 (2.1%) |
| 45 to 59 Minutes | 145 (7.2%) | 92 (6.0%) |
| 60 to 89 Minutes | 149 (7.4%) | 49 (3.2%) |
| 90 or more Minutes | 139 (6.9%) | 15 (1.0%) |
Time of Departure to Work by Sex in Johnston County
The most frequent times of departure to work in Johnston County are 6:00 AM to 6:29 AM (242, 12.0%) for males and 7:00 AM to 7:29 AM (354, 23.1%) for females.
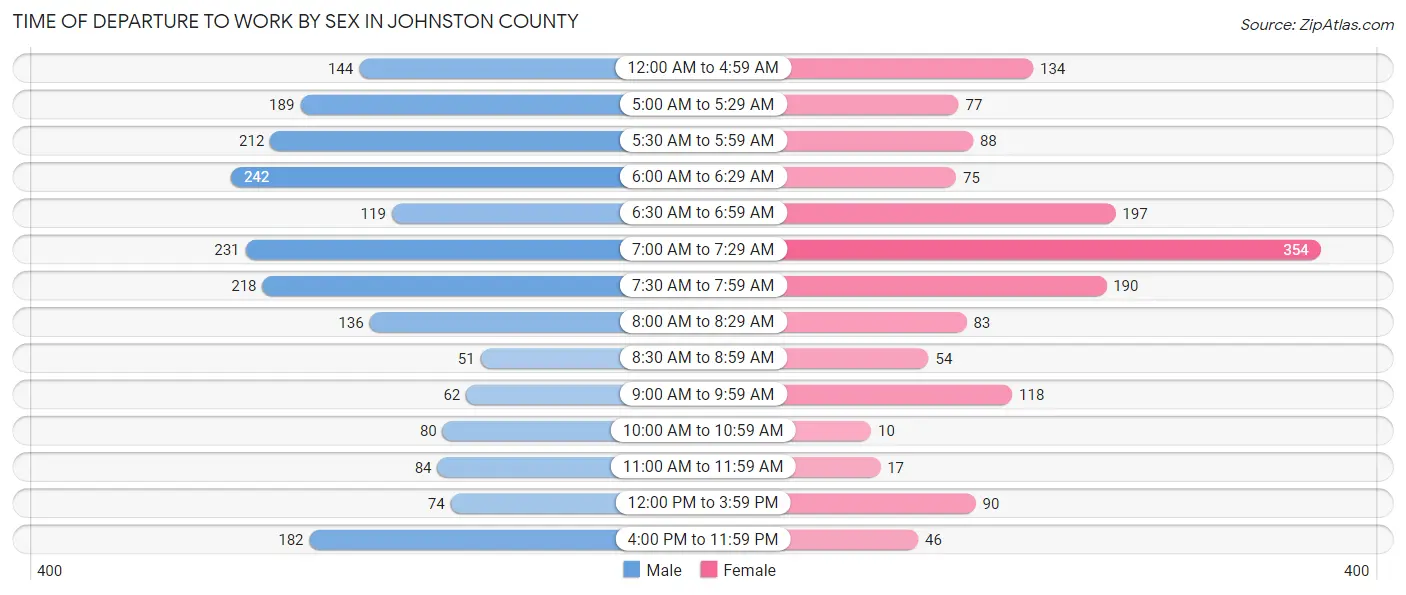
| Time of Departure | Male | Female |
| 12:00 AM to 4:59 AM | 144 (7.1%) | 134 (8.7%) |
| 5:00 AM to 5:29 AM | 189 (9.3%) | 77 (5.0%) |
| 5:30 AM to 5:59 AM | 212 (10.5%) | 88 (5.7%) |
| 6:00 AM to 6:29 AM | 242 (12.0%) | 75 (4.9%) |
| 6:30 AM to 6:59 AM | 119 (5.9%) | 197 (12.9%) |
| 7:00 AM to 7:29 AM | 231 (11.4%) | 354 (23.1%) |
| 7:30 AM to 7:59 AM | 218 (10.8%) | 190 (12.4%) |
| 8:00 AM to 8:29 AM | 136 (6.7%) | 83 (5.4%) |
| 8:30 AM to 8:59 AM | 51 (2.5%) | 54 (3.5%) |
| 9:00 AM to 9:59 AM | 62 (3.1%) | 118 (7.7%) |
| 10:00 AM to 10:59 AM | 80 (4.0%) | 10 (0.6%) |
| 11:00 AM to 11:59 AM | 84 (4.2%) | 17 (1.1%) |
| 12:00 PM to 3:59 PM | 74 (3.7%) | 90 (5.9%) |
| 4:00 PM to 11:59 PM | 182 (9.0%) | 46 (3.0%) |
| Total | 2,024 (100.0%) | 1,533 (100.0%) |
Housing Occupancy in Johnston County
Occupancy by Ownership in Johnston County
Of the total 3,889 dwellings in Johnston County, owner-occupied units account for 2,728 (70.2%), while renter-occupied units make up 1,161 (29.8%).
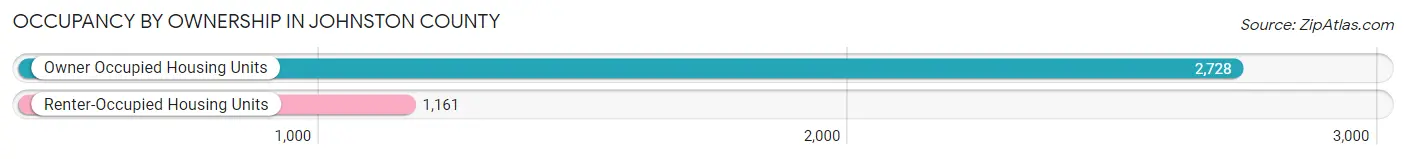
| Occupancy | # Housing Units | % Housing Units |
| Owner Occupied Housing Units | 2,728 | 70.2% |
| Renter-Occupied Housing Units | 1,161 | 29.8% |
| Total Occupied Housing Units | 3,889 | 100.0% |
Occupancy by Household Size in Johnston County
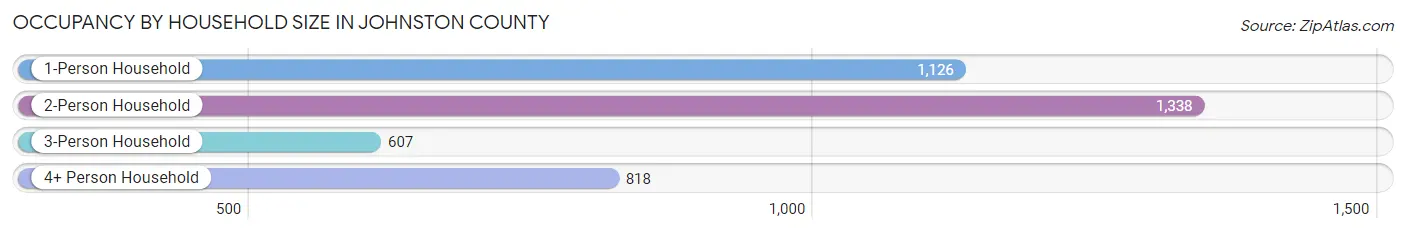
| Household Size | # Housing Units | % Housing Units |
| 1-Person Household | 1,126 | 28.9% |
| 2-Person Household | 1,338 | 34.4% |
| 3-Person Household | 607 | 15.6% |
| 4+ Person Household | 818 | 21.0% |
| Total Housing Units | 3,889 | 100.0% |
Occupancy by Ownership by Household Size in Johnston County
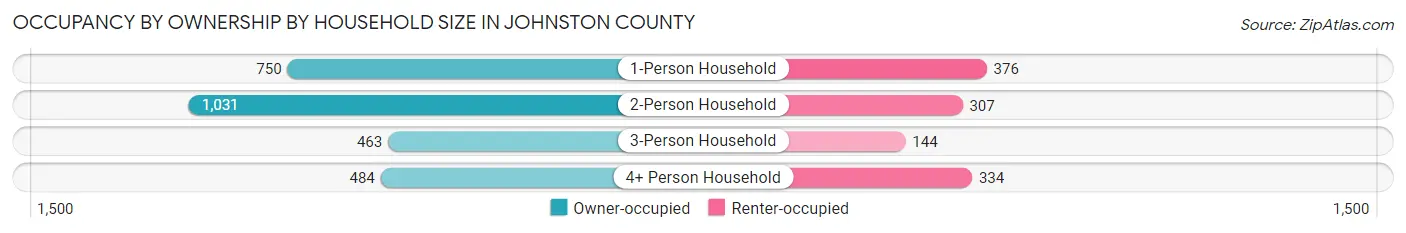
| Household Size | Owner-occupied | Renter-occupied |
| 1-Person Household | 750 (66.6%) | 376 (33.4%) |
| 2-Person Household | 1,031 (77.1%) | 307 (22.9%) |
| 3-Person Household | 463 (76.3%) | 144 (23.7%) |
| 4+ Person Household | 484 (59.2%) | 334 (40.8%) |
| Total Housing Units | 2,728 (70.2%) | 1,161 (29.8%) |
Occupancy by Educational Attainment in Johnston County
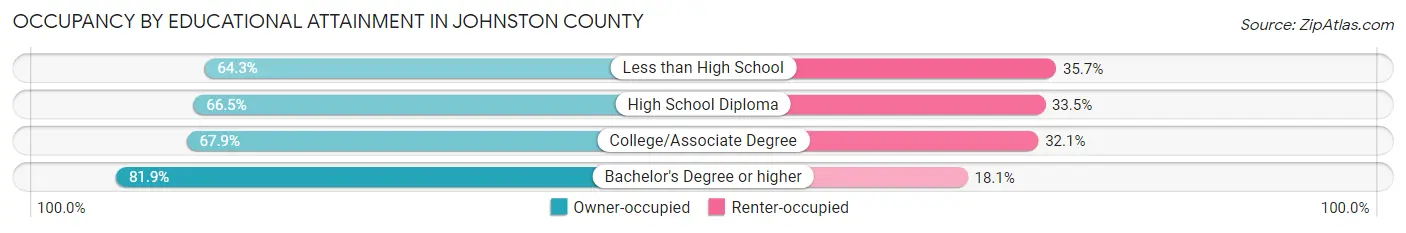
| Household Size | Owner-occupied | Renter-occupied |
| Less than High School | 314 (64.3%) | 174 (35.7%) |
| High School Diploma | 815 (66.5%) | 410 (33.5%) |
| College/Associate Degree | 885 (67.9%) | 419 (32.1%) |
| Bachelor's Degree or higher | 714 (81.9%) | 158 (18.1%) |
Occupancy by Age of Householder in Johnston County
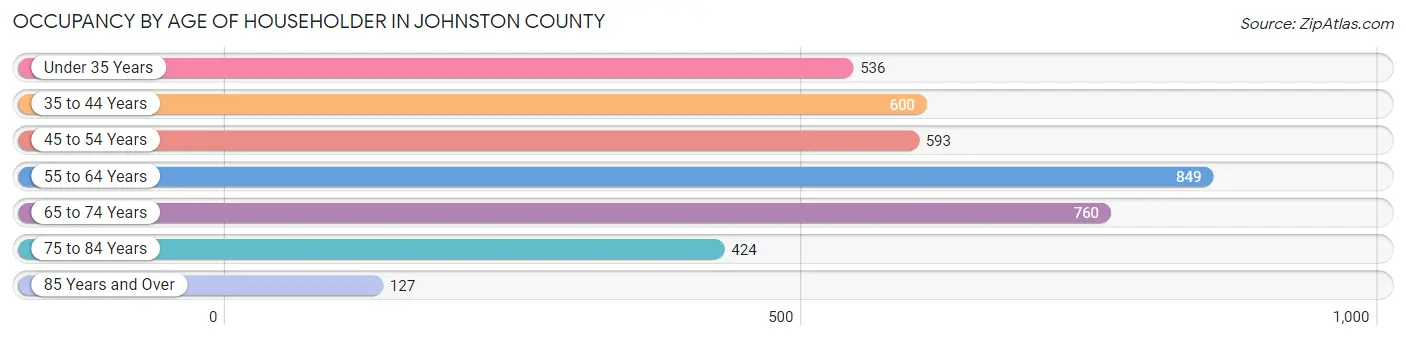
| Age Bracket | # Households | % Households |
| Under 35 Years | 536 | 13.8% |
| 35 to 44 Years | 600 | 15.4% |
| 45 to 54 Years | 593 | 15.2% |
| 55 to 64 Years | 849 | 21.8% |
| 65 to 74 Years | 760 | 19.5% |
| 75 to 84 Years | 424 | 10.9% |
| 85 Years and Over | 127 | 3.3% |
| Total | 3,889 | 100.0% |
Housing Finances in Johnston County
Median Income by Occupancy in Johnston County
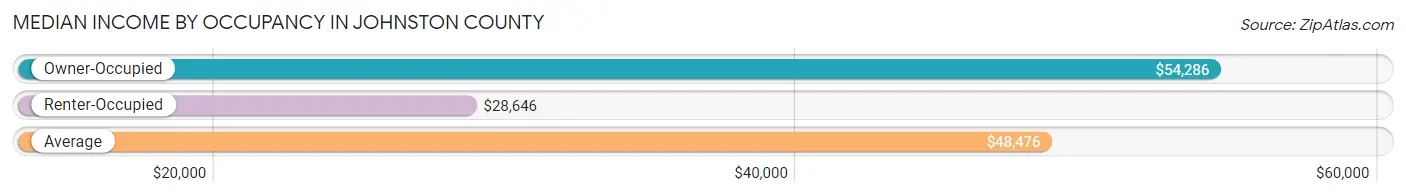
| Occupancy Type | # Households | Median Income |
| Owner-Occupied | 2,728 (70.2%) | $54,286 |
| Renter-Occupied | 1,161 (29.8%) | $28,646 |
| Average | 3,889 (100.0%) | $48,476 |
Occupancy by Householder Income Bracket in Johnston County
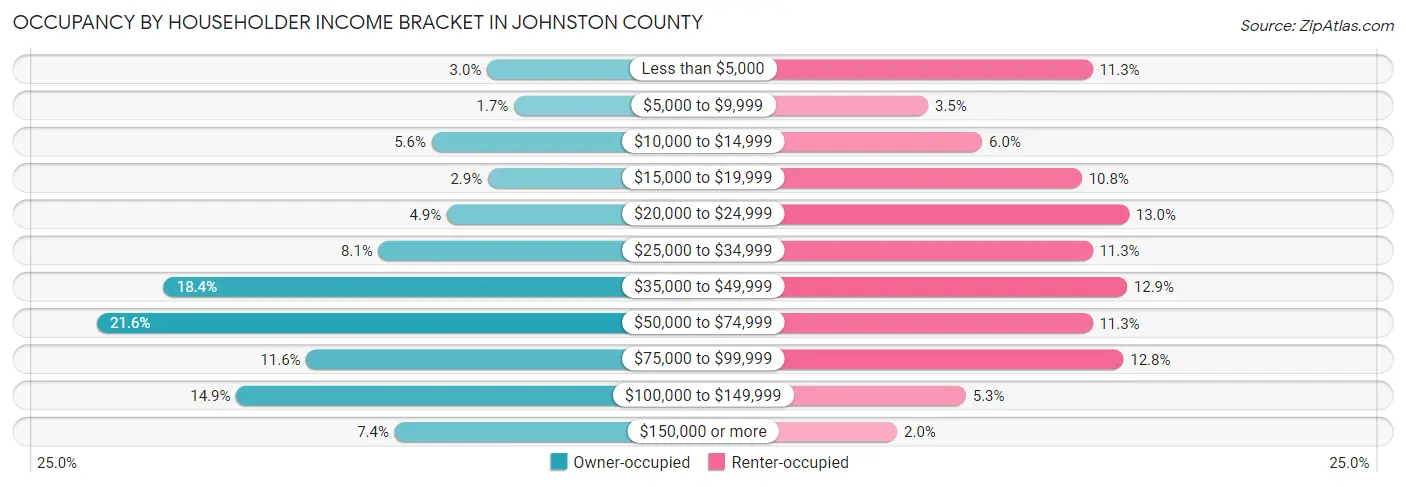
| Income Bracket | Owner-occupied | Renter-occupied |
| Less than $5,000 | 81 (3.0%) | 131 (11.3%) |
| $5,000 to $9,999 | 46 (1.7%) | 40 (3.5%) |
| $10,000 to $14,999 | 153 (5.6%) | 70 (6.0%) |
| $15,000 to $19,999 | 80 (2.9%) | 125 (10.8%) |
| $20,000 to $24,999 | 133 (4.9%) | 151 (13.0%) |
| $25,000 to $34,999 | 222 (8.1%) | 131 (11.3%) |
| $35,000 to $49,999 | 501 (18.4%) | 150 (12.9%) |
| $50,000 to $74,999 | 588 (21.5%) | 131 (11.3%) |
| $75,000 to $99,999 | 316 (11.6%) | 148 (12.8%) |
| $100,000 to $149,999 | 407 (14.9%) | 61 (5.2%) |
| $150,000 or more | 201 (7.4%) | 23 (2.0%) |
| Total | 2,728 (100.0%) | 1,161 (100.0%) |
Monthly Housing Cost Tiers in Johnston County
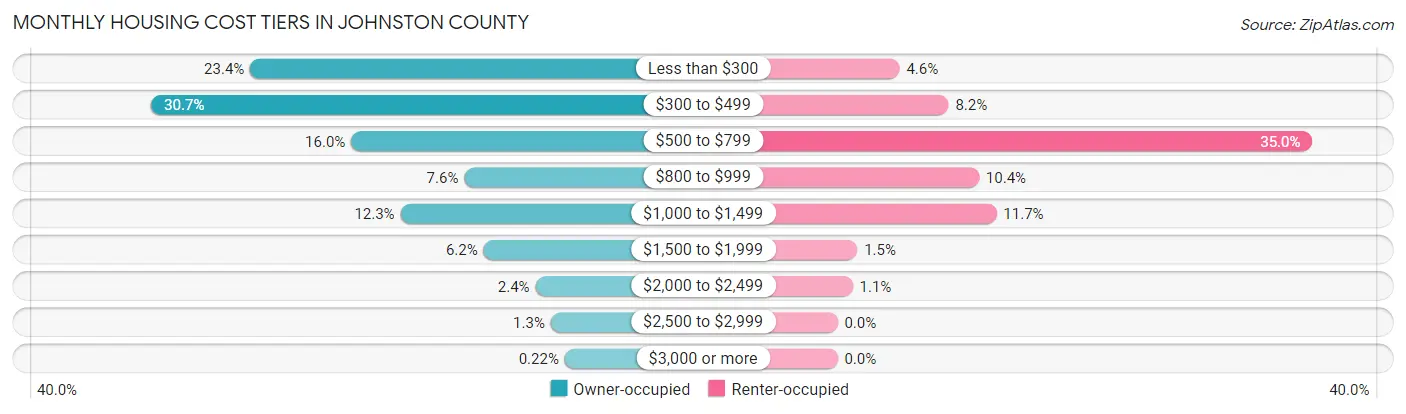
| Monthly Cost | Owner-occupied | Renter-occupied |
| Less than $300 | 638 (23.4%) | 53 (4.6%) |
| $300 to $499 | 837 (30.7%) | 95 (8.2%) |
| $500 to $799 | 435 (16.0%) | 406 (35.0%) |
| $800 to $999 | 208 (7.6%) | 121 (10.4%) |
| $1,000 to $1,499 | 336 (12.3%) | 136 (11.7%) |
| $1,500 to $1,999 | 169 (6.2%) | 17 (1.5%) |
| $2,000 to $2,499 | 65 (2.4%) | 13 (1.1%) |
| $2,500 to $2,999 | 34 (1.3%) | 0 (0.0%) |
| $3,000 or more | 6 (0.2%) | 0 (0.0%) |
| Total | 2,728 (100.0%) | 1,161 (100.0%) |
Physical Housing Characteristics in Johnston County
Housing Structures in Johnston County
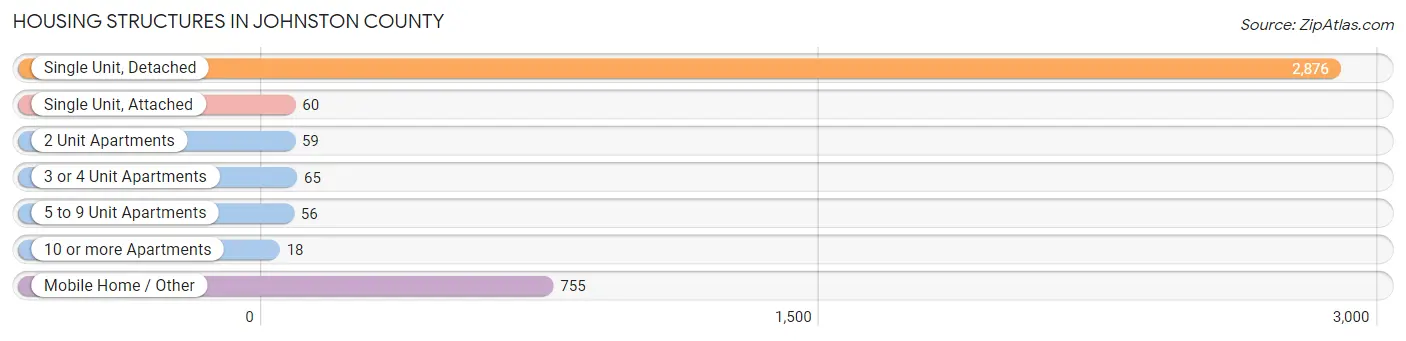
| Structure Type | # Housing Units | % Housing Units |
| Single Unit, Detached | 2,876 | 74.0% |
| Single Unit, Attached | 60 | 1.5% |
| 2 Unit Apartments | 59 | 1.5% |
| 3 or 4 Unit Apartments | 65 | 1.7% |
| 5 to 9 Unit Apartments | 56 | 1.4% |
| 10 or more Apartments | 18 | 0.5% |
| Mobile Home / Other | 755 | 19.4% |
| Total | 3,889 | 100.0% |
Housing Structures by Occupancy in Johnston County
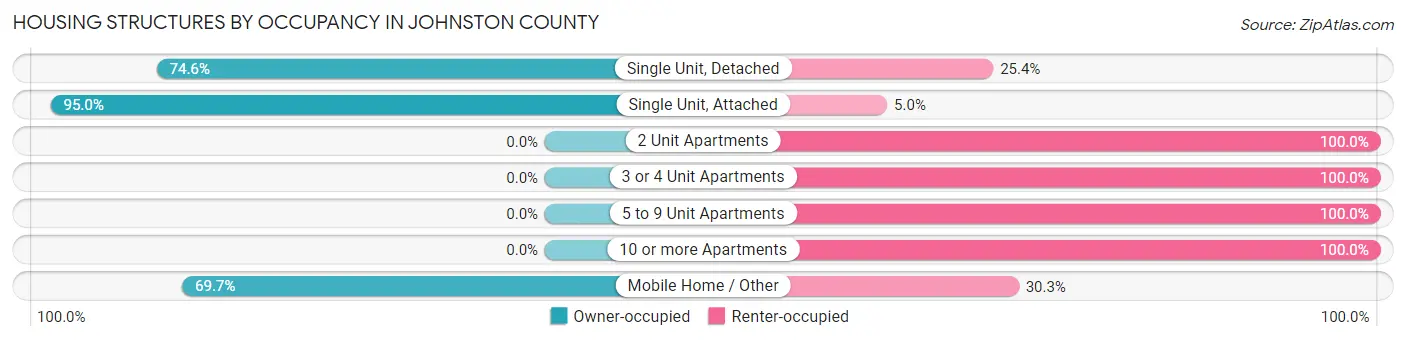
| Structure Type | Owner-occupied | Renter-occupied |
| Single Unit, Detached | 2,145 (74.6%) | 731 (25.4%) |
| Single Unit, Attached | 57 (95.0%) | 3 (5.0%) |
| 2 Unit Apartments | 0 (0.0%) | 59 (100.0%) |
| 3 or 4 Unit Apartments | 0 (0.0%) | 65 (100.0%) |
| 5 to 9 Unit Apartments | 0 (0.0%) | 56 (100.0%) |
| 10 or more Apartments | 0 (0.0%) | 18 (100.0%) |
| Mobile Home / Other | 526 (69.7%) | 229 (30.3%) |
| Total | 2,728 (70.2%) | 1,161 (29.8%) |
Housing Structures by Number of Rooms in Johnston County
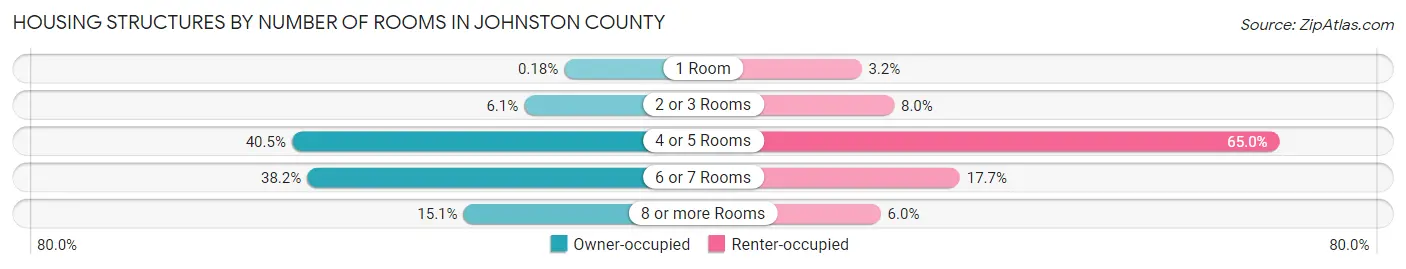
| Number of Rooms | Owner-occupied | Renter-occupied |
| 1 Room | 5 (0.2%) | 37 (3.2%) |
| 2 or 3 Rooms | 166 (6.1%) | 93 (8.0%) |
| 4 or 5 Rooms | 1,104 (40.5%) | 755 (65.0%) |
| 6 or 7 Rooms | 1,042 (38.2%) | 206 (17.7%) |
| 8 or more Rooms | 411 (15.1%) | 70 (6.0%) |
| Total | 2,728 (100.0%) | 1,161 (100.0%) |
Housing Structure by Heating Type in Johnston County
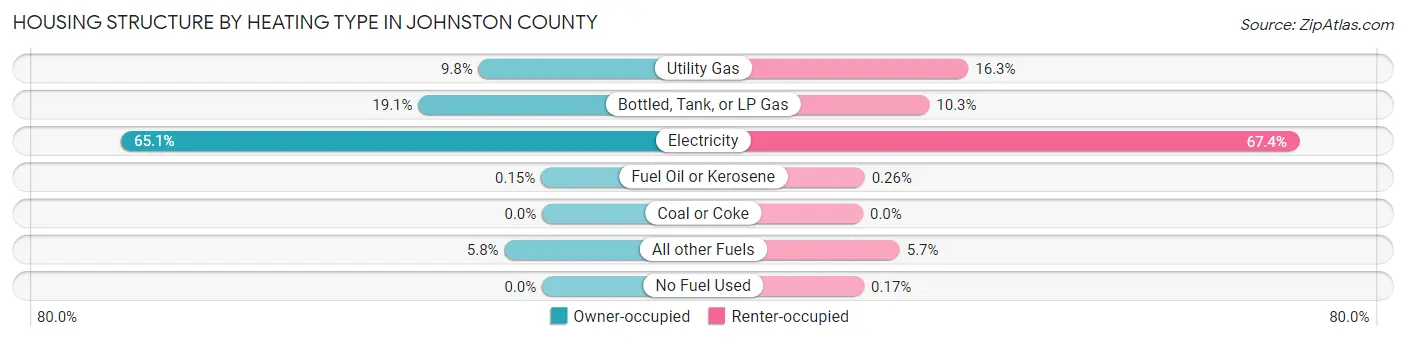
| Heating Type | Owner-occupied | Renter-occupied |
| Utility Gas | 268 (9.8%) | 189 (16.3%) |
| Bottled, Tank, or LP Gas | 522 (19.1%) | 119 (10.2%) |
| Electricity | 1,775 (65.1%) | 782 (67.4%) |
| Fuel Oil or Kerosene | 4 (0.2%) | 3 (0.3%) |
| Coal or Coke | 0 (0.0%) | 0 (0.0%) |
| All other Fuels | 159 (5.8%) | 66 (5.7%) |
| No Fuel Used | 0 (0.0%) | 2 (0.2%) |
| Total | 2,728 (100.0%) | 1,161 (100.0%) |
Household Vehicle Usage in Johnston County
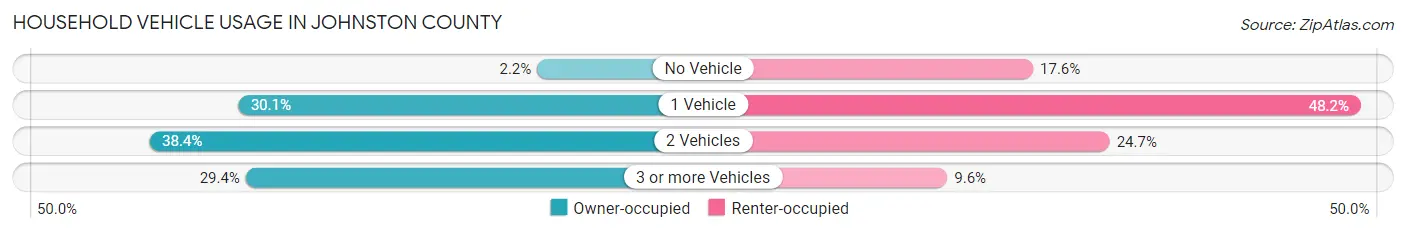
| Vehicles per Household | Owner-occupied | Renter-occupied |
| No Vehicle | 59 (2.2%) | 204 (17.6%) |
| 1 Vehicle | 821 (30.1%) | 559 (48.1%) |
| 2 Vehicles | 1,047 (38.4%) | 287 (24.7%) |
| 3 or more Vehicles | 801 (29.4%) | 111 (9.6%) |
| Total | 2,728 (100.0%) | 1,161 (100.0%) |
Real Estate & Mortgages in Johnston County
Real Estate and Mortgage Overview in Johnston County
| Characteristic | Without Mortgage | With Mortgage |
| Housing Units | 1,762 | 966 |
| Median Property Value | $86,100 | $139,900 |
| Median Household Income | $46,200 | $152 |
| Monthly Housing Costs | $354 | $6 |
| Real Estate Taxes | $475 | $52 |
Property Value by Mortgage Status in Johnston County
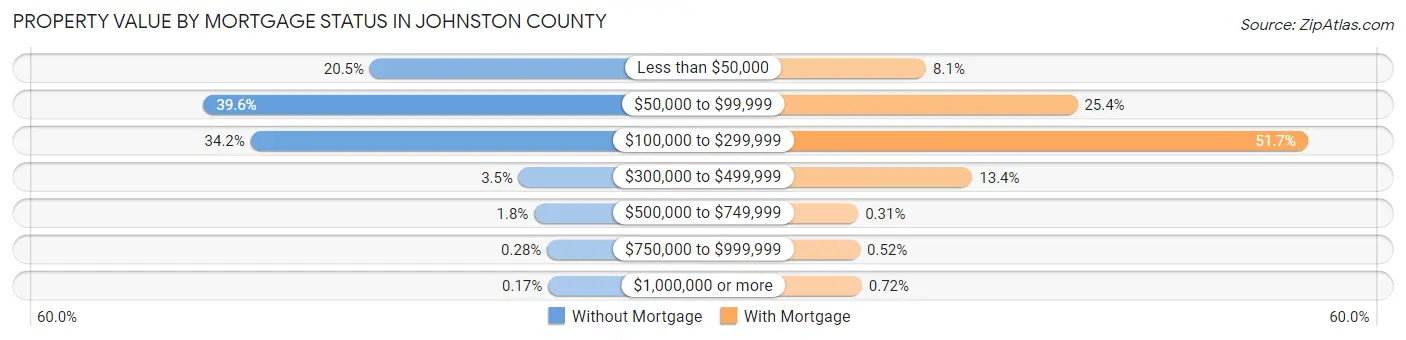
| Property Value | Without Mortgage | With Mortgage |
| Less than $50,000 | 362 (20.5%) | 78 (8.1%) |
| $50,000 to $99,999 | 697 (39.6%) | 245 (25.4%) |
| $100,000 to $299,999 | 602 (34.2%) | 499 (51.7%) |
| $300,000 to $499,999 | 62 (3.5%) | 129 (13.4%) |
| $500,000 to $749,999 | 31 (1.8%) | 3 (0.3%) |
| $750,000 to $999,999 | 5 (0.3%) | 5 (0.5%) |
| $1,000,000 or more | 3 (0.2%) | 7 (0.7%) |
| Total | 1,762 (100.0%) | 966 (100.0%) |
Household Income by Mortgage Status in Johnston County
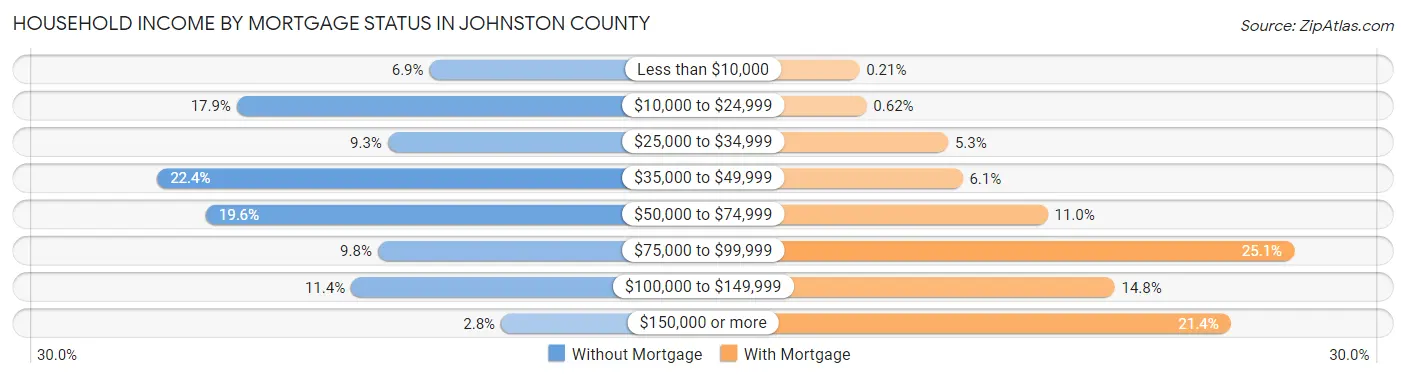
| Household Income | Without Mortgage | With Mortgage |
| Less than $10,000 | 121 (6.9%) | 2 (0.2%) |
| $10,000 to $24,999 | 315 (17.9%) | 6 (0.6%) |
| $25,000 to $34,999 | 163 (9.2%) | 51 (5.3%) |
| $35,000 to $49,999 | 395 (22.4%) | 59 (6.1%) |
| $50,000 to $74,999 | 346 (19.6%) | 106 (11.0%) |
| $75,000 to $99,999 | 173 (9.8%) | 242 (25.1%) |
| $100,000 to $149,999 | 200 (11.4%) | 143 (14.8%) |
| $150,000 or more | 49 (2.8%) | 207 (21.4%) |
| Total | 1,762 (100.0%) | 966 (100.0%) |
Property Value to Household Income Ratio in Johnston County
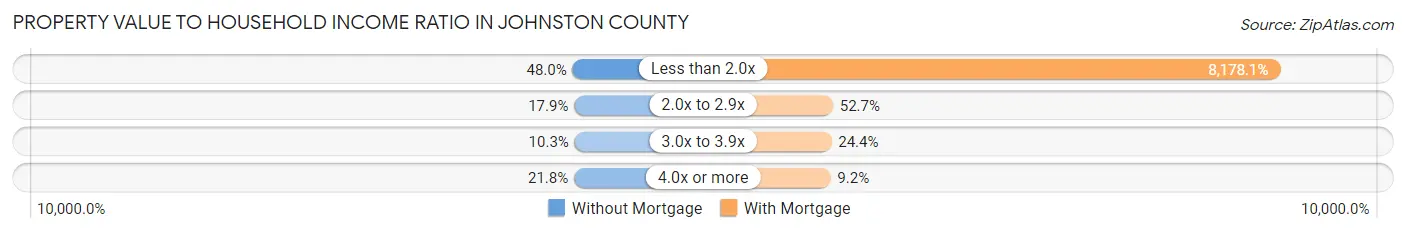
| Value-to-Income Ratio | Without Mortgage | With Mortgage |
| Less than 2.0x | 846 (48.0%) | 79,000 (8,178.1%) |
| 2.0x to 2.9x | 315 (17.9%) | 509 (52.7%) |
| 3.0x to 3.9x | 182 (10.3%) | 236 (24.4%) |
| 4.0x or more | 384 (21.8%) | 89 (9.2%) |
| Total | 1,762 (100.0%) | 966 (100.0%) |
Real Estate Taxes by Mortgage Status in Johnston County
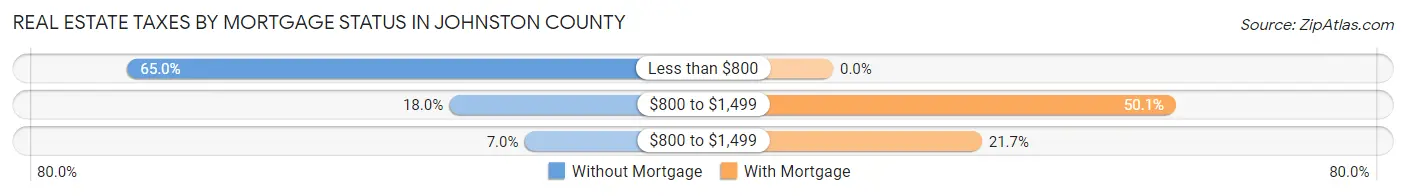
| Property Taxes | Without Mortgage | With Mortgage |
| Less than $800 | 1,145 (65.0%) | 0 (0.0%) |
| $800 to $1,499 | 317 (18.0%) | 484 (50.1%) |
| $800 to $1,499 | 123 (7.0%) | 210 (21.7%) |
| Total | 1,762 (100.0%) | 966 (100.0%) |
Health & Disability in Johnston County
Health Insurance Coverage by Age in Johnston County
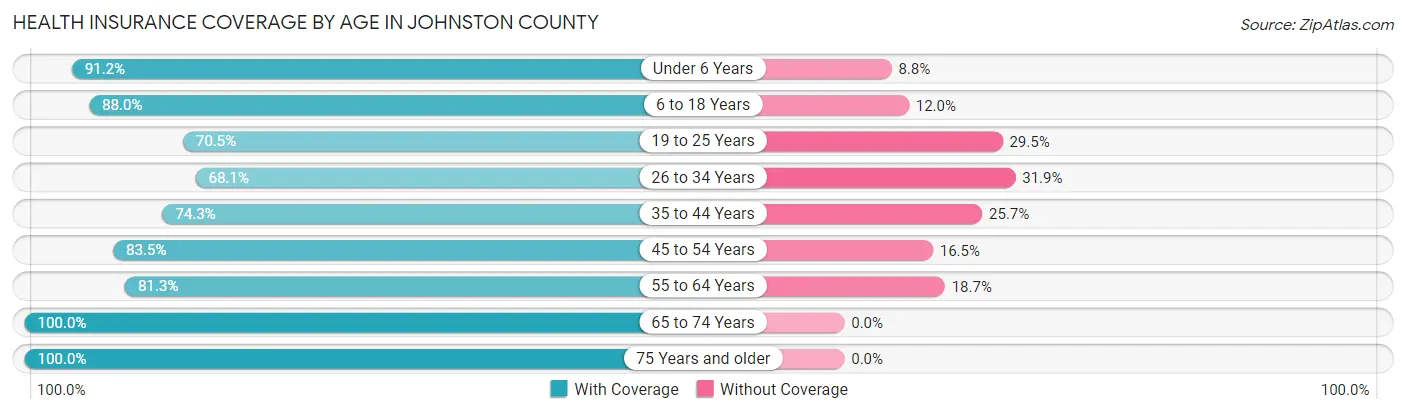
| Age Bracket | With Coverage | Without Coverage |
| Under 6 Years | 664 (91.2%) | 64 (8.8%) |
| 6 to 18 Years | 1,669 (88.0%) | 228 (12.0%) |
| 19 to 25 Years | 712 (70.5%) | 298 (29.5%) |
| 26 to 34 Years | 722 (68.1%) | 338 (31.9%) |
| 35 to 44 Years | 853 (74.3%) | 295 (25.7%) |
| 45 to 54 Years | 997 (83.5%) | 197 (16.5%) |
| 55 to 64 Years | 1,102 (81.3%) | 254 (18.7%) |
| 65 to 74 Years | 1,121 (100.0%) | 0 (0.0%) |
| 75 Years and older | 809 (100.0%) | 0 (0.0%) |
| Total | 8,649 (83.8%) | 1,674 (16.2%) |
Health Insurance Coverage by Citizenship Status in Johnston County
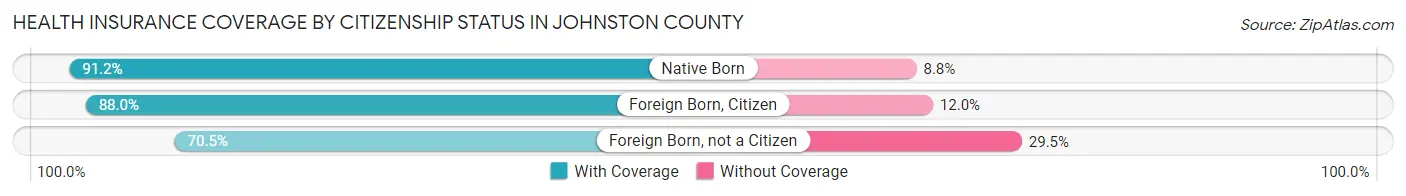
| Citizenship Status | With Coverage | Without Coverage |
| Native Born | 664 (91.2%) | 64 (8.8%) |
| Foreign Born, Citizen | 1,669 (88.0%) | 228 (12.0%) |
| Foreign Born, not a Citizen | 712 (70.5%) | 298 (29.5%) |
Health Insurance Coverage by Household Income in Johnston County
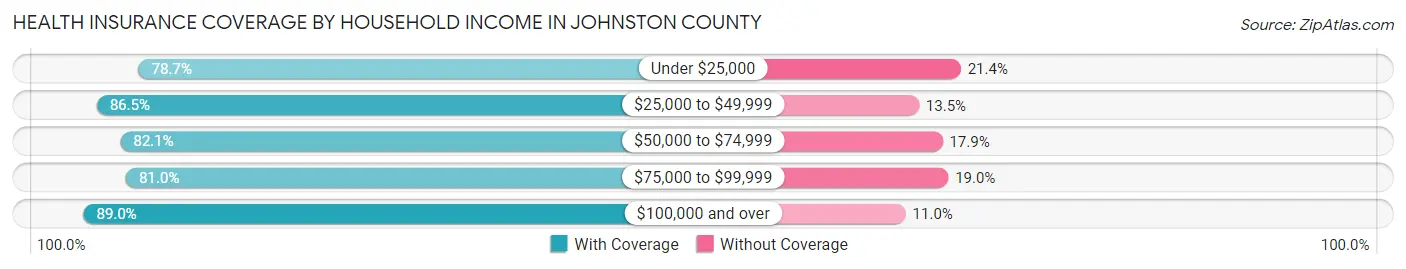
| Household Income | With Coverage | Without Coverage |
| Under $25,000 | 1,595 (78.6%) | 433 (21.3%) |
| $25,000 to $49,999 | 2,042 (86.5%) | 319 (13.5%) |
| $50,000 to $74,999 | 1,543 (82.1%) | 337 (17.9%) |
| $75,000 to $99,999 | 1,181 (81.0%) | 277 (19.0%) |
| $100,000 and over | 2,089 (89.0%) | 259 (11.0%) |
Public vs Private Health Insurance Coverage by Age in Johnston County
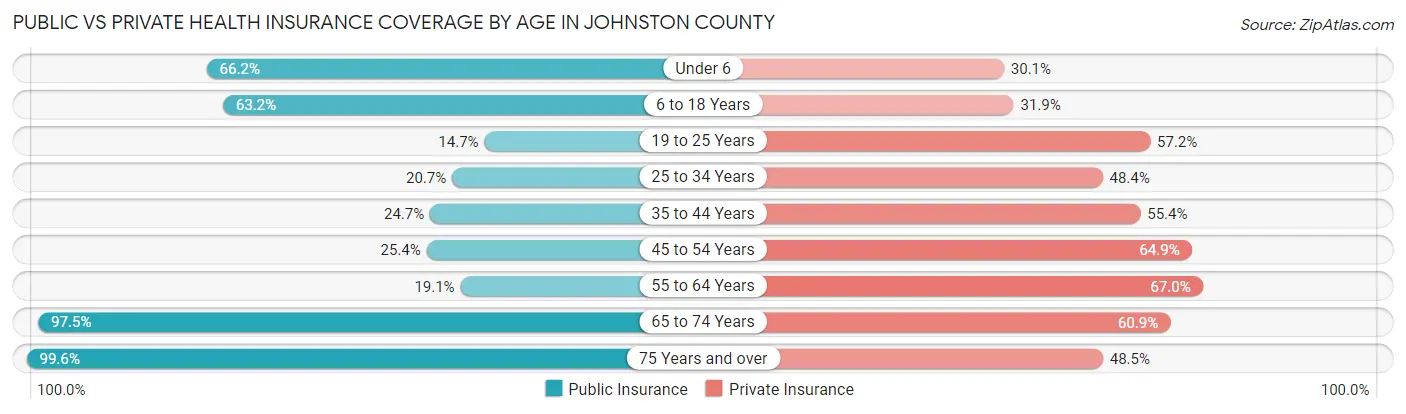
| Age Bracket | Public Insurance | Private Insurance |
| Under 6 | 482 (66.2%) | 219 (30.1%) |
| 6 to 18 Years | 1,199 (63.2%) | 605 (31.9%) |
| 19 to 25 Years | 148 (14.6%) | 578 (57.2%) |
| 25 to 34 Years | 219 (20.7%) | 513 (48.4%) |
| 35 to 44 Years | 284 (24.7%) | 636 (55.4%) |
| 45 to 54 Years | 303 (25.4%) | 775 (64.9%) |
| 55 to 64 Years | 259 (19.1%) | 908 (67.0%) |
| 65 to 74 Years | 1,093 (97.5%) | 683 (60.9%) |
| 75 Years and over | 806 (99.6%) | 392 (48.4%) |
| Total | 4,793 (46.4%) | 5,309 (51.4%) |
Disability Status by Sex by Age in Johnston County
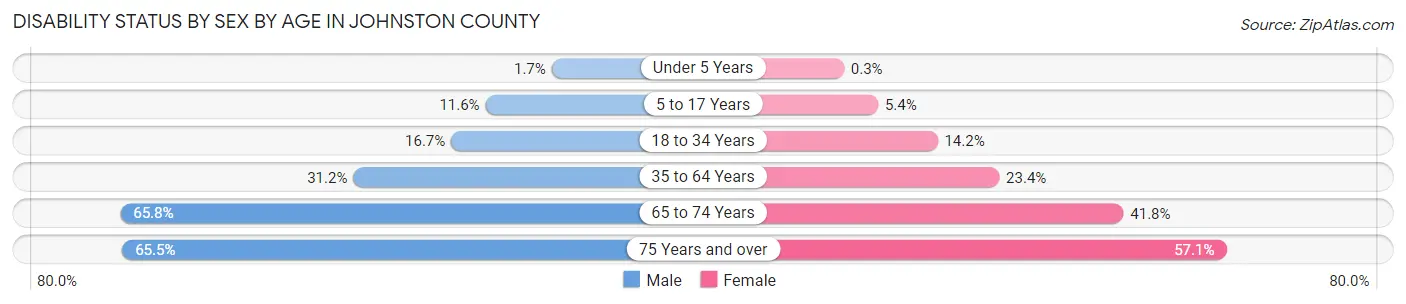
| Age Bracket | Male | Female |
| Under 5 Years | 5 (1.7%) | 1 (0.3%) |
| 5 to 17 Years | 110 (11.6%) | 47 (5.4%) |
| 18 to 34 Years | 196 (16.7%) | 153 (14.2%) |
| 35 to 64 Years | 585 (31.2%) | 426 (23.4%) |
| 65 to 74 Years | 352 (65.8%) | 245 (41.8%) |
| 75 Years and over | 243 (65.5%) | 250 (57.1%) |
Disability Class by Sex by Age in Johnston County
Disability Class: Hearing Difficulty
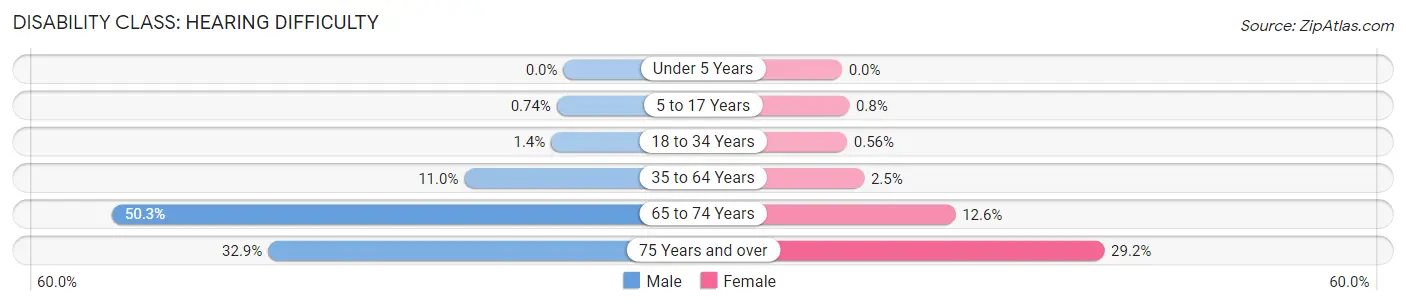
| Age Bracket | Male | Female |
| Under 5 Years | 0 (0.0%) | 0 (0.0%) |
| 5 to 17 Years | 7 (0.7%) | 7 (0.8%) |
| 18 to 34 Years | 16 (1.4%) | 6 (0.6%) |
| 35 to 64 Years | 207 (11.0%) | 45 (2.5%) |
| 65 to 74 Years | 269 (50.3%) | 74 (12.6%) |
| 75 Years and over | 122 (32.9%) | 128 (29.2%) |
Disability Class: Vision Difficulty
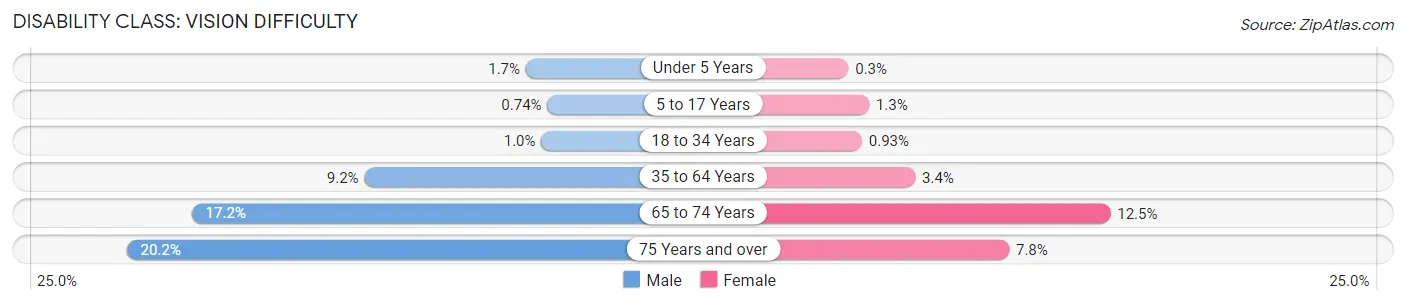
| Age Bracket | Male | Female |
| Under 5 Years | 5 (1.7%) | 1 (0.3%) |
| 5 to 17 Years | 7 (0.7%) | 11 (1.3%) |
| 18 to 34 Years | 12 (1.0%) | 10 (0.9%) |
| 35 to 64 Years | 173 (9.2%) | 62 (3.4%) |
| 65 to 74 Years | 92 (17.2%) | 73 (12.5%) |
| 75 Years and over | 75 (20.2%) | 34 (7.8%) |
Disability Class: Cognitive Difficulty
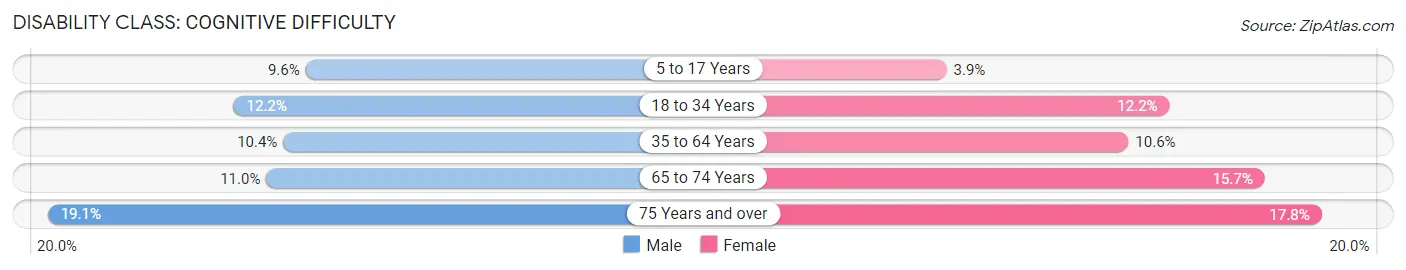
| Age Bracket | Male | Female |
| 5 to 17 Years | 91 (9.6%) | 34 (3.9%) |
| 18 to 34 Years | 144 (12.2%) | 131 (12.2%) |
| 35 to 64 Years | 195 (10.4%) | 194 (10.6%) |
| 65 to 74 Years | 59 (11.0%) | 92 (15.7%) |
| 75 Years and over | 71 (19.1%) | 78 (17.8%) |
Disability Class: Ambulatory Difficulty
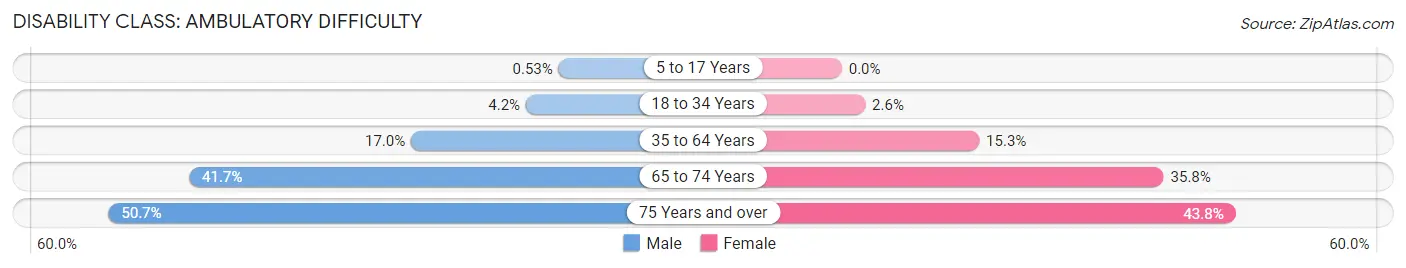
| Age Bracket | Male | Female |
| 5 to 17 Years | 5 (0.5%) | 0 (0.0%) |
| 18 to 34 Years | 49 (4.2%) | 28 (2.6%) |
| 35 to 64 Years | 318 (17.0%) | 279 (15.3%) |
| 65 to 74 Years | 223 (41.7%) | 210 (35.8%) |
| 75 Years and over | 188 (50.7%) | 192 (43.8%) |
Disability Class: Self-Care Difficulty
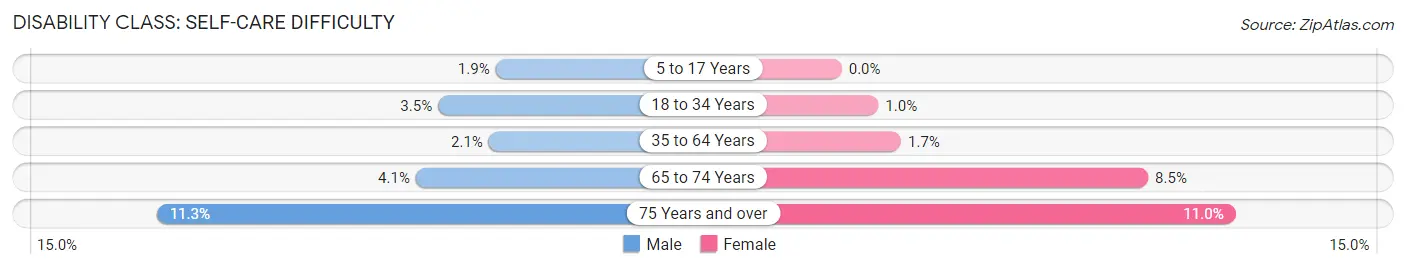
| Age Bracket | Male | Female |
| 5 to 17 Years | 18 (1.9%) | 0 (0.0%) |
| 18 to 34 Years | 41 (3.5%) | 11 (1.0%) |
| 35 to 64 Years | 39 (2.1%) | 30 (1.7%) |
| 65 to 74 Years | 22 (4.1%) | 50 (8.5%) |
| 75 Years and over | 42 (11.3%) | 48 (11.0%) |
Technology Access in Johnston County
Computing Device Access in Johnston County
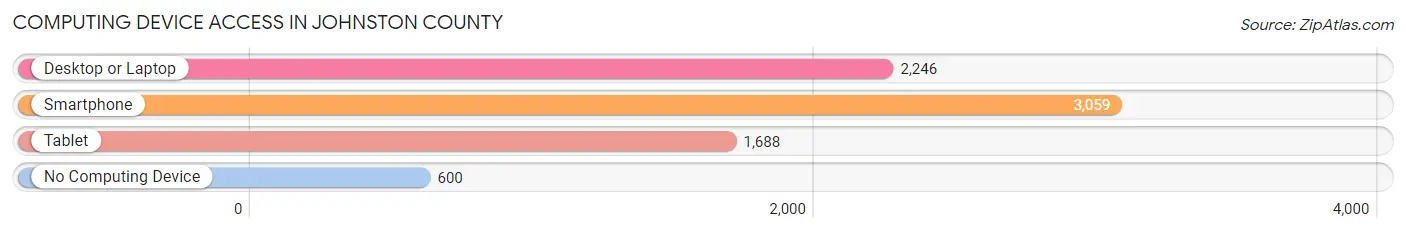
| Device Type | # Households | % Households |
| Desktop or Laptop | 2,246 | 57.8% |
| Smartphone | 3,059 | 78.7% |
| Tablet | 1,688 | 43.4% |
| No Computing Device | 600 | 15.4% |
| Total | 3,889 | 100.0% |
Internet Access in Johnston County
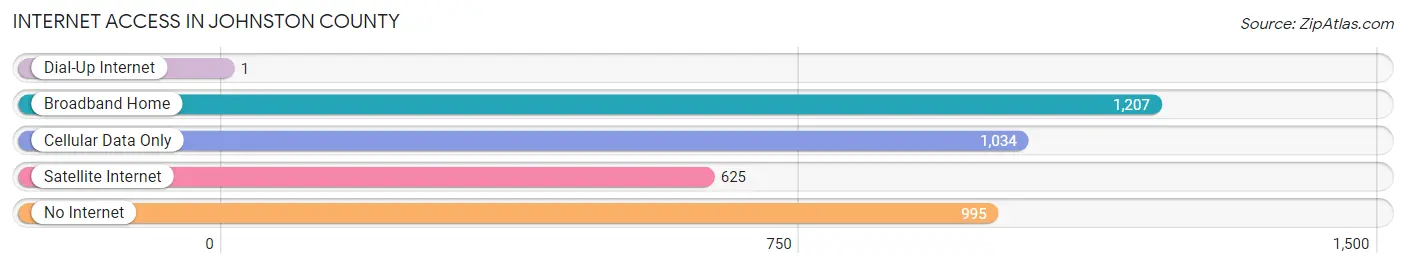
| Internet Type | # Households | % Households |
| Dial-Up Internet | 1 | 0.0% |
| Broadband Home | 1,207 | 31.0% |
| Cellular Data Only | 1,034 | 26.6% |
| Satellite Internet | 625 | 16.1% |
| No Internet | 995 | 25.6% |
| Total | 3,889 | 100.0% |
Johnston County Summary
Johnston County is located in the south-central region of Oklahoma, and is bordered by Marshall County to the north, Pontotoc County to the east, Coal County to the south, and Atoka County to the west. The county seat is Tishomingo, and the county was named for Douglas H. Johnston, the first governor of the Chickasaw Nation.
Geography
Johnston County covers an area of 845 square miles, and is located in the Arbuckle Mountains region of Oklahoma. The county is mostly hilly, with elevations ranging from 600 to 1,400 feet above sea level. The county is drained by the Blue River, which flows through the county from north to south. The county is also home to several small lakes, including Lake Tishomingo, Lake Texoma, and Lake Murray.
Climate
Johnston County has a humid subtropical climate, with hot summers and mild winters. The average annual temperature is around 64°F, and the average annual precipitation is around 40 inches.
Demographics
As of the 2010 census, Johnston County had a population of 10,957. The racial makeup of the county was 81.3% White, 15.2% Native American, 0.5% Black or African American, 0.3% Asian, 0.1% Pacific Islander, and 2.6% from two or more races. Hispanic or Latino of any race were 2.2% of the population.
Economy
Johnston County is largely rural, and the economy is largely based on agriculture. The county is home to several large farms, and the main crops grown in the county are cotton, soybeans, and wheat. The county is also home to several small businesses, including restaurants, retail stores, and service providers.
The county is also home to several large employers, including the Tishomingo National Fish Hatchery, the Johnston County Correctional Center, and the Johnston County Memorial Hospital. The county is also home to several tourist attractions, including the Chickasaw National Recreation Area, the Chickasaw Cultural Center, and the Chickasaw National Wildlife Refuge.
History
Johnston County was created in 1907, and was named for Douglas H. Johnston, the first governor of the Chickasaw Nation. The county was originally part of the Chickasaw Nation, and was home to several Native American tribes, including the Choctaw, Chickasaw, and Seminole.
The county was largely rural until the mid-20th century, when the construction of Lake Texoma and the Tishomingo National Fish Hatchery brought new economic opportunities to the area. The county has since become a popular tourist destination, and is home to several tourist attractions, including the Chickasaw National Recreation Area, the Chickasaw Cultural Center, and the Chickasaw National Wildlife Refuge.
Common Questions
What is Per Capita Income in Johnston County?
Per Capita income in Johnston County is $24,457.
What is the Median Family Income in Johnston County?
Median Family Income in Johnston County is $56,875.
What is the Median Household income in Johnston County?
Median Household Income in Johnston County is $48,476.
What is Income or Wage Gap in Johnston County?
Income or Wage Gap in Johnston County is 26.6%.
Women in Johnston County earn 73.4 cents for every dollar earned by a man.
What is Family Income Deficit in Johnston County?
Family Income Deficit in Johnston County is $12,358.
Families that are below poverty line in Johnston County earn $12,358 less on average than the poverty threshold level.
What is Inequality or Gini Index in Johnston County?
Inequality or Gini Index in Johnston County is 0.44.
What is the Total Population of Johnston County?
Total Population of Johnston County is 10,410.
What is the Total Male Population of Johnston County?
Total Male Population of Johnston County is 5,254.
What is the Total Female Population of Johnston County?
Total Female Population of Johnston County is 5,156.
What is the Ratio of Males per 100 Females in Johnston County?
There are 101.90 Males per 100 Females in Johnston County.
What is the Ratio of Females per 100 Males in Johnston County?
There are 98.13 Females per 100 Males in Johnston County.
What is the Median Population Age in Johnston County?
Median Population Age in Johnston County is 39.5 Years.
What is the Average Family Size in Johnston County
Average Family Size in Johnston County is 3.1 People.
What is the Average Household Size in Johnston County
Average Household Size in Johnston County is 2.6 People.
How Large is the Labor Force in Johnston County?
There are 4,037 People in the Labor Forcein in Johnston County.
What is the Percentage of People in the Labor Force in Johnston County?
49.1% of People are in the Labor Force in Johnston County.
What is the Unemployment Rate in Johnston County?
Unemployment Rate in Johnston County is 5.5%.