Haskell County, OK Map & Demographics
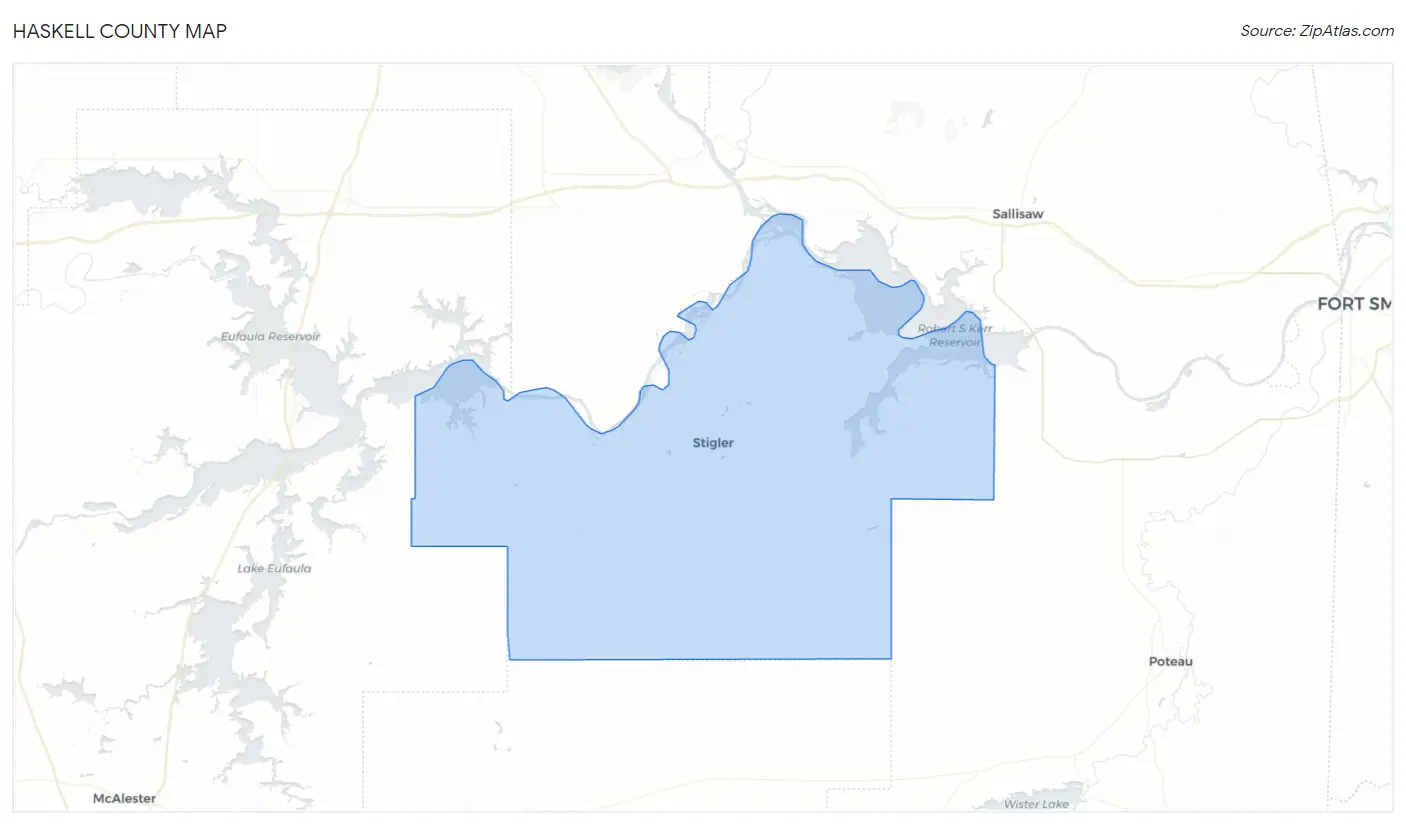
Haskell County Map
Haskell County Overview
$25,234
PER CAPITA INCOME
$58,261
AVG FAMILY INCOME
$46,239
AVG HOUSEHOLD INCOME
30.9%
WAGE / INCOME GAP [ % ]
69.1¢/ $1
WAGE / INCOME GAP [ $ ]
$10,579
FAMILY INCOME DEFICIT
0.46
INEQUALITY / GINI INDEX
11,651
TOTAL POPULATION
5,811
MALE POPULATION
5,840
FEMALE POPULATION
99.50
MALES / 100 FEMALES
100.50
FEMALES / 100 MALES
41.3
MEDIAN AGE
3.1
AVG FAMILY SIZE
2.6
AVG HOUSEHOLD SIZE
4,881
LABOR FORCE [ PEOPLE ]
52.7%
PERCENT IN LABOR FORCE
7.7%
UNEMPLOYMENT RATE
Haskell County Area Codes
Income in Haskell County
Income Overview in Haskell County
Per Capita Income in Haskell County is $25,234, while median incomes of families and households are $58,261 and $46,239 respectively.
| Characteristic | Number | Measure |
| Per Capita Income | 11,651 | $25,234 |
| Median Family Income | 3,136 | $58,261 |
| Mean Family Income | 3,136 | $75,204 |
| Median Household Income | 4,518 | $46,239 |
| Mean Household Income | 4,518 | $62,912 |
| Income Deficit | 3,136 | $10,579 |
| Wage / Income Gap (%) | 11,651 | 30.88% |
| Wage / Income Gap ($) | 11,651 | 69.12¢ per $1 |
| Gini / Inequality Index | 11,651 | 0.46 |
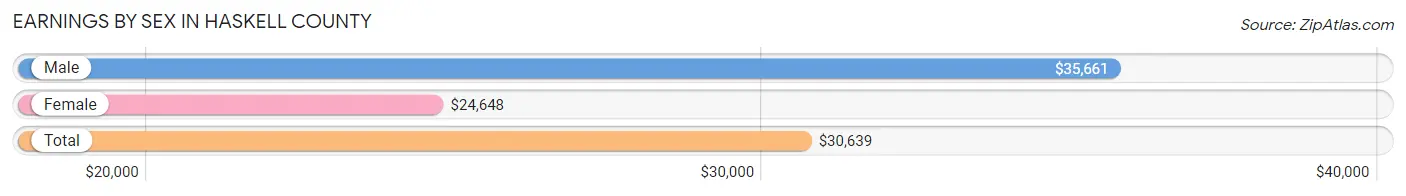
Earnings by Sex in Haskell County
Average Earnings in Haskell County are $30,639, $35,661 for men and $24,648 for women, a difference of 30.9%.
| Sex | Number | Average Earnings |
| Male | 2,736 (52.6%) | $35,661 |
| Female | 2,467 (47.4%) | $24,648 |
| Total | 5,203 (100.0%) | $30,639 |
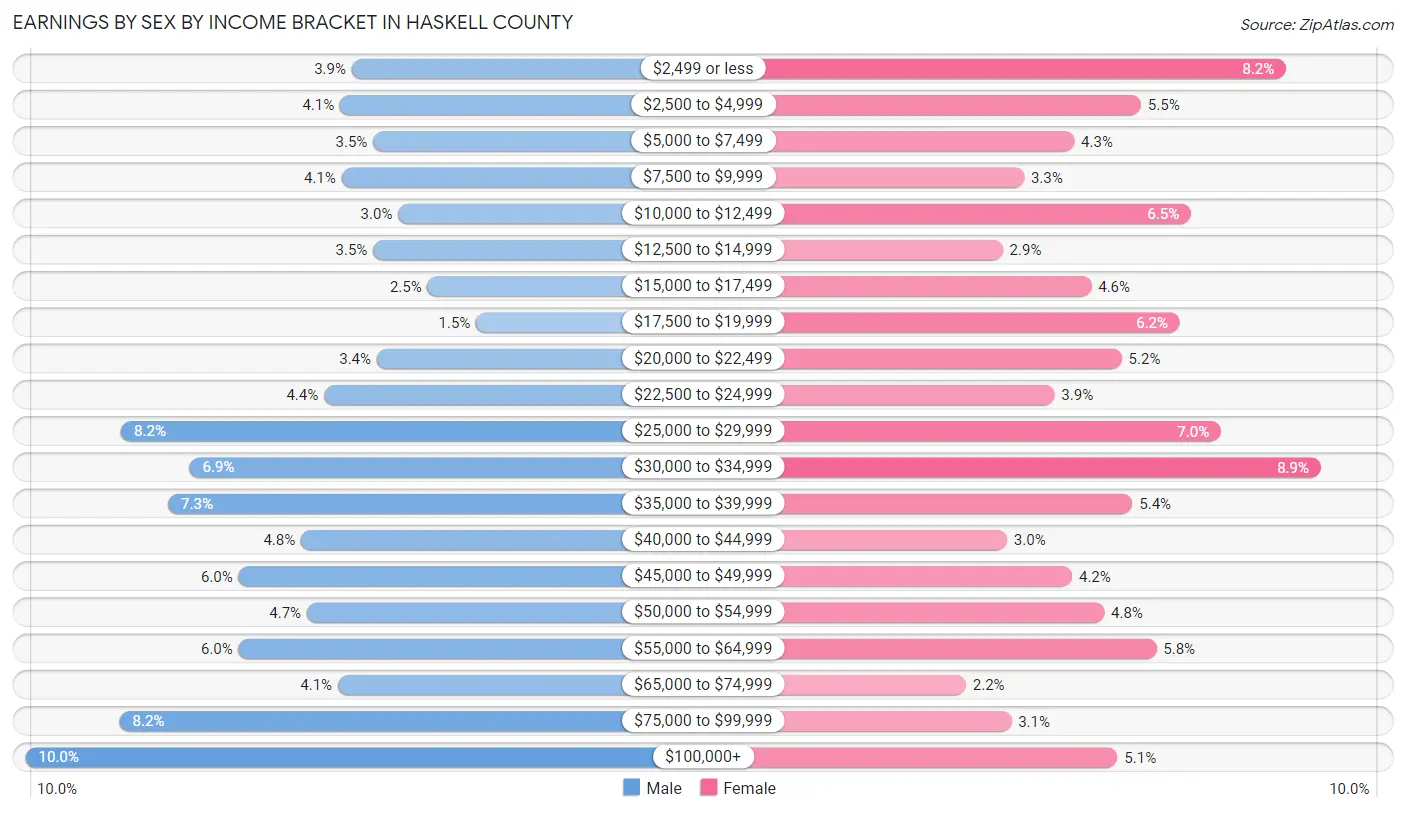
Earnings by Sex by Income Bracket in Haskell County
The most common earnings brackets in Haskell County are $100,000+ for men (273 | 10.0%) and $30,000 to $34,999 for women (219 | 8.9%).
| Income | Male | Female |
| $2,499 or less | 106 (3.9%) | 203 (8.2%) |
| $2,500 to $4,999 | 112 (4.1%) | 136 (5.5%) |
| $5,000 to $7,499 | 95 (3.5%) | 105 (4.3%) |
| $7,500 to $9,999 | 111 (4.1%) | 82 (3.3%) |
| $10,000 to $12,499 | 82 (3.0%) | 159 (6.5%) |
| $12,500 to $14,999 | 95 (3.5%) | 72 (2.9%) |
| $15,000 to $17,499 | 67 (2.5%) | 113 (4.6%) |
| $17,500 to $19,999 | 42 (1.5%) | 154 (6.2%) |
| $20,000 to $22,499 | 93 (3.4%) | 127 (5.1%) |
| $22,500 to $24,999 | 120 (4.4%) | 96 (3.9%) |
| $25,000 to $29,999 | 224 (8.2%) | 173 (7.0%) |
| $30,000 to $34,999 | 189 (6.9%) | 219 (8.9%) |
| $35,000 to $39,999 | 200 (7.3%) | 132 (5.3%) |
| $40,000 to $44,999 | 132 (4.8%) | 74 (3.0%) |
| $45,000 to $49,999 | 164 (6.0%) | 104 (4.2%) |
| $50,000 to $54,999 | 129 (4.7%) | 119 (4.8%) |
| $55,000 to $64,999 | 164 (6.0%) | 143 (5.8%) |
| $65,000 to $74,999 | 113 (4.1%) | 55 (2.2%) |
| $75,000 to $99,999 | 225 (8.2%) | 76 (3.1%) |
| $100,000+ | 273 (10.0%) | 125 (5.1%) |
| Total | 2,736 (100.0%) | 2,467 (100.0%) |
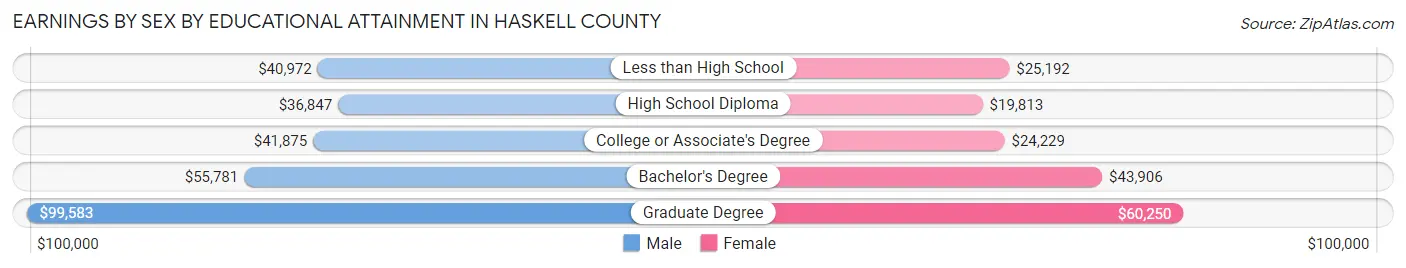
Earnings by Sex by Educational Attainment in Haskell County
Average earnings in Haskell County are $40,601 for men and $28,363 for women, a difference of 30.1%. Men with an educational attainment of graduate degree enjoy the highest average annual earnings of $99,583, while those with high school diploma education earn the least with $36,847. Women with an educational attainment of graduate degree earn the most with the average annual earnings of $60,250, while those with high school diploma education have the smallest earnings of $19,813.
| Educational Attainment | Male Income | Female Income |
| Less than High School | $40,972 | $25,192 |
| High School Diploma | $36,847 | $19,813 |
| College or Associate's Degree | $41,875 | $24,229 |
| Bachelor's Degree | $55,781 | $43,906 |
| Graduate Degree | $99,583 | $60,250 |
| Total | $40,601 | $28,363 |
Family Income in Haskell County
Family Income Brackets in Haskell County
According to the Haskell County family income data, there are 640 families falling into the $50,000 to $74,999 income range, which is the most common income bracket and makes up 20.4% of all families. Conversely, the less than $10,000 income bracket is the least frequent group with only 132 families (4.2%) belonging to this category.
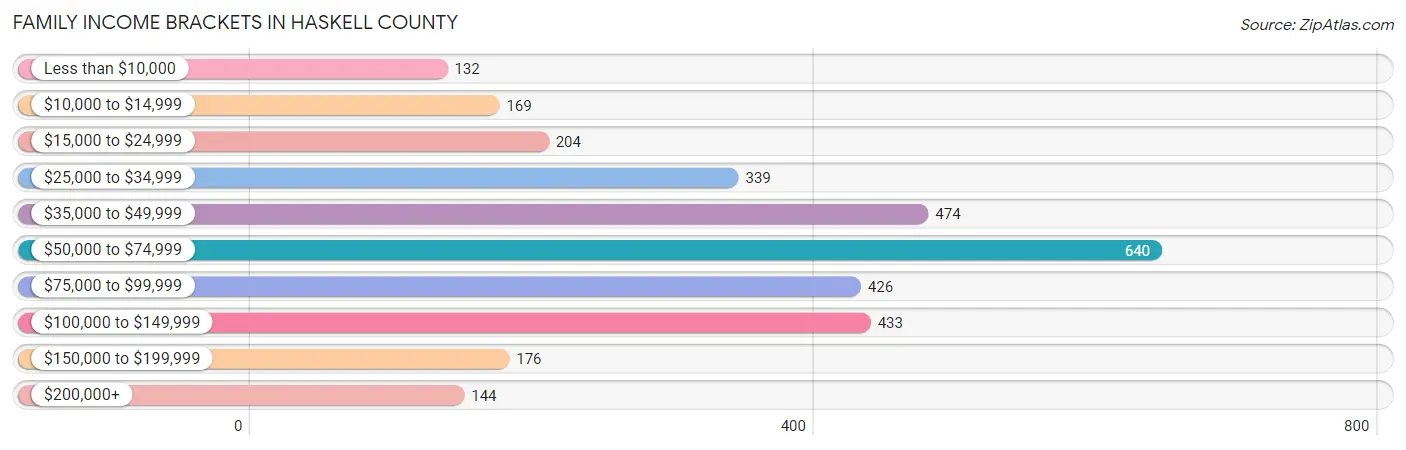
| Income Bracket | # Families | % Families |
| Less than $10,000 | 132 | 4.2% |
| $10,000 to $14,999 | 169 | 5.4% |
| $15,000 to $24,999 | 204 | 6.5% |
| $25,000 to $34,999 | 339 | 10.8% |
| $35,000 to $49,999 | 474 | 15.1% |
| $50,000 to $74,999 | 640 | 20.4% |
| $75,000 to $99,999 | 426 | 13.6% |
| $100,000 to $149,999 | 433 | 13.8% |
| $150,000 to $199,999 | 176 | 5.6% |
| $200,000+ | 144 | 4.6% |
Family Income by Famaliy Size in Haskell County
7+ person families (85 | 2.7%) account for the highest median family income in Haskell County with $82,557 per family, while 2-person families (1,534 | 48.9%) have the highest median income of $29,239 per family member.
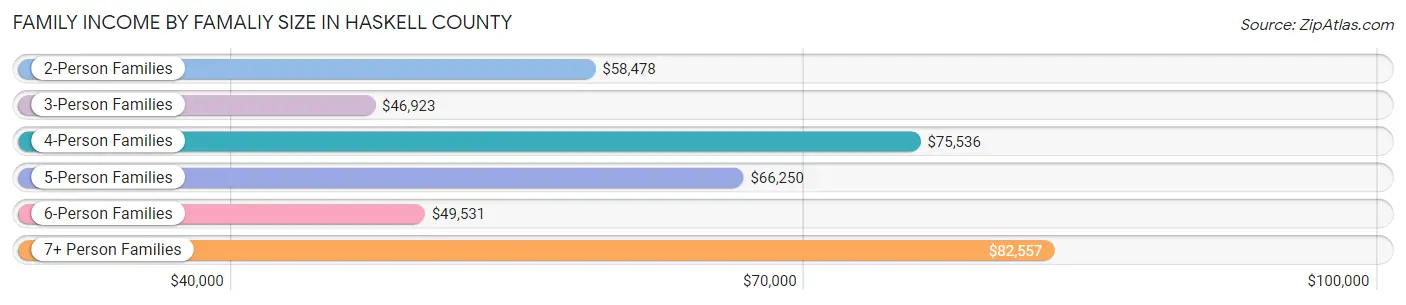
| Income Bracket | # Families | Median Income |
| 2-Person Families | 1,534 (48.9%) | $58,478 |
| 3-Person Families | 694 (22.1%) | $46,923 |
| 4-Person Families | 477 (15.2%) | $75,536 |
| 5-Person Families | 220 (7.0%) | $66,250 |
| 6-Person Families | 126 (4.0%) | $49,531 |
| 7+ Person Families | 85 (2.7%) | $82,557 |
| Total | 3,136 (100.0%) | $58,261 |
Family Income by Number of Earners in Haskell County
The median family income in Haskell County is $58,261, with families comprising 3+ earners (242) having the highest median family income of $110,000, while families with no earners (651) have the lowest median family income of $33,523, accounting for 7.7% and 20.8% of families, respectively.
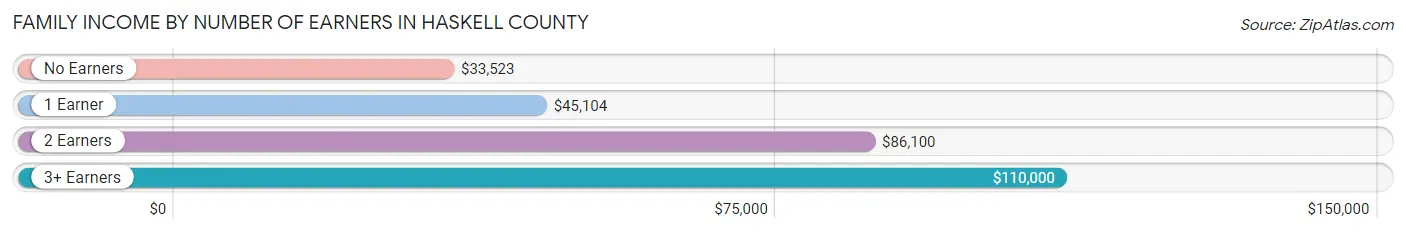
| Number of Earners | # Families | Median Income |
| No Earners | 651 (20.8%) | $33,523 |
| 1 Earner | 1,101 (35.1%) | $45,104 |
| 2 Earners | 1,142 (36.4%) | $86,100 |
| 3+ Earners | 242 (7.7%) | $110,000 |
| Total | 3,136 (100.0%) | $58,261 |
Household Income in Haskell County
Household Income Brackets in Haskell County
With 809 households falling in the category, the $50,000 to $74,999 income range is the most frequent in Haskell County, accounting for 17.9% of all households. In contrast, only 158 households (3.5%) fall into the $200,000+ income bracket, making it the least populous group.
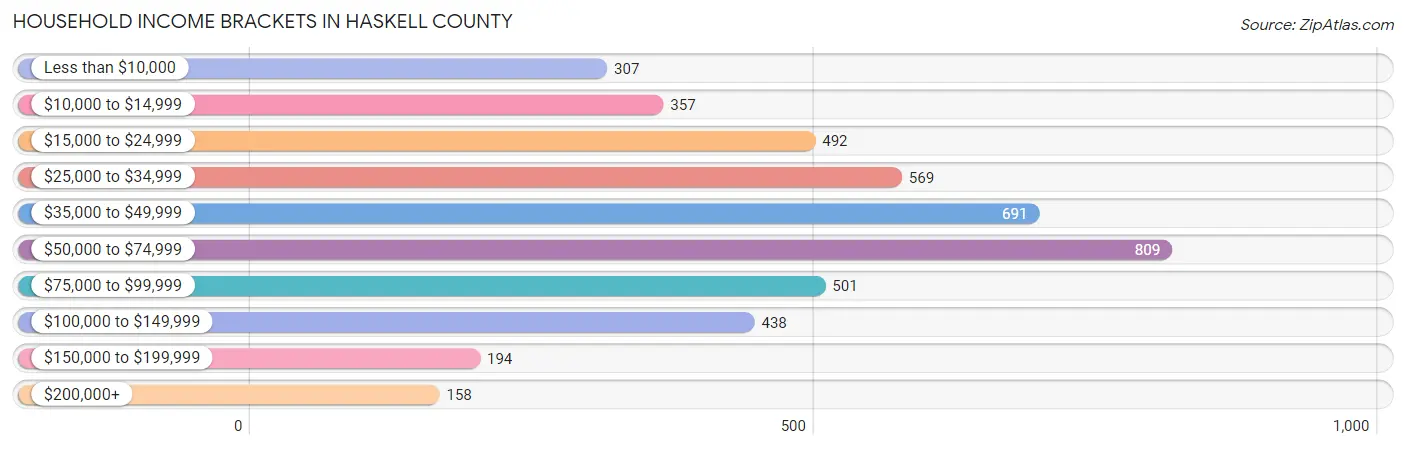
| Income Bracket | # Households | % Households |
| Less than $10,000 | 307 | 6.8% |
| $10,000 to $14,999 | 357 | 7.9% |
| $15,000 to $24,999 | 492 | 10.9% |
| $25,000 to $34,999 | 569 | 12.6% |
| $35,000 to $49,999 | 691 | 15.3% |
| $50,000 to $74,999 | 809 | 17.9% |
| $75,000 to $99,999 | 501 | 11.1% |
| $100,000 to $149,999 | 438 | 9.7% |
| $150,000 to $199,999 | 194 | 4.3% |
| $200,000+ | 158 | 3.5% |
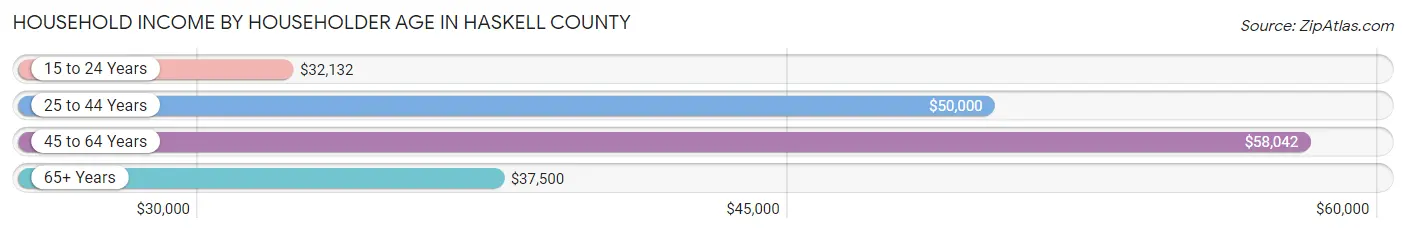
Household Income by Householder Age in Haskell County
The median household income in Haskell County is $46,239, with the highest median household income of $58,042 found in the 45 to 64 years age bracket for the primary householder. A total of 1,555 households (34.4%) fall into this category. Meanwhile, the 15 to 24 years age bracket for the primary householder has the lowest median household income of $32,132, with 161 households (3.6%) in this group.
| Income Bracket | # Households | Median Income |
| 15 to 24 Years | 161 (3.6%) | $32,132 |
| 25 to 44 Years | 1,282 (28.4%) | $50,000 |
| 45 to 64 Years | 1,555 (34.4%) | $58,042 |
| 65+ Years | 1,520 (33.6%) | $37,500 |
| Total | 4,518 (100.0%) | $46,239 |
Poverty in Haskell County
Income Below Poverty by Sex and Age in Haskell County
With 17.7% poverty level for males and 25.1% for females among the residents of Haskell County, under 5 year old males and under 5 year old females are the most vulnerable to poverty, with 109 males (34.4%) and 142 females (43.6%) in their respective age groups living below the poverty level.
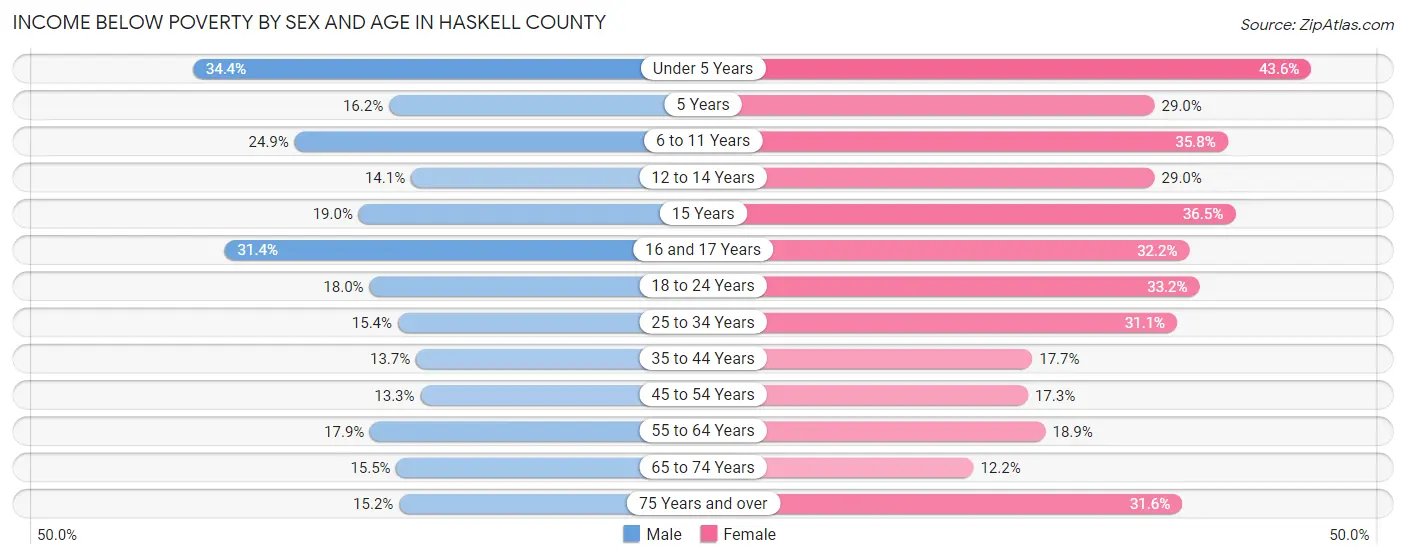
| Age Bracket | Male | Female |
| Under 5 Years | 109 (34.4%) | 142 (43.6%) |
| 5 Years | 11 (16.2%) | 18 (29.0%) |
| 6 to 11 Years | 108 (24.9%) | 150 (35.8%) |
| 12 to 14 Years | 41 (14.1%) | 72 (29.0%) |
| 15 Years | 15 (19.0%) | 27 (36.5%) |
| 16 and 17 Years | 55 (31.4%) | 49 (32.2%) |
| 18 to 24 Years | 92 (18.0%) | 140 (33.2%) |
| 25 to 34 Years | 96 (15.4%) | 200 (31.1%) |
| 35 to 44 Years | 104 (13.7%) | 119 (17.7%) |
| 45 to 54 Years | 88 (13.3%) | 117 (17.3%) |
| 55 to 64 Years | 132 (17.9%) | 159 (18.9%) |
| 65 to 74 Years | 101 (15.5%) | 83 (12.2%) |
| 75 Years and over | 66 (15.2%) | 173 (31.6%) |
| Total | 1,018 (17.7%) | 1,449 (25.1%) |
Income Above Poverty by Sex and Age in Haskell County
According to the poverty statistics in Haskell County, males aged 45 to 54 years and females aged 65 to 74 years are the age groups that are most secure financially, with 86.7% of males and 87.8% of females in these age groups living above the poverty line.
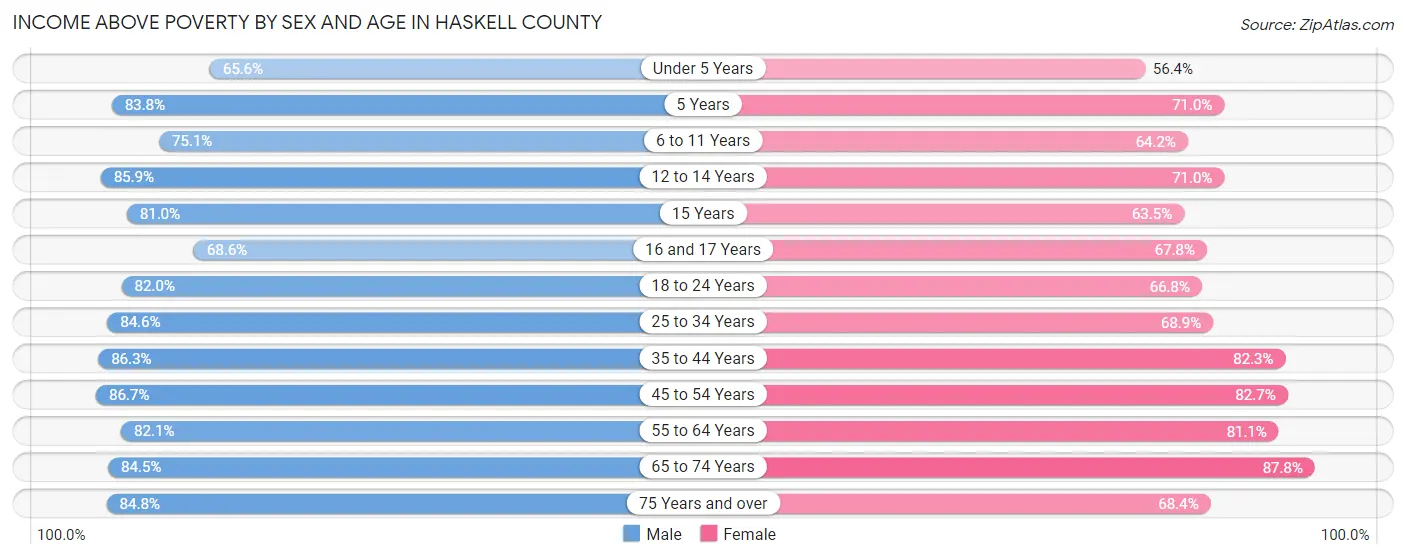
| Age Bracket | Male | Female |
| Under 5 Years | 208 (65.6%) | 184 (56.4%) |
| 5 Years | 57 (83.8%) | 44 (71.0%) |
| 6 to 11 Years | 325 (75.1%) | 269 (64.2%) |
| 12 to 14 Years | 249 (85.9%) | 176 (71.0%) |
| 15 Years | 64 (81.0%) | 47 (63.5%) |
| 16 and 17 Years | 120 (68.6%) | 103 (67.8%) |
| 18 to 24 Years | 419 (82.0%) | 282 (66.8%) |
| 25 to 34 Years | 529 (84.6%) | 443 (68.9%) |
| 35 to 44 Years | 657 (86.3%) | 554 (82.3%) |
| 45 to 54 Years | 575 (86.7%) | 560 (82.7%) |
| 55 to 64 Years | 604 (82.1%) | 682 (81.1%) |
| 65 to 74 Years | 551 (84.5%) | 596 (87.8%) |
| 75 Years and over | 367 (84.8%) | 375 (68.4%) |
| Total | 4,725 (82.3%) | 4,315 (74.9%) |
Income Below Poverty Among Married-Couple Families in Haskell County
The poverty statistics for married-couple families in Haskell County show that 11.6% or 282 of the total 2,427 families live below the poverty line. Families with 5 or more children have the highest poverty rate of 64.9%, comprising of 24 families. On the other hand, families with no children have the lowest poverty rate of 8.0%, which includes 121 families.
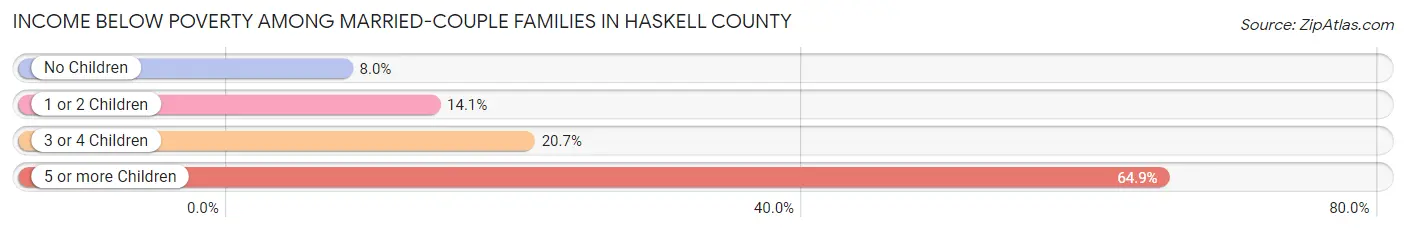
| Children | Above Poverty | Below Poverty |
| No Children | 1,395 (92.0%) | 121 (8.0%) |
| 1 or 2 Children | 568 (85.9%) | 93 (14.1%) |
| 3 or 4 Children | 169 (79.3%) | 44 (20.7%) |
| 5 or more Children | 13 (35.1%) | 24 (64.9%) |
| Total | 2,145 (88.4%) | 282 (11.6%) |
Income Below Poverty Among Single-Parent Households in Haskell County
According to the poverty data in Haskell County, 25.7% or 66 single-father households and 38.7% or 175 single-mother households are living below the poverty line. Among single-father households, those with no children have the highest poverty rate, with 50 households (39.1%) experiencing poverty. Likewise, among single-mother households, those with 3 or 4 children have the highest poverty rate, with 49 households (89.1%) falling below the poverty line.
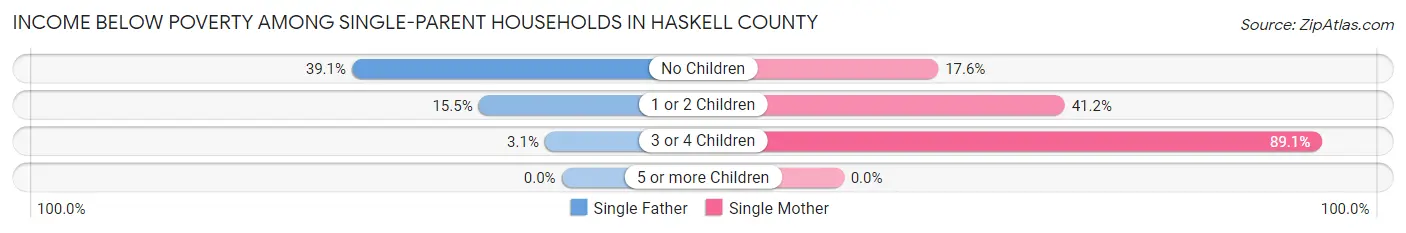
| Children | Single Father | Single Mother |
| No Children | 50 (39.1%) | 28 (17.6%) |
| 1 or 2 Children | 15 (15.5%) | 98 (41.2%) |
| 3 or 4 Children | 1 (3.1%) | 49 (89.1%) |
| 5 or more Children | 0 (0.0%) | 0 (0.0%) |
| Total | 66 (25.7%) | 175 (38.7%) |
Income Below Poverty Among Married-Couple vs Single-Parent Households in Haskell County
The poverty data for Haskell County shows that 282 of the married-couple family households (11.6%) and 241 of the single-parent households (34.0%) are living below the poverty level. Within the married-couple family households, those with 5 or more children have the highest poverty rate, with 24 households (64.9%) falling below the poverty line. Among the single-parent households, those with 3 or 4 children have the highest poverty rate, with 50 household (57.5%) living below poverty.
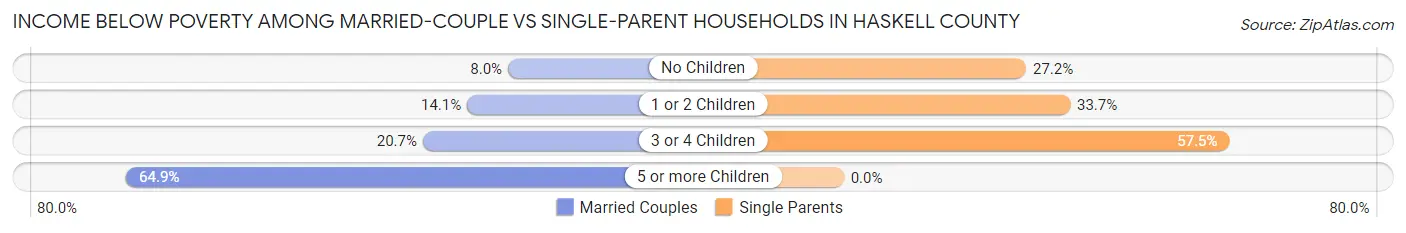
| Children | Married-Couple Families | Single-Parent Households |
| No Children | 121 (8.0%) | 78 (27.2%) |
| 1 or 2 Children | 93 (14.1%) | 113 (33.7%) |
| 3 or 4 Children | 44 (20.7%) | 50 (57.5%) |
| 5 or more Children | 24 (64.9%) | 0 (0.0%) |
| Total | 282 (11.6%) | 241 (34.0%) |
Race in Haskell County
The most populous races in Haskell County are White / Caucasian (8,147 | 69.9%), Two or more Races (1,891 | 16.2%), and Native / Alaskan (1,318 | 11.3%).
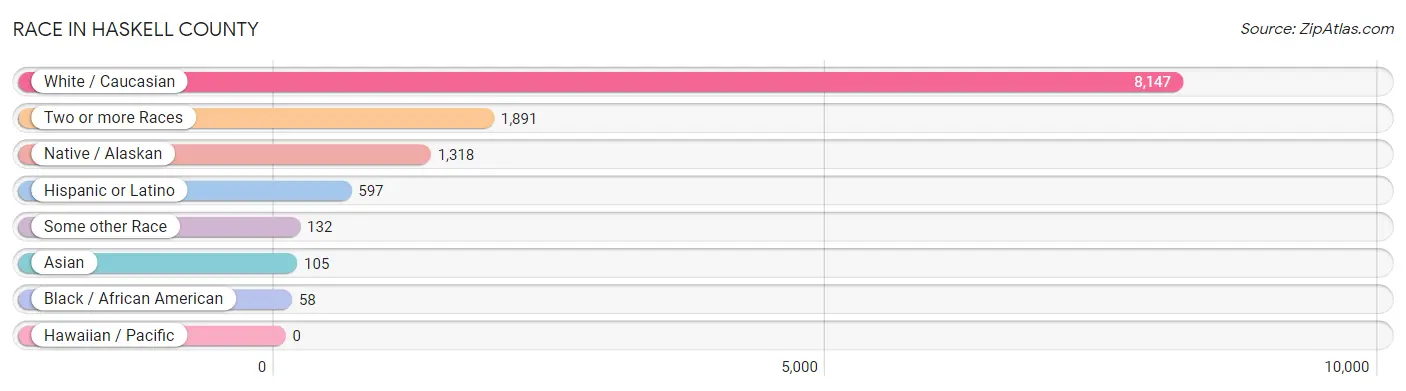
| Race | # Population | % Population |
| Asian | 105 | 0.9% |
| Black / African American | 58 | 0.5% |
| Hawaiian / Pacific | 0 | 0.0% |
| Hispanic or Latino | 597 | 5.1% |
| Native / Alaskan | 1,318 | 11.3% |
| White / Caucasian | 8,147 | 69.9% |
| Two or more Races | 1,891 | 16.2% |
| Some other Race | 132 | 1.1% |
| Total | 11,651 | 100.0% |
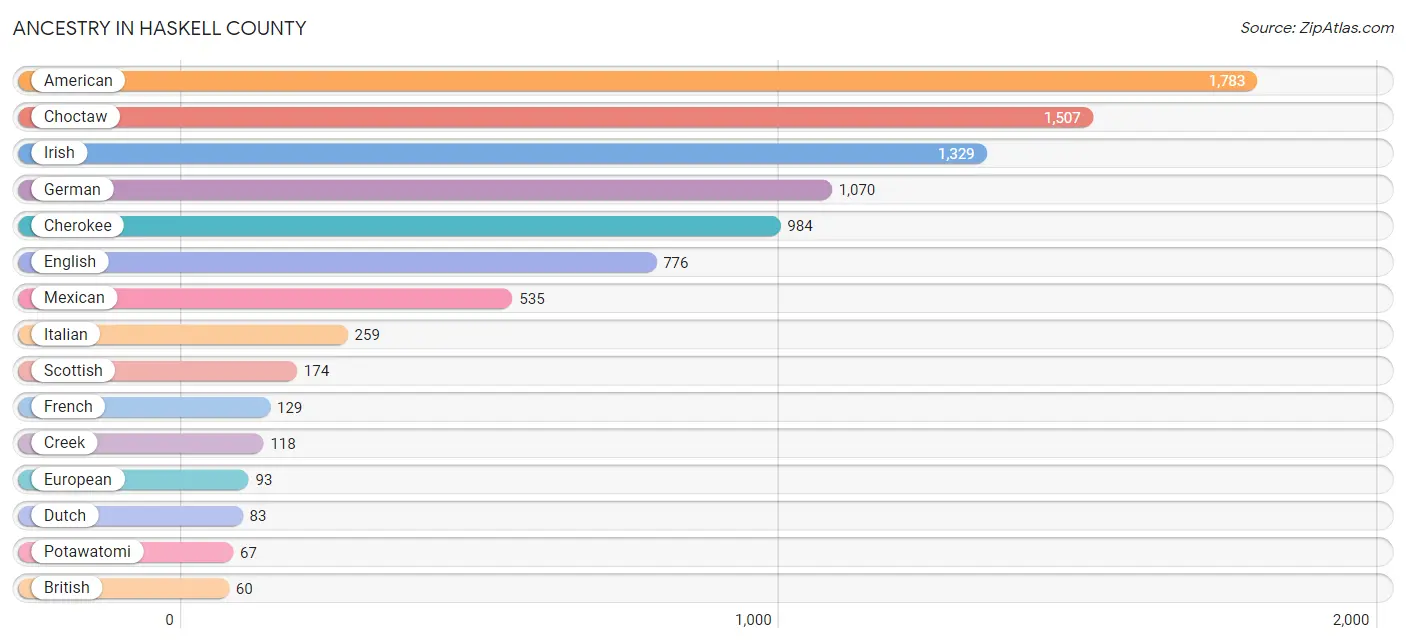
Ancestry in Haskell County
The most populous ancestries reported in Haskell County are American (1,783 | 15.3%), Choctaw (1,507 | 12.9%), Irish (1,329 | 11.4%), German (1,070 | 9.2%), and Cherokee (984 | 8.5%), together accounting for 57.3% of all Haskell County residents.
| Ancestry | # Population | % Population |
| American | 1,783 | 15.3% |
| Apache | 36 | 0.3% |
| Australian | 10 | 0.1% |
| Bangladeshi | 43 | 0.4% |
| Belgian | 1 | 0.0% |
| Bhutanese | 1 | 0.0% |
| Blackfeet | 13 | 0.1% |
| British | 60 | 0.5% |
| Central American | 9 | 0.1% |
| Cherokee | 984 | 8.5% |
| Chickasaw | 44 | 0.4% |
| Choctaw | 1,507 | 12.9% |
| Comanche | 2 | 0.0% |
| Creek | 118 | 1.0% |
| Cuban | 1 | 0.0% |
| Czech | 19 | 0.2% |
| Czechoslovakian | 3 | 0.0% |
| Danish | 4 | 0.0% |
| Delaware | 9 | 0.1% |
| Dutch | 83 | 0.7% |
| Dutch West Indian | 48 | 0.4% |
| Eastern European | 13 | 0.1% |
| English | 776 | 6.7% |
| European | 93 | 0.8% |
| Finnish | 10 | 0.1% |
| French | 129 | 1.1% |
| French American Indian | 4 | 0.0% |
| French Canadian | 8 | 0.1% |
| German | 1,070 | 9.2% |
| Greek | 9 | 0.1% |
| Hungarian | 29 | 0.3% |
| Indian (Asian) | 6 | 0.1% |
| Iranian | 2 | 0.0% |
| Irish | 1,329 | 11.4% |
| Iroquois | 3 | 0.0% |
| Italian | 259 | 2.2% |
| Kiowa | 9 | 0.1% |
| Korean | 38 | 0.3% |
| Latvian | 7 | 0.1% |
| Malaysian | 49 | 0.4% |
| Mexican | 535 | 4.6% |
| Navajo | 29 | 0.3% |
| Norwegian | 26 | 0.2% |
| Pennsylvania German | 12 | 0.1% |
| Polish | 40 | 0.3% |
| Portuguese | 13 | 0.1% |
| Potawatomi | 67 | 0.6% |
| Puerto Rican | 15 | 0.1% |
| Russian | 16 | 0.1% |
| Salvadoran | 9 | 0.1% |
| Scandinavian | 35 | 0.3% |
| Scotch-Irish | 57 | 0.5% |
| Scottish | 174 | 1.5% |
| Seminole | 5 | 0.0% |
| Sioux | 3 | 0.0% |
| Spaniard | 2 | 0.0% |
| Spanish | 8 | 0.1% |
| Sri Lankan | 17 | 0.2% |
| Swedish | 24 | 0.2% |
| Welsh | 22 | 0.2% | View All 60 Rows |
Immigrants in Haskell County
The most numerous immigrant groups reported in Haskell County came from Central America (197 | 1.7%), Latin America (197 | 1.7%), Mexico (192 | 1.7%), Asia (83 | 0.7%), and South Eastern Asia (75 | 0.6%), together accounting for 6.4% of all Haskell County residents.
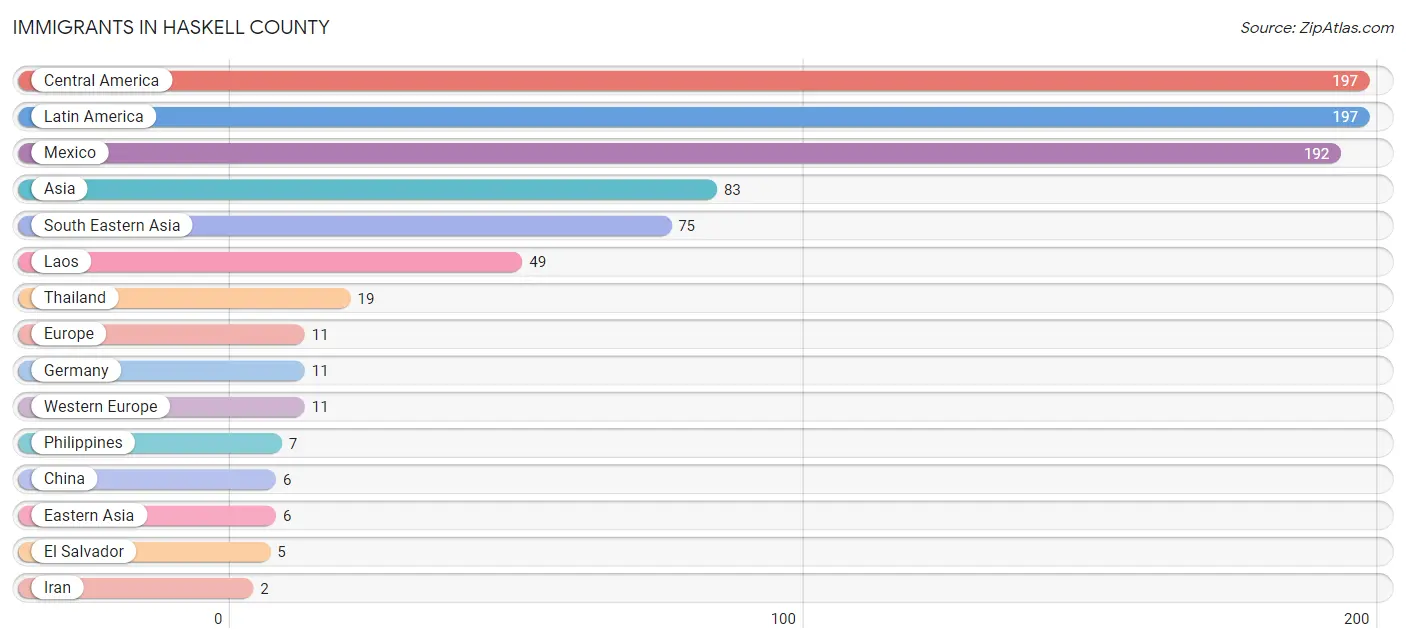
| Immigration Origin | # Population | % Population |
| Asia | 83 | 0.7% |
| Australia | 1 | 0.0% |
| Central America | 197 | 1.7% |
| China | 6 | 0.1% |
| Eastern Asia | 6 | 0.1% |
| El Salvador | 5 | 0.0% |
| Europe | 11 | 0.1% |
| Germany | 11 | 0.1% |
| Iran | 2 | 0.0% |
| Laos | 49 | 0.4% |
| Latin America | 197 | 1.7% |
| Mexico | 192 | 1.7% |
| Oceania | 1 | 0.0% |
| Philippines | 7 | 0.1% |
| South Central Asia | 2 | 0.0% |
| South Eastern Asia | 75 | 0.6% |
| Thailand | 19 | 0.2% |
| Western Europe | 11 | 0.1% | View All 18 Rows |
Sex and Age in Haskell County
Sex and Age in Haskell County
The most populous age groups in Haskell County are 10 to 14 Years (429 | 7.4%) for men and 55 to 59 Years (430 | 7.4%) for women.
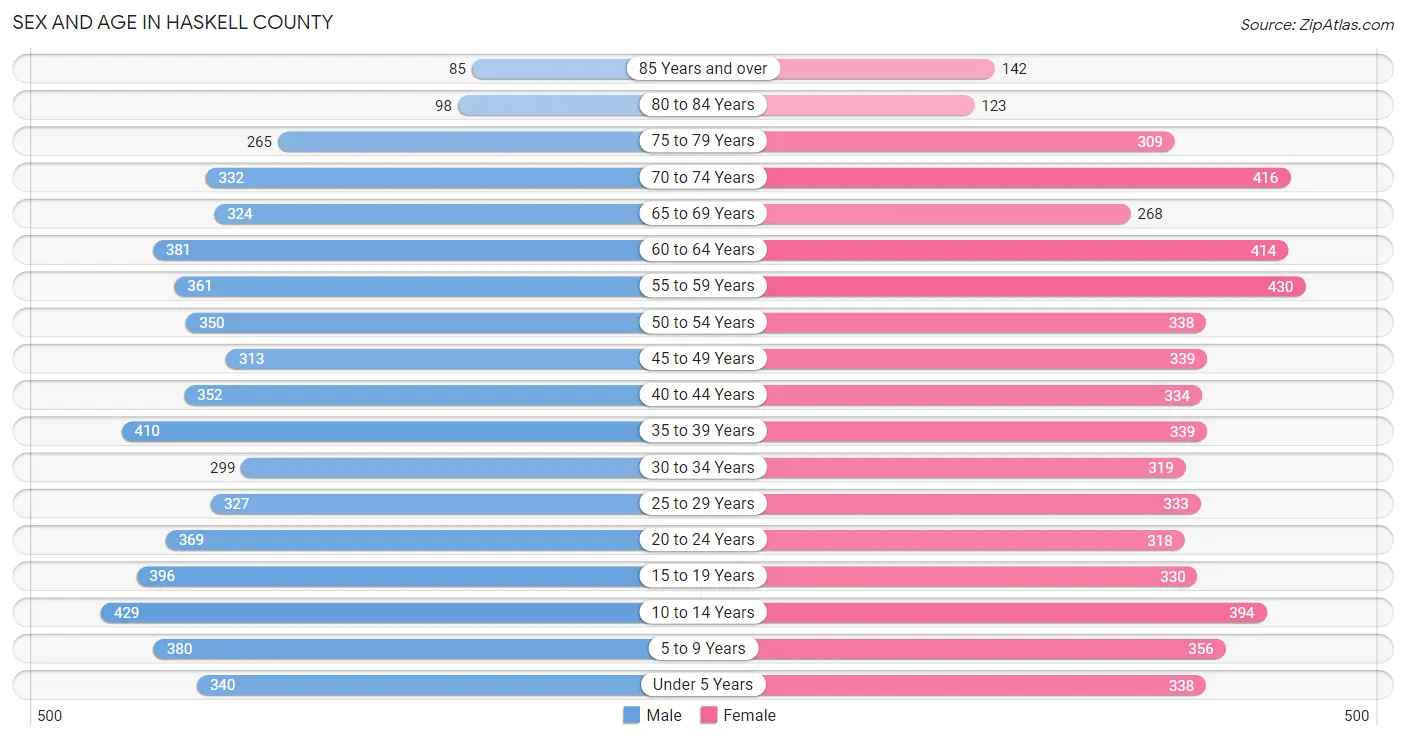
| Age Bracket | Male | Female |
| Under 5 Years | 340 (5.9%) | 338 (5.8%) |
| 5 to 9 Years | 380 (6.5%) | 356 (6.1%) |
| 10 to 14 Years | 429 (7.4%) | 394 (6.8%) |
| 15 to 19 Years | 396 (6.8%) | 330 (5.7%) |
| 20 to 24 Years | 369 (6.4%) | 318 (5.4%) |
| 25 to 29 Years | 327 (5.6%) | 333 (5.7%) |
| 30 to 34 Years | 299 (5.1%) | 319 (5.5%) |
| 35 to 39 Years | 410 (7.1%) | 339 (5.8%) |
| 40 to 44 Years | 352 (6.1%) | 334 (5.7%) |
| 45 to 49 Years | 313 (5.4%) | 339 (5.8%) |
| 50 to 54 Years | 350 (6.0%) | 338 (5.8%) |
| 55 to 59 Years | 361 (6.2%) | 430 (7.4%) |
| 60 to 64 Years | 381 (6.6%) | 414 (7.1%) |
| 65 to 69 Years | 324 (5.6%) | 268 (4.6%) |
| 70 to 74 Years | 332 (5.7%) | 416 (7.1%) |
| 75 to 79 Years | 265 (4.6%) | 309 (5.3%) |
| 80 to 84 Years | 98 (1.7%) | 123 (2.1%) |
| 85 Years and over | 85 (1.5%) | 142 (2.4%) |
| Total | 5,811 (100.0%) | 5,840 (100.0%) |
Families and Households in Haskell County
Median Family Size in Haskell County
The median family size in Haskell County is 3.06 persons per family, with married-couple families (2,427 | 77.4%) accounting for the largest median family size of 3.09 persons per family. On the other hand, single male/father families (257 | 8.2%) represent the smallest median family size with 2.91 persons per family.
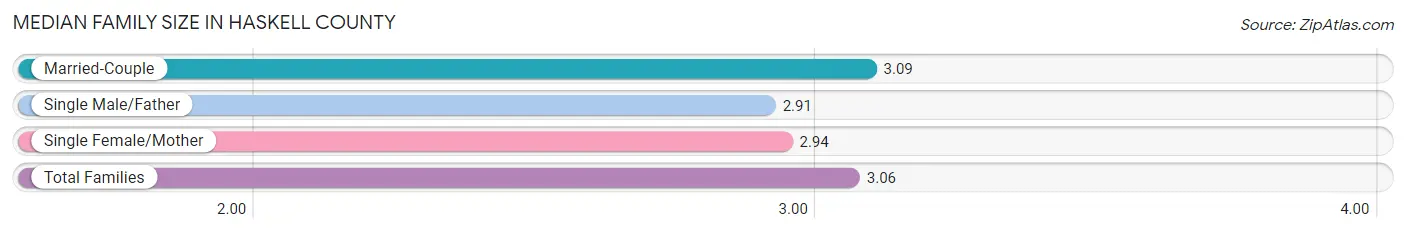
| Family Type | # Families | Family Size |
| Married-Couple | 2,427 (77.4%) | 3.09 |
| Single Male/Father | 257 (8.2%) | 2.91 |
| Single Female/Mother | 452 (14.4%) | 2.94 |
| Total Families | 3,136 (100.0%) | 3.06 |
Median Household Size in Haskell County
The median household size in Haskell County is 2.56 persons per household, with single male/father households (257 | 5.7%) accounting for the largest median household size of 3.4 persons per household. non-family households (1,382 | 30.6%) represent the smallest median household size with 1.16 persons per household.
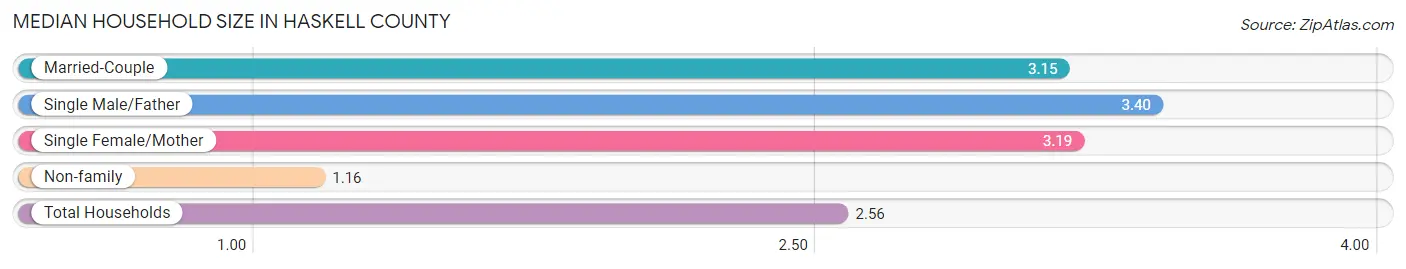
| Household Type | # Households | Household Size |
| Married-Couple | 2,427 (53.7%) | 3.15 |
| Single Male/Father | 257 (5.7%) | 3.40 |
| Single Female/Mother | 452 (10.0%) | 3.19 |
| Non-family | 1,382 (30.6%) | 1.16 |
| Total Households | 4,518 (100.0%) | 2.56 |
Household Size by Marriage Status in Haskell County
Out of a total of 4,518 households in Haskell County, 3,136 (69.4%) are family households, while 1,382 (30.6%) are nonfamily households. The most numerous type of family households are 2-person households, comprising 1,444, and the most common type of nonfamily households are 1-person households, comprising 1,173.
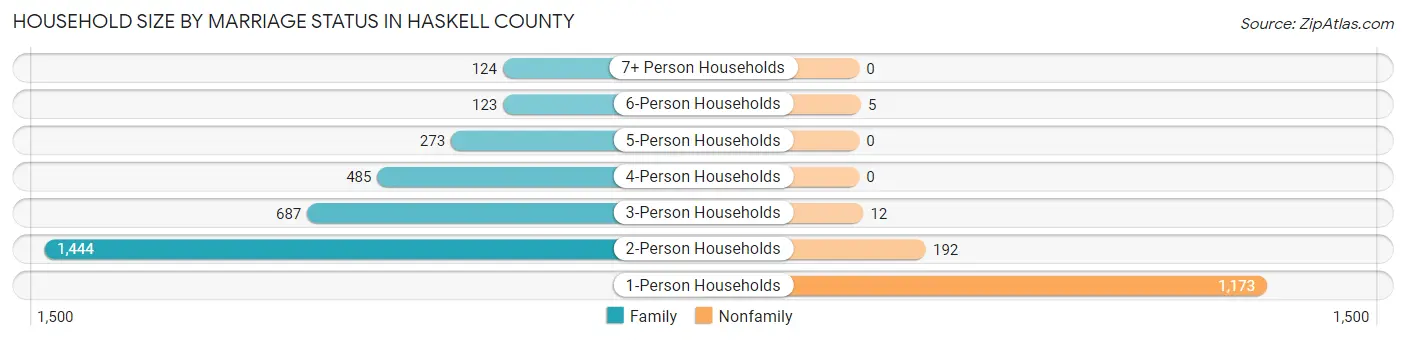
| Household Size | Family Households | Nonfamily Households |
| 1-Person Households | - | 1,173 (26.0%) |
| 2-Person Households | 1,444 (32.0%) | 192 (4.3%) |
| 3-Person Households | 687 (15.2%) | 12 (0.3%) |
| 4-Person Households | 485 (10.7%) | 0 (0.0%) |
| 5-Person Households | 273 (6.0%) | 0 (0.0%) |
| 6-Person Households | 123 (2.7%) | 5 (0.1%) |
| 7+ Person Households | 124 (2.7%) | 0 (0.0%) |
| Total | 3,136 (69.4%) | 1,382 (30.6%) |
Female Fertility in Haskell County
Fertility by Age in Haskell County
Average fertility rate in Haskell County is 58.0 births per 1,000 women. Women in the age bracket of 20 to 34 years have the highest fertility rate with 124.0 births per 1,000 women. Women in the age bracket of 20 to 34 years acount for 87.0% of all women with births.
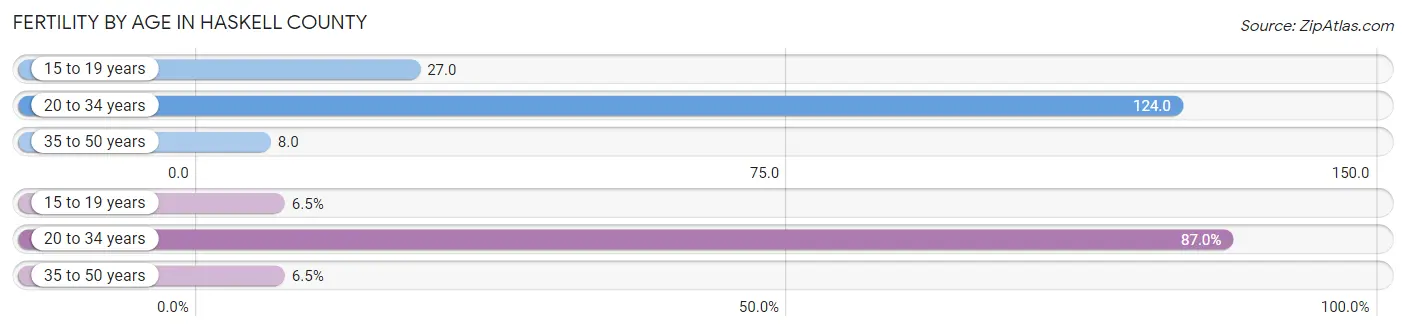
| Age Bracket | Women with Births | Births / 1,000 Women |
| 15 to 19 years | 9 (6.5%) | 27.0 |
| 20 to 34 years | 120 (87.0%) | 124.0 |
| 35 to 50 years | 9 (6.5%) | 8.0 |
| Total | 138 (100.0%) | 58.0 |
Fertility by Age by Marriage Status in Haskell County
63.8% of women with births (138) in Haskell County are married. The highest percentage of unmarried women with births falls into 15 to 19 years age bracket with 77.8% of them unmarried at the time of birth, while the lowest percentage of unmarried women with births belong to 20 to 34 years age bracket with 31.7% of them unmarried.
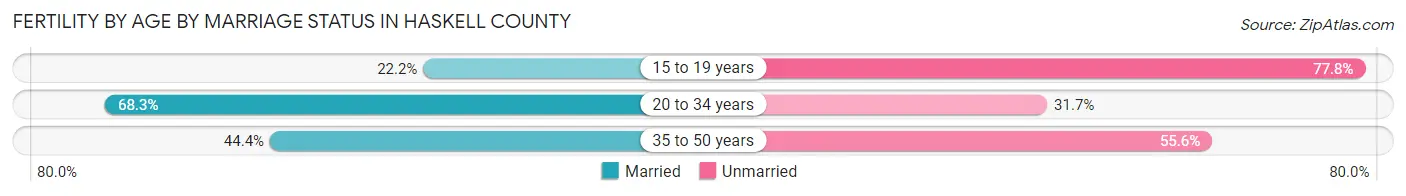
| Age Bracket | Married | Unmarried |
| 15 to 19 years | 2 (22.2%) | 7 (77.8%) |
| 20 to 34 years | 82 (68.3%) | 38 (31.7%) |
| 35 to 50 years | 4 (44.4%) | 5 (55.6%) |
| Total | 88 (63.8%) | 50 (36.2%) |
Fertility by Education in Haskell County
Average fertility rate in Haskell County is 58.0 births per 1,000 women. Women with the education attainment of college or associate's degree have the highest fertility rate of 74.0 births per 1,000 women, while women with the education attainment of graduate degree have the lowest fertility at 22.0 births per 1,000 women. Women with the education attainment of college or associate's degree represent 44.9% of all women with births.
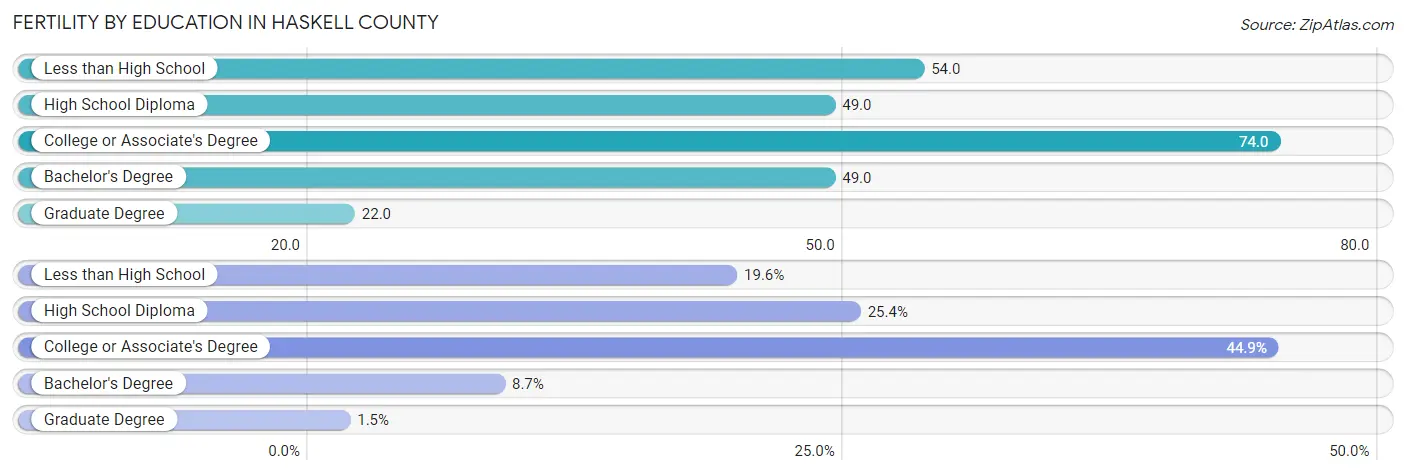
| Educational Attainment | Women with Births | Births / 1,000 Women |
| Less than High School | 27 (19.6%) | 54.0 |
| High School Diploma | 35 (25.4%) | 49.0 |
| College or Associate's Degree | 62 (44.9%) | 74.0 |
| Bachelor's Degree | 12 (8.7%) | 49.0 |
| Graduate Degree | 2 (1.5%) | 22.0 |
| Total | 138 (100.0%) | 58.0 |
Fertility by Education by Marriage Status in Haskell County
36.2% of women with births in Haskell County are unmarried. Women with the educational attainment of graduate degree are most likely to be married with 100.0% of them married at childbirth, while women with the educational attainment of less than high school are least likely to be married with 74.1% of them unmarried at childbirth.
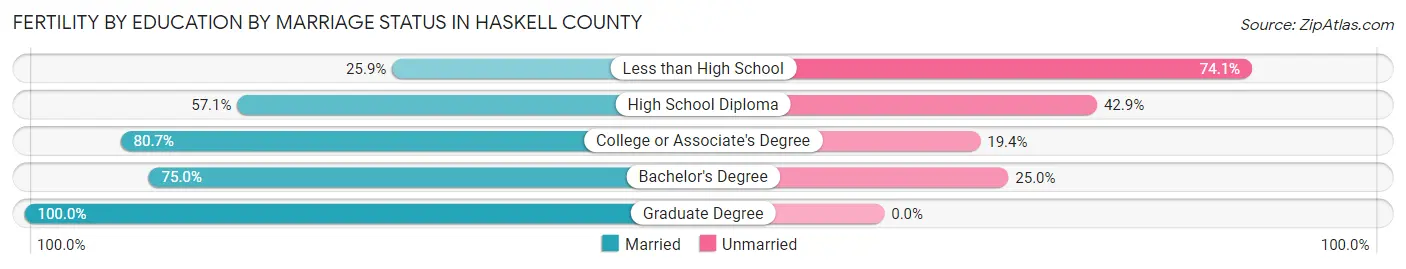
| Educational Attainment | Married | Unmarried |
| Less than High School | 7 (25.9%) | 20 (74.1%) |
| High School Diploma | 20 (57.1%) | 15 (42.9%) |
| College or Associate's Degree | 50 (80.6%) | 12 (19.4%) |
| Bachelor's Degree | 9 (75.0%) | 3 (25.0%) |
| Graduate Degree | 2 (100.0%) | 0 (0.0%) |
| Total | 88 (63.8%) | 50 (36.2%) |
Employment Characteristics in Haskell County
Employment by Class of Employer in Haskell County
Among the 4,404 employed individuals in Haskell County, private company employees (2,447 | 55.6%), self-employed (not incorporated) (591 | 13.4%), and state government employees (334 | 7.6%) make up the most common classes of employment.
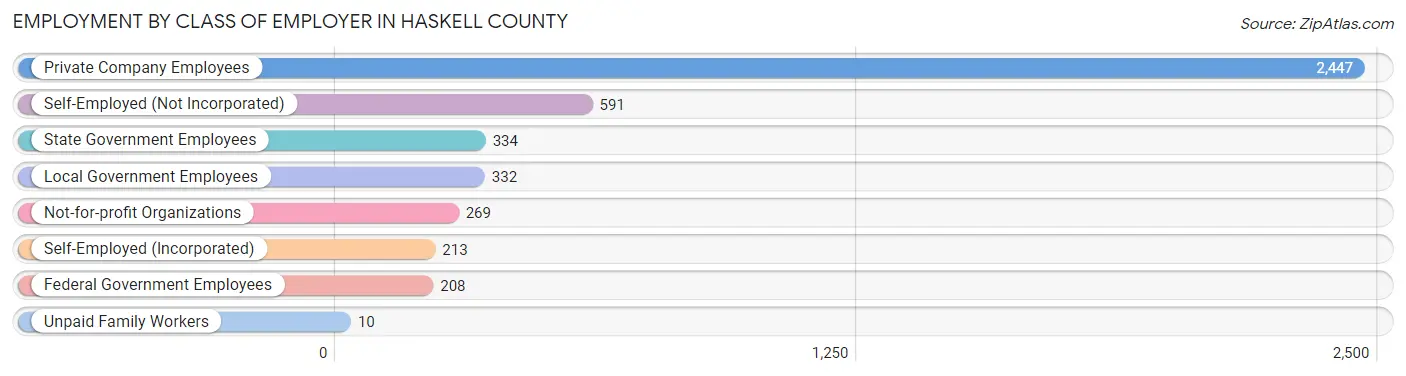
| Employer Class | # Employees | % Employees |
| Private Company Employees | 2,447 | 55.6% |
| Self-Employed (Incorporated) | 213 | 4.8% |
| Self-Employed (Not Incorporated) | 591 | 13.4% |
| Not-for-profit Organizations | 269 | 6.1% |
| Local Government Employees | 332 | 7.5% |
| State Government Employees | 334 | 7.6% |
| Federal Government Employees | 208 | 4.7% |
| Unpaid Family Workers | 10 | 0.2% |
| Total | 4,404 | 100.0% |
Employment Status by Age in Haskell County
According to the labor force statistics for Haskell County, out of the total population over 16 years of age (9,261), 52.7% or 4,881 individuals are in the labor force, with 7.7% or 376 of them unemployed. The age group with the highest labor force participation rate is 35 to 44 years, with 79.9% or 1,147 individuals in the labor force. Within the labor force, the 16 to 19 years age range has the highest percentage of unemployed individuals, with 19.7% or 36 of them being unemployed.
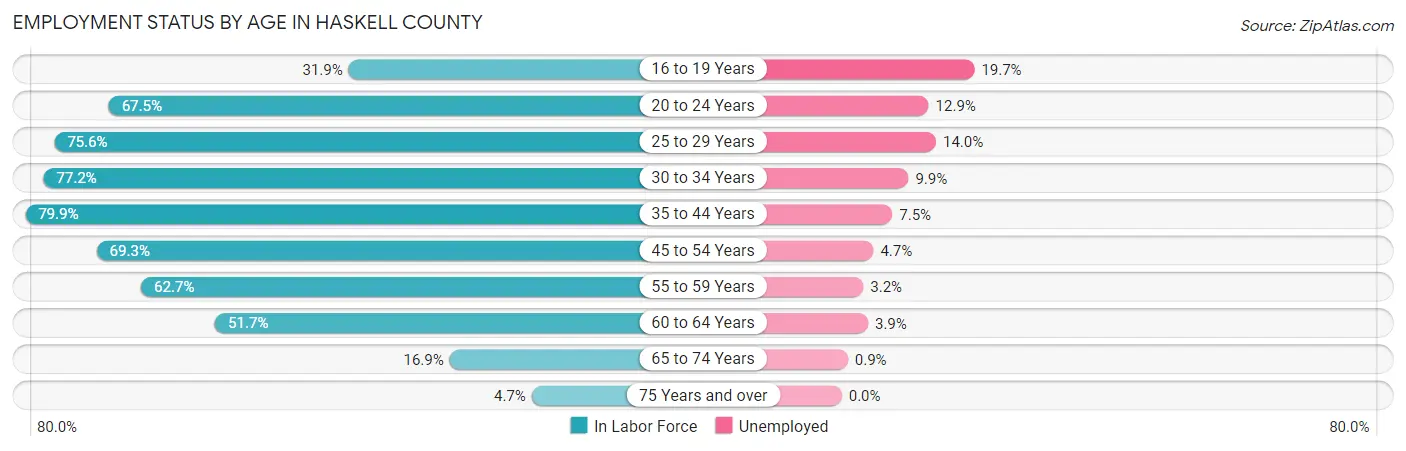
| Age Bracket | In Labor Force | Unemployed |
| 16 to 19 Years | 183 (31.9%) | 36 (19.7%) |
| 20 to 24 Years | 464 (67.5%) | 60 (12.9%) |
| 25 to 29 Years | 499 (75.6%) | 70 (14.0%) |
| 30 to 34 Years | 477 (77.2%) | 47 (9.9%) |
| 35 to 44 Years | 1,147 (79.9%) | 86 (7.5%) |
| 45 to 54 Years | 929 (69.3%) | 44 (4.7%) |
| 55 to 59 Years | 496 (62.7%) | 16 (3.2%) |
| 60 to 64 Years | 411 (51.7%) | 16 (3.9%) |
| 65 to 74 Years | 226 (16.9%) | 2 (0.9%) |
| 75 Years and over | 48 (4.7%) | 0 (0.0%) |
| Total | 4,881 (52.7%) | 376 (7.7%) |
Employment Status by Educational Attainment in Haskell County
According to labor force statistics for Haskell County, 70.2% of individuals (3,959) out of the total population between 25 and 64 years of age (5,639) are in the labor force, with 7.1% or 281 of them being unemployed. The group with the highest labor force participation rate are those with the educational attainment of bachelor's degree or higher, with 86.6% or 690 individuals in the labor force. Within the labor force, individuals with less than high school education have the highest percentage of unemployment, with 9.9% or 38 of them being unemployed.
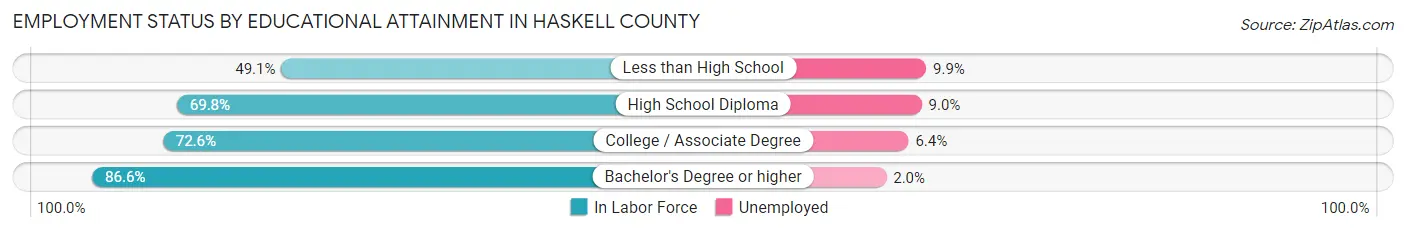
| Educational Attainment | In Labor Force | Unemployed |
| Less than High School | 385 (49.1%) | 78 (9.9%) |
| High School Diploma | 1,607 (69.8%) | 207 (9.0%) |
| College / Associate Degree | 1,274 (72.6%) | 112 (6.4%) |
| Bachelor's Degree or higher | 690 (86.6%) | 16 (2.0%) |
| Total | 3,959 (70.2%) | 400 (7.1%) |
Employment Occupations by Sex in Haskell County
Management, Business, Science and Arts Occupations
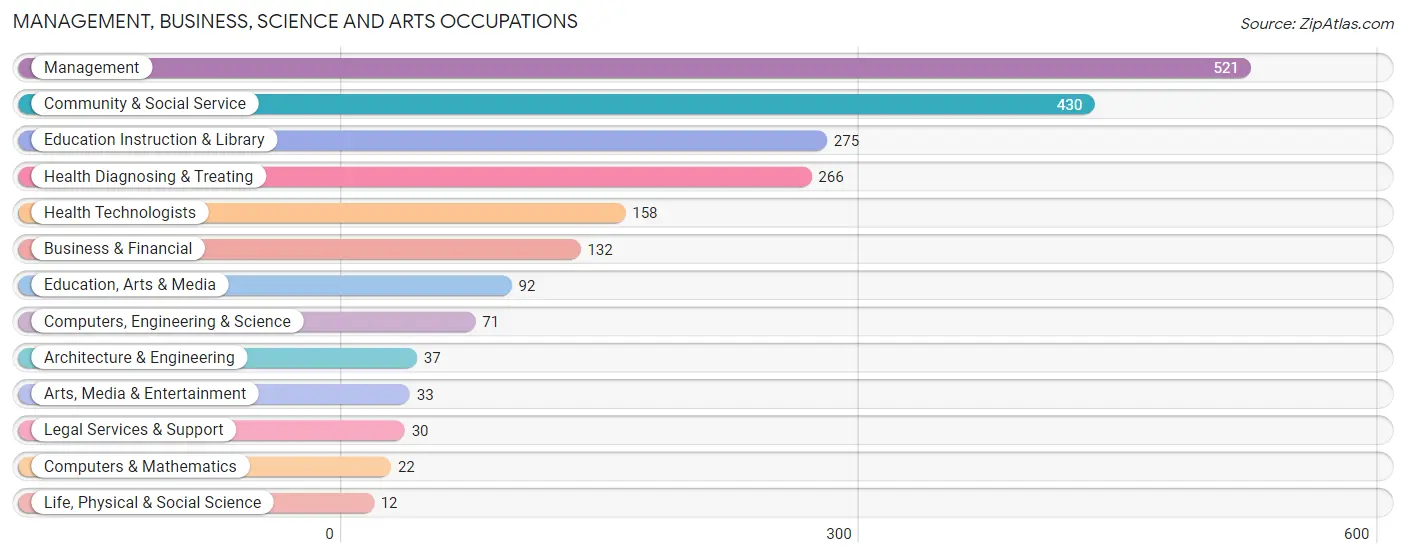
The most common Management, Business, Science and Arts occupations in Haskell County are Management (521 | 11.6%), Community & Social Service (430 | 9.6%), Education Instruction & Library (275 | 6.1%), Health Diagnosing & Treating (266 | 5.9%), and Health Technologists (158 | 3.5%).
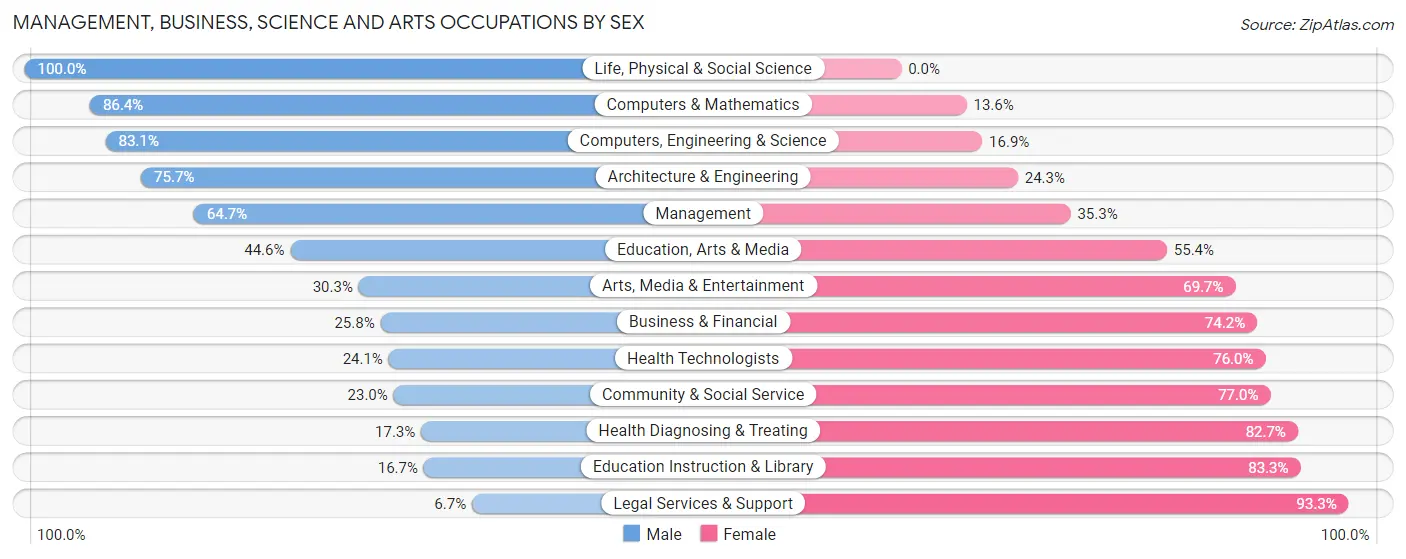
Management, Business, Science and Arts Occupations by Sex
Within the Management, Business, Science and Arts occupations in Haskell County, the most male-oriented occupations are Life, Physical & Social Science (100.0%), Computers & Mathematics (86.4%), and Computers, Engineering & Science (83.1%), while the most female-oriented occupations are Legal Services & Support (93.3%), Education Instruction & Library (83.3%), and Health Diagnosing & Treating (82.7%).
| Occupation | Male | Female |
| Management | 337 (64.7%) | 184 (35.3%) |
| Business & Financial | 34 (25.8%) | 98 (74.2%) |
| Computers, Engineering & Science | 59 (83.1%) | 12 (16.9%) |
| Computers & Mathematics | 19 (86.4%) | 3 (13.6%) |
| Architecture & Engineering | 28 (75.7%) | 9 (24.3%) |
| Life, Physical & Social Science | 12 (100.0%) | 0 (0.0%) |
| Community & Social Service | 99 (23.0%) | 331 (77.0%) |
| Education, Arts & Media | 41 (44.6%) | 51 (55.4%) |
| Legal Services & Support | 2 (6.7%) | 28 (93.3%) |
| Education Instruction & Library | 46 (16.7%) | 229 (83.3%) |
| Arts, Media & Entertainment | 10 (30.3%) | 23 (69.7%) |
| Health Diagnosing & Treating | 46 (17.3%) | 220 (82.7%) |
| Health Technologists | 38 (24.0%) | 120 (75.9%) |
| Total (Category) | 575 (40.5%) | 845 (59.5%) |
| Total (Overall) | 2,353 (52.3%) | 2,145 (47.7%) |
Services Occupations
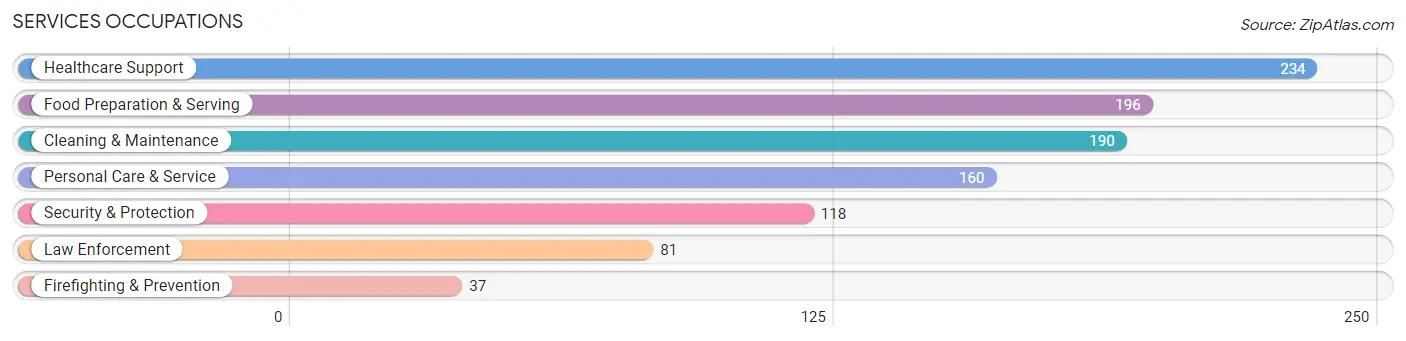
The most common Services occupations in Haskell County are Healthcare Support (234 | 5.2%), Food Preparation & Serving (196 | 4.4%), Cleaning & Maintenance (190 | 4.2%), Personal Care & Service (160 | 3.6%), and Security & Protection (118 | 2.6%).
Services Occupations by Sex
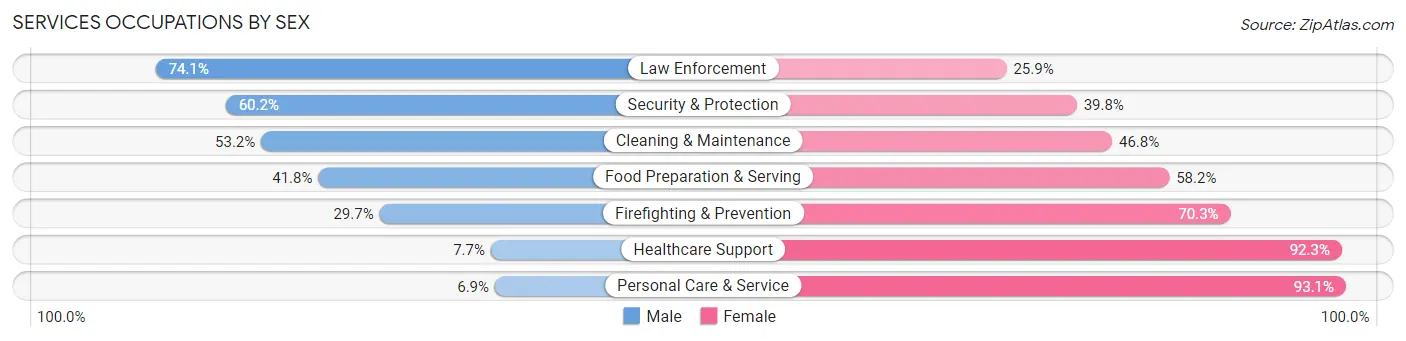
Within the Services occupations in Haskell County, the most male-oriented occupations are Law Enforcement (74.1%), Security & Protection (60.2%), and Cleaning & Maintenance (53.2%), while the most female-oriented occupations are Personal Care & Service (93.1%), Healthcare Support (92.3%), and Firefighting & Prevention (70.3%).
| Occupation | Male | Female |
| Healthcare Support | 18 (7.7%) | 216 (92.3%) |
| Security & Protection | 71 (60.2%) | 47 (39.8%) |
| Firefighting & Prevention | 11 (29.7%) | 26 (70.3%) |
| Law Enforcement | 60 (74.1%) | 21 (25.9%) |
| Food Preparation & Serving | 82 (41.8%) | 114 (58.2%) |
| Cleaning & Maintenance | 101 (53.2%) | 89 (46.8%) |
| Personal Care & Service | 11 (6.9%) | 149 (93.1%) |
| Total (Category) | 283 (31.5%) | 615 (68.5%) |
| Total (Overall) | 2,353 (52.3%) | 2,145 (47.7%) |
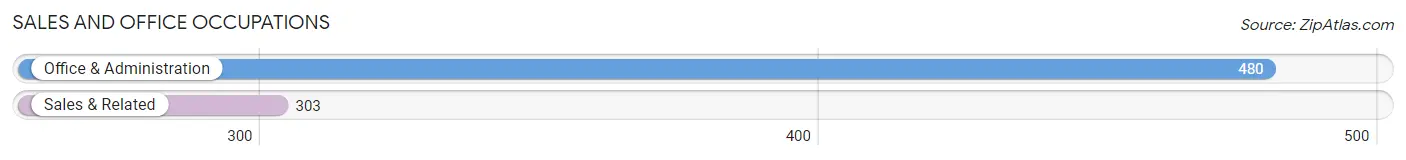
Sales and Office Occupations
The most common Sales and Office occupations in Haskell County are Office & Administration (480 | 10.7%), and Sales & Related (303 | 6.7%).
Sales and Office Occupations by Sex
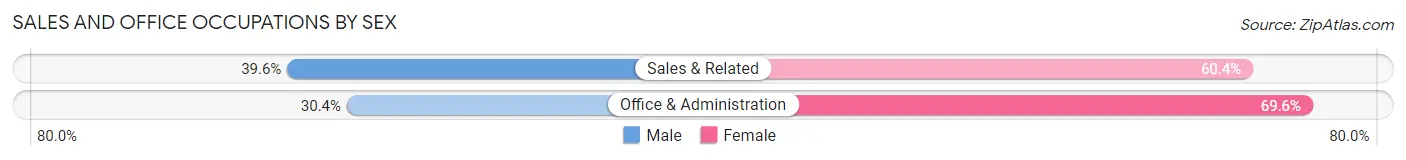
| Occupation | Male | Female |
| Sales & Related | 120 (39.6%) | 183 (60.4%) |
| Office & Administration | 146 (30.4%) | 334 (69.6%) |
| Total (Category) | 266 (34.0%) | 517 (66.0%) |
| Total (Overall) | 2,353 (52.3%) | 2,145 (47.7%) |
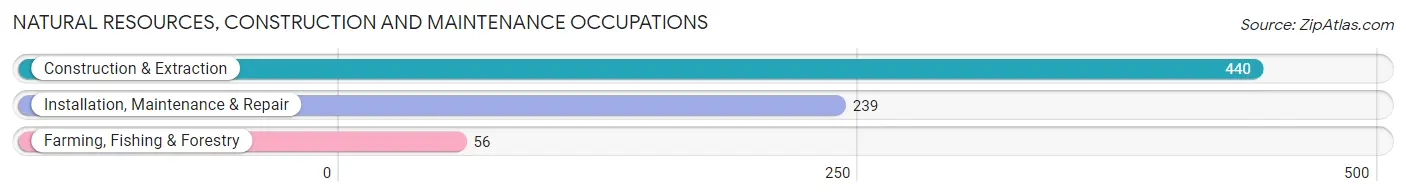
Natural Resources, Construction and Maintenance Occupations
The most common Natural Resources, Construction and Maintenance occupations in Haskell County are Construction & Extraction (440 | 9.8%), Installation, Maintenance & Repair (239 | 5.3%), and Farming, Fishing & Forestry (56 | 1.2%).
Natural Resources, Construction and Maintenance Occupations by Sex
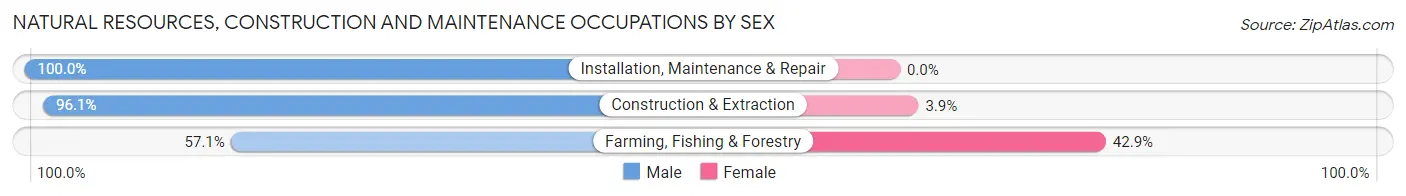
| Occupation | Male | Female |
| Farming, Fishing & Forestry | 32 (57.1%) | 24 (42.9%) |
| Construction & Extraction | 423 (96.1%) | 17 (3.9%) |
| Installation, Maintenance & Repair | 239 (100.0%) | 0 (0.0%) |
| Total (Category) | 694 (94.4%) | 41 (5.6%) |
| Total (Overall) | 2,353 (52.3%) | 2,145 (47.7%) |
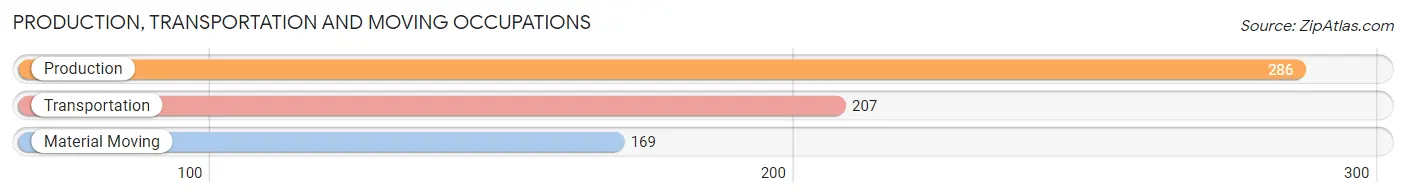
Production, Transportation and Moving Occupations
The most common Production, Transportation and Moving occupations in Haskell County are Production (286 | 6.4%), Transportation (207 | 4.6%), and Material Moving (169 | 3.8%).
Production, Transportation and Moving Occupations by Sex
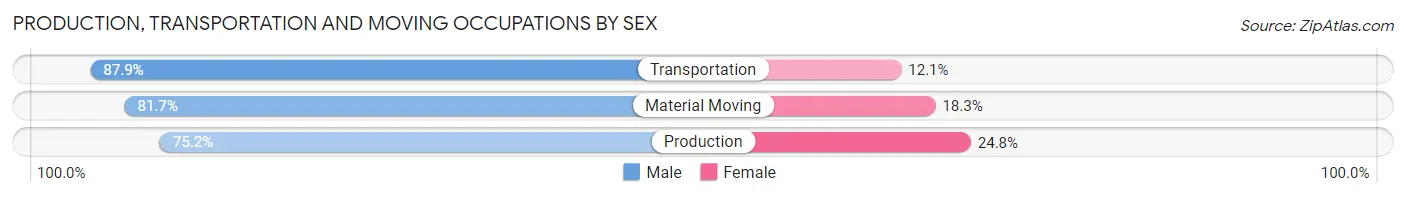
| Occupation | Male | Female |
| Production | 215 (75.2%) | 71 (24.8%) |
| Transportation | 182 (87.9%) | 25 (12.1%) |
| Material Moving | 138 (81.7%) | 31 (18.3%) |
| Total (Category) | 535 (80.8%) | 127 (19.2%) |
| Total (Overall) | 2,353 (52.3%) | 2,145 (47.7%) |
Employment Industries by Sex in Haskell County
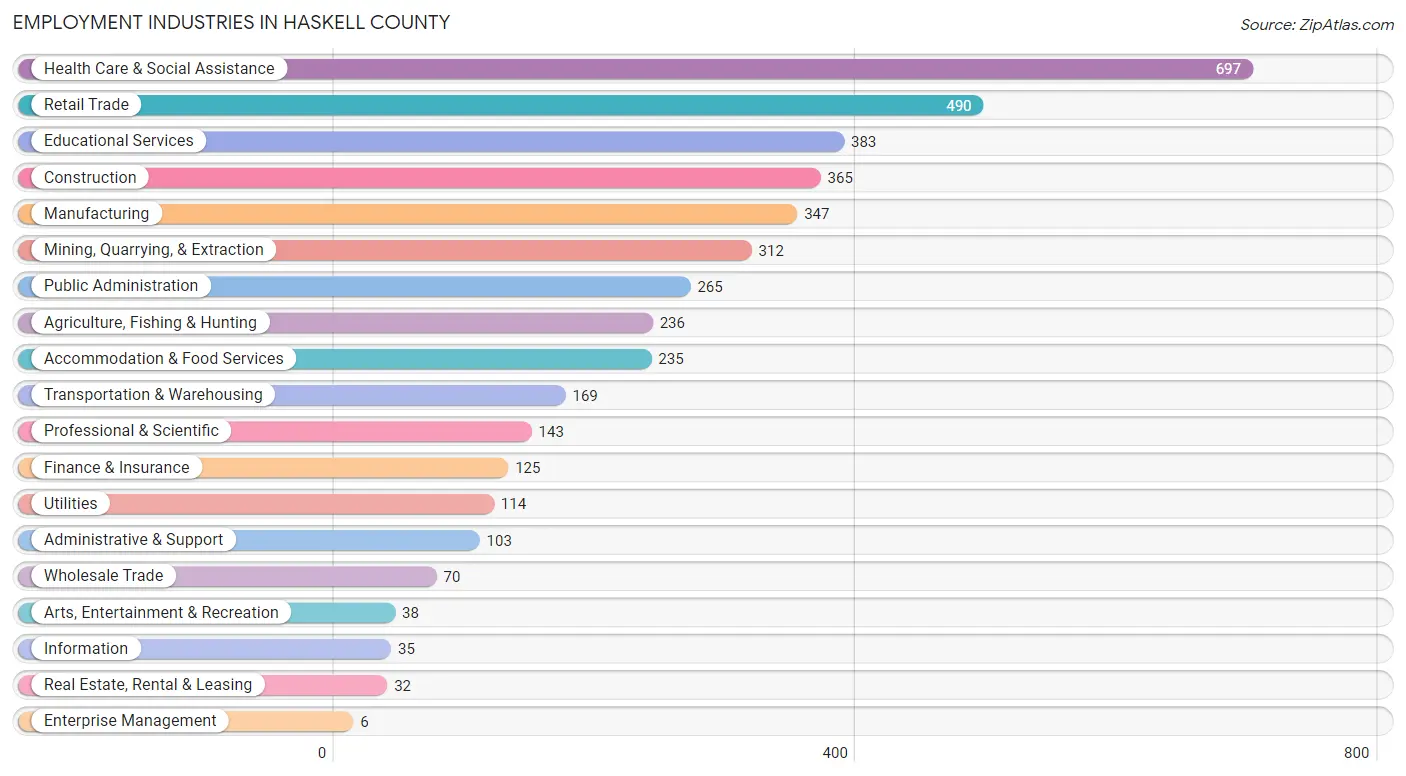
Employment Industries in Haskell County
The major employment industries in Haskell County include Health Care & Social Assistance (697 | 15.5%), Retail Trade (490 | 10.9%), Educational Services (383 | 8.5%), Construction (365 | 8.1%), and Manufacturing (347 | 7.7%).
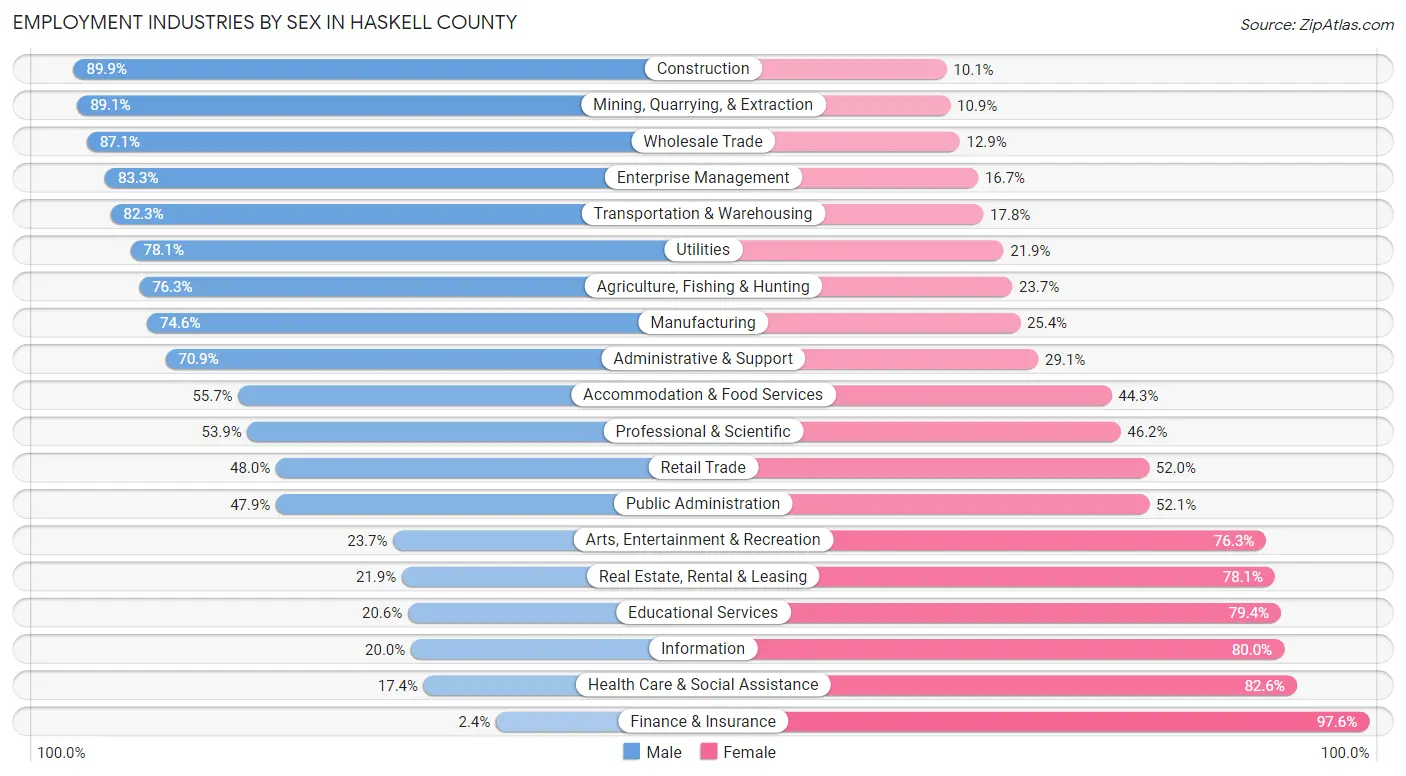
Employment Industries by Sex in Haskell County
The Haskell County industries that see more men than women are Construction (89.9%), Mining, Quarrying, & Extraction (89.1%), and Wholesale Trade (87.1%), whereas the industries that tend to have a higher number of women are Finance & Insurance (97.6%), Health Care & Social Assistance (82.6%), and Information (80.0%).
| Industry | Male | Female |
| Agriculture, Fishing & Hunting | 180 (76.3%) | 56 (23.7%) |
| Mining, Quarrying, & Extraction | 278 (89.1%) | 34 (10.9%) |
| Construction | 328 (89.9%) | 37 (10.1%) |
| Manufacturing | 259 (74.6%) | 88 (25.4%) |
| Wholesale Trade | 61 (87.1%) | 9 (12.9%) |
| Retail Trade | 235 (48.0%) | 255 (52.0%) |
| Transportation & Warehousing | 139 (82.3%) | 30 (17.7%) |
| Utilities | 89 (78.1%) | 25 (21.9%) |
| Information | 7 (20.0%) | 28 (80.0%) |
| Finance & Insurance | 3 (2.4%) | 122 (97.6%) |
| Real Estate, Rental & Leasing | 7 (21.9%) | 25 (78.1%) |
| Professional & Scientific | 77 (53.8%) | 66 (46.2%) |
| Enterprise Management | 5 (83.3%) | 1 (16.7%) |
| Administrative & Support | 73 (70.9%) | 30 (29.1%) |
| Educational Services | 79 (20.6%) | 304 (79.4%) |
| Health Care & Social Assistance | 121 (17.4%) | 576 (82.6%) |
| Arts, Entertainment & Recreation | 9 (23.7%) | 29 (76.3%) |
| Accommodation & Food Services | 131 (55.7%) | 104 (44.3%) |
| Public Administration | 127 (47.9%) | 138 (52.1%) |
| Total | 2,353 (52.3%) | 2,145 (47.7%) |
Education in Haskell County
School Enrollment in Haskell County
The most common levels of schooling among the 2,630 students in Haskell County are middle school (652 | 24.8%), high school (572 | 21.7%), and elementary school (554 | 21.1%).
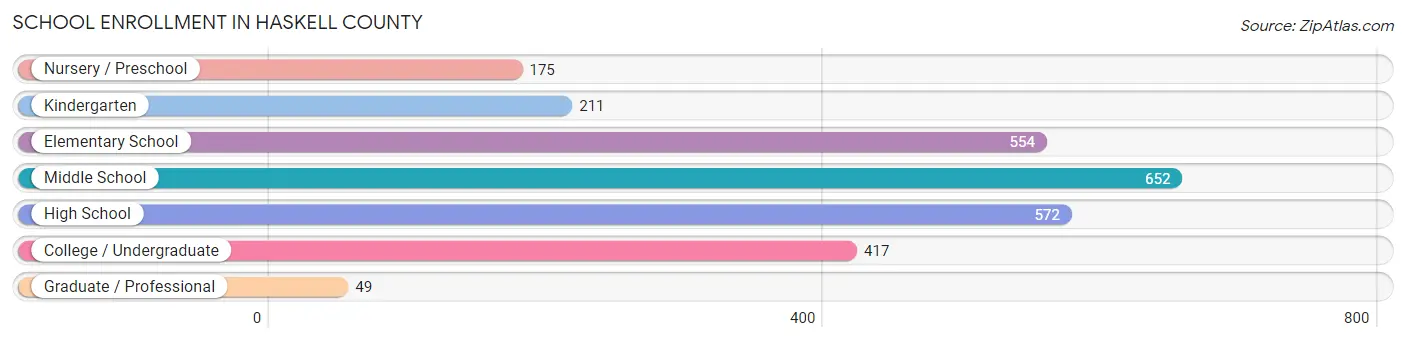
| School Level | # Students | % Students |
| Nursery / Preschool | 175 | 6.7% |
| Kindergarten | 211 | 8.0% |
| Elementary School | 554 | 21.1% |
| Middle School | 652 | 24.8% |
| High School | 572 | 21.7% |
| College / Undergraduate | 417 | 15.9% |
| Graduate / Professional | 49 | 1.9% |
| Total | 2,630 | 100.0% |
School Enrollment by Age by Funding Source in Haskell County
Out of a total of 2,630 students who are enrolled in schools in Haskell County, 160 (6.1%) attend a private institution, while the remaining 2,470 (93.9%) are enrolled in public schools. The age group of 35 years and over has the highest likelihood of being enrolled in private schools, with 34 (36.6% in the age bracket) enrolled. Conversely, the age group of 18 to 19 year olds has the lowest likelihood of being enrolled in a private school, with 183 (99.5% in the age bracket) attending a public institution.
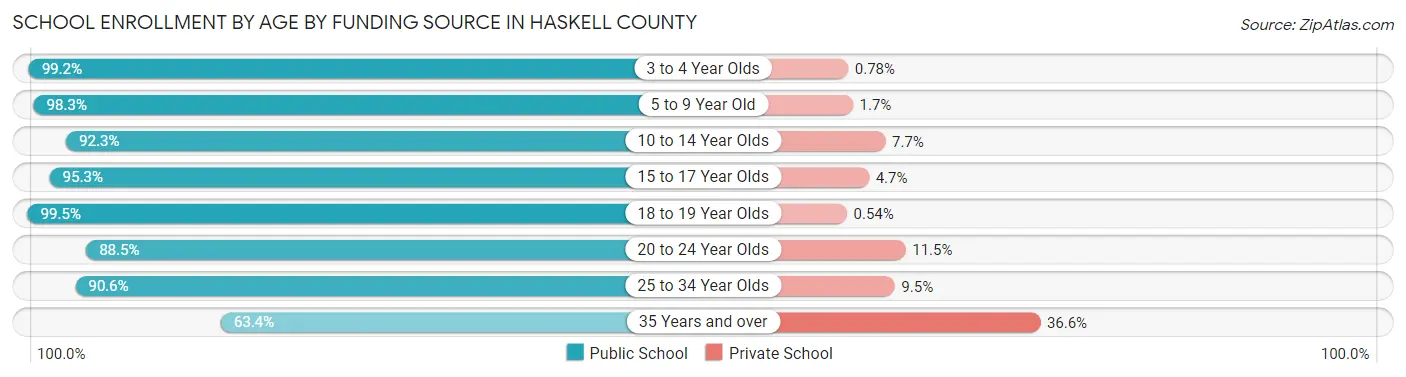
| Age Bracket | Public School | Private School |
| 3 to 4 Year Olds | 127 (99.2%) | 1 (0.8%) |
| 5 to 9 Year Old | 711 (98.3%) | 12 (1.7%) |
| 10 to 14 Year Olds | 705 (92.3%) | 59 (7.7%) |
| 15 to 17 Year Olds | 408 (95.3%) | 20 (4.7%) |
| 18 to 19 Year Olds | 183 (99.5%) | 1 (0.5%) |
| 20 to 24 Year Olds | 162 (88.5%) | 21 (11.5%) |
| 25 to 34 Year Olds | 115 (90.5%) | 12 (9.5%) |
| 35 Years and over | 59 (63.4%) | 34 (36.6%) |
| Total | 2,470 (93.9%) | 160 (6.1%) |
Educational Attainment by Field of Study in Haskell County
Education (394 | 31.6%), business (245 | 19.7%), science & technology (134 | 10.7%), arts & humanities (129 | 10.3%), and bio, nature & agricultural (82 | 6.6%) are the most common fields of study among 1,247 individuals in Haskell County who have obtained a bachelor's degree or higher.
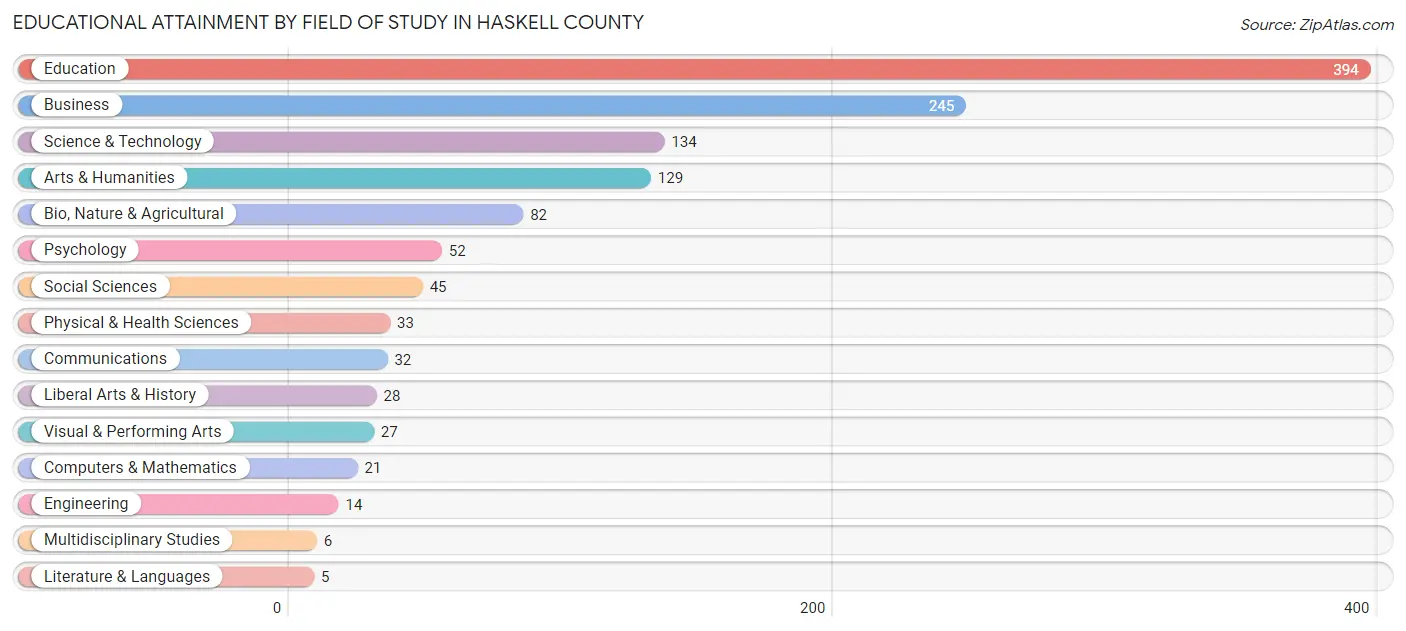
| Field of Study | # Graduates | % Graduates |
| Computers & Mathematics | 21 | 1.7% |
| Bio, Nature & Agricultural | 82 | 6.6% |
| Physical & Health Sciences | 33 | 2.6% |
| Psychology | 52 | 4.2% |
| Social Sciences | 45 | 3.6% |
| Engineering | 14 | 1.1% |
| Multidisciplinary Studies | 6 | 0.5% |
| Science & Technology | 134 | 10.7% |
| Business | 245 | 19.7% |
| Education | 394 | 31.6% |
| Literature & Languages | 5 | 0.4% |
| Liberal Arts & History | 28 | 2.2% |
| Visual & Performing Arts | 27 | 2.2% |
| Communications | 32 | 2.6% |
| Arts & Humanities | 129 | 10.3% |
| Total | 1,247 | 100.0% |
Transportation & Commute in Haskell County
Vehicle Availability by Sex in Haskell County
The most prevalent vehicle ownership categories in Haskell County are males with 2 vehicles (879, accounting for 38.2%) and females with 2 vehicles (657, making up 41.8%).
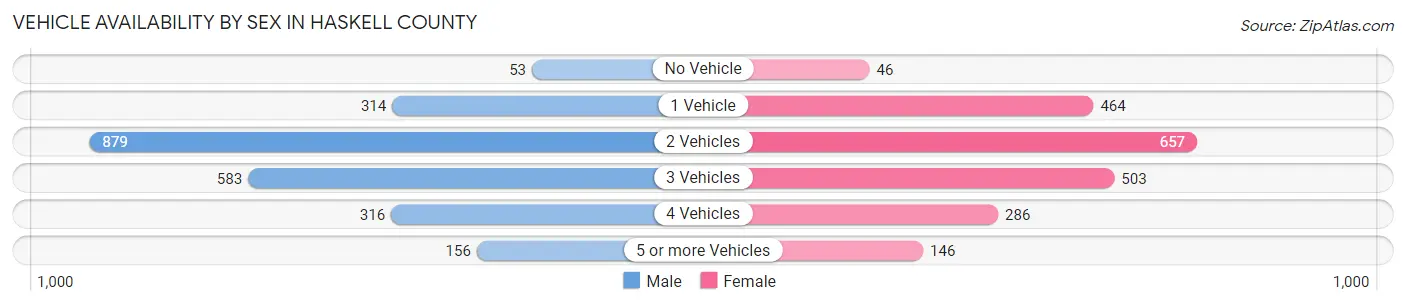
| Vehicles Available | Male | Female |
| No Vehicle | 53 (2.3%) | 46 (2.2%) |
| 1 Vehicle | 314 (13.7%) | 464 (22.1%) |
| 2 Vehicles | 879 (38.2%) | 657 (31.3%) |
| 3 Vehicles | 583 (25.3%) | 503 (23.9%) |
| 4 Vehicles | 316 (13.7%) | 286 (13.6%) |
| 5 or more Vehicles | 156 (6.8%) | 146 (7.0%) |
| Total | 2,301 (100.0%) | 2,102 (100.0%) |
Commute Time in Haskell County
The most frequently occuring commute durations in Haskell County are 5 to 9 minutes (733 commuters, 17.6%), 10 to 14 minutes (564 commuters, 13.5%), and less than 5 minutes (445 commuters, 10.7%).
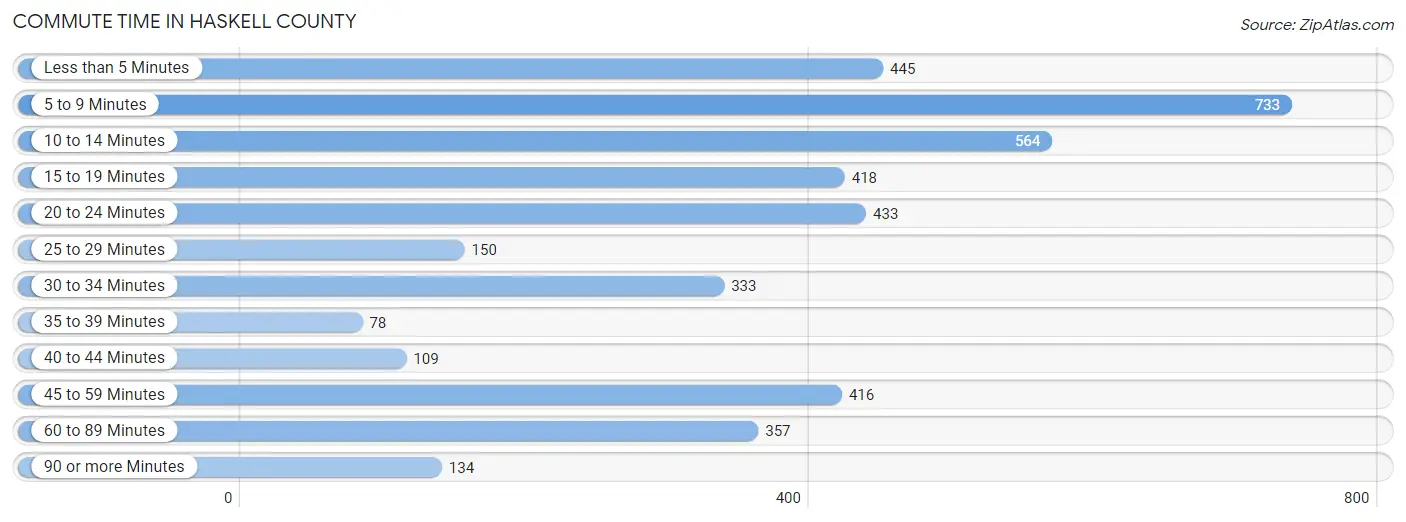
| Commute Time | # Commuters | % Commuters |
| Less than 5 Minutes | 445 | 10.7% |
| 5 to 9 Minutes | 733 | 17.6% |
| 10 to 14 Minutes | 564 | 13.5% |
| 15 to 19 Minutes | 418 | 10.0% |
| 20 to 24 Minutes | 433 | 10.4% |
| 25 to 29 Minutes | 150 | 3.6% |
| 30 to 34 Minutes | 333 | 8.0% |
| 35 to 39 Minutes | 78 | 1.9% |
| 40 to 44 Minutes | 109 | 2.6% |
| 45 to 59 Minutes | 416 | 10.0% |
| 60 to 89 Minutes | 357 | 8.6% |
| 90 or more Minutes | 134 | 3.2% |
Commute Time by Sex in Haskell County
The most common commute times in Haskell County are 10 to 14 minutes (288 commuters, 13.2%) for males and 5 to 9 minutes (466 commuters, 23.5%) for females.
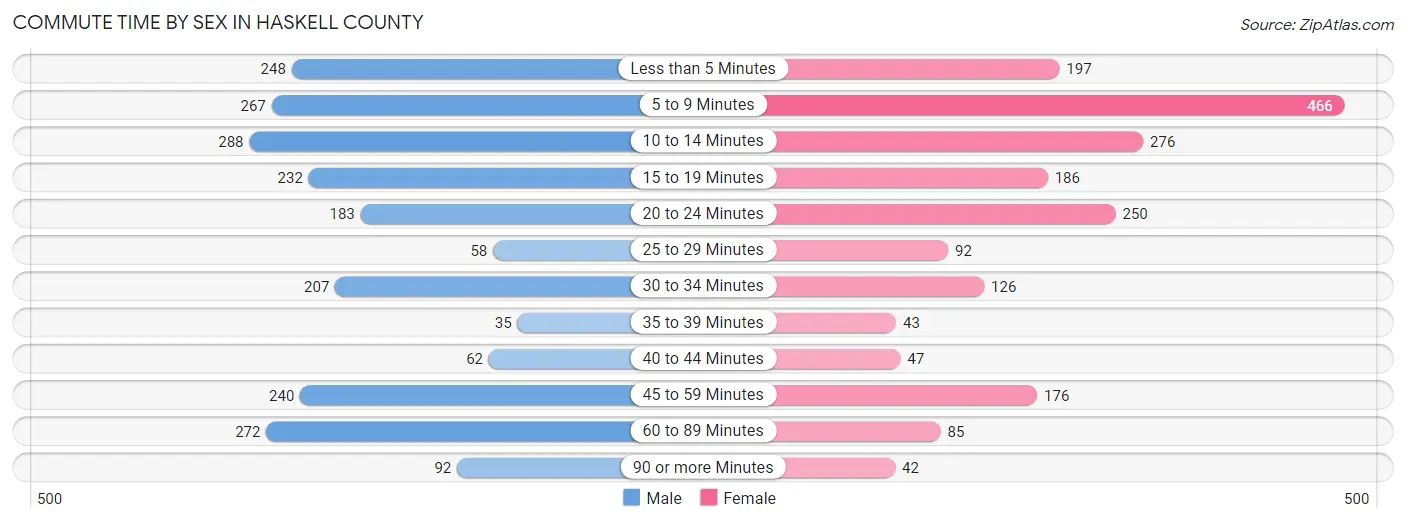
| Commute Time | Male | Female |
| Less than 5 Minutes | 248 (11.4%) | 197 (9.9%) |
| 5 to 9 Minutes | 267 (12.2%) | 466 (23.5%) |
| 10 to 14 Minutes | 288 (13.2%) | 276 (13.9%) |
| 15 to 19 Minutes | 232 (10.6%) | 186 (9.4%) |
| 20 to 24 Minutes | 183 (8.4%) | 250 (12.6%) |
| 25 to 29 Minutes | 58 (2.7%) | 92 (4.6%) |
| 30 to 34 Minutes | 207 (9.5%) | 126 (6.3%) |
| 35 to 39 Minutes | 35 (1.6%) | 43 (2.2%) |
| 40 to 44 Minutes | 62 (2.8%) | 47 (2.4%) |
| 45 to 59 Minutes | 240 (11.0%) | 176 (8.9%) |
| 60 to 89 Minutes | 272 (12.4%) | 85 (4.3%) |
| 90 or more Minutes | 92 (4.2%) | 42 (2.1%) |
Time of Departure to Work by Sex in Haskell County
The most frequent times of departure to work in Haskell County are 7:00 AM to 7:29 AM (319, 14.6%) for males and 7:30 AM to 7:59 AM (361, 18.2%) for females.
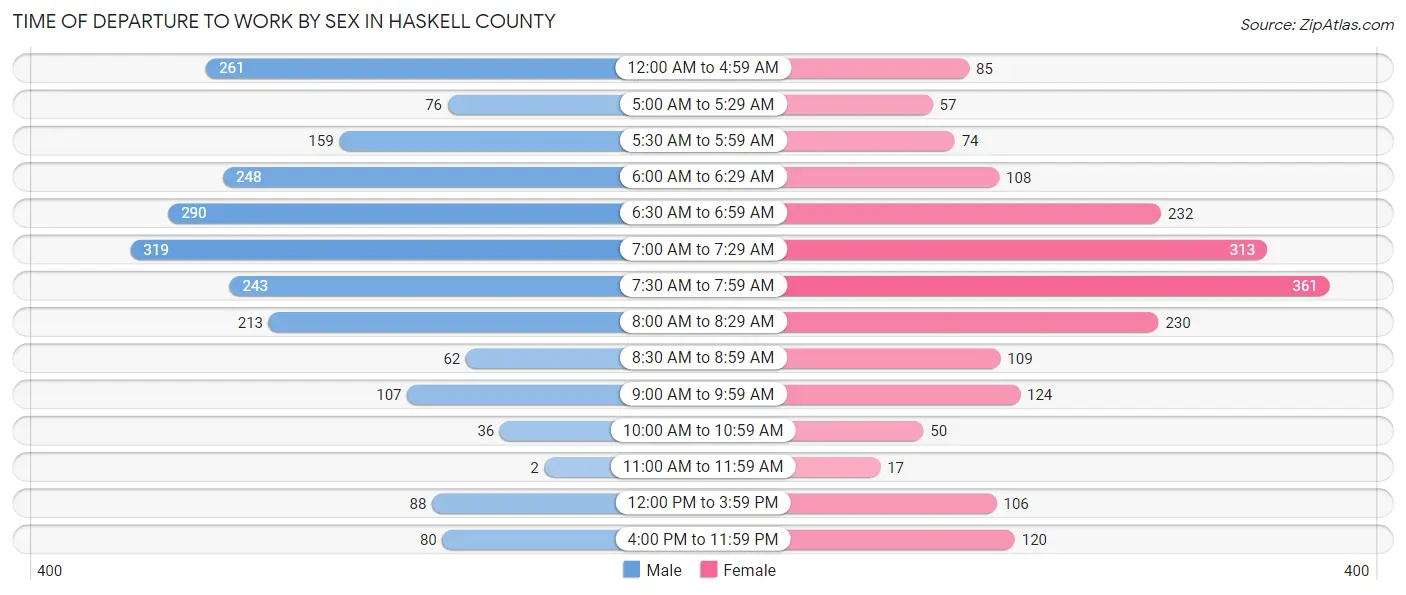
| Time of Departure | Male | Female |
| 12:00 AM to 4:59 AM | 261 (11.9%) | 85 (4.3%) |
| 5:00 AM to 5:29 AM | 76 (3.5%) | 57 (2.9%) |
| 5:30 AM to 5:59 AM | 159 (7.3%) | 74 (3.7%) |
| 6:00 AM to 6:29 AM | 248 (11.4%) | 108 (5.4%) |
| 6:30 AM to 6:59 AM | 290 (13.3%) | 232 (11.7%) |
| 7:00 AM to 7:29 AM | 319 (14.6%) | 313 (15.8%) |
| 7:30 AM to 7:59 AM | 243 (11.1%) | 361 (18.2%) |
| 8:00 AM to 8:29 AM | 213 (9.8%) | 230 (11.6%) |
| 8:30 AM to 8:59 AM | 62 (2.8%) | 109 (5.5%) |
| 9:00 AM to 9:59 AM | 107 (4.9%) | 124 (6.2%) |
| 10:00 AM to 10:59 AM | 36 (1.7%) | 50 (2.5%) |
| 11:00 AM to 11:59 AM | 2 (0.1%) | 17 (0.9%) |
| 12:00 PM to 3:59 PM | 88 (4.0%) | 106 (5.3%) |
| 4:00 PM to 11:59 PM | 80 (3.7%) | 120 (6.0%) |
| Total | 2,184 (100.0%) | 1,986 (100.0%) |
Housing Occupancy in Haskell County
Occupancy by Ownership in Haskell County
Of the total 4,518 dwellings in Haskell County, owner-occupied units account for 3,391 (75.1%), while renter-occupied units make up 1,127 (24.9%).
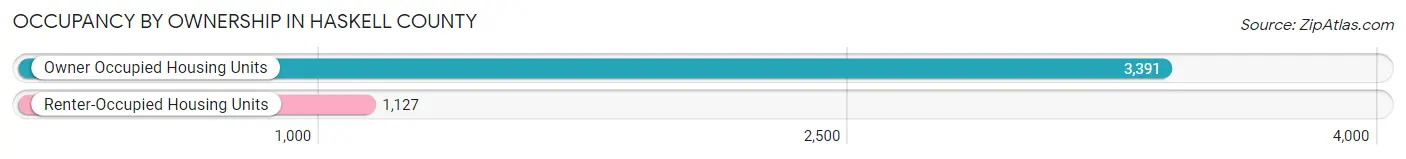
| Occupancy | # Housing Units | % Housing Units |
| Owner Occupied Housing Units | 3,391 | 75.1% |
| Renter-Occupied Housing Units | 1,127 | 24.9% |
| Total Occupied Housing Units | 4,518 | 100.0% |
Occupancy by Household Size in Haskell County
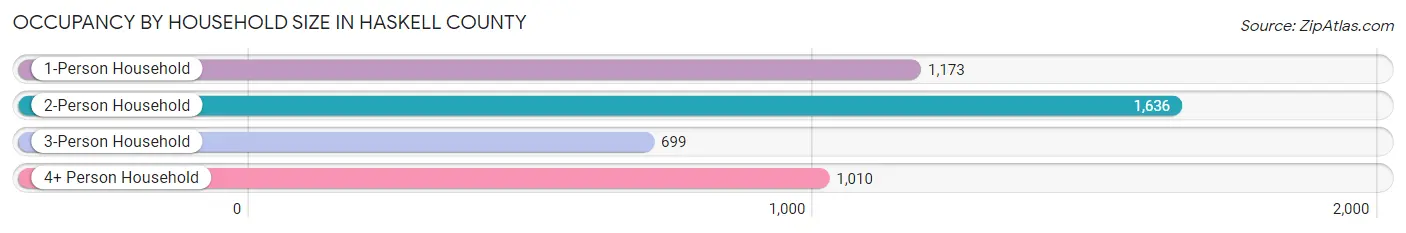
| Household Size | # Housing Units | % Housing Units |
| 1-Person Household | 1,173 | 26.0% |
| 2-Person Household | 1,636 | 36.2% |
| 3-Person Household | 699 | 15.5% |
| 4+ Person Household | 1,010 | 22.4% |
| Total Housing Units | 4,518 | 100.0% |
Occupancy by Ownership by Household Size in Haskell County
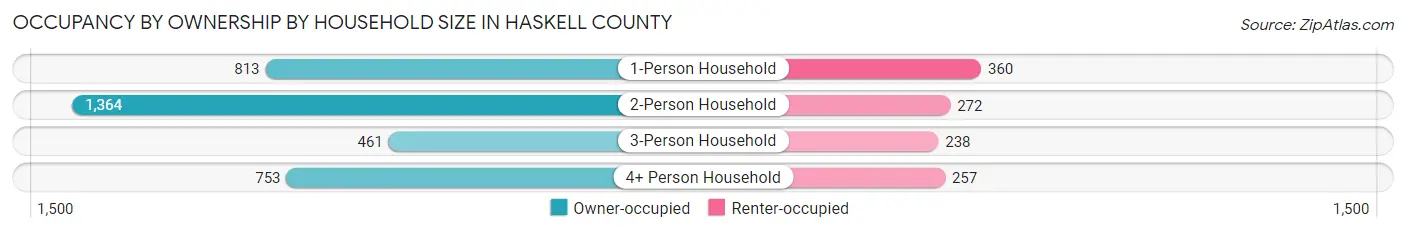
| Household Size | Owner-occupied | Renter-occupied |
| 1-Person Household | 813 (69.3%) | 360 (30.7%) |
| 2-Person Household | 1,364 (83.4%) | 272 (16.6%) |
| 3-Person Household | 461 (65.9%) | 238 (34.1%) |
| 4+ Person Household | 753 (74.6%) | 257 (25.5%) |
| Total Housing Units | 3,391 (75.1%) | 1,127 (24.9%) |
Occupancy by Educational Attainment in Haskell County
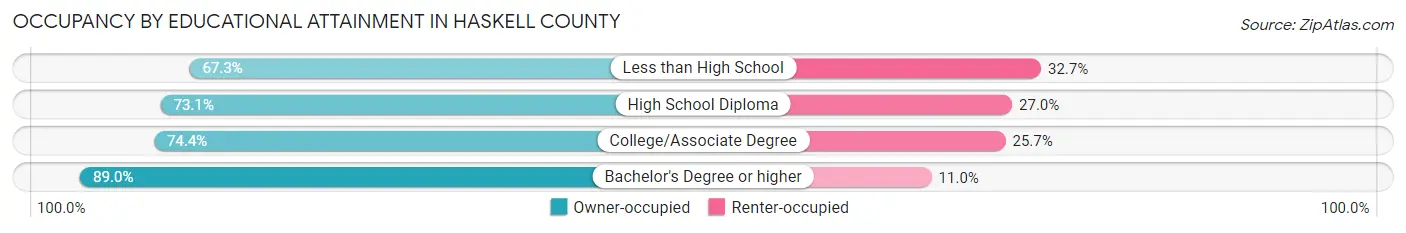
| Household Size | Owner-occupied | Renter-occupied |
| Less than High School | 455 (67.3%) | 221 (32.7%) |
| High School Diploma | 1,290 (73.1%) | 476 (27.0%) |
| College/Associate Degree | 1,023 (74.4%) | 353 (25.7%) |
| Bachelor's Degree or higher | 623 (89.0%) | 77 (11.0%) |
Occupancy by Age of Householder in Haskell County
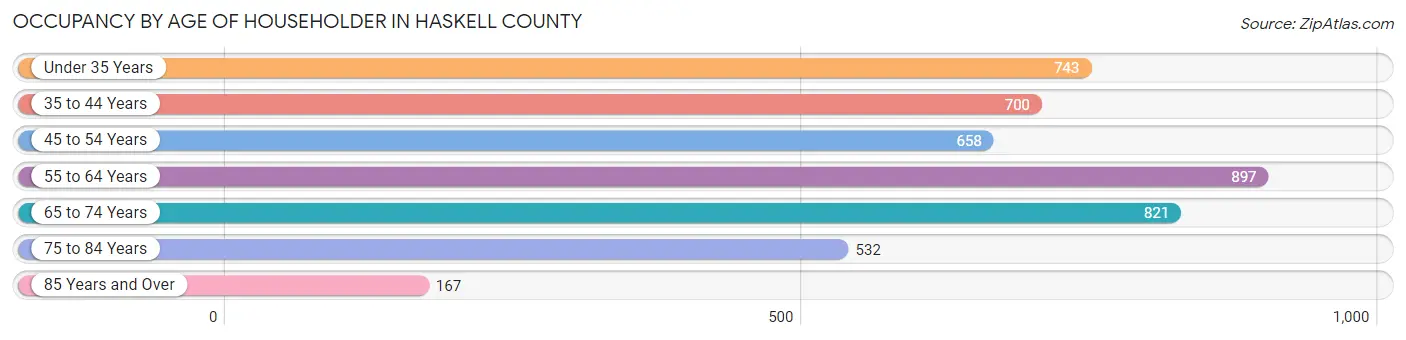
| Age Bracket | # Households | % Households |
| Under 35 Years | 743 | 16.5% |
| 35 to 44 Years | 700 | 15.5% |
| 45 to 54 Years | 658 | 14.6% |
| 55 to 64 Years | 897 | 19.9% |
| 65 to 74 Years | 821 | 18.2% |
| 75 to 84 Years | 532 | 11.8% |
| 85 Years and Over | 167 | 3.7% |
| Total | 4,518 | 100.0% |
Housing Finances in Haskell County
Median Income by Occupancy in Haskell County
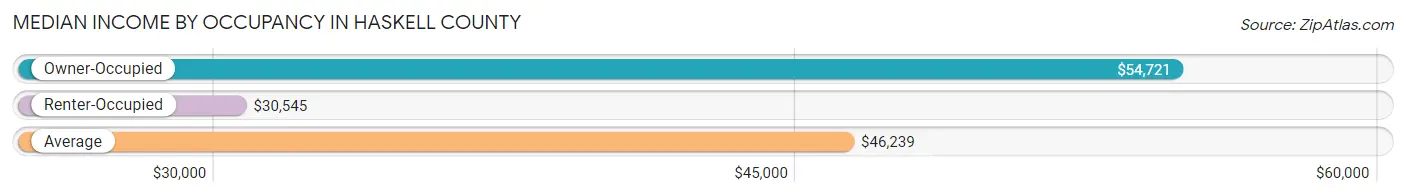
| Occupancy Type | # Households | Median Income |
| Owner-Occupied | 3,391 (75.1%) | $54,721 |
| Renter-Occupied | 1,127 (24.9%) | $30,545 |
| Average | 4,518 (100.0%) | $46,239 |
Occupancy by Householder Income Bracket in Haskell County
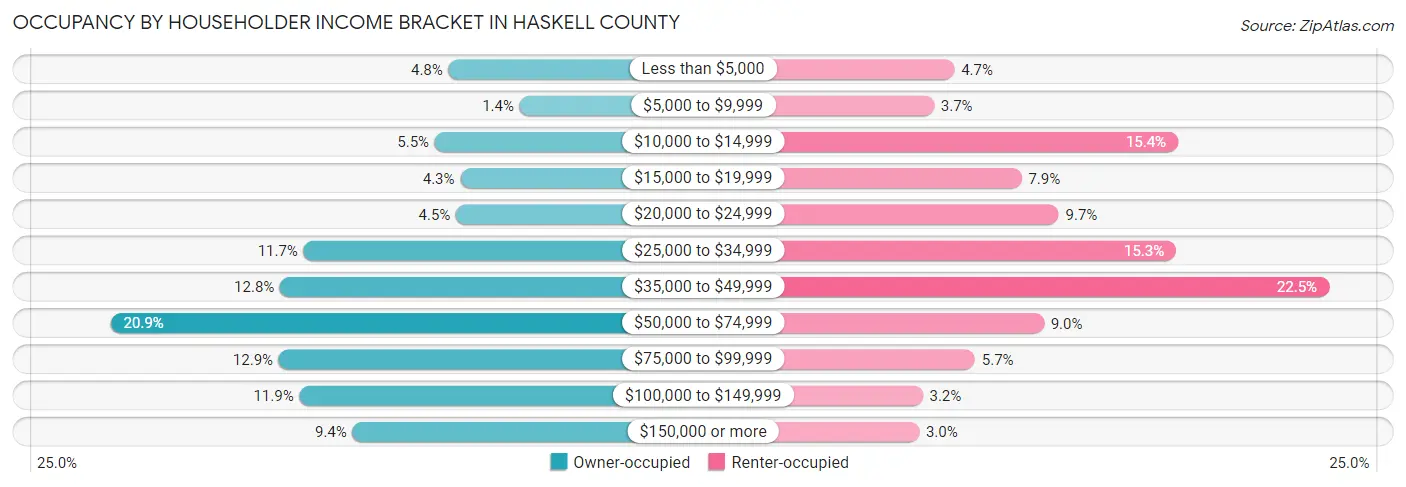
| Income Bracket | Owner-occupied | Renter-occupied |
| Less than $5,000 | 163 (4.8%) | 53 (4.7%) |
| $5,000 to $9,999 | 48 (1.4%) | 42 (3.7%) |
| $10,000 to $14,999 | 185 (5.5%) | 173 (15.3%) |
| $15,000 to $19,999 | 144 (4.3%) | 89 (7.9%) |
| $20,000 to $24,999 | 151 (4.4%) | 109 (9.7%) |
| $25,000 to $34,999 | 397 (11.7%) | 172 (15.3%) |
| $35,000 to $49,999 | 435 (12.8%) | 254 (22.5%) |
| $50,000 to $74,999 | 709 (20.9%) | 101 (9.0%) |
| $75,000 to $99,999 | 437 (12.9%) | 64 (5.7%) |
| $100,000 to $149,999 | 404 (11.9%) | 36 (3.2%) |
| $150,000 or more | 318 (9.4%) | 34 (3.0%) |
| Total | 3,391 (100.0%) | 1,127 (100.0%) |
Monthly Housing Cost Tiers in Haskell County
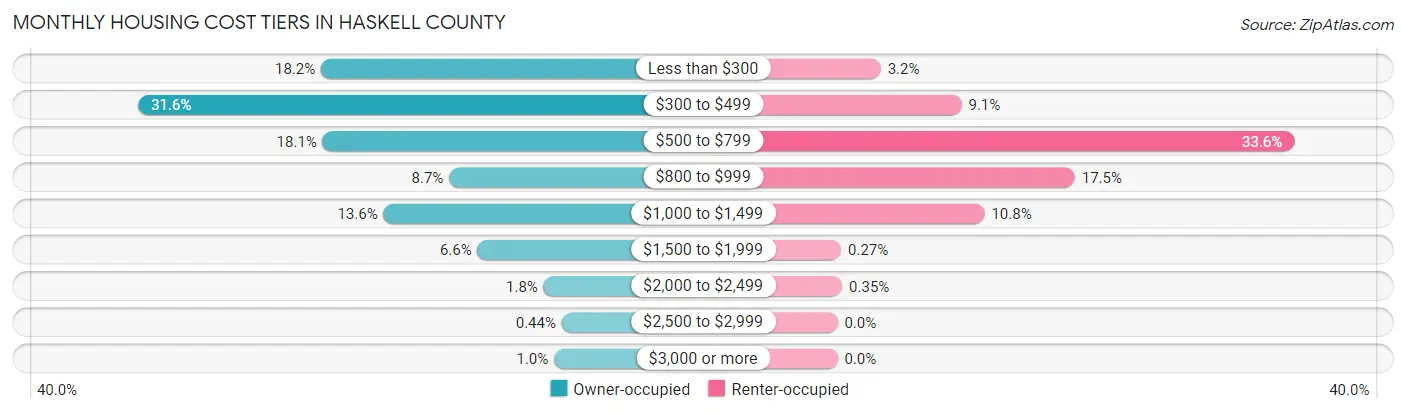
| Monthly Cost | Owner-occupied | Renter-occupied |
| Less than $300 | 616 (18.2%) | 36 (3.2%) |
| $300 to $499 | 1,073 (31.6%) | 103 (9.1%) |
| $500 to $799 | 612 (18.0%) | 379 (33.6%) |
| $800 to $999 | 296 (8.7%) | 197 (17.5%) |
| $1,000 to $1,499 | 460 (13.6%) | 122 (10.8%) |
| $1,500 to $1,999 | 225 (6.6%) | 3 (0.3%) |
| $2,000 to $2,499 | 60 (1.8%) | 4 (0.4%) |
| $2,500 to $2,999 | 15 (0.4%) | 0 (0.0%) |
| $3,000 or more | 34 (1.0%) | 0 (0.0%) |
| Total | 3,391 (100.0%) | 1,127 (100.0%) |
Physical Housing Characteristics in Haskell County
Housing Structures in Haskell County
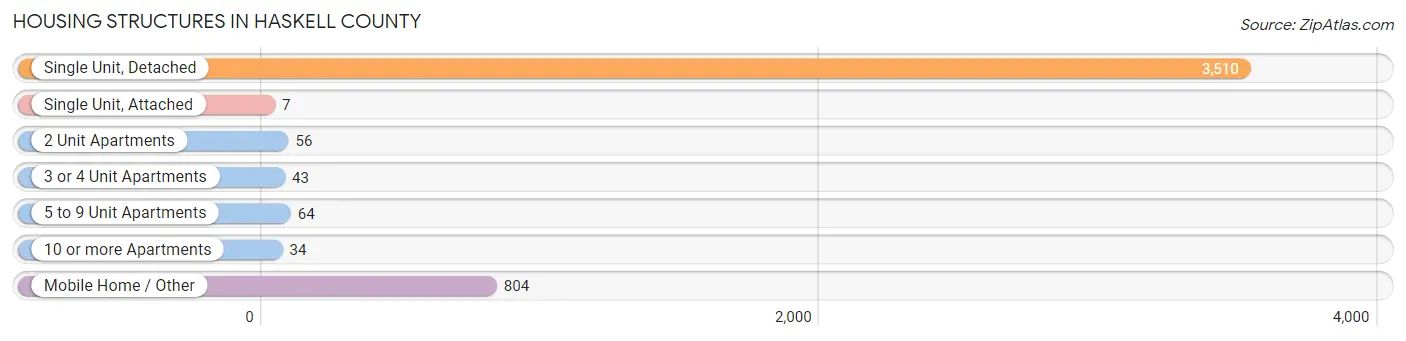
| Structure Type | # Housing Units | % Housing Units |
| Single Unit, Detached | 3,510 | 77.7% |
| Single Unit, Attached | 7 | 0.2% |
| 2 Unit Apartments | 56 | 1.2% |
| 3 or 4 Unit Apartments | 43 | 0.9% |
| 5 to 9 Unit Apartments | 64 | 1.4% |
| 10 or more Apartments | 34 | 0.7% |
| Mobile Home / Other | 804 | 17.8% |
| Total | 4,518 | 100.0% |
Housing Structures by Occupancy in Haskell County
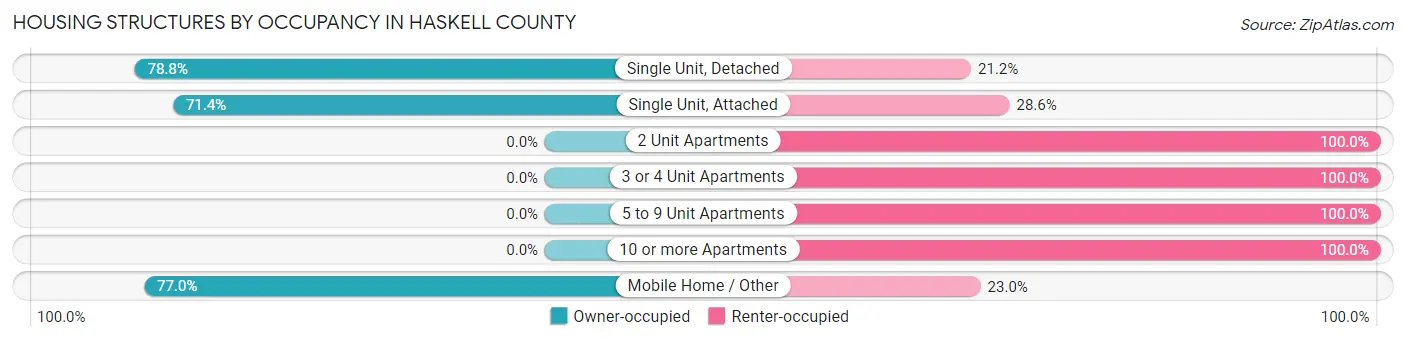
| Structure Type | Owner-occupied | Renter-occupied |
| Single Unit, Detached | 2,767 (78.8%) | 743 (21.2%) |
| Single Unit, Attached | 5 (71.4%) | 2 (28.6%) |
| 2 Unit Apartments | 0 (0.0%) | 56 (100.0%) |
| 3 or 4 Unit Apartments | 0 (0.0%) | 43 (100.0%) |
| 5 to 9 Unit Apartments | 0 (0.0%) | 64 (100.0%) |
| 10 or more Apartments | 0 (0.0%) | 34 (100.0%) |
| Mobile Home / Other | 619 (77.0%) | 185 (23.0%) |
| Total | 3,391 (75.1%) | 1,127 (24.9%) |
Housing Structures by Number of Rooms in Haskell County
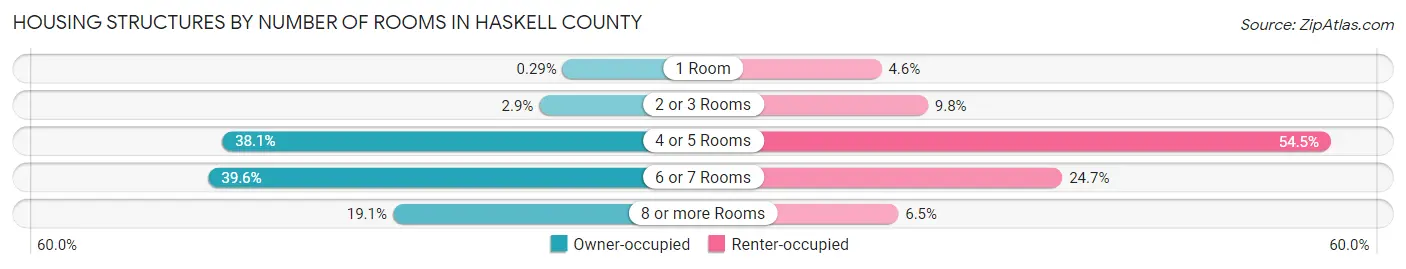
| Number of Rooms | Owner-occupied | Renter-occupied |
| 1 Room | 10 (0.3%) | 52 (4.6%) |
| 2 or 3 Rooms | 98 (2.9%) | 110 (9.8%) |
| 4 or 5 Rooms | 1,291 (38.1%) | 614 (54.5%) |
| 6 or 7 Rooms | 1,343 (39.6%) | 278 (24.7%) |
| 8 or more Rooms | 649 (19.1%) | 73 (6.5%) |
| Total | 3,391 (100.0%) | 1,127 (100.0%) |
Housing Structure by Heating Type in Haskell County
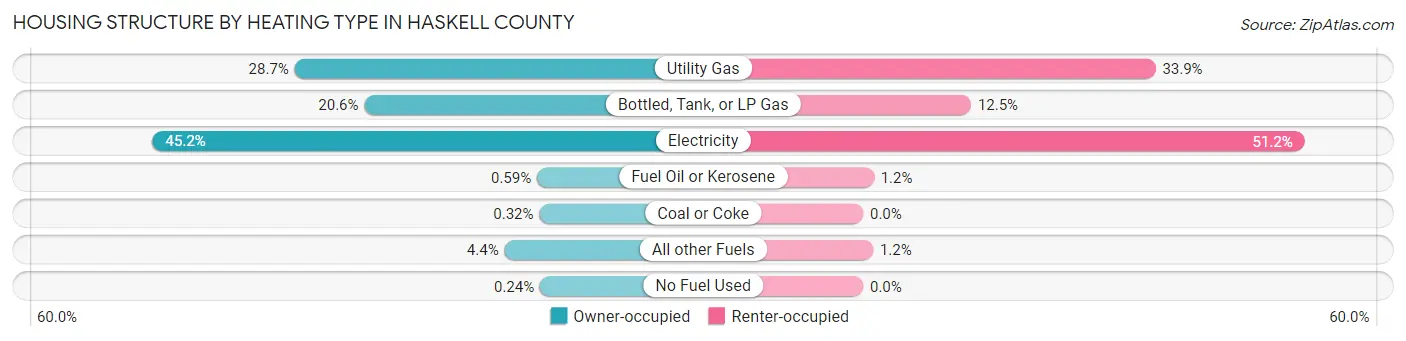
| Heating Type | Owner-occupied | Renter-occupied |
| Utility Gas | 973 (28.7%) | 382 (33.9%) |
| Bottled, Tank, or LP Gas | 699 (20.6%) | 141 (12.5%) |
| Electricity | 1,532 (45.2%) | 577 (51.2%) |
| Fuel Oil or Kerosene | 20 (0.6%) | 14 (1.2%) |
| Coal or Coke | 11 (0.3%) | 0 (0.0%) |
| All other Fuels | 148 (4.4%) | 13 (1.1%) |
| No Fuel Used | 8 (0.2%) | 0 (0.0%) |
| Total | 3,391 (100.0%) | 1,127 (100.0%) |
Household Vehicle Usage in Haskell County
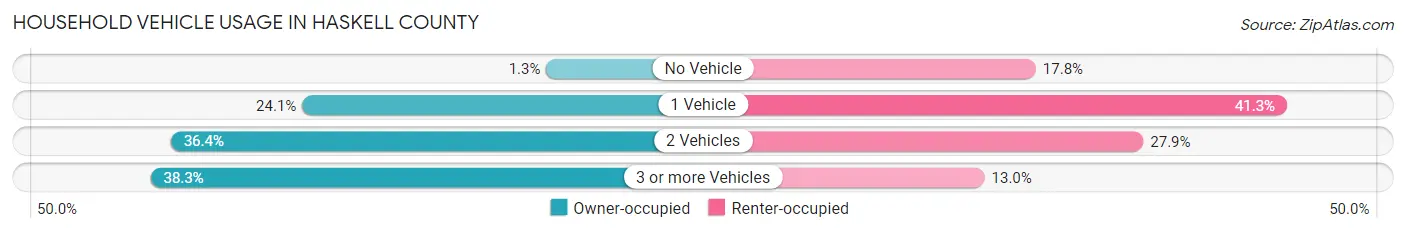
| Vehicles per Household | Owner-occupied | Renter-occupied |
| No Vehicle | 44 (1.3%) | 201 (17.8%) |
| 1 Vehicle | 817 (24.1%) | 465 (41.3%) |
| 2 Vehicles | 1,233 (36.4%) | 314 (27.9%) |
| 3 or more Vehicles | 1,297 (38.3%) | 147 (13.0%) |
| Total | 3,391 (100.0%) | 1,127 (100.0%) |
Real Estate & Mortgages in Haskell County
Real Estate and Mortgage Overview in Haskell County
| Characteristic | Without Mortgage | With Mortgage |
| Housing Units | 2,120 | 1,271 |
| Median Property Value | $96,400 | $128,200 |
| Median Household Income | $46,462 | $127 |
| Monthly Housing Costs | $376 | $23 |
| Real Estate Taxes | $393 | $79 |
Property Value by Mortgage Status in Haskell County
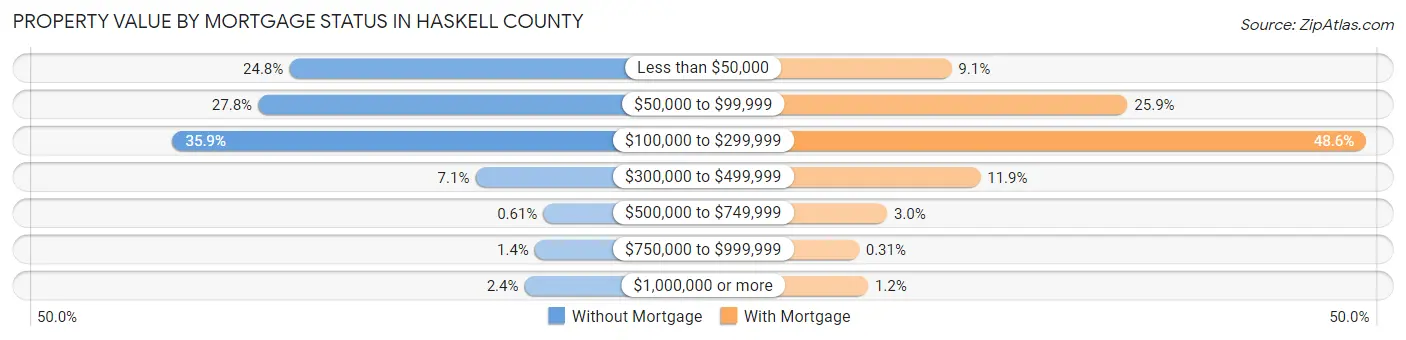
| Property Value | Without Mortgage | With Mortgage |
| Less than $50,000 | 526 (24.8%) | 116 (9.1%) |
| $50,000 to $99,999 | 589 (27.8%) | 329 (25.9%) |
| $100,000 to $299,999 | 761 (35.9%) | 618 (48.6%) |
| $300,000 to $499,999 | 150 (7.1%) | 151 (11.9%) |
| $500,000 to $749,999 | 13 (0.6%) | 38 (3.0%) |
| $750,000 to $999,999 | 30 (1.4%) | 4 (0.3%) |
| $1,000,000 or more | 51 (2.4%) | 15 (1.2%) |
| Total | 2,120 (100.0%) | 1,271 (100.0%) |
Household Income by Mortgage Status in Haskell County
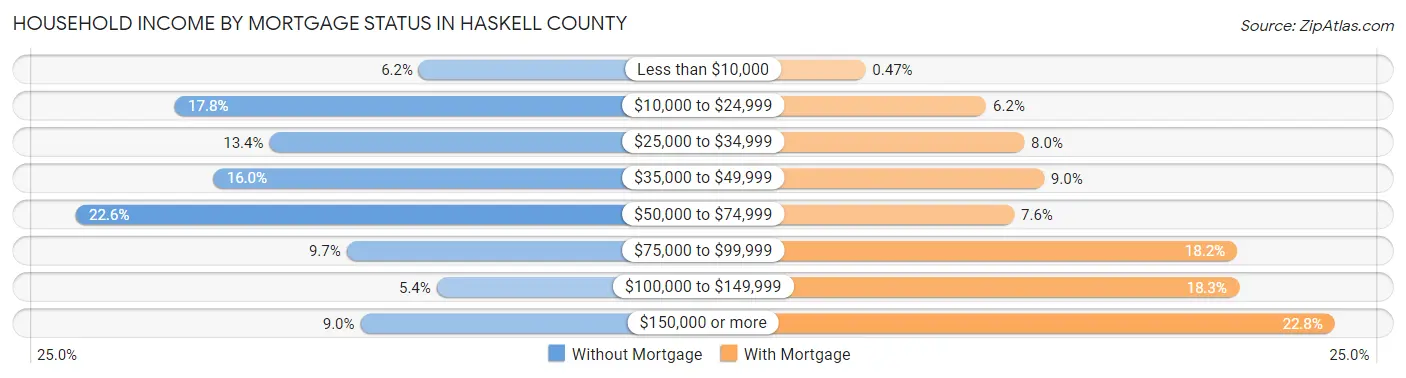
| Household Income | Without Mortgage | With Mortgage |
| Less than $10,000 | 132 (6.2%) | 6 (0.5%) |
| $10,000 to $24,999 | 378 (17.8%) | 79 (6.2%) |
| $25,000 to $34,999 | 283 (13.4%) | 102 (8.0%) |
| $35,000 to $49,999 | 339 (16.0%) | 114 (9.0%) |
| $50,000 to $74,999 | 478 (22.6%) | 96 (7.5%) |
| $75,000 to $99,999 | 205 (9.7%) | 231 (18.2%) |
| $100,000 to $149,999 | 114 (5.4%) | 232 (18.2%) |
| $150,000 or more | 191 (9.0%) | 290 (22.8%) |
| Total | 2,120 (100.0%) | 1,271 (100.0%) |
Property Value to Household Income Ratio in Haskell County
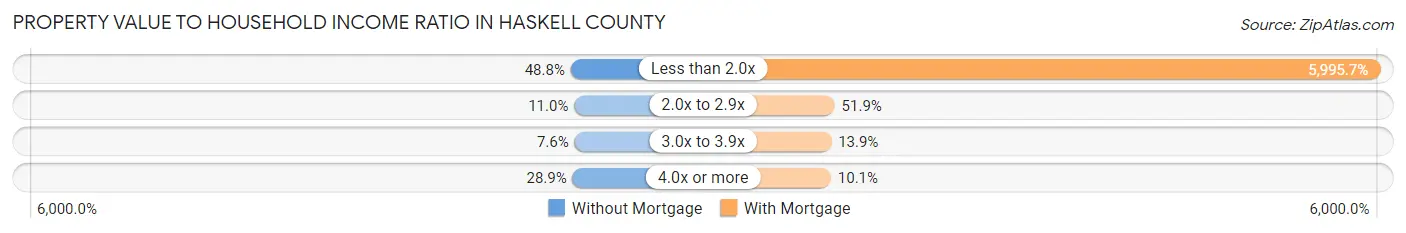
| Value-to-Income Ratio | Without Mortgage | With Mortgage |
| Less than 2.0x | 1,035 (48.8%) | 76,205 (5,995.7%) |
| 2.0x to 2.9x | 234 (11.0%) | 659 (51.8%) |
| 3.0x to 3.9x | 161 (7.6%) | 177 (13.9%) |
| 4.0x or more | 612 (28.9%) | 128 (10.1%) |
| Total | 2,120 (100.0%) | 1,271 (100.0%) |
Real Estate Taxes by Mortgage Status in Haskell County
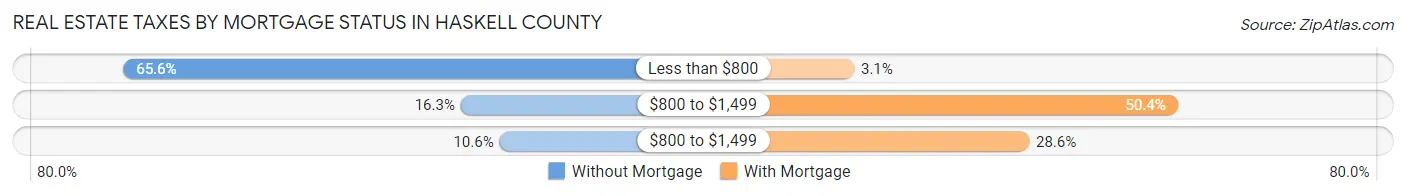
| Property Taxes | Without Mortgage | With Mortgage |
| Less than $800 | 1,390 (65.6%) | 39 (3.1%) |
| $800 to $1,499 | 345 (16.3%) | 640 (50.3%) |
| $800 to $1,499 | 225 (10.6%) | 364 (28.6%) |
| Total | 2,120 (100.0%) | 1,271 (100.0%) |
Health & Disability in Haskell County
Health Insurance Coverage by Age in Haskell County
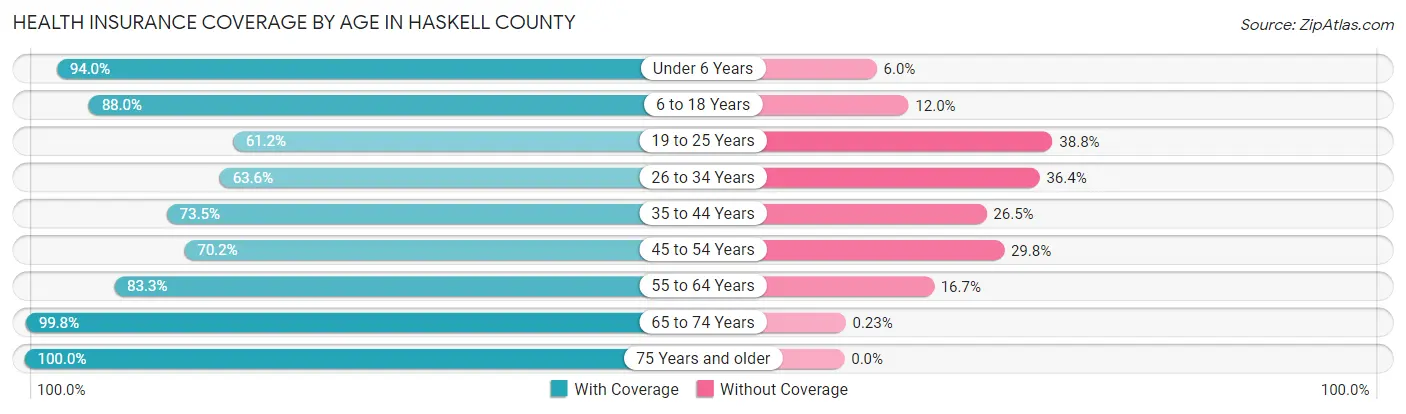
| Age Bracket | With Coverage | Without Coverage |
| Under 6 Years | 765 (94.0%) | 49 (6.0%) |
| 6 to 18 Years | 1,810 (88.0%) | 246 (12.0%) |
| 19 to 25 Years | 544 (61.2%) | 345 (38.8%) |
| 26 to 34 Years | 734 (63.6%) | 420 (36.4%) |
| 35 to 44 Years | 1,054 (73.5%) | 380 (26.5%) |
| 45 to 54 Years | 941 (70.2%) | 399 (29.8%) |
| 55 to 64 Years | 1,314 (83.3%) | 263 (16.7%) |
| 65 to 74 Years | 1,328 (99.8%) | 3 (0.2%) |
| 75 Years and older | 981 (100.0%) | 0 (0.0%) |
| Total | 9,471 (81.8%) | 2,105 (18.2%) |
Health Insurance Coverage by Citizenship Status in Haskell County
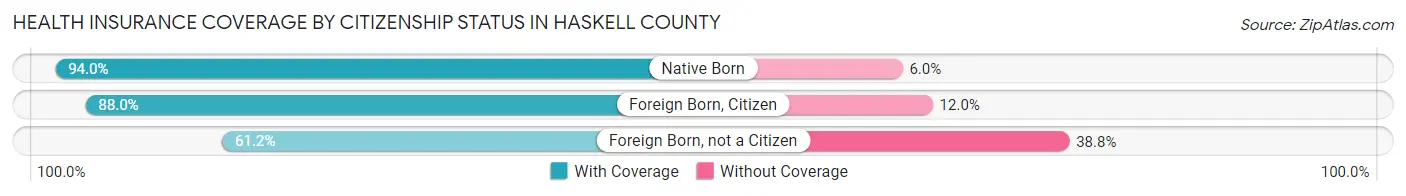
| Citizenship Status | With Coverage | Without Coverage |
| Native Born | 765 (94.0%) | 49 (6.0%) |
| Foreign Born, Citizen | 1,810 (88.0%) | 246 (12.0%) |
| Foreign Born, not a Citizen | 544 (61.2%) | 345 (38.8%) |
Health Insurance Coverage by Household Income in Haskell County
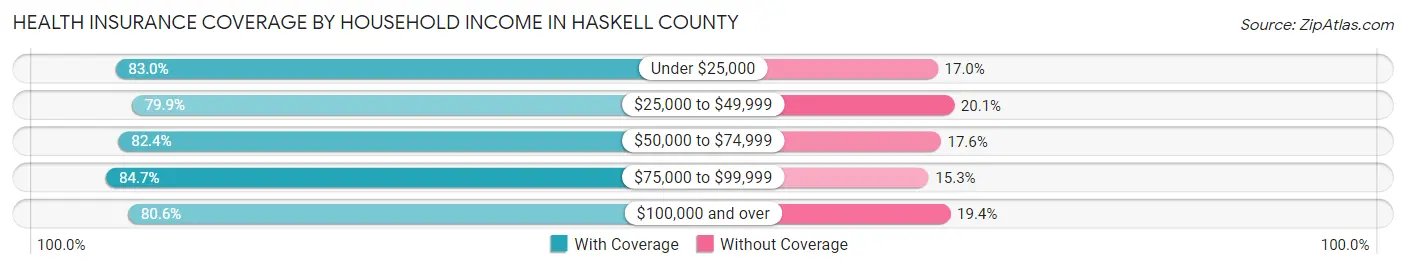
| Household Income | With Coverage | Without Coverage |
| Under $25,000 | 1,825 (83.0%) | 374 (17.0%) |
| $25,000 to $49,999 | 2,413 (79.9%) | 606 (20.1%) |
| $50,000 to $74,999 | 1,784 (82.4%) | 380 (17.6%) |
| $75,000 to $99,999 | 1,324 (84.7%) | 239 (15.3%) |
| $100,000 and over | 2,107 (80.6%) | 506 (19.4%) |
Public vs Private Health Insurance Coverage by Age in Haskell County
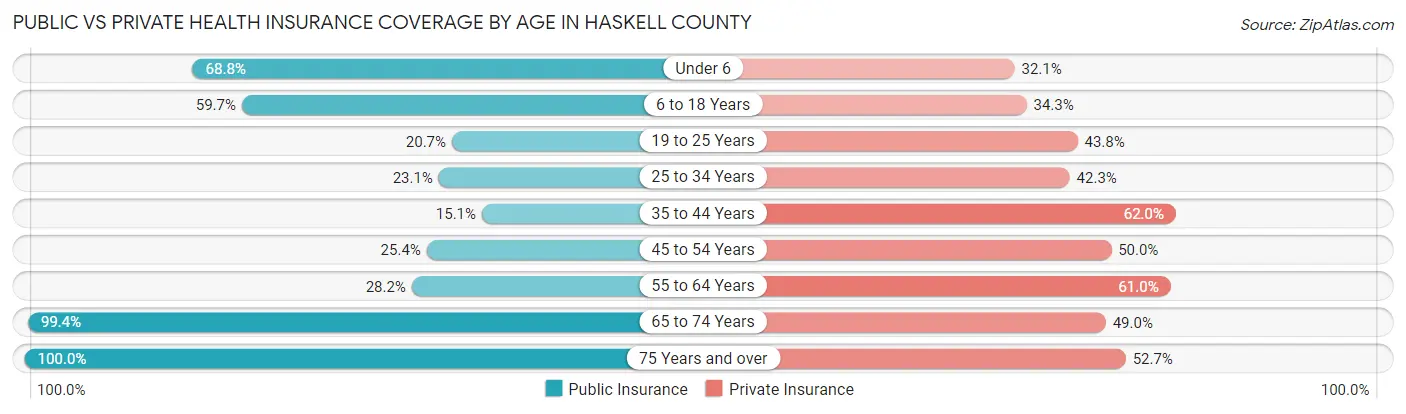
| Age Bracket | Public Insurance | Private Insurance |
| Under 6 | 560 (68.8%) | 261 (32.1%) |
| 6 to 18 Years | 1,227 (59.7%) | 705 (34.3%) |
| 19 to 25 Years | 184 (20.7%) | 389 (43.8%) |
| 25 to 34 Years | 267 (23.1%) | 488 (42.3%) |
| 35 to 44 Years | 217 (15.1%) | 889 (62.0%) |
| 45 to 54 Years | 340 (25.4%) | 670 (50.0%) |
| 55 to 64 Years | 444 (28.1%) | 962 (61.0%) |
| 65 to 74 Years | 1,323 (99.4%) | 652 (49.0%) |
| 75 Years and over | 981 (100.0%) | 517 (52.7%) |
| Total | 5,543 (47.9%) | 5,533 (47.8%) |
Disability Status by Sex by Age in Haskell County
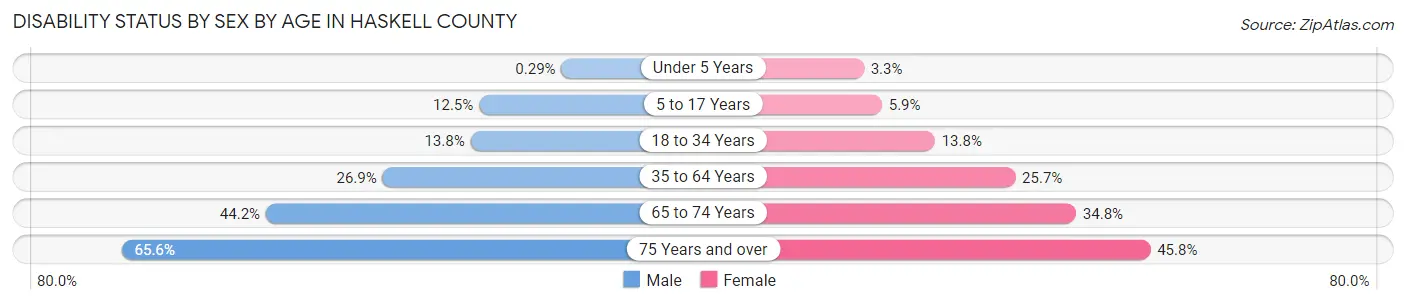
| Age Bracket | Male | Female |
| Under 5 Years | 1 (0.3%) | 11 (3.3%) |
| 5 to 17 Years | 133 (12.5%) | 58 (5.9%) |
| 18 to 34 Years | 156 (13.8%) | 147 (13.8%) |
| 35 to 64 Years | 580 (26.9%) | 564 (25.7%) |
| 65 to 74 Years | 288 (44.2%) | 236 (34.8%) |
| 75 Years and over | 284 (65.6%) | 251 (45.8%) |
Disability Class by Sex by Age in Haskell County
Disability Class: Hearing Difficulty
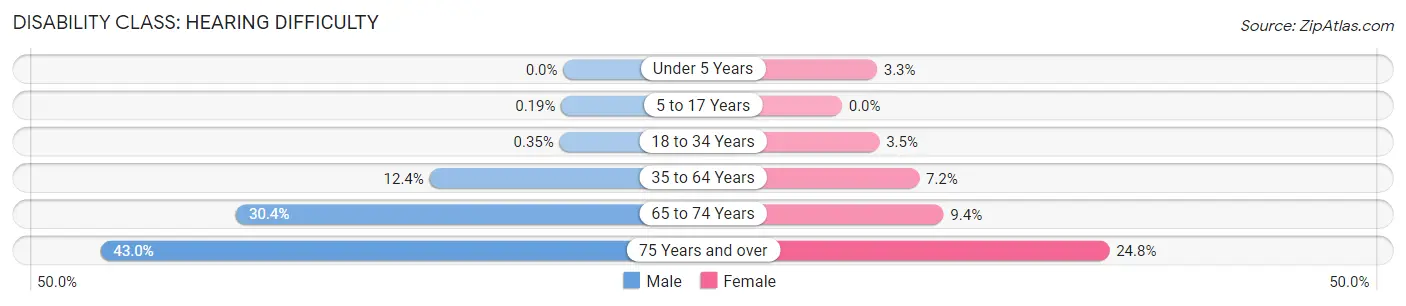
| Age Bracket | Male | Female |
| Under 5 Years | 0 (0.0%) | 11 (3.3%) |
| 5 to 17 Years | 2 (0.2%) | 0 (0.0%) |
| 18 to 34 Years | 4 (0.4%) | 37 (3.5%) |
| 35 to 64 Years | 268 (12.4%) | 157 (7.2%) |
| 65 to 74 Years | 198 (30.4%) | 64 (9.4%) |
| 75 Years and over | 186 (43.0%) | 136 (24.8%) |
Disability Class: Vision Difficulty
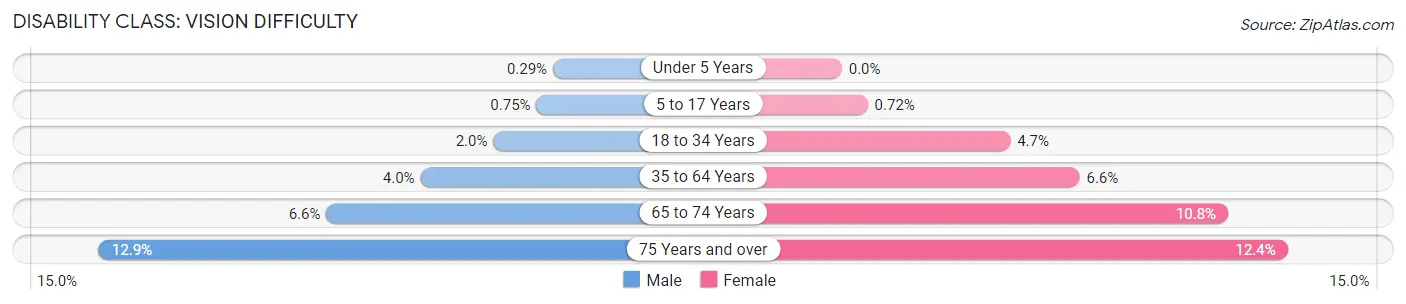
| Age Bracket | Male | Female |
| Under 5 Years | 1 (0.3%) | 0 (0.0%) |
| 5 to 17 Years | 8 (0.7%) | 7 (0.7%) |
| 18 to 34 Years | 22 (1.9%) | 50 (4.7%) |
| 35 to 64 Years | 86 (4.0%) | 145 (6.6%) |
| 65 to 74 Years | 43 (6.6%) | 73 (10.7%) |
| 75 Years and over | 56 (12.9%) | 68 (12.4%) |
Disability Class: Cognitive Difficulty
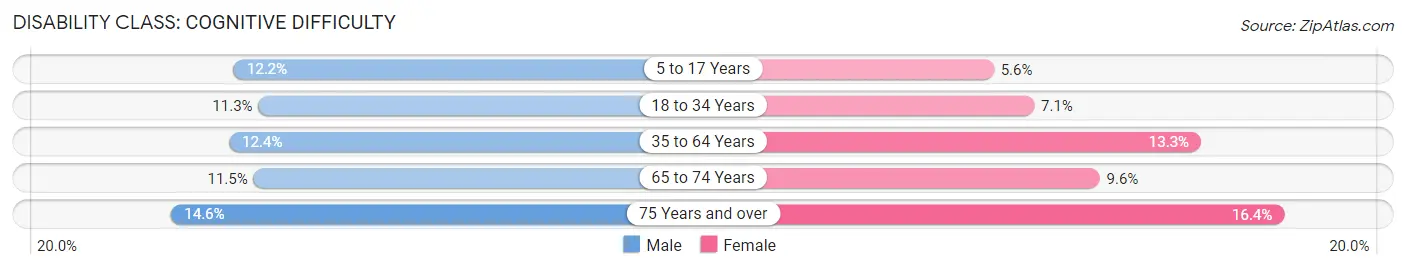
| Age Bracket | Male | Female |
| 5 to 17 Years | 130 (12.2%) | 55 (5.6%) |
| 18 to 34 Years | 128 (11.3%) | 76 (7.1%) |
| 35 to 64 Years | 268 (12.4%) | 292 (13.3%) |
| 65 to 74 Years | 75 (11.5%) | 65 (9.6%) |
| 75 Years and over | 63 (14.5%) | 90 (16.4%) |
Disability Class: Ambulatory Difficulty
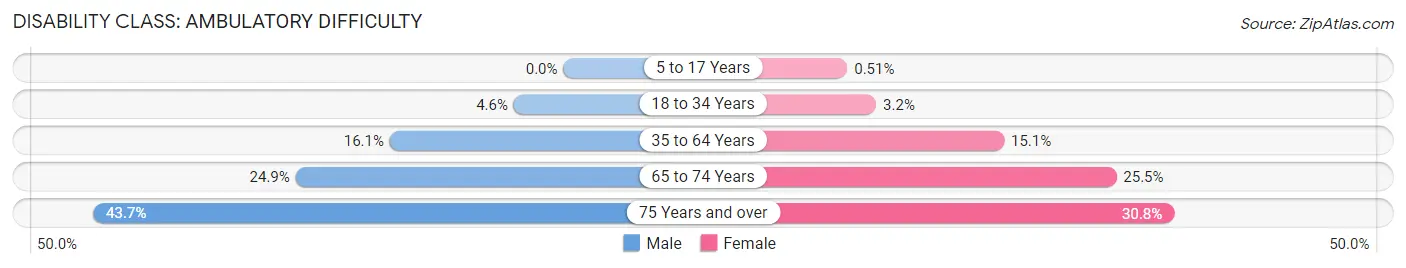
| Age Bracket | Male | Female |
| 5 to 17 Years | 0 (0.0%) | 5 (0.5%) |
| 18 to 34 Years | 52 (4.6%) | 34 (3.2%) |
| 35 to 64 Years | 348 (16.1%) | 330 (15.1%) |
| 65 to 74 Years | 162 (24.8%) | 173 (25.5%) |
| 75 Years and over | 189 (43.6%) | 169 (30.8%) |
Disability Class: Self-Care Difficulty
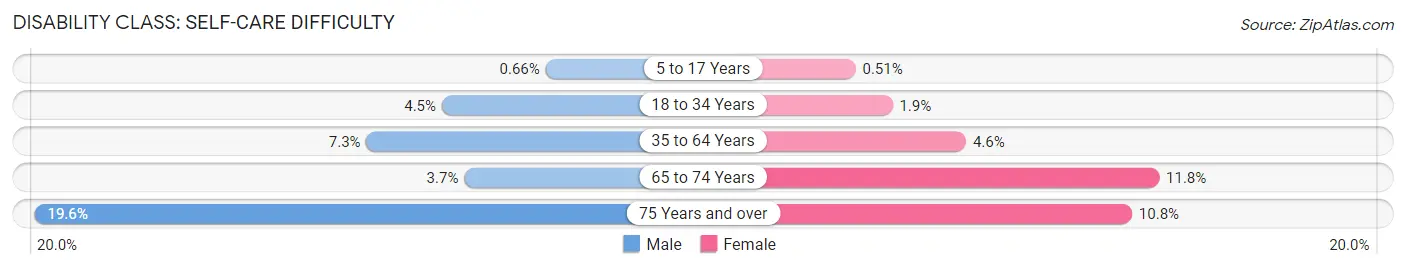
| Age Bracket | Male | Female |
| 5 to 17 Years | 7 (0.7%) | 5 (0.5%) |
| 18 to 34 Years | 51 (4.5%) | 20 (1.9%) |
| 35 to 64 Years | 158 (7.3%) | 101 (4.6%) |
| 65 to 74 Years | 24 (3.7%) | 80 (11.8%) |
| 75 Years and over | 85 (19.6%) | 59 (10.8%) |
Technology Access in Haskell County
Computing Device Access in Haskell County
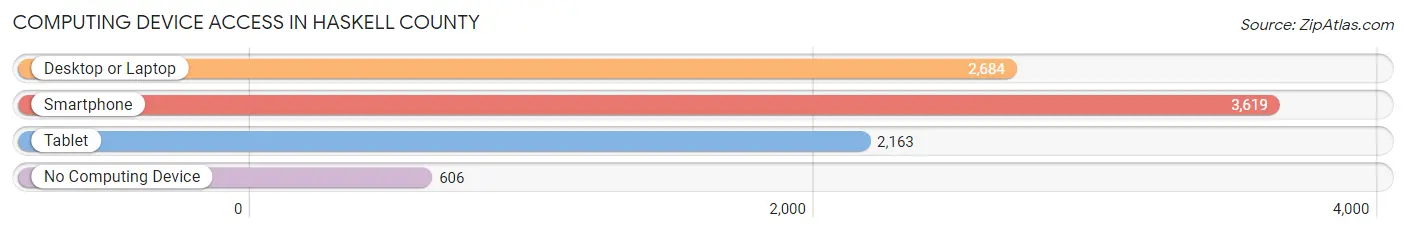
| Device Type | # Households | % Households |
| Desktop or Laptop | 2,684 | 59.4% |
| Smartphone | 3,619 | 80.1% |
| Tablet | 2,163 | 47.9% |
| No Computing Device | 606 | 13.4% |
| Total | 4,518 | 100.0% |
Internet Access in Haskell County
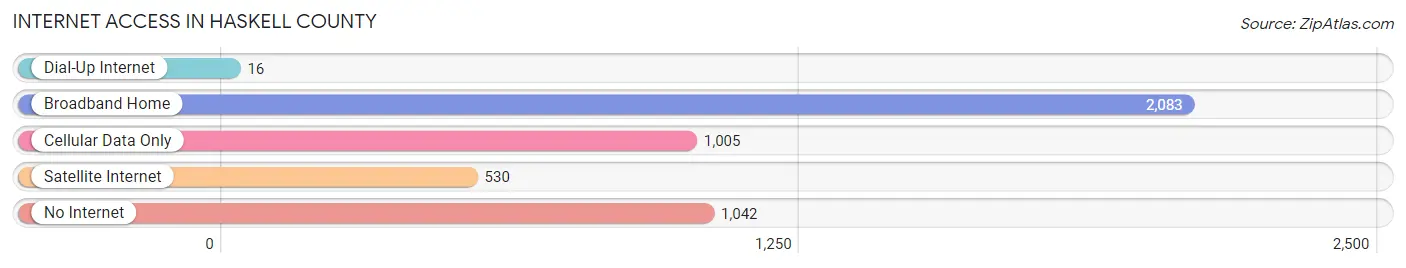
| Internet Type | # Households | % Households |
| Dial-Up Internet | 16 | 0.4% |
| Broadband Home | 2,083 | 46.1% |
| Cellular Data Only | 1,005 | 22.2% |
| Satellite Internet | 530 | 11.7% |
| No Internet | 1,042 | 23.1% |
| Total | 4,518 | 100.0% |
Haskell County Summary
Haskell County, Oklahoma is located in the southeastern corner of the state and is bordered by Muskogee County to the north, Sequoyah County to the east, Le Flore County to the south, and McIntosh County to the west. The county seat is Stigler, and the county was named for Charles N. Haskell, the first governor of Oklahoma. The county has a total area of 590 square miles, of which 588 square miles is land and 2 square miles is water.
Geography
Haskell County is located in the foothills of the Ozark Mountains and is part of the Arkansas River Valley. The terrain is mostly rolling hills and valleys, with some flat areas in the northern part of the county. The highest point in the county is located in the northwest corner, at an elevation of 1,065 feet. The county is drained by the Arkansas River and its tributaries, including the Poteau River, the Illinois River, and the Kiamichi River.
The climate of Haskell County is humid subtropical, with hot, humid summers and mild winters. The average annual temperature is 64°F, and the average annual precipitation is 45 inches.
Economy
The economy of Haskell County is largely based on agriculture. The county is home to a variety of crops, including corn, soybeans, wheat, cotton, and hay. Livestock production is also important, with cattle, hogs, and poultry being the main animals raised.
The county is also home to several manufacturing companies, including a paper mill, a furniture factory, and a plastics plant. Tourism is also an important part of the economy, with several lakes and rivers providing recreational opportunities.
Demographics
As of the 2010 census, Haskell County had a population of 12,769. The racial makeup of the county was 79.2% White, 0.7% African American, 15.2% Native American, 0.2% Asian, 0.1% Pacific Islander, 0.7% from other races, and 3.9% from two or more races. Hispanic or Latino of any race were 2.7% of the population.
The median income for a household in the county was $30,945, and the median income for a family was $35,938. The per capita income for the county was $15,845. About 17.2% of families and 21.2% of the population were below the poverty line, including 28.2% of those under age 18 and 16.2% of those age 65 or over.
Education
Haskell County is served by the Haskell County Public Schools system, which includes one high school, one middle school, and four elementary schools. The county also has one private school, Stigler Christian Academy. The county is home to Eastern Oklahoma State College, a two-year college located in Wilburton.
Common Questions
What is Per Capita Income in Haskell County?
Per Capita income in Haskell County is $25,234.
What is the Median Family Income in Haskell County?
Median Family Income in Haskell County is $58,261.
What is the Median Household income in Haskell County?
Median Household Income in Haskell County is $46,239.
What is Income or Wage Gap in Haskell County?
Income or Wage Gap in Haskell County is 30.9%.
Women in Haskell County earn 69.1 cents for every dollar earned by a man.
What is Family Income Deficit in Haskell County?
Family Income Deficit in Haskell County is $10,579.
Families that are below poverty line in Haskell County earn $10,579 less on average than the poverty threshold level.
What is Inequality or Gini Index in Haskell County?
Inequality or Gini Index in Haskell County is 0.46.
What is the Total Population of Haskell County?
Total Population of Haskell County is 11,651.
What is the Total Male Population of Haskell County?
Total Male Population of Haskell County is 5,811.
What is the Total Female Population of Haskell County?
Total Female Population of Haskell County is 5,840.
What is the Ratio of Males per 100 Females in Haskell County?
There are 99.50 Males per 100 Females in Haskell County.
What is the Ratio of Females per 100 Males in Haskell County?
There are 100.50 Females per 100 Males in Haskell County.
What is the Median Population Age in Haskell County?
Median Population Age in Haskell County is 41.3 Years.
What is the Average Family Size in Haskell County
Average Family Size in Haskell County is 3.1 People.
What is the Average Household Size in Haskell County
Average Household Size in Haskell County is 2.6 People.
How Large is the Labor Force in Haskell County?
There are 4,881 People in the Labor Forcein in Haskell County.
What is the Percentage of People in the Labor Force in Haskell County?
52.7% of People are in the Labor Force in Haskell County.
What is the Unemployment Rate in Haskell County?
Unemployment Rate in Haskell County is 7.7%.