Harmon County, OK Map & Demographics
Harmon County Map
Harmon County Overview
$31,814
PER CAPITA INCOME
$64,375
AVG FAMILY INCOME
$55,729
AVG HOUSEHOLD INCOME
43.3%
WAGE / INCOME GAP [ % ]
56.7¢/ $1
WAGE / INCOME GAP [ $ ]
$13,730
FAMILY INCOME DEFICIT
0.51
INEQUALITY / GINI INDEX
2,499
TOTAL POPULATION
1,243
MALE POPULATION
1,256
FEMALE POPULATION
98.96
MALES / 100 FEMALES
101.05
FEMALES / 100 MALES
40.7
MEDIAN AGE
3.1
AVG FAMILY SIZE
2.5
AVG HOUSEHOLD SIZE
1,183
LABOR FORCE [ PEOPLE ]
59.3%
PERCENT IN LABOR FORCE
7.4%
UNEMPLOYMENT RATE
Harmon County Area Codes
Income in Harmon County
Income Overview in Harmon County
Per Capita Income in Harmon County is $31,814, while median incomes of families and households are $64,375 and $55,729 respectively.
| Characteristic | Number | Measure |
| Per Capita Income | 2,499 | $31,814 |
| Median Family Income | 631 | $64,375 |
| Mean Family Income | 631 | $92,722 |
| Median Household Income | 954 | $55,729 |
| Mean Household Income | 954 | $80,947 |
| Income Deficit | 631 | $13,730 |
| Wage / Income Gap (%) | 2,499 | 43.35% |
| Wage / Income Gap ($) | 2,499 | 56.65¢ per $1 |
| Gini / Inequality Index | 2,499 | 0.51 |
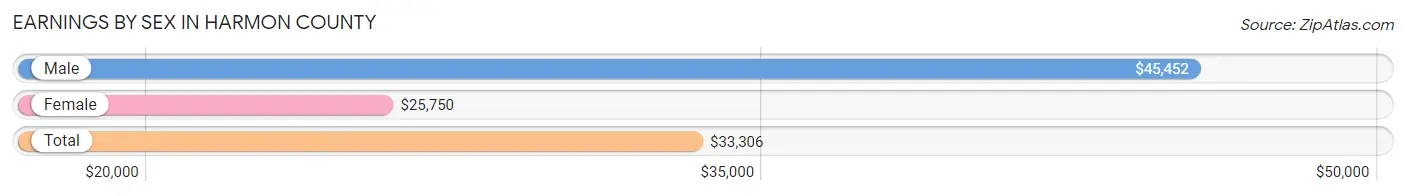
Earnings by Sex in Harmon County
Average Earnings in Harmon County are $33,306, $45,452 for men and $25,750 for women, a difference of 43.3%.
| Sex | Number | Average Earnings |
| Male | 729 (61.1%) | $45,452 |
| Female | 465 (38.9%) | $25,750 |
| Total | 1,194 (100.0%) | $33,306 |
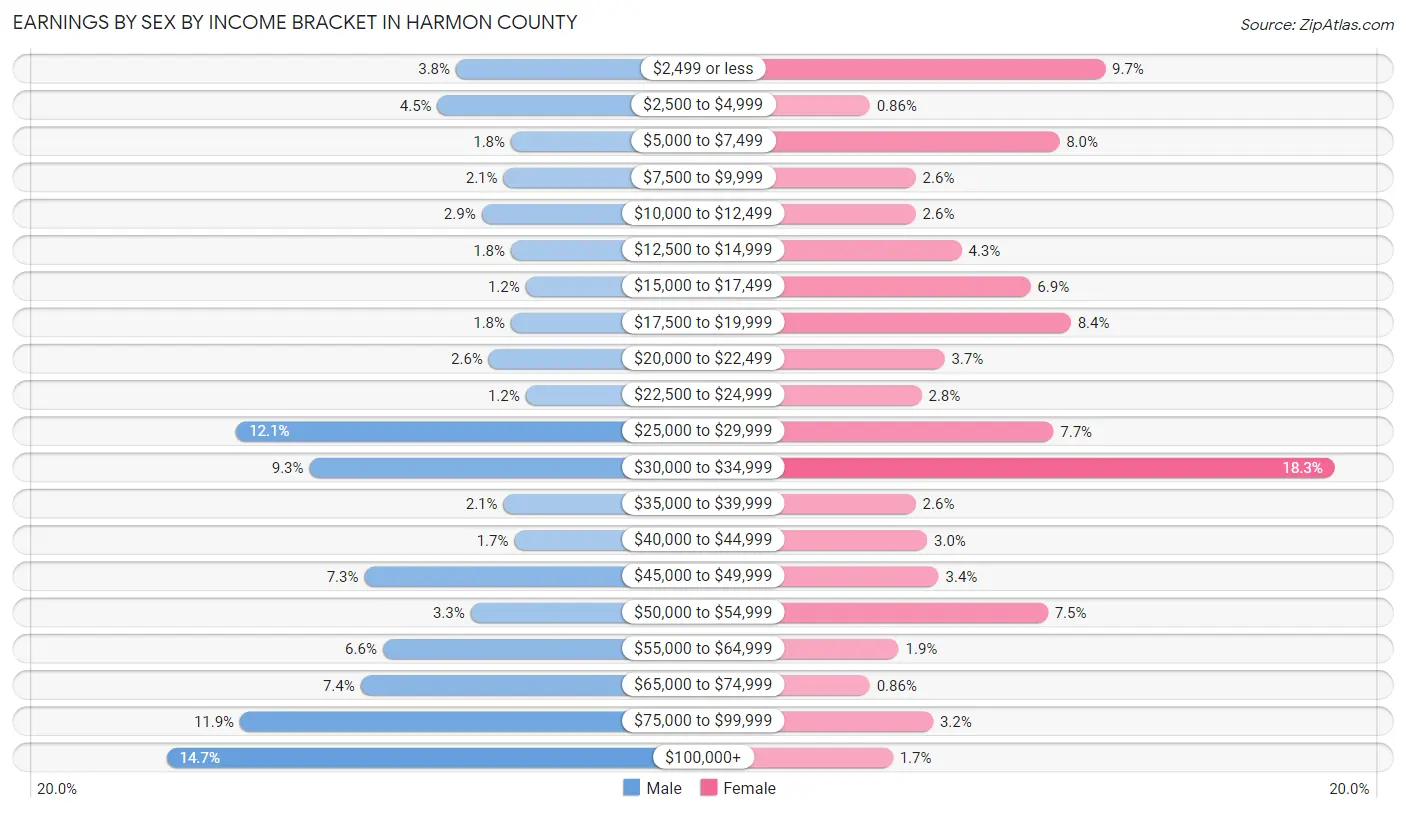
Earnings by Sex by Income Bracket in Harmon County
The most common earnings brackets in Harmon County are $100,000+ for men (107 | 14.7%) and $30,000 to $34,999 for women (85 | 18.3%).
| Income | Male | Female |
| $2,499 or less | 28 (3.8%) | 45 (9.7%) |
| $2,500 to $4,999 | 33 (4.5%) | 4 (0.9%) |
| $5,000 to $7,499 | 13 (1.8%) | 37 (8.0%) |
| $7,500 to $9,999 | 15 (2.1%) | 12 (2.6%) |
| $10,000 to $12,499 | 21 (2.9%) | 12 (2.6%) |
| $12,500 to $14,999 | 13 (1.8%) | 20 (4.3%) |
| $15,000 to $17,499 | 9 (1.2%) | 32 (6.9%) |
| $17,500 to $19,999 | 13 (1.8%) | 39 (8.4%) |
| $20,000 to $22,499 | 19 (2.6%) | 17 (3.7%) |
| $22,500 to $24,999 | 9 (1.2%) | 13 (2.8%) |
| $25,000 to $29,999 | 88 (12.1%) | 36 (7.7%) |
| $30,000 to $34,999 | 68 (9.3%) | 85 (18.3%) |
| $35,000 to $39,999 | 15 (2.1%) | 12 (2.6%) |
| $40,000 to $44,999 | 12 (1.7%) | 14 (3.0%) |
| $45,000 to $49,999 | 53 (7.3%) | 16 (3.4%) |
| $50,000 to $54,999 | 24 (3.3%) | 35 (7.5%) |
| $55,000 to $64,999 | 48 (6.6%) | 9 (1.9%) |
| $65,000 to $74,999 | 54 (7.4%) | 4 (0.9%) |
| $75,000 to $99,999 | 87 (11.9%) | 15 (3.2%) |
| $100,000+ | 107 (14.7%) | 8 (1.7%) |
| Total | 729 (100.0%) | 465 (100.0%) |
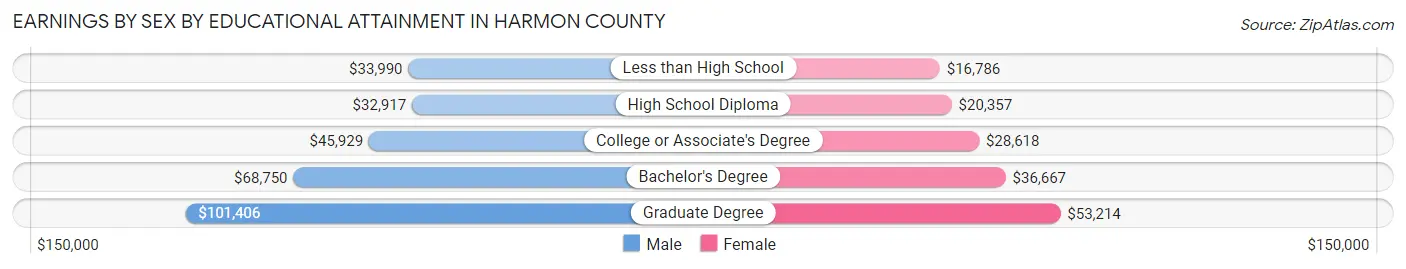
Earnings by Sex by Educational Attainment in Harmon County
Average earnings in Harmon County are $47,708 for men and $22,981 for women, a difference of 51.8%. Men with an educational attainment of graduate degree enjoy the highest average annual earnings of $101,406, while those with high school diploma education earn the least with $32,917. Women with an educational attainment of graduate degree earn the most with the average annual earnings of $53,214, while those with less than high school education have the smallest earnings of $16,786.
| Educational Attainment | Male Income | Female Income |
| Less than High School | $33,990 | $16,786 |
| High School Diploma | $32,917 | $20,357 |
| College or Associate's Degree | $45,929 | $28,618 |
| Bachelor's Degree | $68,750 | $36,667 |
| Graduate Degree | $101,406 | $53,214 |
| Total | $47,708 | $22,981 |
Family Income in Harmon County
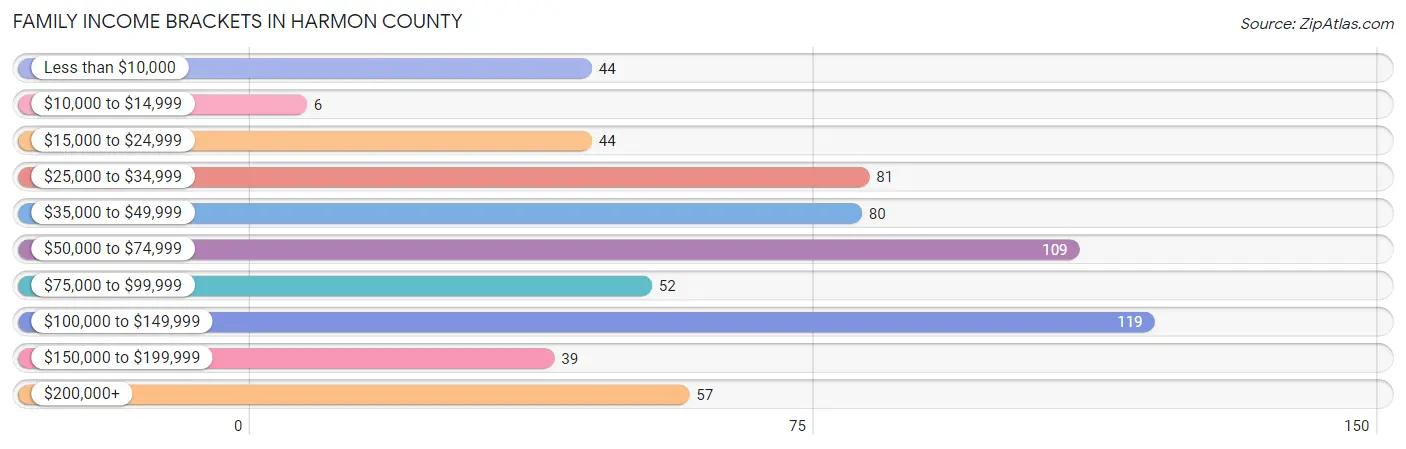
Family Income Brackets in Harmon County
According to the Harmon County family income data, there are 119 families falling into the $100,000 to $149,999 income range, which is the most common income bracket and makes up 18.9% of all families. Conversely, the $10,000 to $14,999 income bracket is the least frequent group with only 6 families (0.9%) belonging to this category.
| Income Bracket | # Families | % Families |
| Less than $10,000 | 44 | 7.0% |
| $10,000 to $14,999 | 6 | 1.0% |
| $15,000 to $24,999 | 44 | 7.0% |
| $25,000 to $34,999 | 81 | 12.8% |
| $35,000 to $49,999 | 80 | 12.7% |
| $50,000 to $74,999 | 109 | 17.3% |
| $75,000 to $99,999 | 52 | 8.2% |
| $100,000 to $149,999 | 119 | 18.9% |
| $150,000 to $199,999 | 39 | 6.2% |
| $200,000+ | 57 | 9.0% |
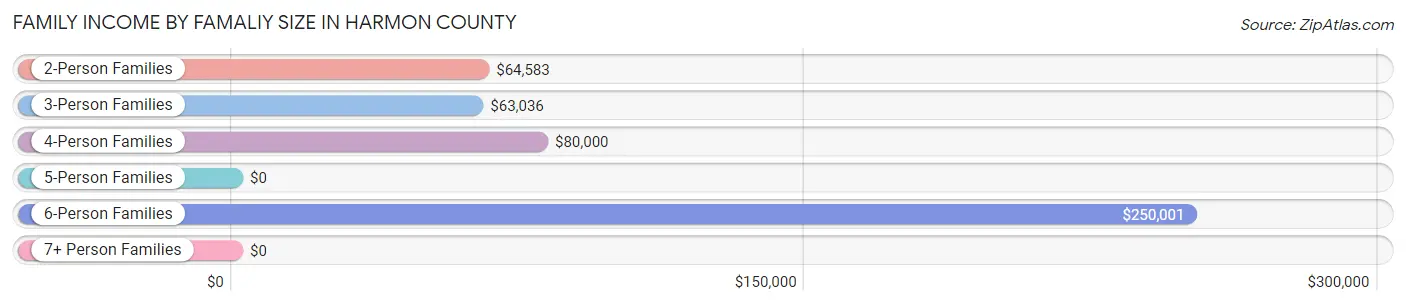
Family Income by Famaliy Size in Harmon County
6-person families (30 | 4.8%) account for the highest median family income in Harmon County with $250,001 per family, while 6-person families (30 | 4.8%) have the highest median income of $41,667 per family member.
| Income Bracket | # Families | Median Income |
| 2-Person Families | 275 (43.6%) | $64,583 |
| 3-Person Families | 127 (20.1%) | $63,036 |
| 4-Person Families | 134 (21.2%) | $80,000 |
| 5-Person Families | 53 (8.4%) | $0 |
| 6-Person Families | 30 (4.8%) | $250,001 |
| 7+ Person Families | 12 (1.9%) | $0 |
| Total | 631 (100.0%) | $64,375 |
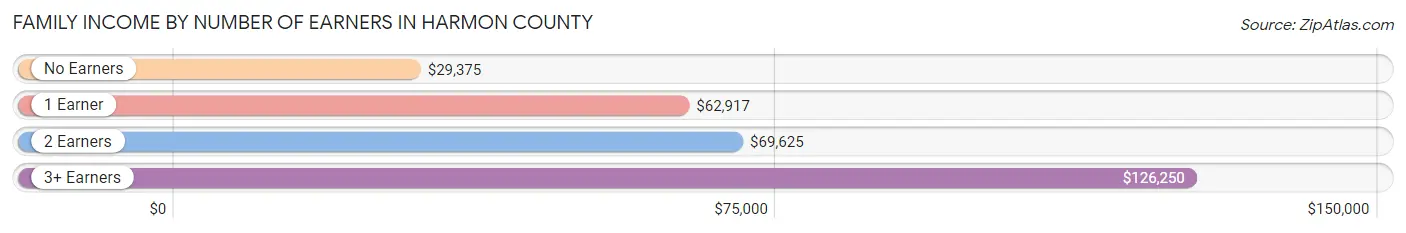
Family Income by Number of Earners in Harmon County
The median family income in Harmon County is $64,375, with families comprising 3+ earners (66) having the highest median family income of $126,250, while families with no earners (97) have the lowest median family income of $29,375, accounting for 10.5% and 15.4% of families, respectively.
| Number of Earners | # Families | Median Income |
| No Earners | 97 (15.4%) | $29,375 |
| 1 Earner | 275 (43.6%) | $62,917 |
| 2 Earners | 193 (30.6%) | $69,625 |
| 3+ Earners | 66 (10.5%) | $126,250 |
| Total | 631 (100.0%) | $64,375 |
Household Income in Harmon County
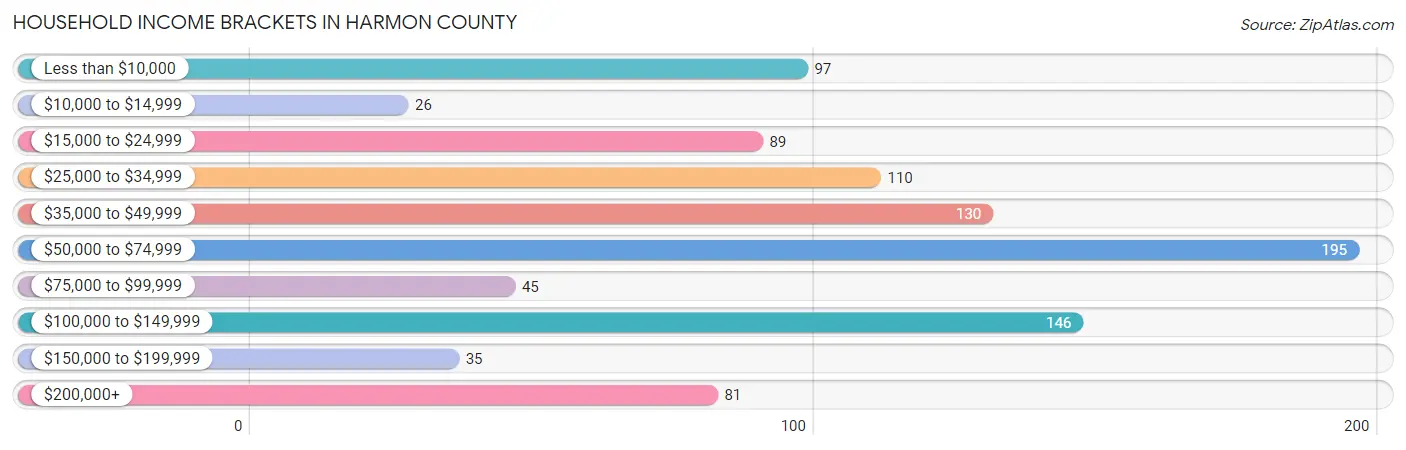
Household Income Brackets in Harmon County
With 195 households falling in the category, the $50,000 to $74,999 income range is the most frequent in Harmon County, accounting for 20.4% of all households. In contrast, only 26 households (2.7%) fall into the $10,000 to $14,999 income bracket, making it the least populous group.
| Income Bracket | # Households | % Households |
| Less than $10,000 | 97 | 10.2% |
| $10,000 to $14,999 | 26 | 2.7% |
| $15,000 to $24,999 | 89 | 9.3% |
| $25,000 to $34,999 | 110 | 11.5% |
| $35,000 to $49,999 | 130 | 13.6% |
| $50,000 to $74,999 | 195 | 20.4% |
| $75,000 to $99,999 | 45 | 4.7% |
| $100,000 to $149,999 | 146 | 15.3% |
| $150,000 to $199,999 | 35 | 3.7% |
| $200,000+ | 81 | 8.5% |
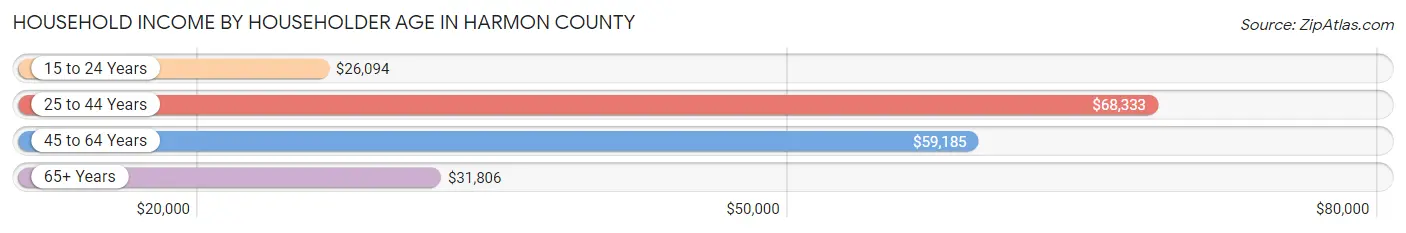
Household Income by Householder Age in Harmon County
The median household income in Harmon County is $55,729, with the highest median household income of $68,333 found in the 25 to 44 years age bracket for the primary householder. A total of 274 households (28.7%) fall into this category. Meanwhile, the 15 to 24 years age bracket for the primary householder has the lowest median household income of $26,094, with 15 households (1.6%) in this group.
| Income Bracket | # Households | Median Income |
| 15 to 24 Years | 15 (1.6%) | $26,094 |
| 25 to 44 Years | 274 (28.7%) | $68,333 |
| 45 to 64 Years | 392 (41.1%) | $59,185 |
| 65+ Years | 273 (28.6%) | $31,806 |
| Total | 954 (100.0%) | $55,729 |
Poverty in Harmon County
Income Below Poverty by Sex and Age in Harmon County
With 14.5% poverty level for males and 20.6% for females among the residents of Harmon County, 5 year old males and 5 year old females are the most vulnerable to poverty, with 11 males (40.7%) and 5 females (55.6%) in their respective age groups living below the poverty level.
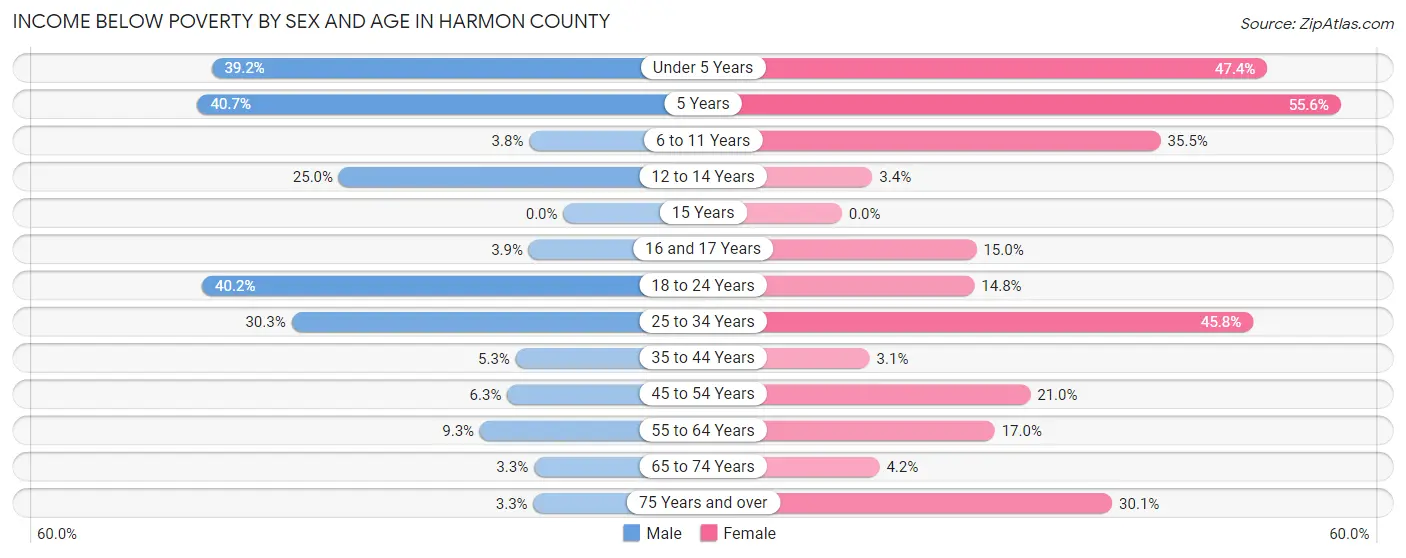
| Age Bracket | Male | Female |
| Under 5 Years | 29 (39.2%) | 27 (47.4%) |
| 5 Years | 11 (40.7%) | 5 (55.6%) |
| 6 to 11 Years | 3 (3.8%) | 38 (35.5%) |
| 12 to 14 Years | 11 (25.0%) | 3 (3.4%) |
| 15 Years | 0 (0.0%) | 0 (0.0%) |
| 16 and 17 Years | 3 (3.8%) | 3 (15.0%) |
| 18 to 24 Years | 35 (40.2%) | 13 (14.8%) |
| 25 to 34 Years | 43 (30.3%) | 60 (45.8%) |
| 35 to 44 Years | 6 (5.3%) | 4 (3.1%) |
| 45 to 54 Years | 12 (6.2%) | 34 (21.0%) |
| 55 to 64 Years | 13 (9.3%) | 31 (17.0%) |
| 65 to 74 Years | 5 (3.3%) | 6 (4.2%) |
| 75 Years and over | 2 (3.3%) | 28 (30.1%) |
| Total | 173 (14.5%) | 252 (20.6%) |
Income Above Poverty by Sex and Age in Harmon County
According to the poverty statistics in Harmon County, males aged 15 years and females aged 15 years are the age groups that are most secure financially, with 100.0% of males and 100.0% of females in these age groups living above the poverty line.
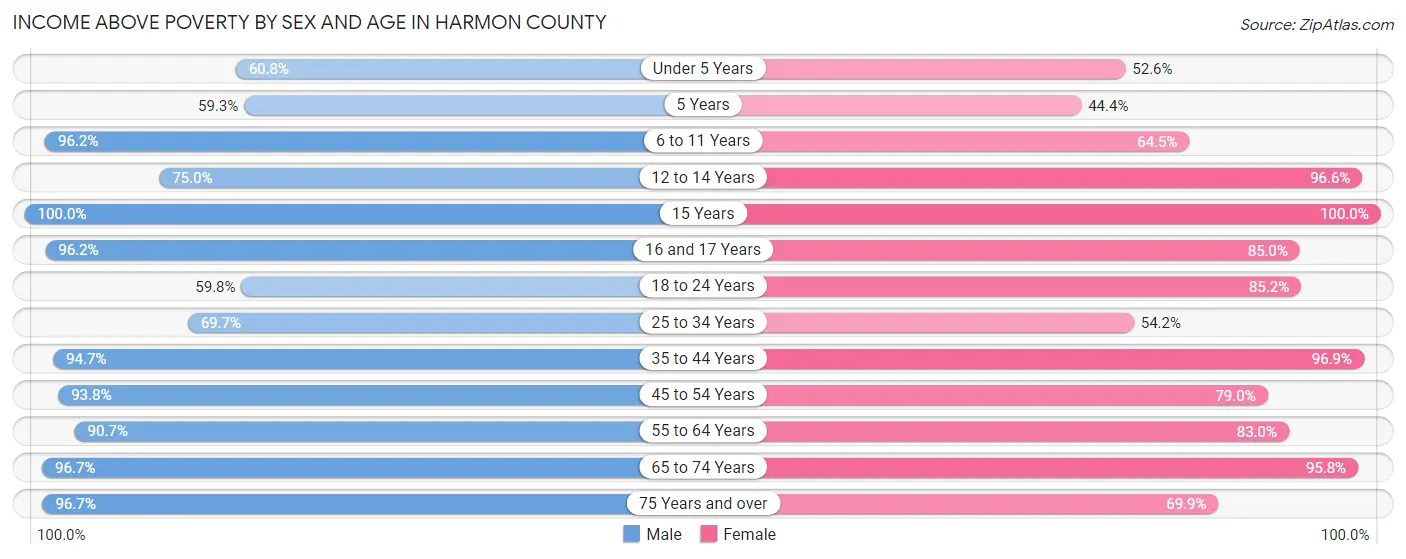
| Age Bracket | Male | Female |
| Under 5 Years | 45 (60.8%) | 30 (52.6%) |
| 5 Years | 16 (59.3%) | 4 (44.4%) |
| 6 to 11 Years | 76 (96.2%) | 69 (64.5%) |
| 12 to 14 Years | 33 (75.0%) | 85 (96.6%) |
| 15 Years | 4 (100.0%) | 14 (100.0%) |
| 16 and 17 Years | 75 (96.2%) | 17 (85.0%) |
| 18 to 24 Years | 52 (59.8%) | 75 (85.2%) |
| 25 to 34 Years | 99 (69.7%) | 71 (54.2%) |
| 35 to 44 Years | 107 (94.7%) | 125 (96.9%) |
| 45 to 54 Years | 180 (93.8%) | 128 (79.0%) |
| 55 to 64 Years | 127 (90.7%) | 151 (83.0%) |
| 65 to 74 Years | 148 (96.7%) | 137 (95.8%) |
| 75 Years and over | 58 (96.7%) | 65 (69.9%) |
| Total | 1,020 (85.5%) | 971 (79.4%) |
Income Below Poverty Among Married-Couple Families in Harmon County
The poverty statistics for married-couple families in Harmon County show that 9.0% or 42 of the total 468 families live below the poverty line. Families with 3 or 4 children have the highest poverty rate of 36.1%, comprising of 13 families. On the other hand, families with no children have the lowest poverty rate of 4.7%, which includes 12 families.
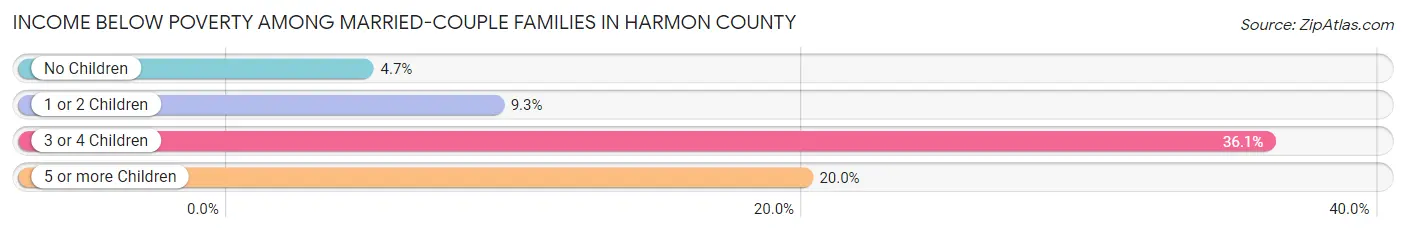
| Children | Above Poverty | Below Poverty |
| No Children | 242 (95.3%) | 12 (4.7%) |
| 1 or 2 Children | 157 (90.7%) | 16 (9.2%) |
| 3 or 4 Children | 23 (63.9%) | 13 (36.1%) |
| 5 or more Children | 4 (80.0%) | 1 (20.0%) |
| Total | 426 (91.0%) | 42 (9.0%) |
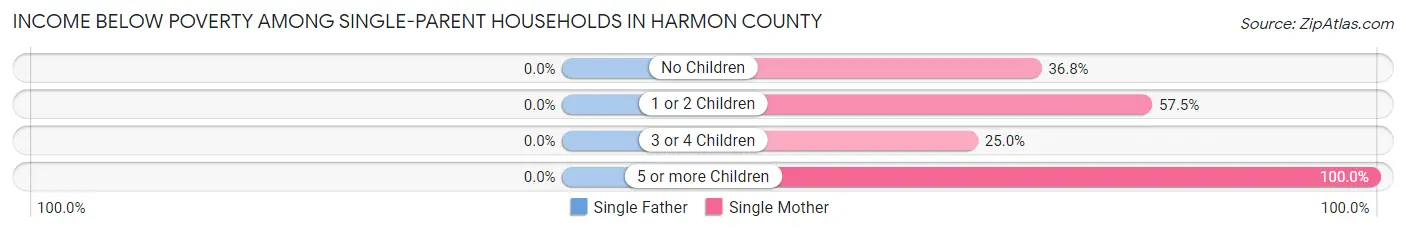
Income Below Poverty Among Single-Parent Households in Harmon County
| Children | Single Father | Single Mother |
| No Children | 0 (0.0%) | 14 (36.8%) |
| 1 or 2 Children | 0 (0.0%) | 27 (57.5%) |
| 3 or 4 Children | 0 (0.0%) | 5 (25.0%) |
| 5 or more Children | 0 (0.0%) | 6 (100.0%) |
| Total | 0 (0.0%) | 52 (46.9%) |
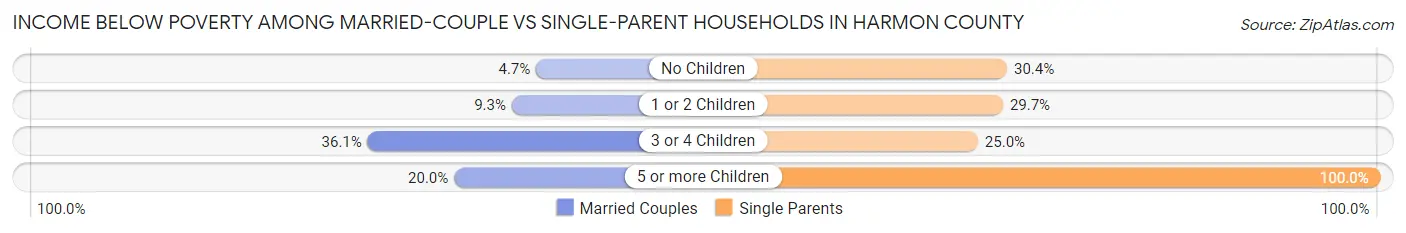
Income Below Poverty Among Married-Couple vs Single-Parent Households in Harmon County
The poverty data for Harmon County shows that 42 of the married-couple family households (9.0%) and 52 of the single-parent households (31.9%) are living below the poverty level. Within the married-couple family households, those with 3 or 4 children have the highest poverty rate, with 13 households (36.1%) falling below the poverty line. Among the single-parent households, those with 5 or more children have the highest poverty rate, with 6 household (100.0%) living below poverty.
| Children | Married-Couple Families | Single-Parent Households |
| No Children | 12 (4.7%) | 14 (30.4%) |
| 1 or 2 Children | 16 (9.2%) | 27 (29.7%) |
| 3 or 4 Children | 13 (36.1%) | 5 (25.0%) |
| 5 or more Children | 1 (20.0%) | 6 (100.0%) |
| Total | 42 (9.0%) | 52 (31.9%) |
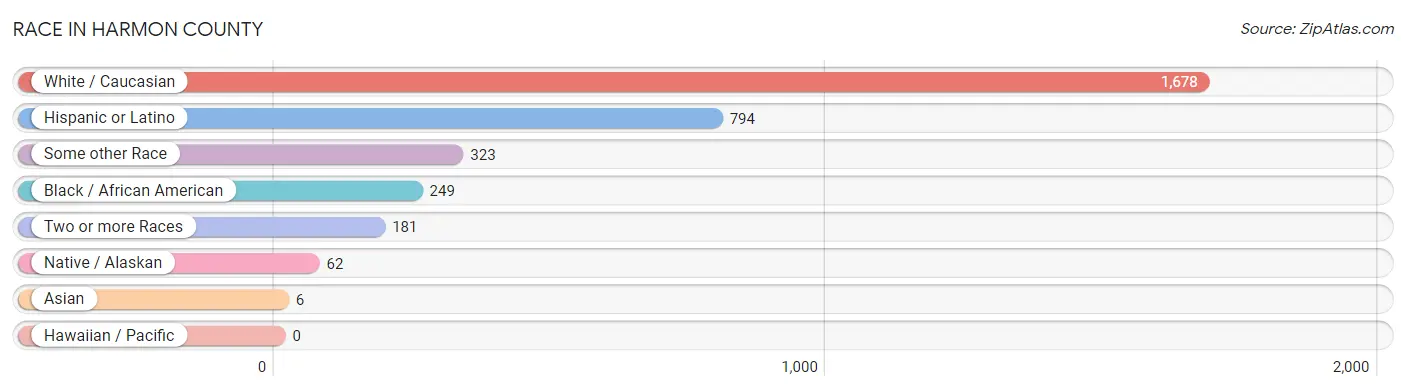
Race in Harmon County
The most populous races in Harmon County are White / Caucasian (1,678 | 67.1%), Hispanic or Latino (794 | 31.8%), and Some other Race (323 | 12.9%).
| Race | # Population | % Population |
| Asian | 6 | 0.2% |
| Black / African American | 249 | 10.0% |
| Hawaiian / Pacific | 0 | 0.0% |
| Hispanic or Latino | 794 | 31.8% |
| Native / Alaskan | 62 | 2.5% |
| White / Caucasian | 1,678 | 67.1% |
| Two or more Races | 181 | 7.2% |
| Some other Race | 323 | 12.9% |
| Total | 2,499 | 100.0% |
Ancestry in Harmon County
The most populous ancestries reported in Harmon County are Mexican (627 | 25.1%), American (191 | 7.6%), German (154 | 6.2%), English (130 | 5.2%), and Irish (119 | 4.8%), together accounting for 48.9% of all Harmon County residents.

| Ancestry | # Population | % Population |
| American | 191 | 7.6% |
| Apache | 6 | 0.2% |
| Belgian | 2 | 0.1% |
| British | 20 | 0.8% |
| Central American | 10 | 0.4% |
| Cherokee | 46 | 1.8% |
| Choctaw | 13 | 0.5% |
| Colombian | 28 | 1.1% |
| Creek | 21 | 0.8% |
| Dutch | 7 | 0.3% |
| Dutch West Indian | 2 | 0.1% |
| English | 130 | 5.2% |
| European | 17 | 0.7% |
| French | 6 | 0.2% |
| German | 154 | 6.2% |
| Honduran | 10 | 0.4% |
| Irish | 119 | 4.8% |
| Italian | 20 | 0.8% |
| Mexican | 627 | 25.1% |
| Northern European | 2 | 0.1% |
| Pennsylvania German | 9 | 0.4% |
| Puerto Rican | 1 | 0.0% |
| Russian | 12 | 0.5% |
| Scandinavian | 3 | 0.1% |
| Scotch-Irish | 30 | 1.2% |
| Scottish | 7 | 0.3% |
| Seminole | 44 | 1.8% |
| South American | 28 | 1.1% |
| Spanish | 19 | 0.8% |
| Sri Lankan | 6 | 0.2% |
| Swedish | 5 | 0.2% |
| Welsh | 7 | 0.3% | View All 32 Rows |
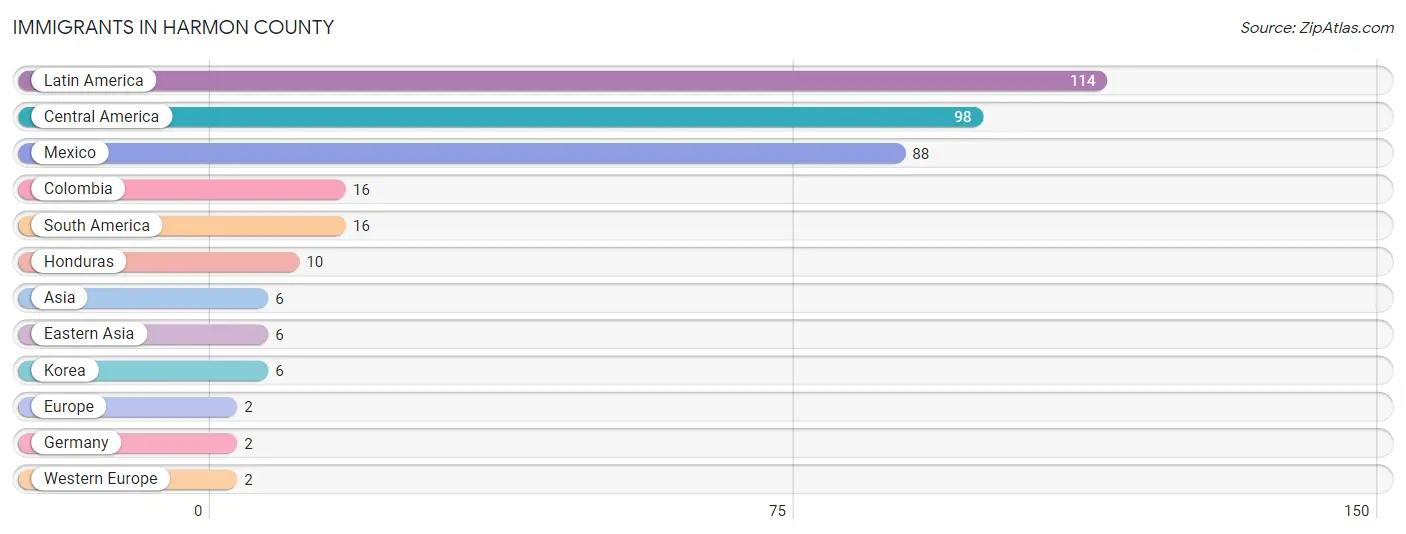
Immigrants in Harmon County
The most numerous immigrant groups reported in Harmon County came from Latin America (114 | 4.6%), Central America (98 | 3.9%), Mexico (88 | 3.5%), Colombia (16 | 0.6%), and South America (16 | 0.6%), together accounting for 13.3% of all Harmon County residents.
| Immigration Origin | # Population | % Population |
| Asia | 6 | 0.2% |
| Central America | 98 | 3.9% |
| Colombia | 16 | 0.6% |
| Eastern Asia | 6 | 0.2% |
| Europe | 2 | 0.1% |
| Germany | 2 | 0.1% |
| Honduras | 10 | 0.4% |
| Korea | 6 | 0.2% |
| Latin America | 114 | 4.6% |
| Mexico | 88 | 3.5% |
| South America | 16 | 0.6% |
| Western Europe | 2 | 0.1% | View All 12 Rows |
Sex and Age in Harmon County
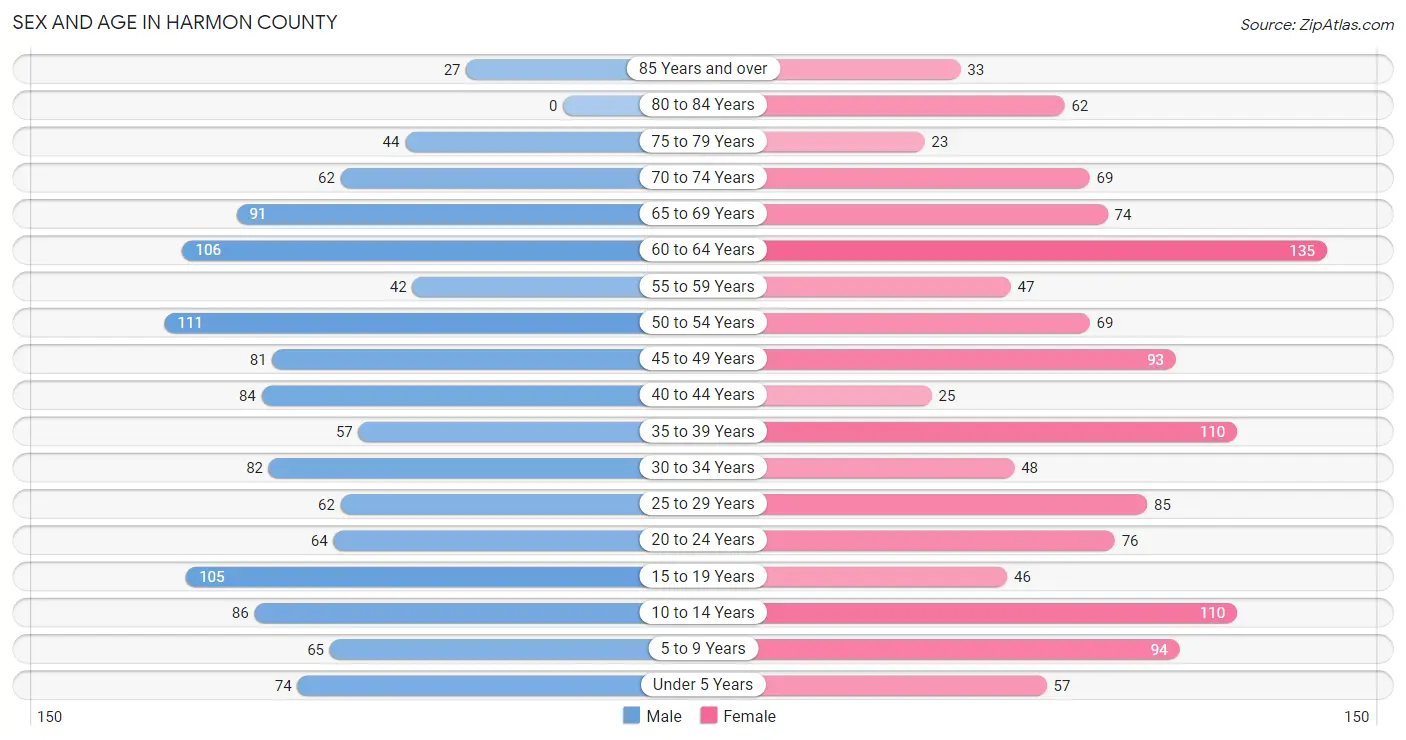
Sex and Age in Harmon County
The most populous age groups in Harmon County are 50 to 54 Years (111 | 8.9%) for men and 60 to 64 Years (135 | 10.7%) for women.
| Age Bracket | Male | Female |
| Under 5 Years | 74 (5.9%) | 57 (4.5%) |
| 5 to 9 Years | 65 (5.2%) | 94 (7.5%) |
| 10 to 14 Years | 86 (6.9%) | 110 (8.8%) |
| 15 to 19 Years | 105 (8.5%) | 46 (3.7%) |
| 20 to 24 Years | 64 (5.1%) | 76 (6.0%) |
| 25 to 29 Years | 62 (5.0%) | 85 (6.8%) |
| 30 to 34 Years | 82 (6.6%) | 48 (3.8%) |
| 35 to 39 Years | 57 (4.6%) | 110 (8.8%) |
| 40 to 44 Years | 84 (6.8%) | 25 (2.0%) |
| 45 to 49 Years | 81 (6.5%) | 93 (7.4%) |
| 50 to 54 Years | 111 (8.9%) | 69 (5.5%) |
| 55 to 59 Years | 42 (3.4%) | 47 (3.7%) |
| 60 to 64 Years | 106 (8.5%) | 135 (10.7%) |
| 65 to 69 Years | 91 (7.3%) | 74 (5.9%) |
| 70 to 74 Years | 62 (5.0%) | 69 (5.5%) |
| 75 to 79 Years | 44 (3.5%) | 23 (1.8%) |
| 80 to 84 Years | 0 (0.0%) | 62 (4.9%) |
| 85 Years and over | 27 (2.2%) | 33 (2.6%) |
| Total | 1,243 (100.0%) | 1,256 (100.0%) |
Families and Households in Harmon County
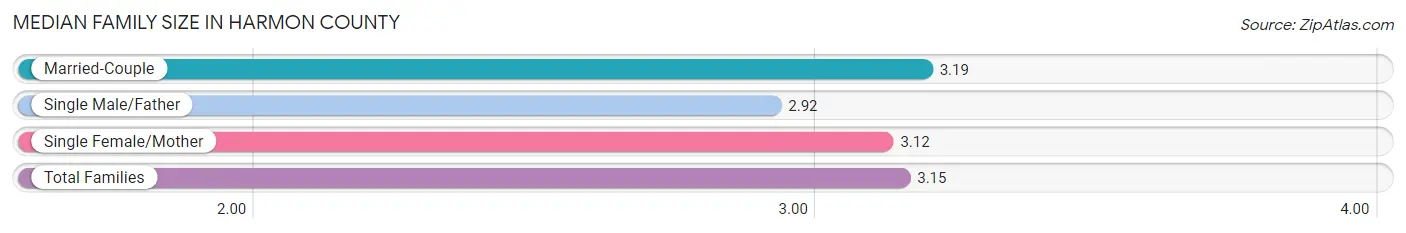
Median Family Size in Harmon County
The median family size in Harmon County is 3.15 persons per family, with married-couple families (468 | 74.2%) accounting for the largest median family size of 3.19 persons per family. On the other hand, single male/father families (52 | 8.2%) represent the smallest median family size with 2.92 persons per family.
| Family Type | # Families | Family Size |
| Married-Couple | 468 (74.2%) | 3.19 |
| Single Male/Father | 52 (8.2%) | 2.92 |
| Single Female/Mother | 111 (17.6%) | 3.12 |
| Total Families | 631 (100.0%) | 3.15 |
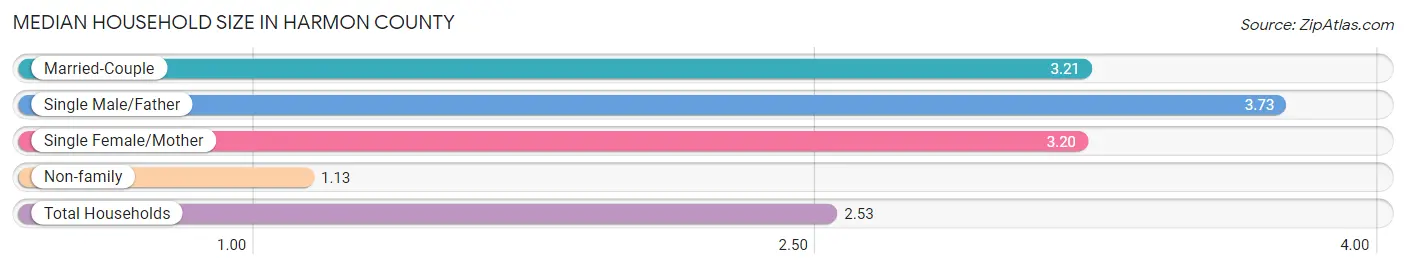
Median Household Size in Harmon County
The median household size in Harmon County is 2.53 persons per household, with single male/father households (52 | 5.4%) accounting for the largest median household size of 3.73 persons per household. non-family households (323 | 33.9%) represent the smallest median household size with 1.13 persons per household.
| Household Type | # Households | Household Size |
| Married-Couple | 468 (49.1%) | 3.21 |
| Single Male/Father | 52 (5.4%) | 3.73 |
| Single Female/Mother | 111 (11.6%) | 3.20 |
| Non-family | 323 (33.9%) | 1.13 |
| Total Households | 954 (100.0%) | 2.53 |
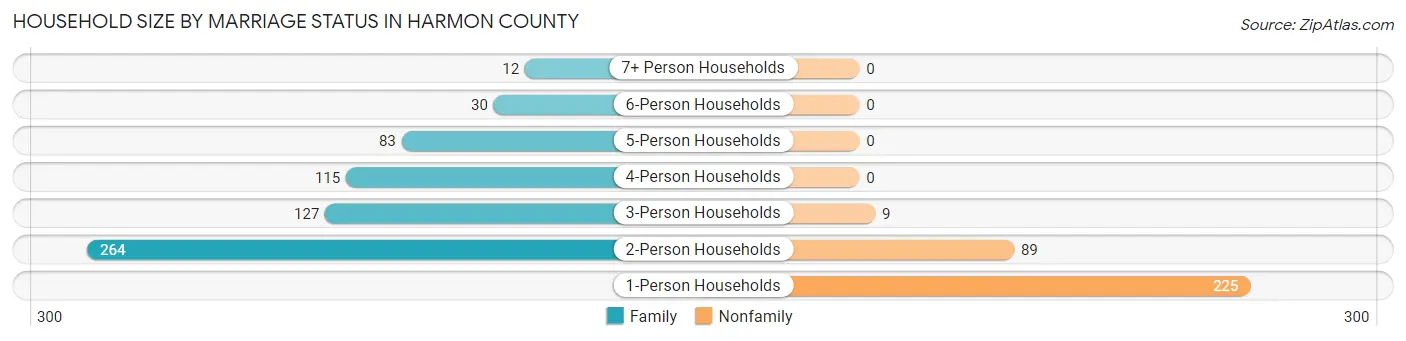
Household Size by Marriage Status in Harmon County
Out of a total of 954 households in Harmon County, 631 (66.1%) are family households, while 323 (33.9%) are nonfamily households. The most numerous type of family households are 2-person households, comprising 264, and the most common type of nonfamily households are 1-person households, comprising 225.
| Household Size | Family Households | Nonfamily Households |
| 1-Person Households | - | 225 (23.6%) |
| 2-Person Households | 264 (27.7%) | 89 (9.3%) |
| 3-Person Households | 127 (13.3%) | 9 (0.9%) |
| 4-Person Households | 115 (12.0%) | 0 (0.0%) |
| 5-Person Households | 83 (8.7%) | 0 (0.0%) |
| 6-Person Households | 30 (3.1%) | 0 (0.0%) |
| 7+ Person Households | 12 (1.3%) | 0 (0.0%) |
| Total | 631 (66.1%) | 323 (33.9%) |
Female Fertility in Harmon County
Fertility by Age in Harmon County
Average fertility rate in Harmon County is 119.0 births per 1,000 women. Women in the age bracket of 20 to 34 years have the highest fertility rate with 220.0 births per 1,000 women. Women in the age bracket of 20 to 34 years acount for 76.7% of all women with births.
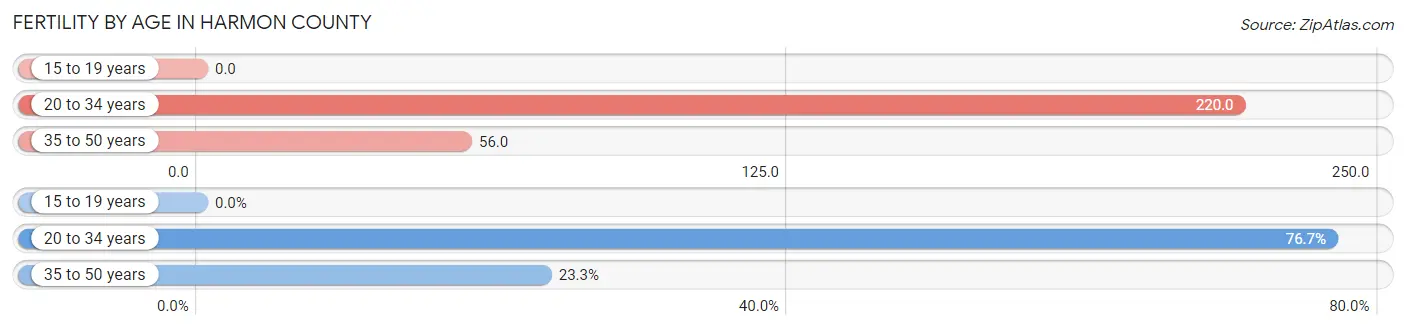
| Age Bracket | Women with Births | Births / 1,000 Women |
| 15 to 19 years | 0 (0.0%) | 0.0 |
| 20 to 34 years | 46 (76.7%) | 220.0 |
| 35 to 50 years | 14 (23.3%) | 56.0 |
| Total | 60 (100.0%) | 119.0 |
Fertility by Age by Marriage Status in Harmon County
75.0% of women with births (60) in Harmon County are married. The highest percentage of unmarried women with births falls into 35 to 50 years age bracket with 64.3% of them unmarried at the time of birth, while the lowest percentage of unmarried women with births belong to 20 to 34 years age bracket with 13.0% of them unmarried.
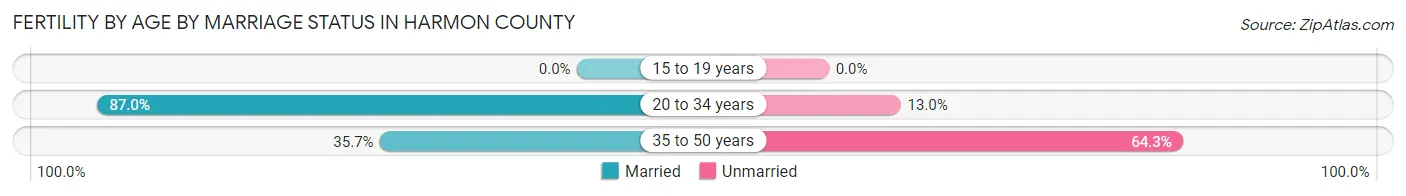
| Age Bracket | Married | Unmarried |
| 15 to 19 years | 0 (0.0%) | 0 (0.0%) |
| 20 to 34 years | 40 (87.0%) | 6 (13.0%) |
| 35 to 50 years | 5 (35.7%) | 9 (64.3%) |
| Total | 45 (75.0%) | 15 (25.0%) |
Fertility by Education in Harmon County
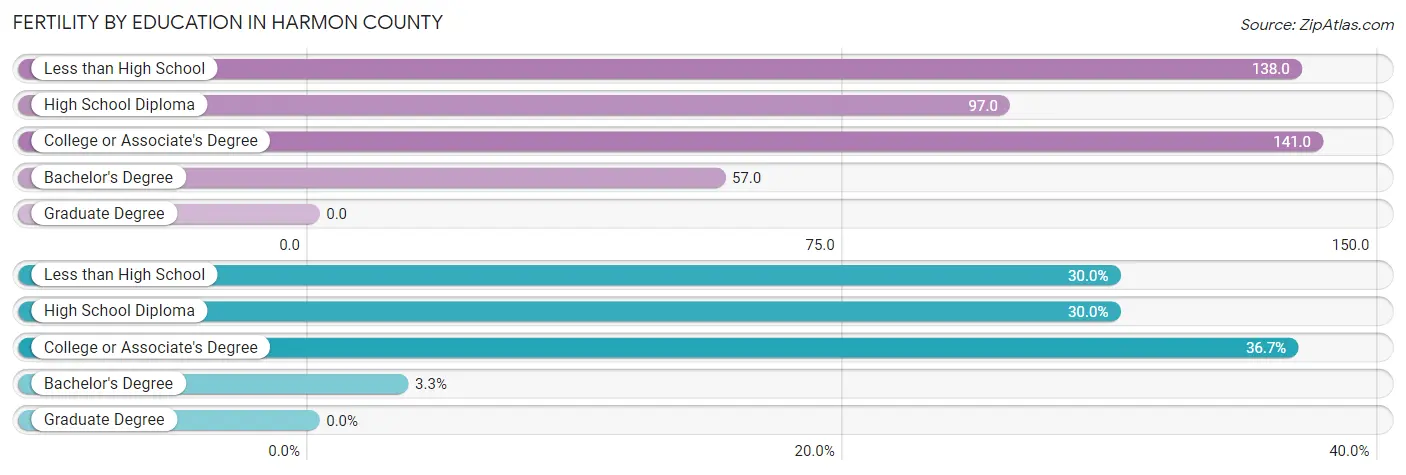
| Educational Attainment | Women with Births | Births / 1,000 Women |
| Less than High School | 18 (30.0%) | 138.0 |
| High School Diploma | 18 (30.0%) | 97.0 |
| College or Associate's Degree | 22 (36.7%) | 141.0 |
| Bachelor's Degree | 2 (3.3%) | 57.0 |
| Graduate Degree | 0 (0.0%) | 0.0 |
| Total | 60 (100.0%) | 119.0 |
Fertility by Education by Marriage Status in Harmon County
25.0% of women with births in Harmon County are unmarried. Women with the educational attainment of college or associate's degree are most likely to be married with 100.0% of them married at childbirth, while women with the educational attainment of less than high school are least likely to be married with 50.0% of them unmarried at childbirth.
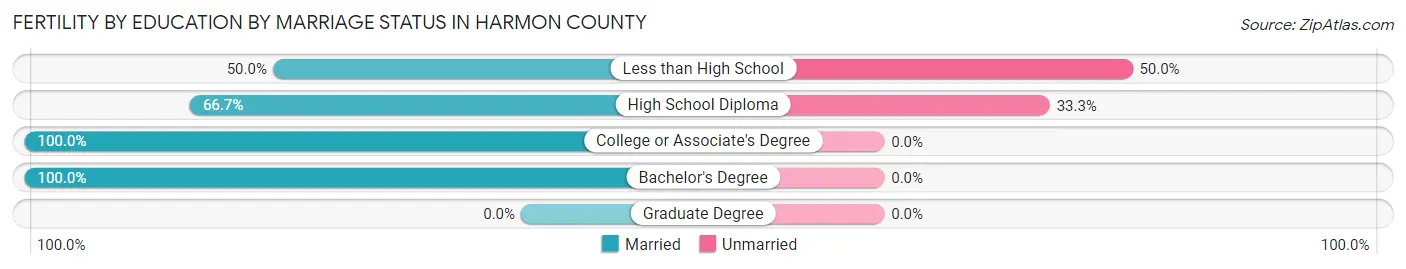
| Educational Attainment | Married | Unmarried |
| Less than High School | 9 (50.0%) | 9 (50.0%) |
| High School Diploma | 12 (66.7%) | 6 (33.3%) |
| College or Associate's Degree | 22 (100.0%) | 0 (0.0%) |
| Bachelor's Degree | 2 (100.0%) | 0 (0.0%) |
| Graduate Degree | 0 (0.0%) | 0 (0.0%) |
| Total | 45 (75.0%) | 15 (25.0%) |
Employment Characteristics in Harmon County
Employment by Class of Employer in Harmon County
Among the 1,069 employed individuals in Harmon County, private company employees (644 | 60.2%), self-employed (not incorporated) (163 | 15.2%), and local government employees (80 | 7.5%) make up the most common classes of employment.
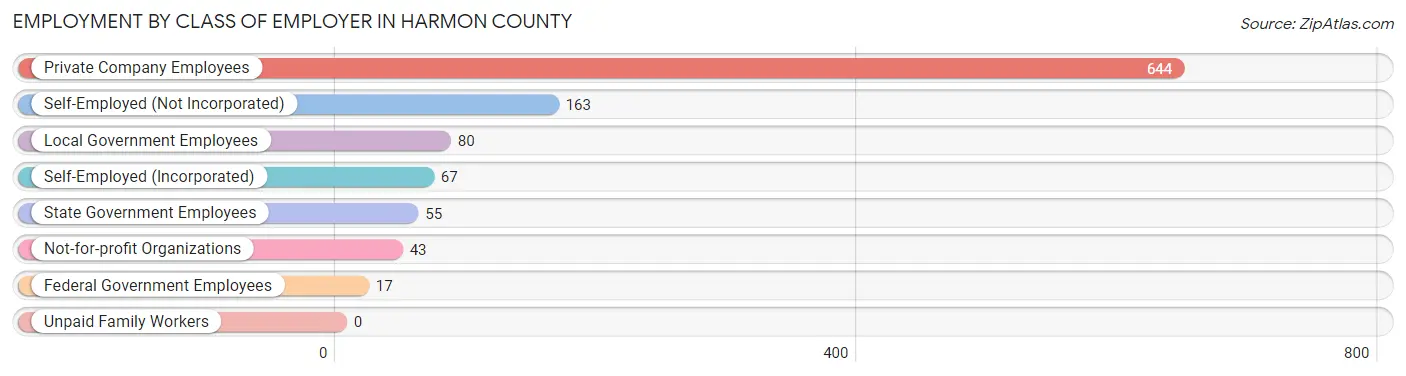
| Employer Class | # Employees | % Employees |
| Private Company Employees | 644 | 60.2% |
| Self-Employed (Incorporated) | 67 | 6.3% |
| Self-Employed (Not Incorporated) | 163 | 15.2% |
| Not-for-profit Organizations | 43 | 4.0% |
| Local Government Employees | 80 | 7.5% |
| State Government Employees | 55 | 5.1% |
| Federal Government Employees | 17 | 1.6% |
| Unpaid Family Workers | 0 | 0.0% |
| Total | 1,069 | 100.0% |
Employment Status by Age in Harmon County
According to the labor force statistics for Harmon County, out of the total population over 16 years of age (1,995), 59.3% or 1,183 individuals are in the labor force, with 7.4% or 88 of them unemployed. The age group with the highest labor force participation rate is 30 to 34 years, with 86.2% or 112 individuals in the labor force. Within the labor force, the 20 to 24 years age range has the highest percentage of unemployed individuals, with 41.0% or 48 of them being unemployed.
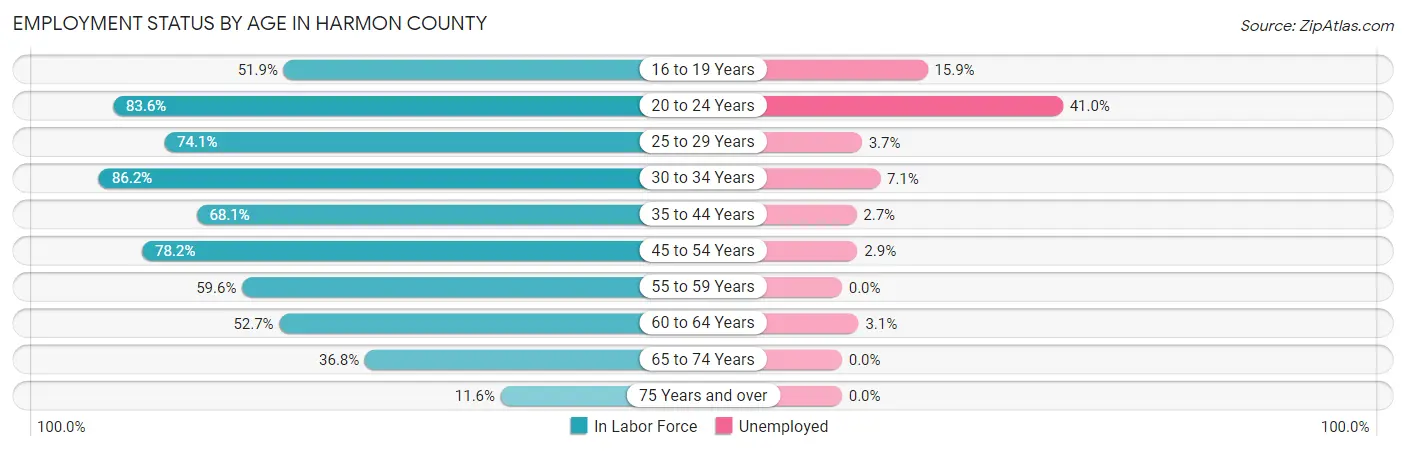
| Age Bracket | In Labor Force | Unemployed |
| 16 to 19 Years | 69 (51.9%) | 11 (15.9%) |
| 20 to 24 Years | 117 (83.6%) | 48 (41.0%) |
| 25 to 29 Years | 109 (74.1%) | 4 (3.7%) |
| 30 to 34 Years | 112 (86.2%) | 8 (7.1%) |
| 35 to 44 Years | 188 (68.1%) | 5 (2.7%) |
| 45 to 54 Years | 277 (78.2%) | 8 (2.9%) |
| 55 to 59 Years | 53 (59.6%) | 0 (0.0%) |
| 60 to 64 Years | 127 (52.7%) | 4 (3.1%) |
| 65 to 74 Years | 109 (36.8%) | 0 (0.0%) |
| 75 Years and over | 22 (11.6%) | 0 (0.0%) |
| Total | 1,183 (59.3%) | 88 (7.4%) |
Employment Status by Educational Attainment in Harmon County
According to labor force statistics for Harmon County, 70.0% of individuals (866) out of the total population between 25 and 64 years of age (1,237) are in the labor force, with 3.3% or 29 of them being unemployed. The group with the highest labor force participation rate are those with the educational attainment of bachelor's degree or higher, with 80.0% or 132 individuals in the labor force. Within the labor force, individuals with college / associate degree education have the highest percentage of unemployment, with 6.9% or 17 of them being unemployed.
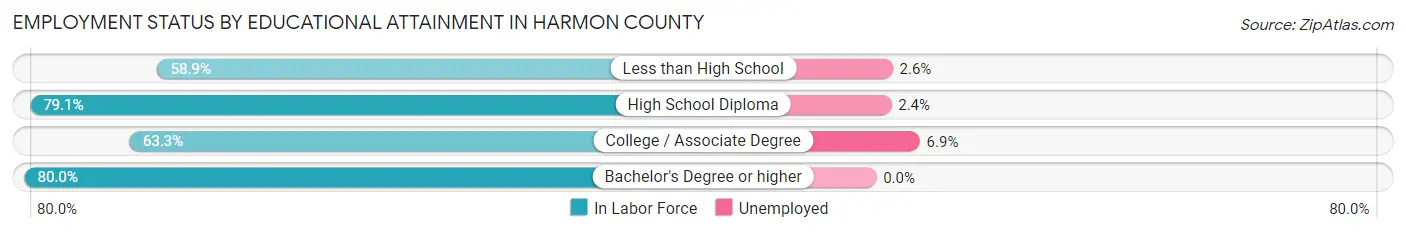
| Educational Attainment | In Labor Force | Unemployed |
| Less than High School | 152 (58.9%) | 7 (2.6%) |
| High School Diploma | 334 (79.1%) | 10 (2.4%) |
| College / Associate Degree | 248 (63.3%) | 27 (6.9%) |
| Bachelor's Degree or higher | 132 (80.0%) | 0 (0.0%) |
| Total | 866 (70.0%) | 41 (3.3%) |
Employment Occupations by Sex in Harmon County
Management, Business, Science and Arts Occupations
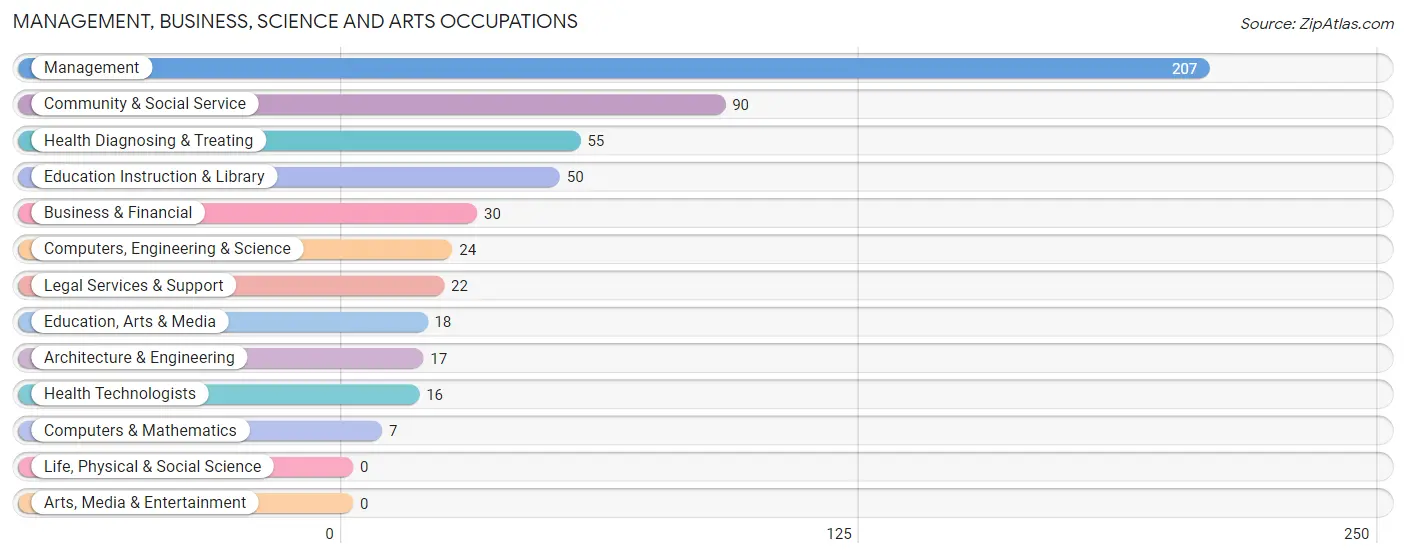
The most common Management, Business, Science and Arts occupations in Harmon County are Management (207 | 18.9%), Community & Social Service (90 | 8.2%), Health Diagnosing & Treating (55 | 5.0%), Education Instruction & Library (50 | 4.6%), and Business & Financial (30 | 2.7%).
Management, Business, Science and Arts Occupations by Sex
Within the Management, Business, Science and Arts occupations in Harmon County, the most male-oriented occupations are Architecture & Engineering (100.0%), Legal Services & Support (100.0%), and Management (85.5%), while the most female-oriented occupations are Business & Financial (93.3%), Health Diagnosing & Treating (92.7%), and Health Technologists (75.0%).
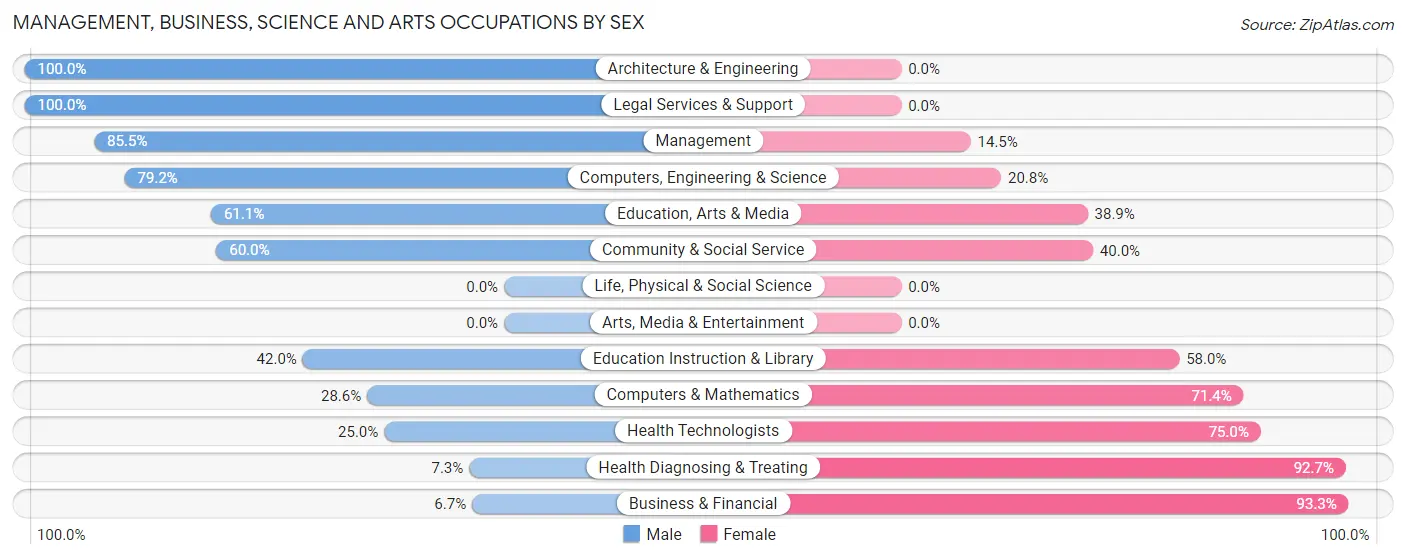
| Occupation | Male | Female |
| Management | 177 (85.5%) | 30 (14.5%) |
| Business & Financial | 2 (6.7%) | 28 (93.3%) |
| Computers, Engineering & Science | 19 (79.2%) | 5 (20.8%) |
| Computers & Mathematics | 2 (28.6%) | 5 (71.4%) |
| Architecture & Engineering | 17 (100.0%) | 0 (0.0%) |
| Life, Physical & Social Science | 0 (0.0%) | 0 (0.0%) |
| Community & Social Service | 54 (60.0%) | 36 (40.0%) |
| Education, Arts & Media | 11 (61.1%) | 7 (38.9%) |
| Legal Services & Support | 22 (100.0%) | 0 (0.0%) |
| Education Instruction & Library | 21 (42.0%) | 29 (58.0%) |
| Arts, Media & Entertainment | 0 (0.0%) | 0 (0.0%) |
| Health Diagnosing & Treating | 4 (7.3%) | 51 (92.7%) |
| Health Technologists | 4 (25.0%) | 12 (75.0%) |
| Total (Category) | 256 (63.0%) | 150 (36.9%) |
| Total (Overall) | 652 (59.5%) | 443 (40.5%) |
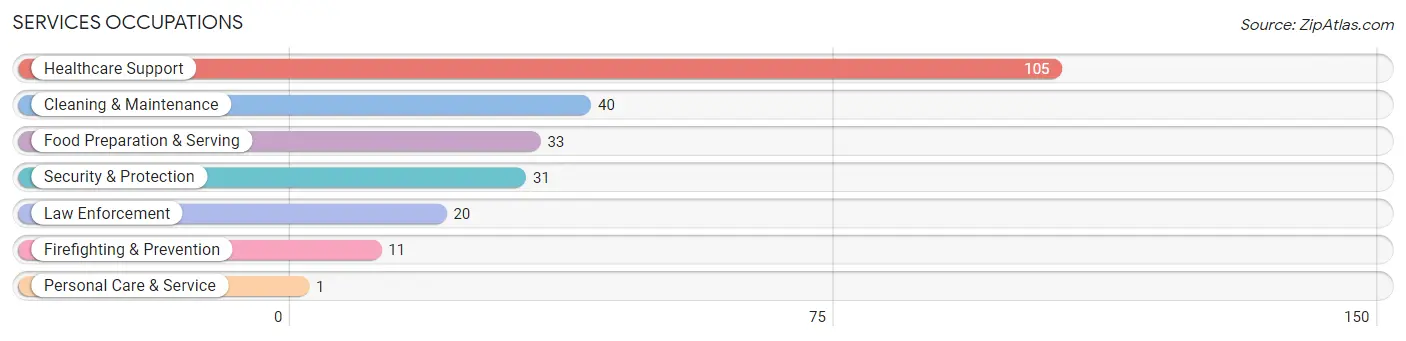
Services Occupations
The most common Services occupations in Harmon County are Healthcare Support (105 | 9.6%), Cleaning & Maintenance (40 | 3.6%), Food Preparation & Serving (33 | 3.0%), Security & Protection (31 | 2.8%), and Law Enforcement (20 | 1.8%).
Services Occupations by Sex
Within the Services occupations in Harmon County, the most male-oriented occupations are Firefighting & Prevention (54.5%), Security & Protection (48.4%), and Law Enforcement (45.0%), while the most female-oriented occupations are Personal Care & Service (100.0%), Healthcare Support (76.2%), and Food Preparation & Serving (72.7%).
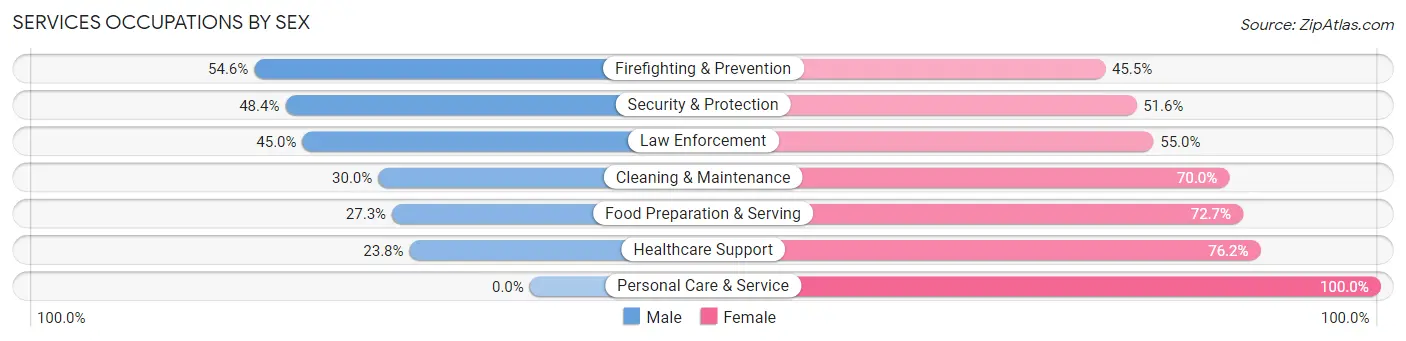
| Occupation | Male | Female |
| Healthcare Support | 25 (23.8%) | 80 (76.2%) |
| Security & Protection | 15 (48.4%) | 16 (51.6%) |
| Firefighting & Prevention | 6 (54.5%) | 5 (45.5%) |
| Law Enforcement | 9 (45.0%) | 11 (55.0%) |
| Food Preparation & Serving | 9 (27.3%) | 24 (72.7%) |
| Cleaning & Maintenance | 12 (30.0%) | 28 (70.0%) |
| Personal Care & Service | 0 (0.0%) | 1 (100.0%) |
| Total (Category) | 61 (29.0%) | 149 (71.0%) |
| Total (Overall) | 652 (59.5%) | 443 (40.5%) |
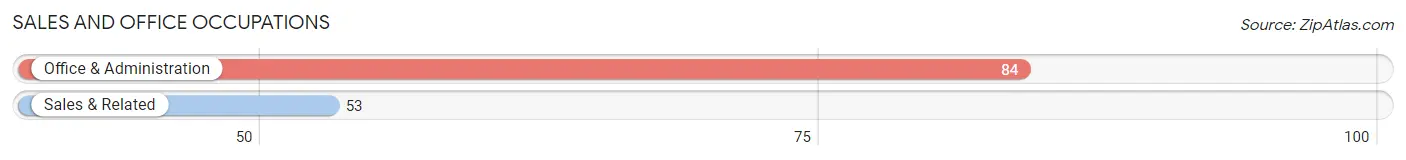
Sales and Office Occupations
The most common Sales and Office occupations in Harmon County are Office & Administration (84 | 7.7%), and Sales & Related (53 | 4.8%).
Sales and Office Occupations by Sex
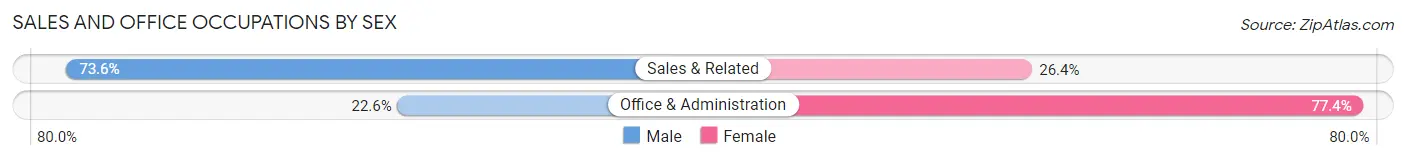
| Occupation | Male | Female |
| Sales & Related | 39 (73.6%) | 14 (26.4%) |
| Office & Administration | 19 (22.6%) | 65 (77.4%) |
| Total (Category) | 58 (42.3%) | 79 (57.7%) |
| Total (Overall) | 652 (59.5%) | 443 (40.5%) |
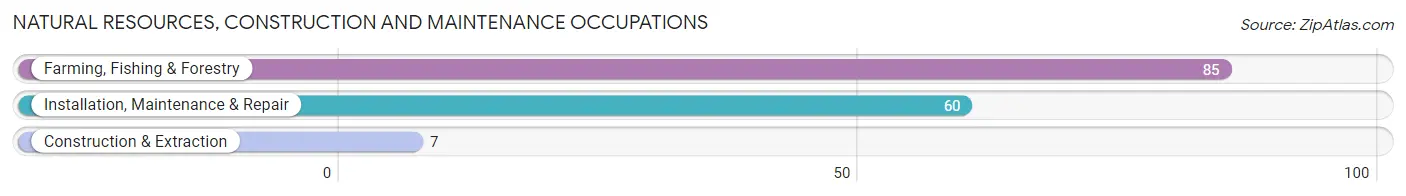
Natural Resources, Construction and Maintenance Occupations
The most common Natural Resources, Construction and Maintenance occupations in Harmon County are Farming, Fishing & Forestry (85 | 7.8%), Installation, Maintenance & Repair (60 | 5.5%), and Construction & Extraction (7 | 0.6%).
Natural Resources, Construction and Maintenance Occupations by Sex
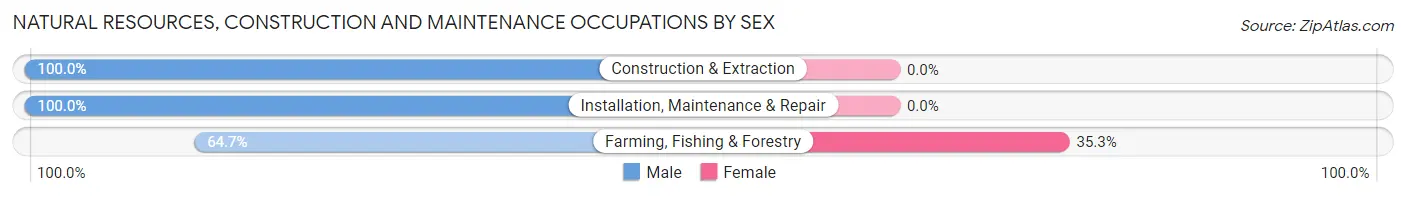
| Occupation | Male | Female |
| Farming, Fishing & Forestry | 55 (64.7%) | 30 (35.3%) |
| Construction & Extraction | 7 (100.0%) | 0 (0.0%) |
| Installation, Maintenance & Repair | 60 (100.0%) | 0 (0.0%) |
| Total (Category) | 122 (80.3%) | 30 (19.7%) |
| Total (Overall) | 652 (59.5%) | 443 (40.5%) |
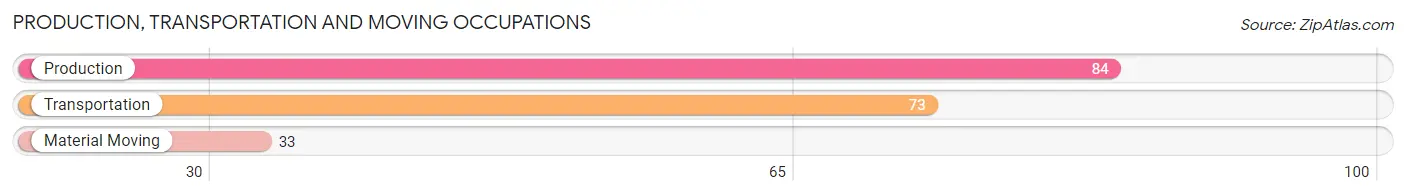
Production, Transportation and Moving Occupations
The most common Production, Transportation and Moving occupations in Harmon County are Production (84 | 7.7%), Transportation (73 | 6.7%), and Material Moving (33 | 3.0%).
Production, Transportation and Moving Occupations by Sex
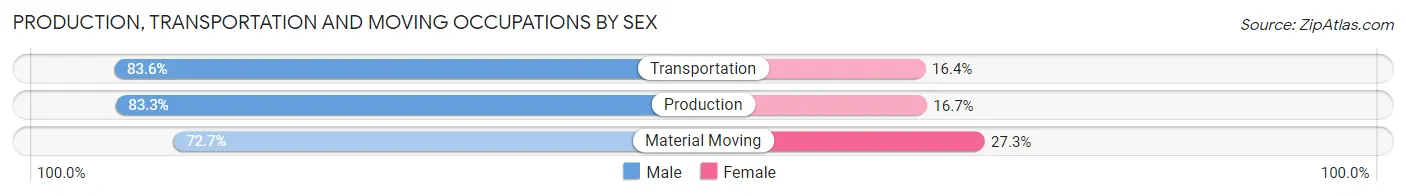
| Occupation | Male | Female |
| Production | 70 (83.3%) | 14 (16.7%) |
| Transportation | 61 (83.6%) | 12 (16.4%) |
| Material Moving | 24 (72.7%) | 9 (27.3%) |
| Total (Category) | 155 (81.6%) | 35 (18.4%) |
| Total (Overall) | 652 (59.5%) | 443 (40.5%) |
Employment Industries by Sex in Harmon County
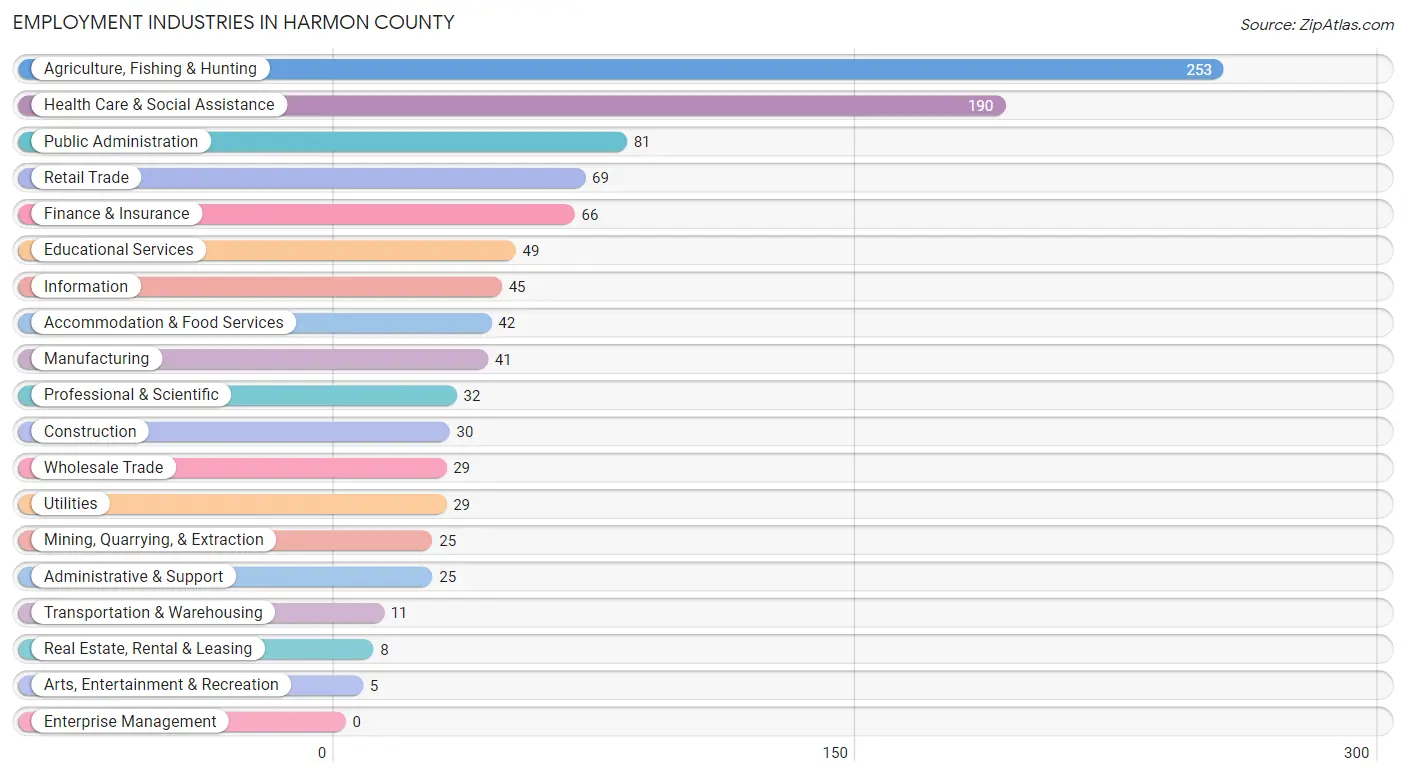
Employment Industries in Harmon County
The major employment industries in Harmon County include Agriculture, Fishing & Hunting (253 | 23.1%), Health Care & Social Assistance (190 | 17.3%), Public Administration (81 | 7.4%), Retail Trade (69 | 6.3%), and Finance & Insurance (66 | 6.0%).
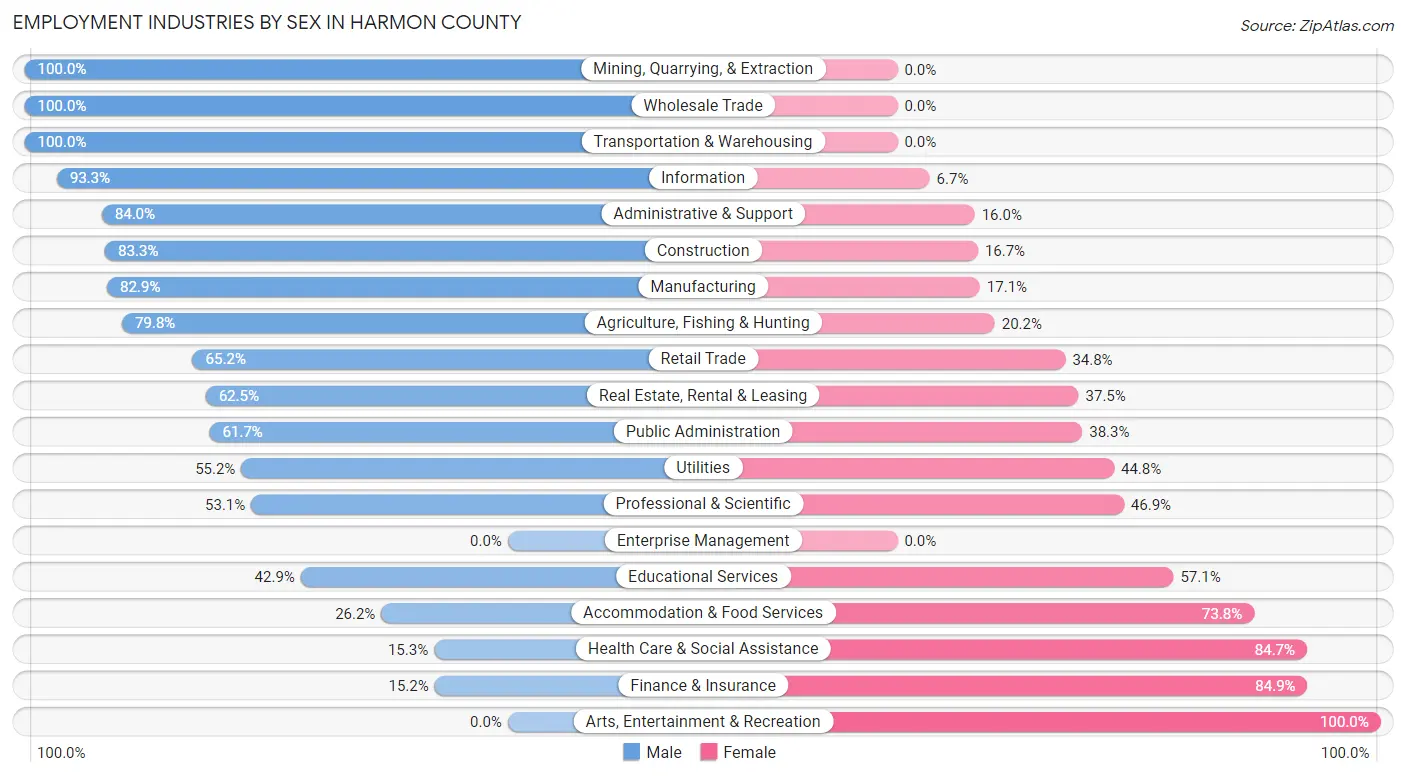
Employment Industries by Sex in Harmon County
The Harmon County industries that see more men than women are Mining, Quarrying, & Extraction (100.0%), Wholesale Trade (100.0%), and Transportation & Warehousing (100.0%), whereas the industries that tend to have a higher number of women are Arts, Entertainment & Recreation (100.0%), Finance & Insurance (84.9%), and Health Care & Social Assistance (84.7%).
| Industry | Male | Female |
| Agriculture, Fishing & Hunting | 202 (79.8%) | 51 (20.2%) |
| Mining, Quarrying, & Extraction | 25 (100.0%) | 0 (0.0%) |
| Construction | 25 (83.3%) | 5 (16.7%) |
| Manufacturing | 34 (82.9%) | 7 (17.1%) |
| Wholesale Trade | 29 (100.0%) | 0 (0.0%) |
| Retail Trade | 45 (65.2%) | 24 (34.8%) |
| Transportation & Warehousing | 11 (100.0%) | 0 (0.0%) |
| Utilities | 16 (55.2%) | 13 (44.8%) |
| Information | 42 (93.3%) | 3 (6.7%) |
| Finance & Insurance | 10 (15.1%) | 56 (84.9%) |
| Real Estate, Rental & Leasing | 5 (62.5%) | 3 (37.5%) |
| Professional & Scientific | 17 (53.1%) | 15 (46.9%) |
| Enterprise Management | 0 (0.0%) | 0 (0.0%) |
| Administrative & Support | 21 (84.0%) | 4 (16.0%) |
| Educational Services | 21 (42.9%) | 28 (57.1%) |
| Health Care & Social Assistance | 29 (15.3%) | 161 (84.7%) |
| Arts, Entertainment & Recreation | 0 (0.0%) | 5 (100.0%) |
| Accommodation & Food Services | 11 (26.2%) | 31 (73.8%) |
| Public Administration | 50 (61.7%) | 31 (38.3%) |
| Total | 652 (59.5%) | 443 (40.5%) |
Education in Harmon County
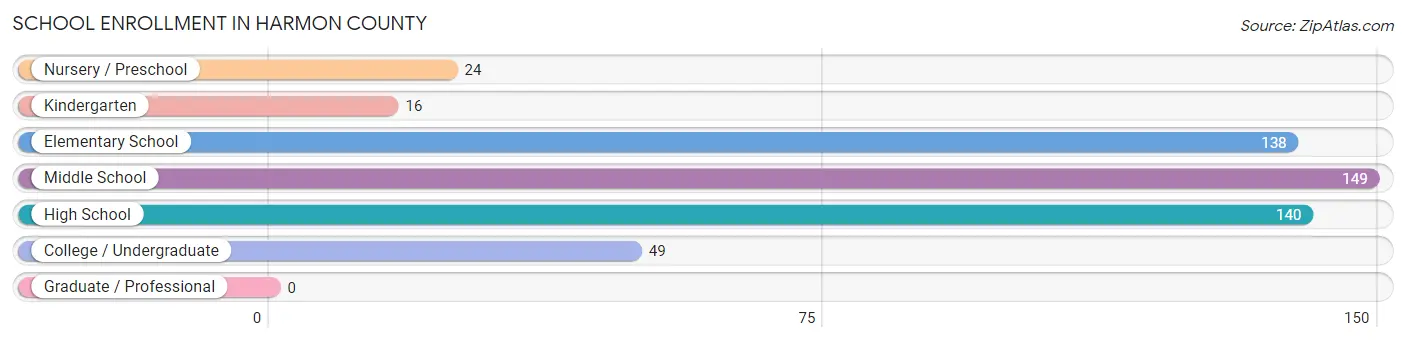
School Enrollment in Harmon County
The most common levels of schooling among the 516 students in Harmon County are middle school (149 | 28.9%), high school (140 | 27.1%), and elementary school (138 | 26.7%).
| School Level | # Students | % Students |
| Nursery / Preschool | 24 | 4.6% |
| Kindergarten | 16 | 3.1% |
| Elementary School | 138 | 26.7% |
| Middle School | 149 | 28.9% |
| High School | 140 | 27.1% |
| College / Undergraduate | 49 | 9.5% |
| Graduate / Professional | 0 | 0.0% |
| Total | 516 | 100.0% |
School Enrollment by Age by Funding Source in Harmon County
Out of a total of 516 students who are enrolled in schools in Harmon County, 28 (5.4%) attend a private institution, while the remaining 488 (94.6%) are enrolled in public schools. The age group of 15 to 17 year olds has the highest likelihood of being enrolled in private schools, with 14 (14.6% in the age bracket) enrolled. Conversely, the age group of 3 to 4 year olds has the lowest likelihood of being enrolled in a private school, with 8 (100.0% in the age bracket) attending a public institution.
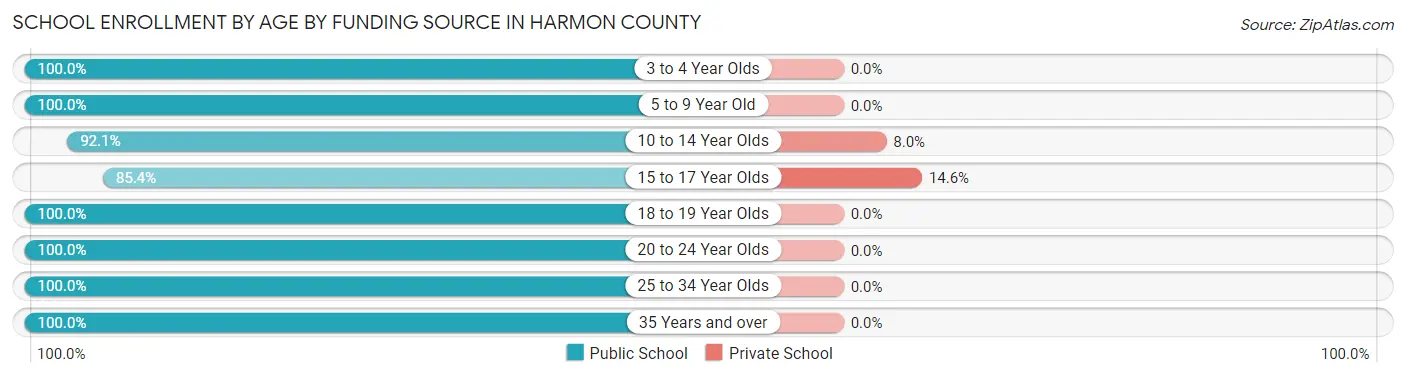
| Age Bracket | Public School | Private School |
| 3 to 4 Year Olds | 8 (100.0%) | 0 (0.0%) |
| 5 to 9 Year Old | 150 (100.0%) | 0 (0.0%) |
| 10 to 14 Year Olds | 162 (92.0%) | 14 (8.0%) |
| 15 to 17 Year Olds | 82 (85.4%) | 14 (14.6%) |
| 18 to 19 Year Olds | 16 (100.0%) | 0 (0.0%) |
| 20 to 24 Year Olds | 27 (100.0%) | 0 (0.0%) |
| 25 to 34 Year Olds | 39 (100.0%) | 0 (0.0%) |
| 35 Years and over | 4 (100.0%) | 0 (0.0%) |
| Total | 488 (94.6%) | 28 (5.4%) |
Educational Attainment by Field of Study in Harmon County
Education (125 | 47.0%), bio, nature & agricultural (36 | 13.5%), physical & health sciences (30 | 11.3%), business (27 | 10.2%), and communications (19 | 7.1%) are the most common fields of study among 266 individuals in Harmon County who have obtained a bachelor's degree or higher.
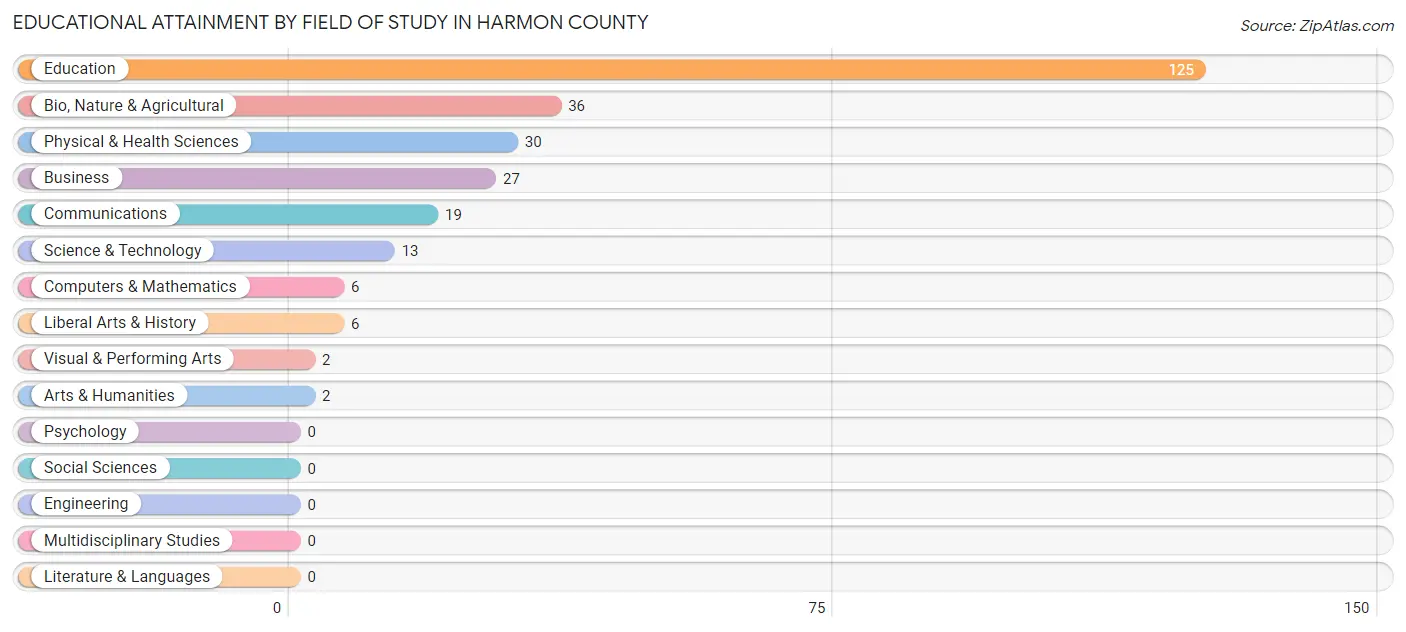
| Field of Study | # Graduates | % Graduates |
| Computers & Mathematics | 6 | 2.3% |
| Bio, Nature & Agricultural | 36 | 13.5% |
| Physical & Health Sciences | 30 | 11.3% |
| Psychology | 0 | 0.0% |
| Social Sciences | 0 | 0.0% |
| Engineering | 0 | 0.0% |
| Multidisciplinary Studies | 0 | 0.0% |
| Science & Technology | 13 | 4.9% |
| Business | 27 | 10.2% |
| Education | 125 | 47.0% |
| Literature & Languages | 0 | 0.0% |
| Liberal Arts & History | 6 | 2.3% |
| Visual & Performing Arts | 2 | 0.7% |
| Communications | 19 | 7.1% |
| Arts & Humanities | 2 | 0.7% |
| Total | 266 | 100.0% |
Transportation & Commute in Harmon County
Vehicle Availability by Sex in Harmon County
The most prevalent vehicle ownership categories in Harmon County are males with 2 vehicles (269, accounting for 42.2%) and females with 2 vehicles (189, making up 62.4%).
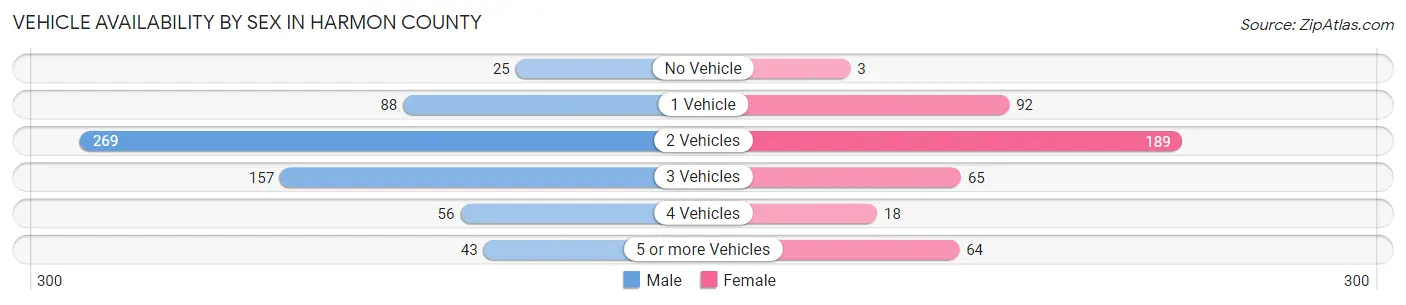
| Vehicles Available | Male | Female |
| No Vehicle | 25 (3.9%) | 3 (0.7%) |
| 1 Vehicle | 88 (13.8%) | 92 (21.3%) |
| 2 Vehicles | 269 (42.2%) | 189 (43.9%) |
| 3 Vehicles | 157 (24.6%) | 65 (15.1%) |
| 4 Vehicles | 56 (8.8%) | 18 (4.2%) |
| 5 or more Vehicles | 43 (6.7%) | 64 (14.8%) |
| Total | 638 (100.0%) | 431 (100.0%) |
Commute Time in Harmon County
The most frequently occuring commute durations in Harmon County are 5 to 9 minutes (311 commuters, 31.9%), 20 to 24 minutes (125 commuters, 12.8%), and less than 5 minutes (113 commuters, 11.6%).
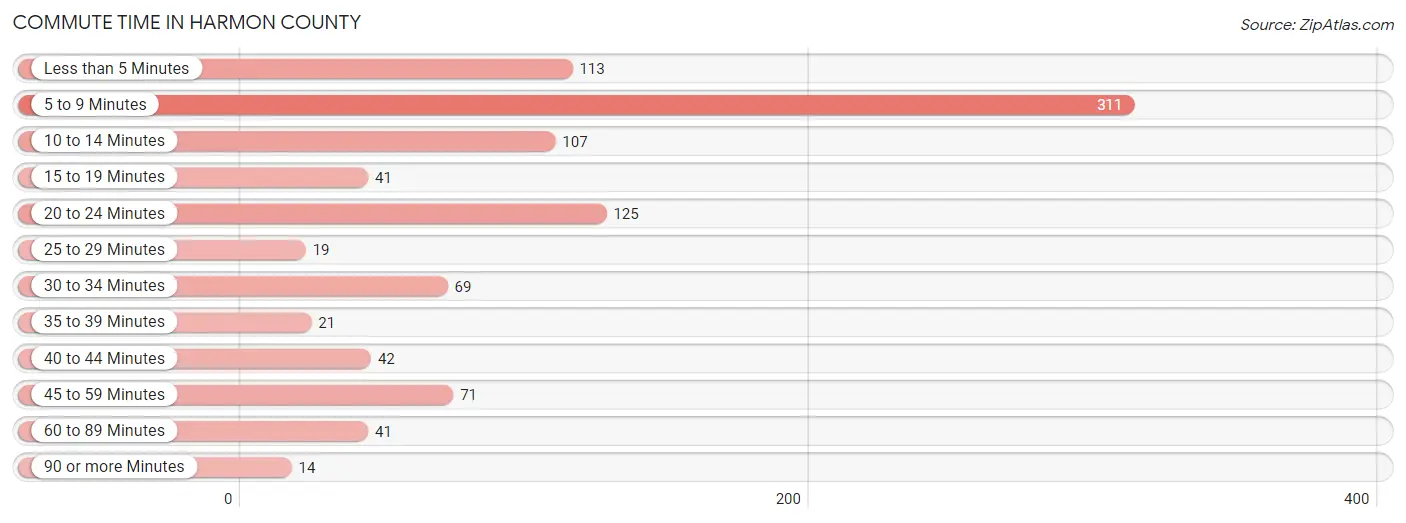
| Commute Time | # Commuters | % Commuters |
| Less than 5 Minutes | 113 | 11.6% |
| 5 to 9 Minutes | 311 | 31.9% |
| 10 to 14 Minutes | 107 | 11.0% |
| 15 to 19 Minutes | 41 | 4.2% |
| 20 to 24 Minutes | 125 | 12.8% |
| 25 to 29 Minutes | 19 | 1.9% |
| 30 to 34 Minutes | 69 | 7.1% |
| 35 to 39 Minutes | 21 | 2.2% |
| 40 to 44 Minutes | 42 | 4.3% |
| 45 to 59 Minutes | 71 | 7.3% |
| 60 to 89 Minutes | 41 | 4.2% |
| 90 or more Minutes | 14 | 1.4% |
Commute Time by Sex in Harmon County
The most common commute times in Harmon County are 5 to 9 minutes (204 commuters, 35.5%) for males and 5 to 9 minutes (107 commuters, 26.8%) for females.
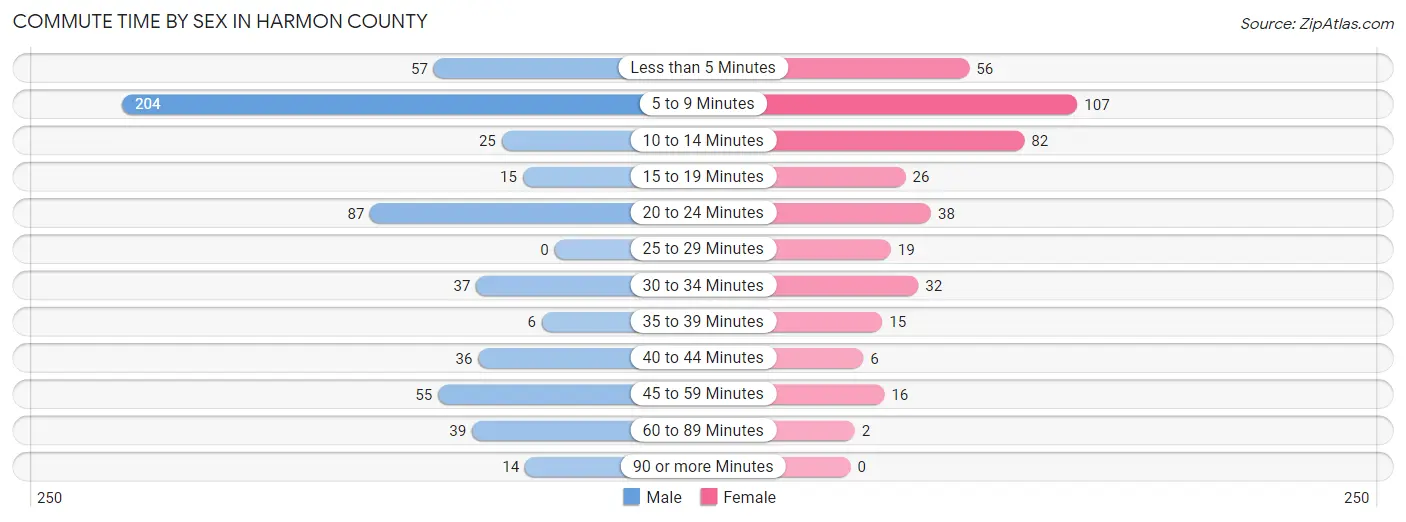
| Commute Time | Male | Female |
| Less than 5 Minutes | 57 (9.9%) | 56 (14.0%) |
| 5 to 9 Minutes | 204 (35.5%) | 107 (26.8%) |
| 10 to 14 Minutes | 25 (4.3%) | 82 (20.5%) |
| 15 to 19 Minutes | 15 (2.6%) | 26 (6.5%) |
| 20 to 24 Minutes | 87 (15.1%) | 38 (9.5%) |
| 25 to 29 Minutes | 0 (0.0%) | 19 (4.8%) |
| 30 to 34 Minutes | 37 (6.4%) | 32 (8.0%) |
| 35 to 39 Minutes | 6 (1.0%) | 15 (3.8%) |
| 40 to 44 Minutes | 36 (6.3%) | 6 (1.5%) |
| 45 to 59 Minutes | 55 (9.6%) | 16 (4.0%) |
| 60 to 89 Minutes | 39 (6.8%) | 2 (0.5%) |
| 90 or more Minutes | 14 (2.4%) | 0 (0.0%) |
Time of Departure to Work by Sex in Harmon County
The most frequent times of departure to work in Harmon County are 7:30 AM to 7:59 AM (194, 33.7%) for males and 7:30 AM to 7:59 AM (95, 23.8%) for females.
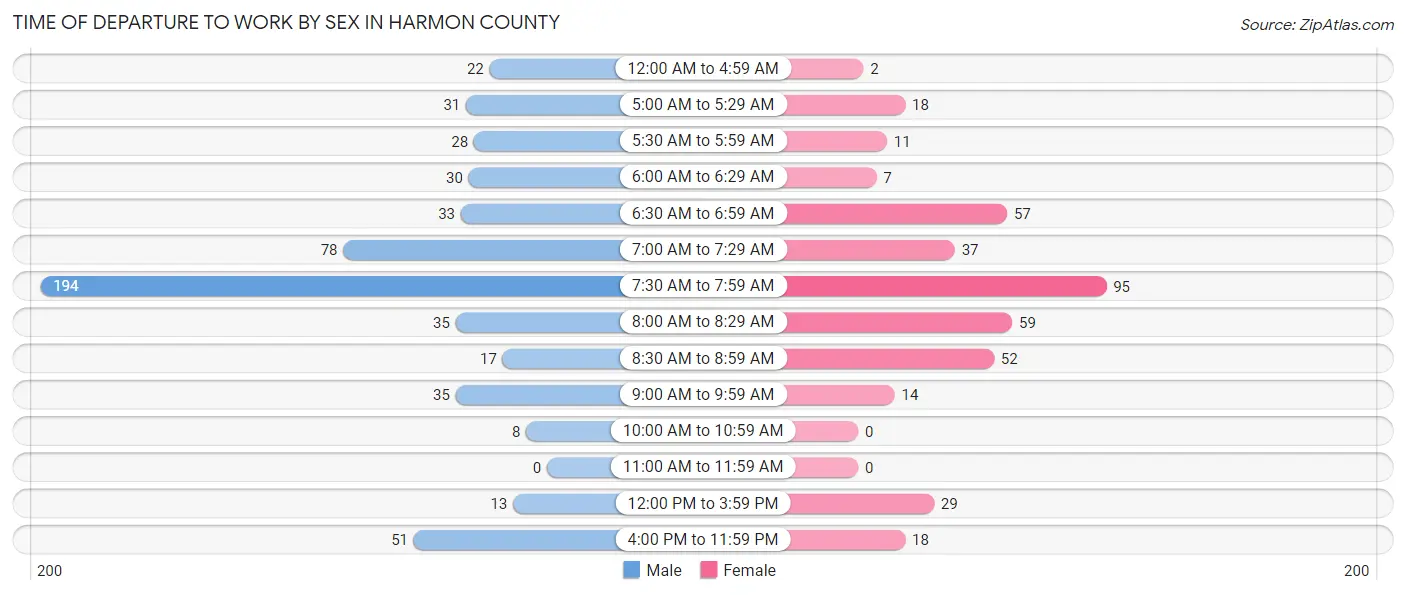
| Time of Departure | Male | Female |
| 12:00 AM to 4:59 AM | 22 (3.8%) | 2 (0.5%) |
| 5:00 AM to 5:29 AM | 31 (5.4%) | 18 (4.5%) |
| 5:30 AM to 5:59 AM | 28 (4.9%) | 11 (2.8%) |
| 6:00 AM to 6:29 AM | 30 (5.2%) | 7 (1.8%) |
| 6:30 AM to 6:59 AM | 33 (5.7%) | 57 (14.3%) |
| 7:00 AM to 7:29 AM | 78 (13.6%) | 37 (9.3%) |
| 7:30 AM to 7:59 AM | 194 (33.7%) | 95 (23.8%) |
| 8:00 AM to 8:29 AM | 35 (6.1%) | 59 (14.8%) |
| 8:30 AM to 8:59 AM | 17 (3.0%) | 52 (13.0%) |
| 9:00 AM to 9:59 AM | 35 (6.1%) | 14 (3.5%) |
| 10:00 AM to 10:59 AM | 8 (1.4%) | 0 (0.0%) |
| 11:00 AM to 11:59 AM | 0 (0.0%) | 0 (0.0%) |
| 12:00 PM to 3:59 PM | 13 (2.3%) | 29 (7.3%) |
| 4:00 PM to 11:59 PM | 51 (8.9%) | 18 (4.5%) |
| Total | 575 (100.0%) | 399 (100.0%) |
Housing Occupancy in Harmon County
Occupancy by Ownership in Harmon County
Of the total 954 dwellings in Harmon County, owner-occupied units account for 717 (75.2%), while renter-occupied units make up 237 (24.8%).
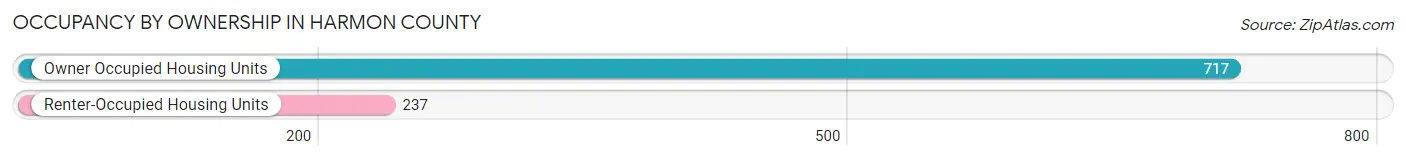
| Occupancy | # Housing Units | % Housing Units |
| Owner Occupied Housing Units | 717 | 75.2% |
| Renter-Occupied Housing Units | 237 | 24.8% |
| Total Occupied Housing Units | 954 | 100.0% |
Occupancy by Household Size in Harmon County
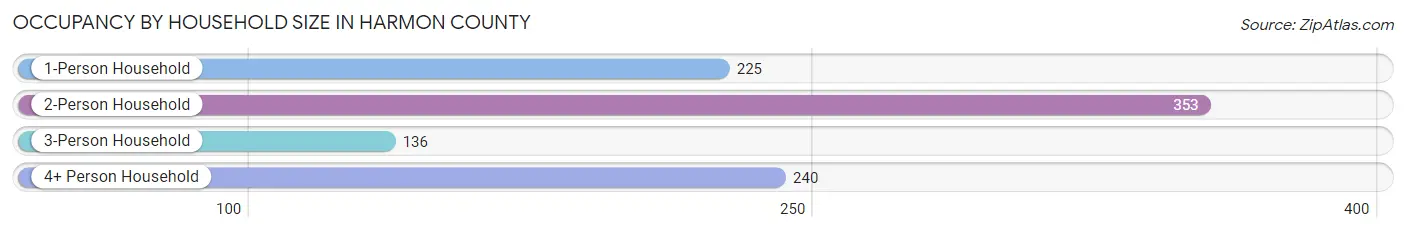
| Household Size | # Housing Units | % Housing Units |
| 1-Person Household | 225 | 23.6% |
| 2-Person Household | 353 | 37.0% |
| 3-Person Household | 136 | 14.3% |
| 4+ Person Household | 240 | 25.2% |
| Total Housing Units | 954 | 100.0% |
Occupancy by Ownership by Household Size in Harmon County
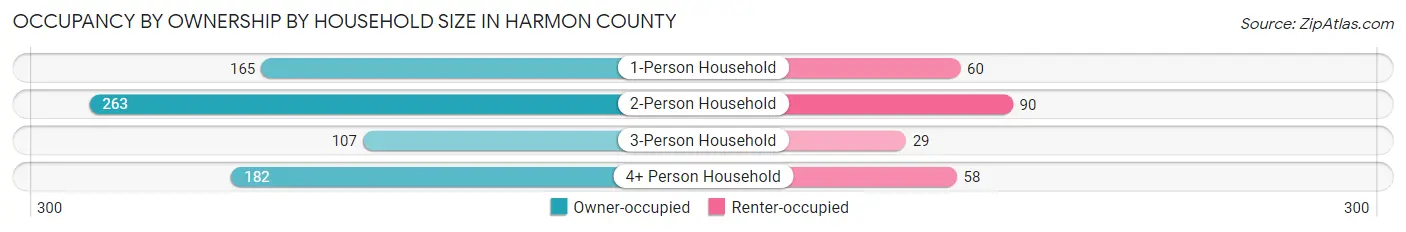
| Household Size | Owner-occupied | Renter-occupied |
| 1-Person Household | 165 (73.3%) | 60 (26.7%) |
| 2-Person Household | 263 (74.5%) | 90 (25.5%) |
| 3-Person Household | 107 (78.7%) | 29 (21.3%) |
| 4+ Person Household | 182 (75.8%) | 58 (24.2%) |
| Total Housing Units | 717 (75.2%) | 237 (24.8%) |
Occupancy by Educational Attainment in Harmon County
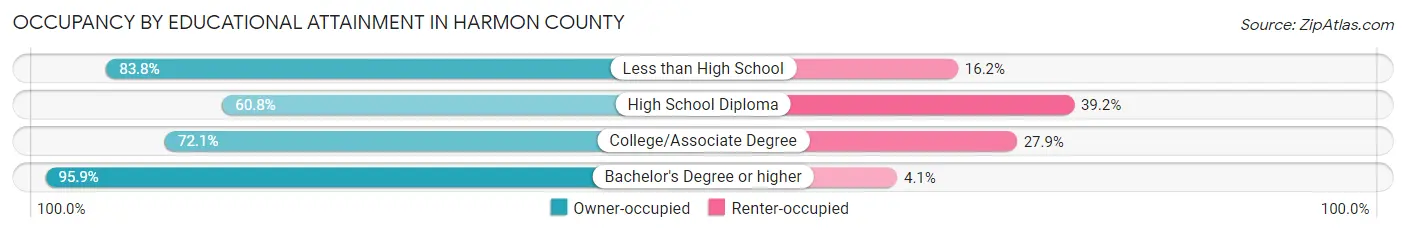
| Household Size | Owner-occupied | Renter-occupied |
| Less than High School | 150 (83.8%) | 29 (16.2%) |
| High School Diploma | 172 (60.8%) | 111 (39.2%) |
| College/Associate Degree | 233 (72.1%) | 90 (27.9%) |
| Bachelor's Degree or higher | 162 (95.9%) | 7 (4.1%) |
Occupancy by Age of Householder in Harmon County
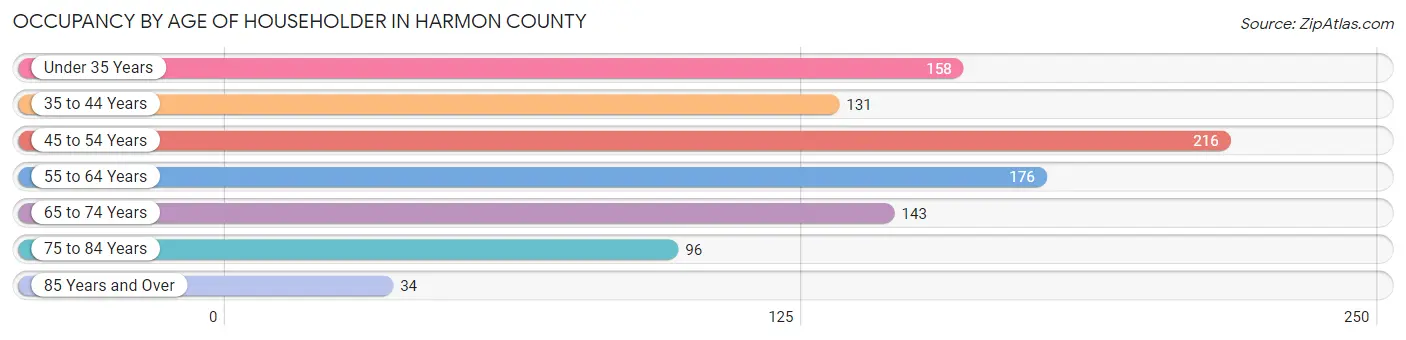
| Age Bracket | # Households | % Households |
| Under 35 Years | 158 | 16.6% |
| 35 to 44 Years | 131 | 13.7% |
| 45 to 54 Years | 216 | 22.6% |
| 55 to 64 Years | 176 | 18.4% |
| 65 to 74 Years | 143 | 15.0% |
| 75 to 84 Years | 96 | 10.1% |
| 85 Years and Over | 34 | 3.6% |
| Total | 954 | 100.0% |
Housing Finances in Harmon County
Median Income by Occupancy in Harmon County
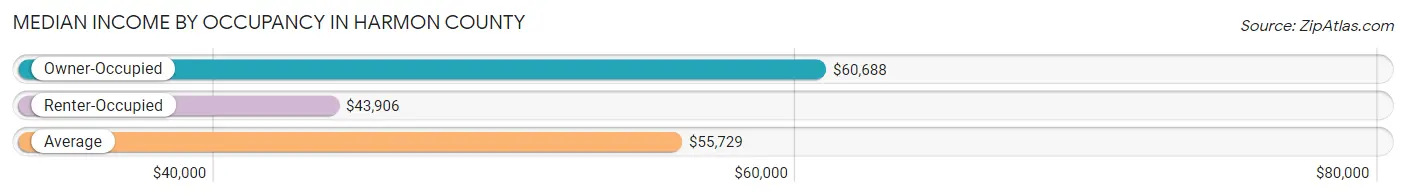
| Occupancy Type | # Households | Median Income |
| Owner-Occupied | 717 (75.2%) | $60,688 |
| Renter-Occupied | 237 (24.8%) | $43,906 |
| Average | 954 (100.0%) | $55,729 |
Occupancy by Householder Income Bracket in Harmon County
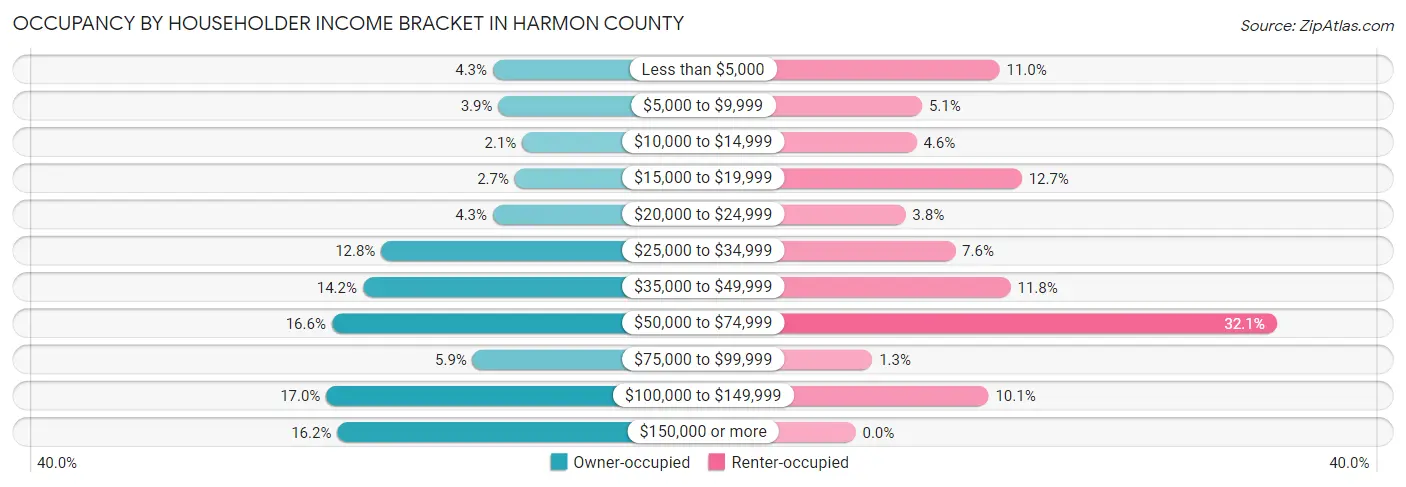
| Income Bracket | Owner-occupied | Renter-occupied |
| Less than $5,000 | 31 (4.3%) | 26 (11.0%) |
| $5,000 to $9,999 | 28 (3.9%) | 12 (5.1%) |
| $10,000 to $14,999 | 15 (2.1%) | 11 (4.6%) |
| $15,000 to $19,999 | 19 (2.6%) | 30 (12.7%) |
| $20,000 to $24,999 | 31 (4.3%) | 9 (3.8%) |
| $25,000 to $34,999 | 92 (12.8%) | 18 (7.6%) |
| $35,000 to $49,999 | 102 (14.2%) | 28 (11.8%) |
| $50,000 to $74,999 | 119 (16.6%) | 76 (32.1%) |
| $75,000 to $99,999 | 42 (5.9%) | 3 (1.3%) |
| $100,000 to $149,999 | 122 (17.0%) | 24 (10.1%) |
| $150,000 or more | 116 (16.2%) | 0 (0.0%) |
| Total | 717 (100.0%) | 237 (100.0%) |
Monthly Housing Cost Tiers in Harmon County
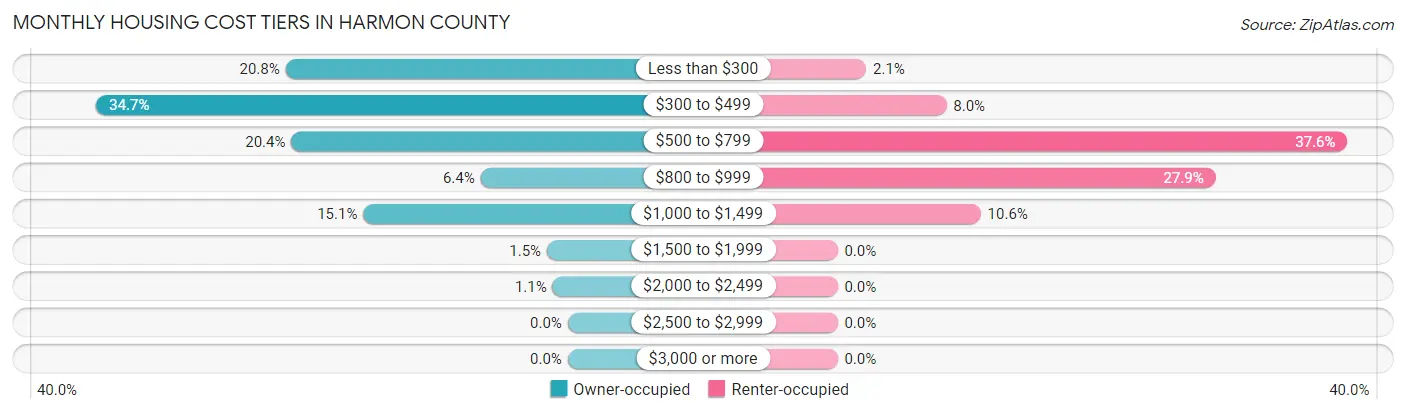
| Monthly Cost | Owner-occupied | Renter-occupied |
| Less than $300 | 149 (20.8%) | 5 (2.1%) |
| $300 to $499 | 249 (34.7%) | 19 (8.0%) |
| $500 to $799 | 146 (20.4%) | 89 (37.6%) |
| $800 to $999 | 46 (6.4%) | 66 (27.9%) |
| $1,000 to $1,499 | 108 (15.1%) | 25 (10.5%) |
| $1,500 to $1,999 | 11 (1.5%) | 0 (0.0%) |
| $2,000 to $2,499 | 8 (1.1%) | 0 (0.0%) |
| $2,500 to $2,999 | 0 (0.0%) | 0 (0.0%) |
| $3,000 or more | 0 (0.0%) | 0 (0.0%) |
| Total | 717 (100.0%) | 237 (100.0%) |
Physical Housing Characteristics in Harmon County
Housing Structures in Harmon County
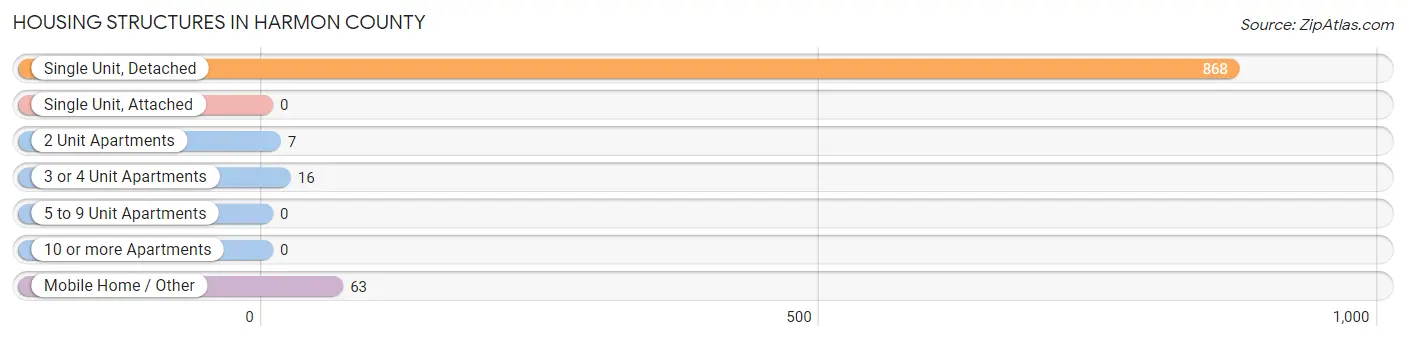
| Structure Type | # Housing Units | % Housing Units |
| Single Unit, Detached | 868 | 91.0% |
| Single Unit, Attached | 0 | 0.0% |
| 2 Unit Apartments | 7 | 0.7% |
| 3 or 4 Unit Apartments | 16 | 1.7% |
| 5 to 9 Unit Apartments | 0 | 0.0% |
| 10 or more Apartments | 0 | 0.0% |
| Mobile Home / Other | 63 | 6.6% |
| Total | 954 | 100.0% |
Housing Structures by Occupancy in Harmon County
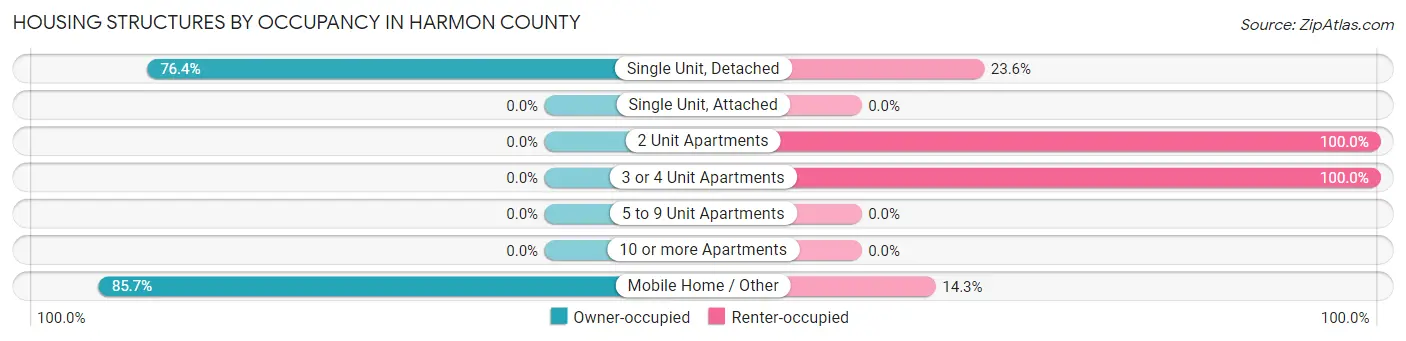
| Structure Type | Owner-occupied | Renter-occupied |
| Single Unit, Detached | 663 (76.4%) | 205 (23.6%) |
| Single Unit, Attached | 0 (0.0%) | 0 (0.0%) |
| 2 Unit Apartments | 0 (0.0%) | 7 (100.0%) |
| 3 or 4 Unit Apartments | 0 (0.0%) | 16 (100.0%) |
| 5 to 9 Unit Apartments | 0 (0.0%) | 0 (0.0%) |
| 10 or more Apartments | 0 (0.0%) | 0 (0.0%) |
| Mobile Home / Other | 54 (85.7%) | 9 (14.3%) |
| Total | 717 (75.2%) | 237 (24.8%) |
Housing Structures by Number of Rooms in Harmon County
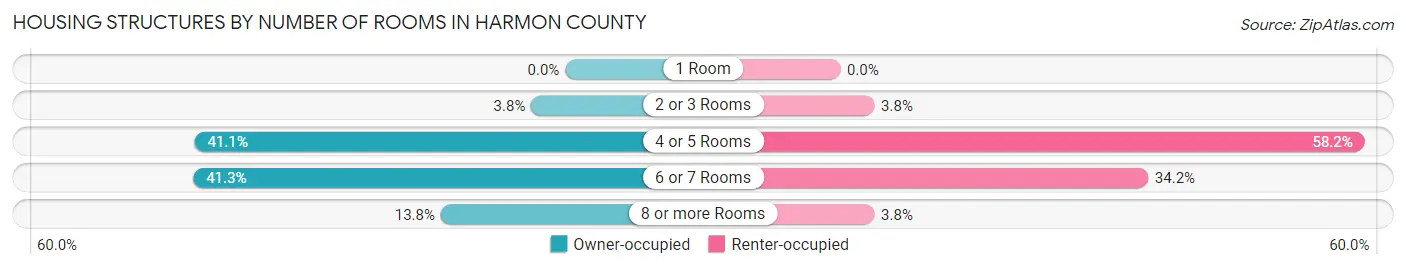
| Number of Rooms | Owner-occupied | Renter-occupied |
| 1 Room | 0 (0.0%) | 0 (0.0%) |
| 2 or 3 Rooms | 27 (3.8%) | 9 (3.8%) |
| 4 or 5 Rooms | 295 (41.1%) | 138 (58.2%) |
| 6 or 7 Rooms | 296 (41.3%) | 81 (34.2%) |
| 8 or more Rooms | 99 (13.8%) | 9 (3.8%) |
| Total | 717 (100.0%) | 237 (100.0%) |
Housing Structure by Heating Type in Harmon County
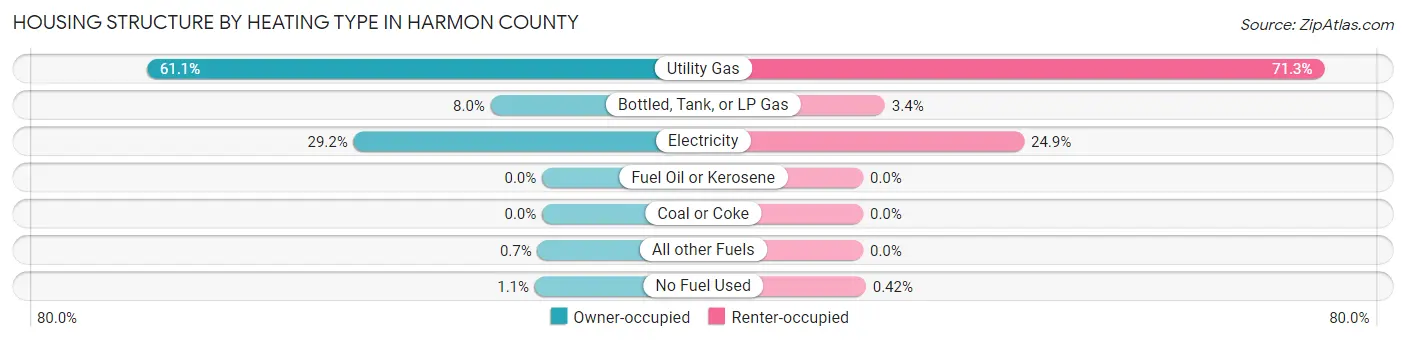
| Heating Type | Owner-occupied | Renter-occupied |
| Utility Gas | 438 (61.1%) | 169 (71.3%) |
| Bottled, Tank, or LP Gas | 57 (8.0%) | 8 (3.4%) |
| Electricity | 209 (29.1%) | 59 (24.9%) |
| Fuel Oil or Kerosene | 0 (0.0%) | 0 (0.0%) |
| Coal or Coke | 0 (0.0%) | 0 (0.0%) |
| All other Fuels | 5 (0.7%) | 0 (0.0%) |
| No Fuel Used | 8 (1.1%) | 1 (0.4%) |
| Total | 717 (100.0%) | 237 (100.0%) |
Household Vehicle Usage in Harmon County
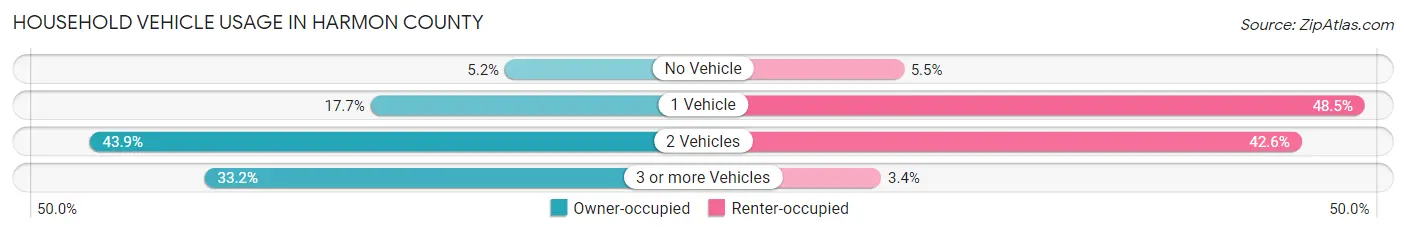
| Vehicles per Household | Owner-occupied | Renter-occupied |
| No Vehicle | 37 (5.2%) | 13 (5.5%) |
| 1 Vehicle | 127 (17.7%) | 115 (48.5%) |
| 2 Vehicles | 315 (43.9%) | 101 (42.6%) |
| 3 or more Vehicles | 238 (33.2%) | 8 (3.4%) |
| Total | 717 (100.0%) | 237 (100.0%) |
Real Estate & Mortgages in Harmon County
Real Estate and Mortgage Overview in Harmon County
| Characteristic | Without Mortgage | With Mortgage |
| Housing Units | 516 | 201 |
| Median Property Value | $68,500 | $101,100 |
| Median Household Income | $46,500 | $51 |
| Monthly Housing Costs | $398 | $0 |
| Real Estate Taxes | $453 | $0 |
Property Value by Mortgage Status in Harmon County
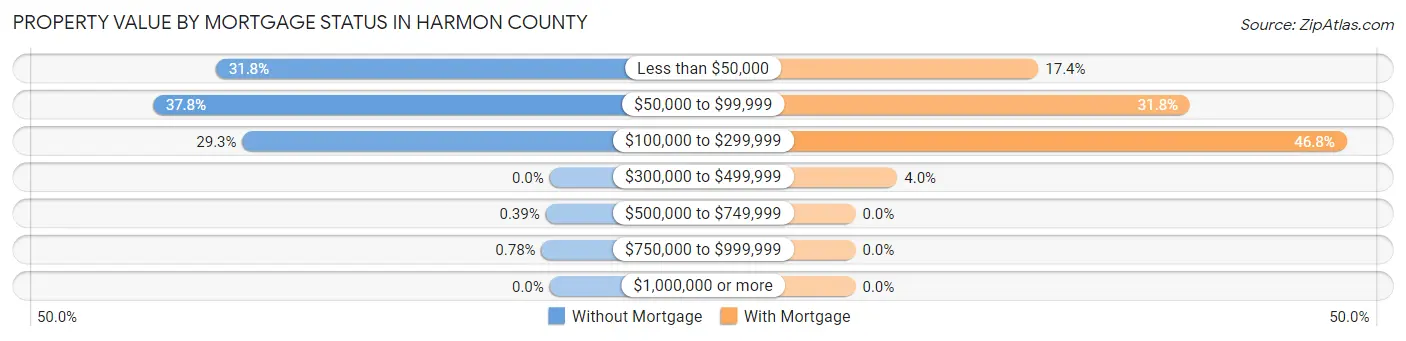
| Property Value | Without Mortgage | With Mortgage |
| Less than $50,000 | 164 (31.8%) | 35 (17.4%) |
| $50,000 to $99,999 | 195 (37.8%) | 64 (31.8%) |
| $100,000 to $299,999 | 151 (29.3%) | 94 (46.8%) |
| $300,000 to $499,999 | 0 (0.0%) | 8 (4.0%) |
| $500,000 to $749,999 | 2 (0.4%) | 0 (0.0%) |
| $750,000 to $999,999 | 4 (0.8%) | 0 (0.0%) |
| $1,000,000 or more | 0 (0.0%) | 0 (0.0%) |
| Total | 516 (100.0%) | 201 (100.0%) |
Household Income by Mortgage Status in Harmon County
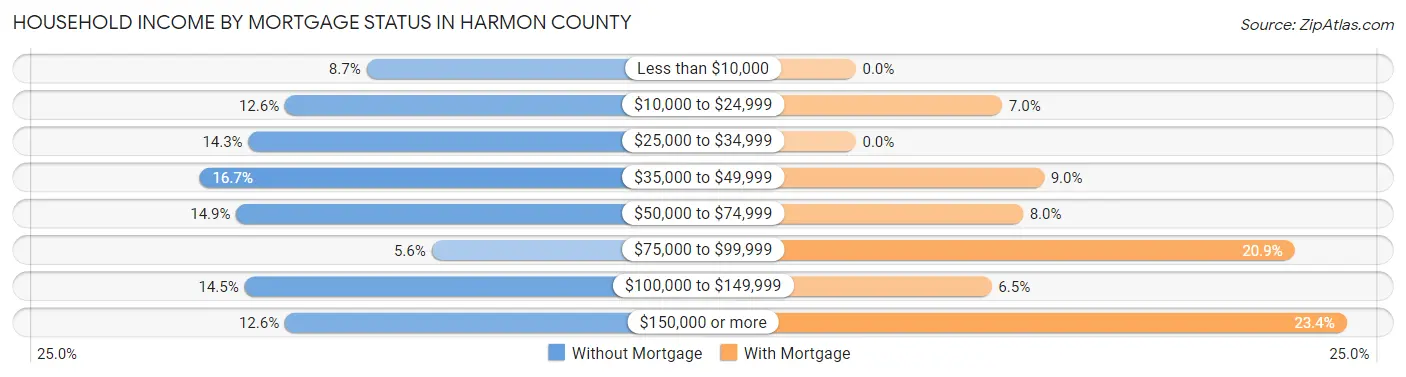
| Household Income | Without Mortgage | With Mortgage |
| Less than $10,000 | 45 (8.7%) | 0 (0.0%) |
| $10,000 to $24,999 | 65 (12.6%) | 14 (7.0%) |
| $25,000 to $34,999 | 74 (14.3%) | 0 (0.0%) |
| $35,000 to $49,999 | 86 (16.7%) | 18 (9.0%) |
| $50,000 to $74,999 | 77 (14.9%) | 16 (8.0%) |
| $75,000 to $99,999 | 29 (5.6%) | 42 (20.9%) |
| $100,000 to $149,999 | 75 (14.5%) | 13 (6.5%) |
| $150,000 or more | 65 (12.6%) | 47 (23.4%) |
| Total | 516 (100.0%) | 201 (100.0%) |
Property Value to Household Income Ratio in Harmon County
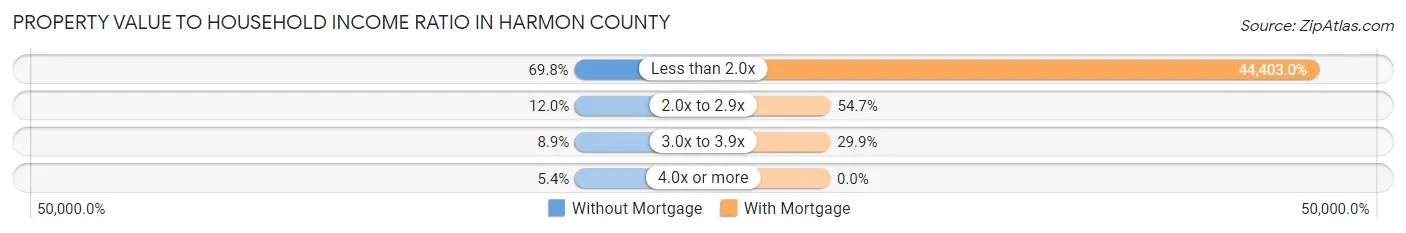
| Value-to-Income Ratio | Without Mortgage | With Mortgage |
| Less than 2.0x | 360 (69.8%) | 89,250 (44,403.0%) |
| 2.0x to 2.9x | 62 (12.0%) | 110 (54.7%) |
| 3.0x to 3.9x | 46 (8.9%) | 60 (29.8%) |
| 4.0x or more | 28 (5.4%) | 0 (0.0%) |
| Total | 516 (100.0%) | 201 (100.0%) |
Real Estate Taxes by Mortgage Status in Harmon County
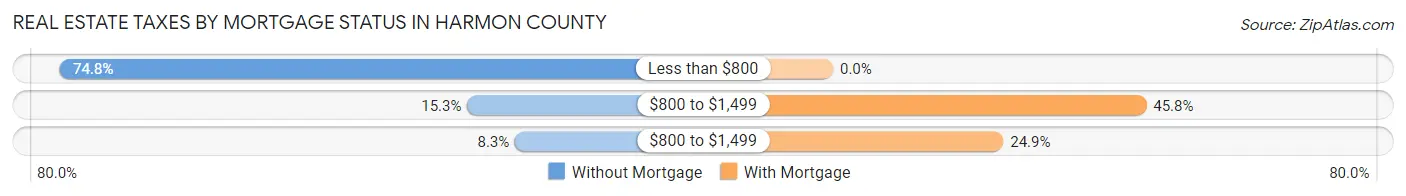
| Property Taxes | Without Mortgage | With Mortgage |
| Less than $800 | 386 (74.8%) | 0 (0.0%) |
| $800 to $1,499 | 79 (15.3%) | 92 (45.8%) |
| $800 to $1,499 | 43 (8.3%) | 50 (24.9%) |
| Total | 516 (100.0%) | 201 (100.0%) |
Health & Disability in Harmon County
Health Insurance Coverage by Age in Harmon County
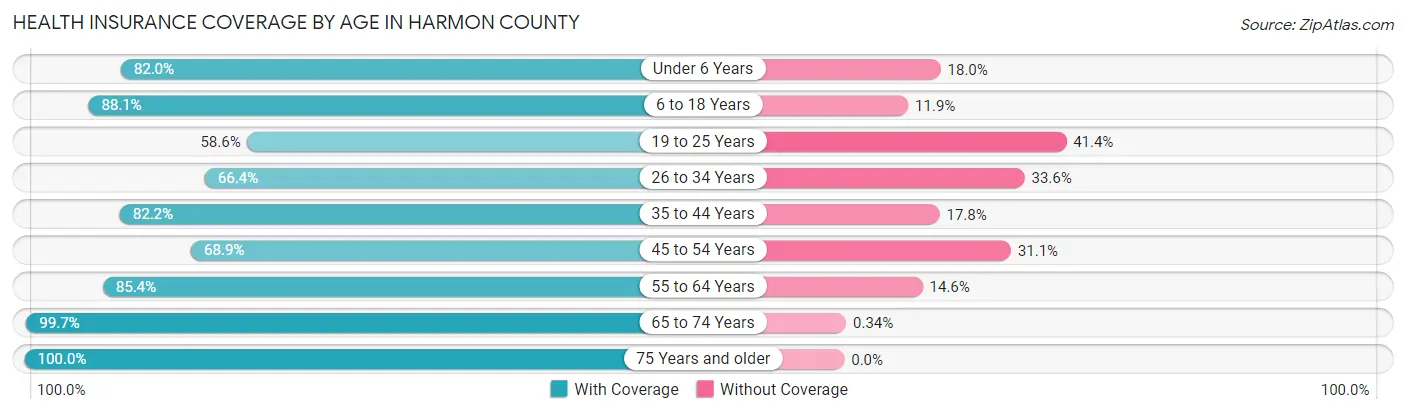
| Age Bracket | With Coverage | Without Coverage |
| Under 6 Years | 137 (82.0%) | 30 (18.0%) |
| 6 to 18 Years | 392 (88.1%) | 53 (11.9%) |
| 19 to 25 Years | 119 (58.6%) | 84 (41.4%) |
| 26 to 34 Years | 156 (66.4%) | 79 (33.6%) |
| 35 to 44 Years | 199 (82.2%) | 43 (17.8%) |
| 45 to 54 Years | 244 (68.9%) | 110 (31.1%) |
| 55 to 64 Years | 275 (85.4%) | 47 (14.6%) |
| 65 to 74 Years | 295 (99.7%) | 1 (0.3%) |
| 75 Years and older | 153 (100.0%) | 0 (0.0%) |
| Total | 1,970 (81.5%) | 447 (18.5%) |
Health Insurance Coverage by Citizenship Status in Harmon County
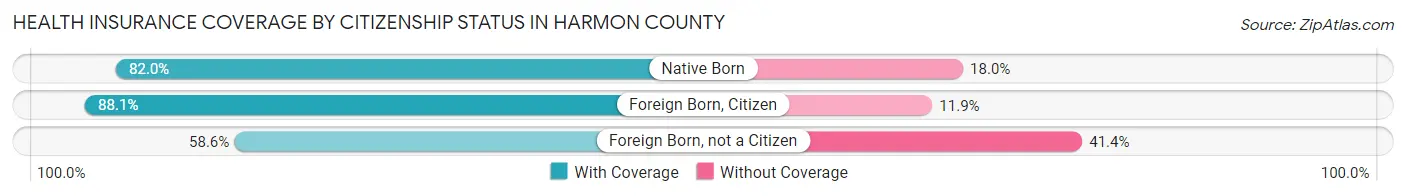
| Citizenship Status | With Coverage | Without Coverage |
| Native Born | 137 (82.0%) | 30 (18.0%) |
| Foreign Born, Citizen | 392 (88.1%) | 53 (11.9%) |
| Foreign Born, not a Citizen | 119 (58.6%) | 84 (41.4%) |
Health Insurance Coverage by Household Income in Harmon County
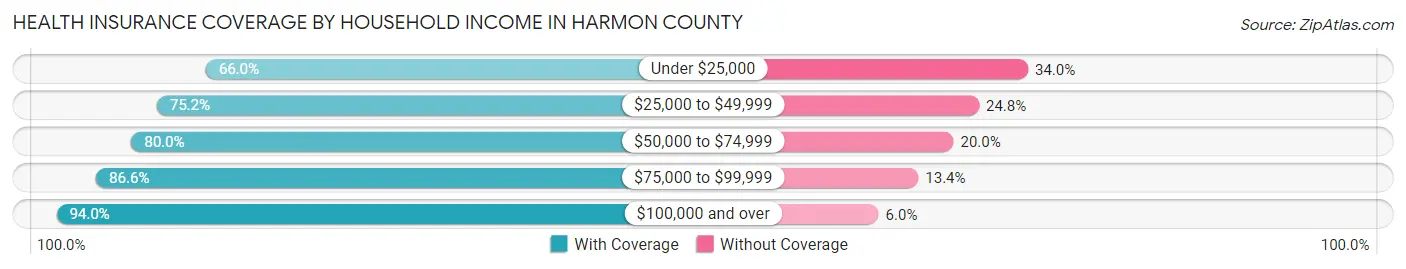
| Household Income | With Coverage | Without Coverage |
| Under $25,000 | 282 (66.0%) | 145 (34.0%) |
| $25,000 to $49,999 | 434 (75.2%) | 143 (24.8%) |
| $50,000 to $74,999 | 356 (80.0%) | 89 (20.0%) |
| $75,000 to $99,999 | 142 (86.6%) | 22 (13.4%) |
| $100,000 and over | 756 (94.0%) | 48 (6.0%) |
Public vs Private Health Insurance Coverage by Age in Harmon County
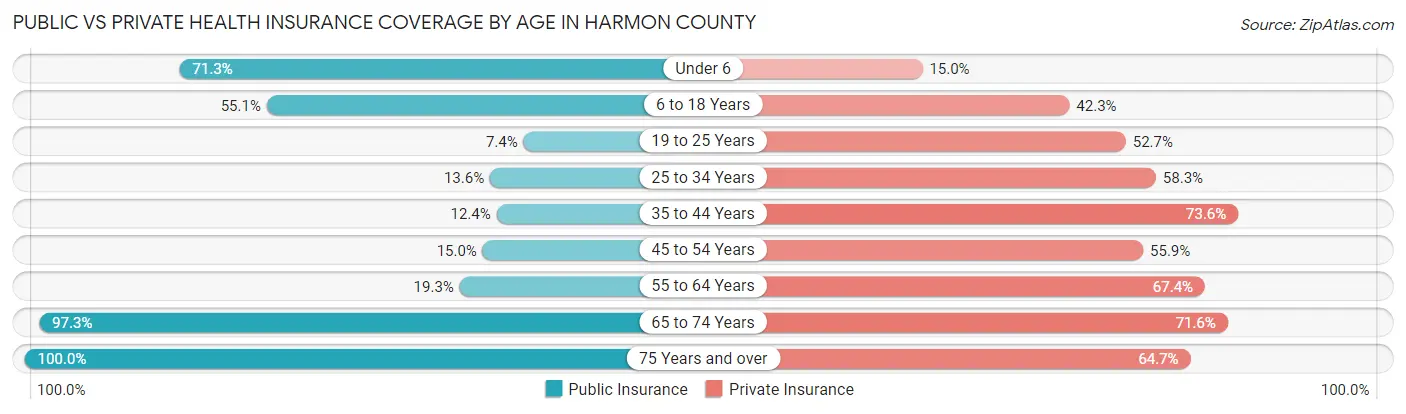
| Age Bracket | Public Insurance | Private Insurance |
| Under 6 | 119 (71.3%) | 25 (15.0%) |
| 6 to 18 Years | 245 (55.1%) | 188 (42.2%) |
| 19 to 25 Years | 15 (7.4%) | 107 (52.7%) |
| 25 to 34 Years | 32 (13.6%) | 137 (58.3%) |
| 35 to 44 Years | 30 (12.4%) | 178 (73.6%) |
| 45 to 54 Years | 53 (15.0%) | 198 (55.9%) |
| 55 to 64 Years | 62 (19.3%) | 217 (67.4%) |
| 65 to 74 Years | 288 (97.3%) | 212 (71.6%) |
| 75 Years and over | 153 (100.0%) | 99 (64.7%) |
| Total | 997 (41.2%) | 1,361 (56.3%) |
Disability Status by Sex by Age in Harmon County
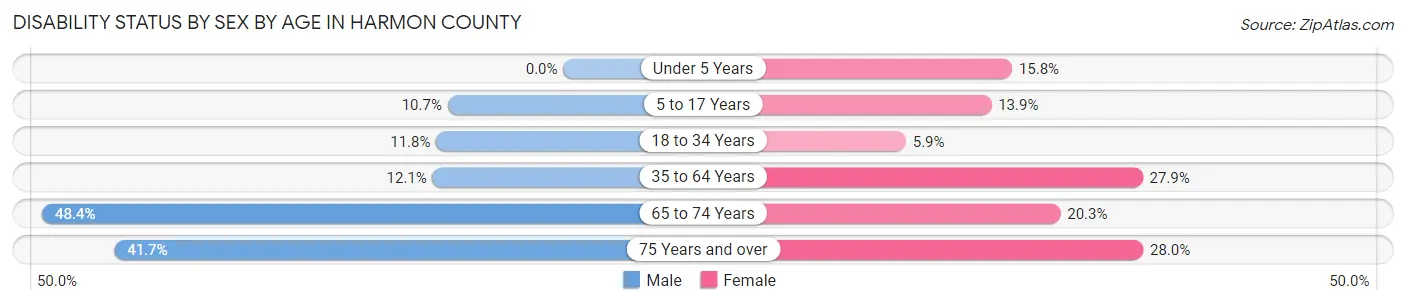
| Age Bracket | Male | Female |
| Under 5 Years | 0 (0.0%) | 9 (15.8%) |
| 5 to 17 Years | 25 (10.7%) | 33 (13.9%) |
| 18 to 34 Years | 27 (11.8%) | 13 (5.9%) |
| 35 to 64 Years | 54 (12.1%) | 132 (27.9%) |
| 65 to 74 Years | 74 (48.4%) | 29 (20.3%) |
| 75 Years and over | 25 (41.7%) | 26 (28.0%) |
Disability Class by Sex by Age in Harmon County
Disability Class: Hearing Difficulty
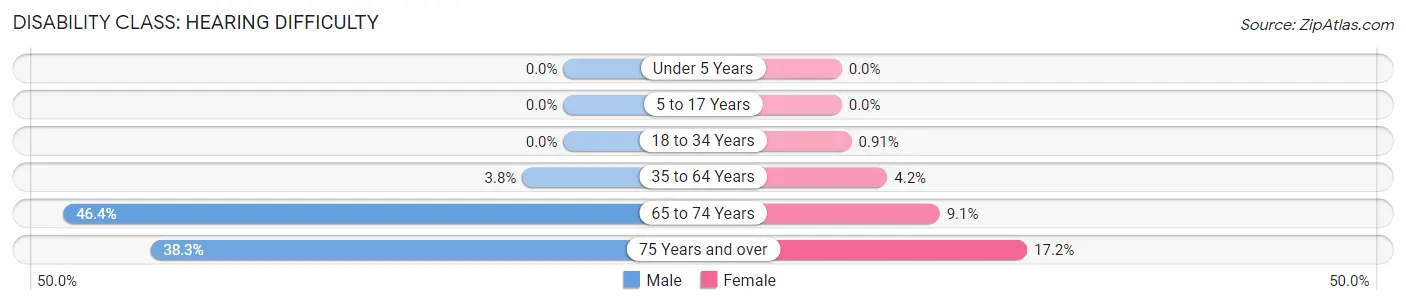
| Age Bracket | Male | Female |
| Under 5 Years | 0 (0.0%) | 0 (0.0%) |
| 5 to 17 Years | 0 (0.0%) | 0 (0.0%) |
| 18 to 34 Years | 0 (0.0%) | 2 (0.9%) |
| 35 to 64 Years | 17 (3.8%) | 20 (4.2%) |
| 65 to 74 Years | 71 (46.4%) | 13 (9.1%) |
| 75 Years and over | 23 (38.3%) | 16 (17.2%) |
Disability Class: Vision Difficulty
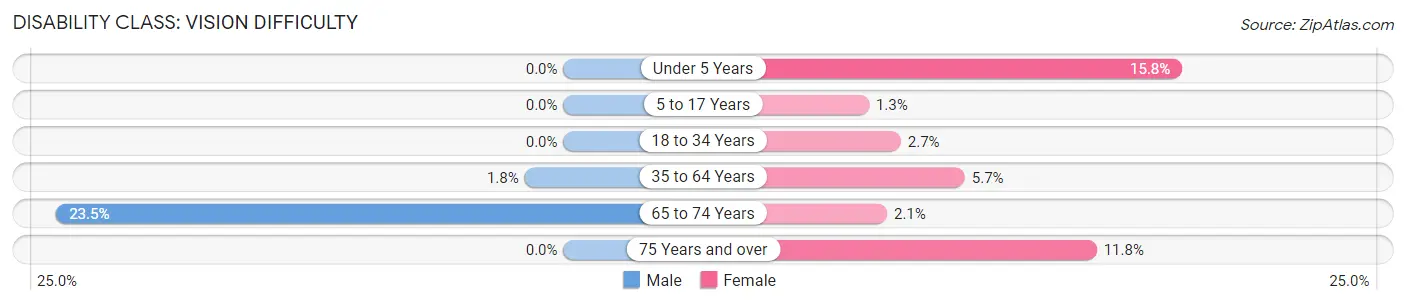
| Age Bracket | Male | Female |
| Under 5 Years | 0 (0.0%) | 9 (15.8%) |
| 5 to 17 Years | 0 (0.0%) | 3 (1.3%) |
| 18 to 34 Years | 0 (0.0%) | 6 (2.7%) |
| 35 to 64 Years | 8 (1.8%) | 27 (5.7%) |
| 65 to 74 Years | 36 (23.5%) | 3 (2.1%) |
| 75 Years and over | 0 (0.0%) | 11 (11.8%) |
Disability Class: Cognitive Difficulty
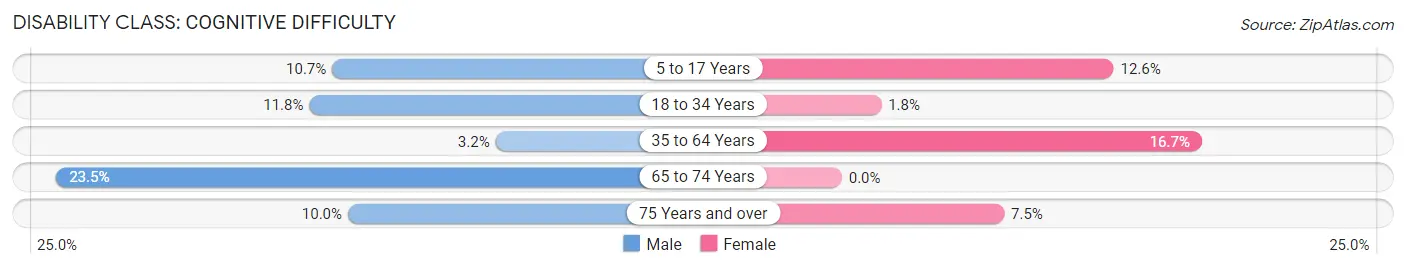
| Age Bracket | Male | Female |
| 5 to 17 Years | 25 (10.7%) | 30 (12.6%) |
| 18 to 34 Years | 27 (11.8%) | 4 (1.8%) |
| 35 to 64 Years | 14 (3.2%) | 79 (16.7%) |
| 65 to 74 Years | 36 (23.5%) | 0 (0.0%) |
| 75 Years and over | 6 (10.0%) | 7 (7.5%) |
Disability Class: Ambulatory Difficulty
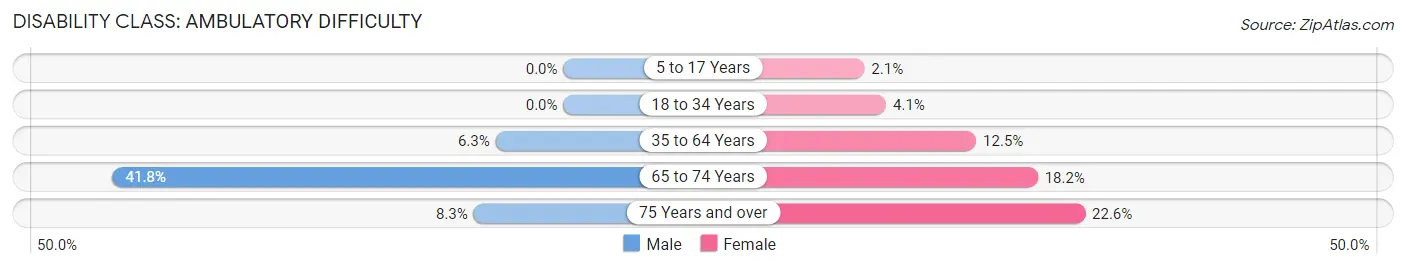
| Age Bracket | Male | Female |
| 5 to 17 Years | 0 (0.0%) | 5 (2.1%) |
| 18 to 34 Years | 0 (0.0%) | 9 (4.1%) |
| 35 to 64 Years | 28 (6.3%) | 59 (12.5%) |
| 65 to 74 Years | 64 (41.8%) | 26 (18.2%) |
| 75 Years and over | 5 (8.3%) | 21 (22.6%) |
Disability Class: Self-Care Difficulty
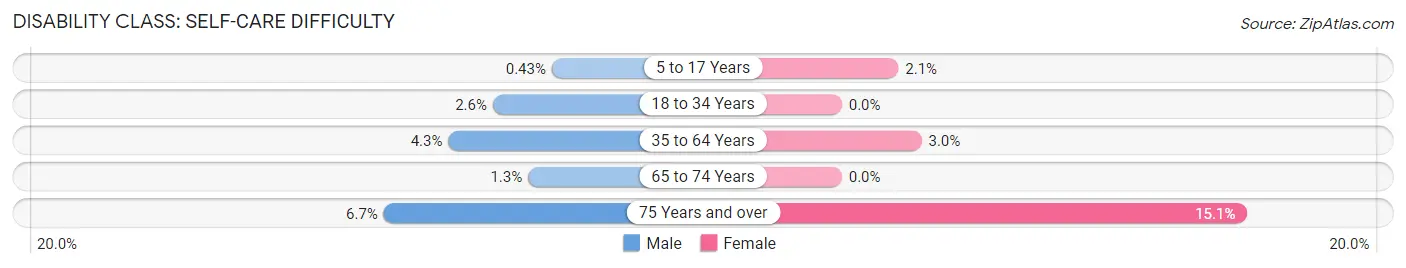
| Age Bracket | Male | Female |
| 5 to 17 Years | 1 (0.4%) | 5 (2.1%) |
| 18 to 34 Years | 6 (2.6%) | 0 (0.0%) |
| 35 to 64 Years | 19 (4.3%) | 14 (3.0%) |
| 65 to 74 Years | 2 (1.3%) | 0 (0.0%) |
| 75 Years and over | 4 (6.7%) | 14 (15.0%) |
Technology Access in Harmon County
Computing Device Access in Harmon County
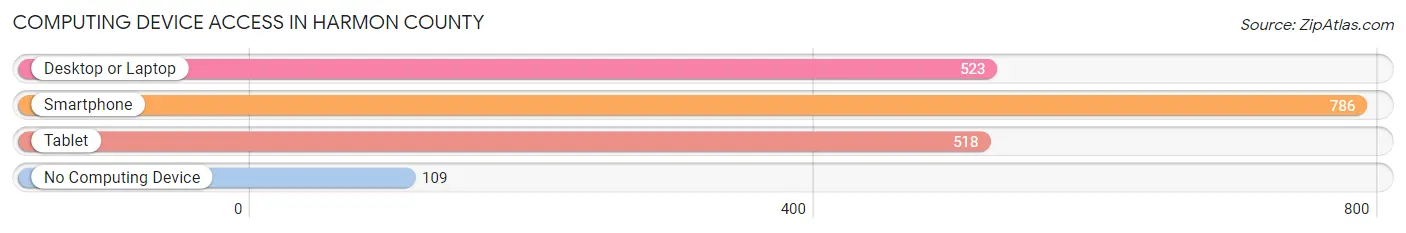
| Device Type | # Households | % Households |
| Desktop or Laptop | 523 | 54.8% |
| Smartphone | 786 | 82.4% |
| Tablet | 518 | 54.3% |
| No Computing Device | 109 | 11.4% |
| Total | 954 | 100.0% |
Internet Access in Harmon County
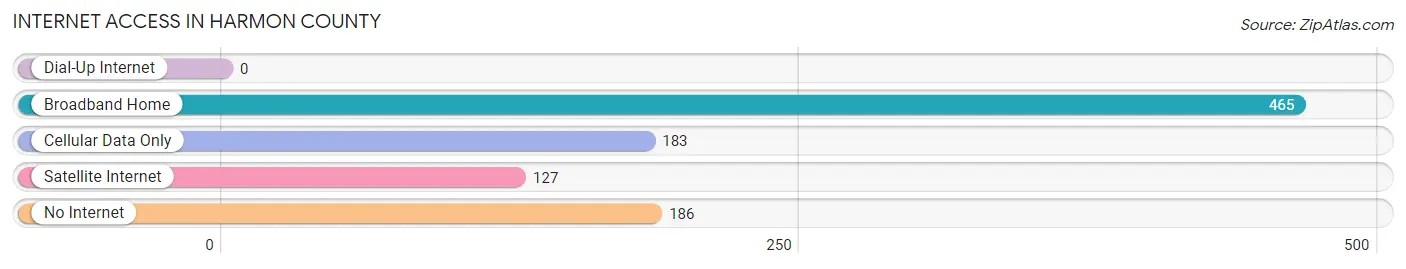
| Internet Type | # Households | % Households |
| Dial-Up Internet | 0 | 0.0% |
| Broadband Home | 465 | 48.7% |
| Cellular Data Only | 183 | 19.2% |
| Satellite Internet | 127 | 13.3% |
| No Internet | 186 | 19.5% |
| Total | 954 | 100.0% |
Harmon County Summary
Harmon County is located in the southwestern part of Oklahoma, and is bordered by Greer County to the north, Jackson County to the east, Beckham County to the south, and Texas to the west. The county seat is Hollis, and the county was named for Judson Harmon, the Attorney General of the United States from 1909 to 1913. Harmon County covers an area of 845 square miles, and has a population of 3,072, according to the 2010 census.
Geography
Harmon County is located in the Red Bed Plains region of Oklahoma, and is characterized by flat to rolling terrain. The county is drained by the North Fork of the Red River, which flows through the county from north to south. The county is also home to several small lakes, including Lake Hollis, Lake Harmon, and Lake McBride. The county is mostly covered in grassland, with some areas of woodland.
Economy
Agriculture is the main economic activity in Harmon County, with the majority of the land being used for cattle and sheep ranching. Other crops grown in the county include wheat, corn, sorghum, and hay. The county also has some oil and gas production, as well as some manufacturing. The county is home to several small businesses, including a few restaurants, a grocery store, and a few convenience stores.
Demographics
According to the 2010 census, Harmon County had a population of 3,072, with a population density of 3.6 people per square mile. The racial makeup of the county was 94.3% White, 0.3% African American, 0.7% Native American, 0.1% Asian, 0.1% Pacific Islander, 2.7% from other races, and 1.8% from two or more races. Hispanic or Latino of any race were 4.3% of the population.
The median income for a household in the county was $30,938, and the median income for a family was $35,938. The per capita income for the county was $15,845. About 16.2% of the population was below the poverty line.
Education
Harmon County is served by the Hollis Public Schools, which includes Hollis High School, Hollis Middle School, and Hollis Elementary School. The county also has a private school, the Harmon County Christian Academy.
Conclusion
Harmon County is a rural county located in southwestern Oklahoma. The county is mostly covered in grassland, and is home to several small lakes. Agriculture is the main economic activity in the county, with cattle and sheep ranching being the primary industry. The county has a population of 3,072, and is served by the Hollis Public Schools and the Harmon County Christian Academy.
Common Questions
What is Per Capita Income in Harmon County?
Per Capita income in Harmon County is $31,814.
What is the Median Family Income in Harmon County?
Median Family Income in Harmon County is $64,375.
What is the Median Household income in Harmon County?
Median Household Income in Harmon County is $55,729.
What is Income or Wage Gap in Harmon County?
Income or Wage Gap in Harmon County is 43.3%.
Women in Harmon County earn 56.7 cents for every dollar earned by a man.
What is Family Income Deficit in Harmon County?
Family Income Deficit in Harmon County is $13,730.
Families that are below poverty line in Harmon County earn $13,730 less on average than the poverty threshold level.
What is Inequality or Gini Index in Harmon County?
Inequality or Gini Index in Harmon County is 0.51.
What is the Total Population of Harmon County?
Total Population of Harmon County is 2,499.
What is the Total Male Population of Harmon County?
Total Male Population of Harmon County is 1,243.
What is the Total Female Population of Harmon County?
Total Female Population of Harmon County is 1,256.
What is the Ratio of Males per 100 Females in Harmon County?
There are 98.96 Males per 100 Females in Harmon County.
What is the Ratio of Females per 100 Males in Harmon County?
There are 101.05 Females per 100 Males in Harmon County.
What is the Median Population Age in Harmon County?
Median Population Age in Harmon County is 40.7 Years.
What is the Average Family Size in Harmon County
Average Family Size in Harmon County is 3.1 People.
What is the Average Household Size in Harmon County
Average Household Size in Harmon County is 2.5 People.
How Large is the Labor Force in Harmon County?
There are 1,183 People in the Labor Forcein in Harmon County.
What is the Percentage of People in the Labor Force in Harmon County?
59.3% of People are in the Labor Force in Harmon County.
What is the Unemployment Rate in Harmon County?
Unemployment Rate in Harmon County is 7.4%.