Greer County, OK Map & Demographics
Greer County Map
Greer County Overview
$22,721
PER CAPITA INCOME
$63,970
AVG FAMILY INCOME
$55,204
AVG HOUSEHOLD INCOME
23.8%
WAGE / INCOME GAP [ % ]
76.2¢/ $1
WAGE / INCOME GAP [ $ ]
0.42
INEQUALITY / GINI INDEX
5,531
TOTAL POPULATION
3,096
MALE POPULATION
2,435
FEMALE POPULATION
127.15
MALES / 100 FEMALES
78.65
FEMALES / 100 MALES
41.0
MEDIAN AGE
2.9
AVG FAMILY SIZE
2.3
AVG HOUSEHOLD SIZE
2,064
LABOR FORCE [ PEOPLE ]
45.9%
PERCENT IN LABOR FORCE
5.8%
UNEMPLOYMENT RATE
Greer County Area Codes
Income in Greer County
Income Overview in Greer County
Per Capita Income in Greer County is $22,721, while median incomes of families and households are $63,970 and $55,204 respectively.
| Characteristic | Number | Measure |
| Per Capita Income | 5,531 | $22,721 |
| Median Family Income | 1,223 | $63,970 |
| Mean Family Income | 1,223 | $77,345 |
| Median Household Income | 2,024 | $55,204 |
| Mean Household Income | 2,024 | $61,654 |
| Income Deficit | 1,223 | $0 |
| Wage / Income Gap (%) | 5,531 | 23.75% |
| Wage / Income Gap ($) | 5,531 | 76.25¢ per $1 |
| Gini / Inequality Index | 5,531 | 0.42 |
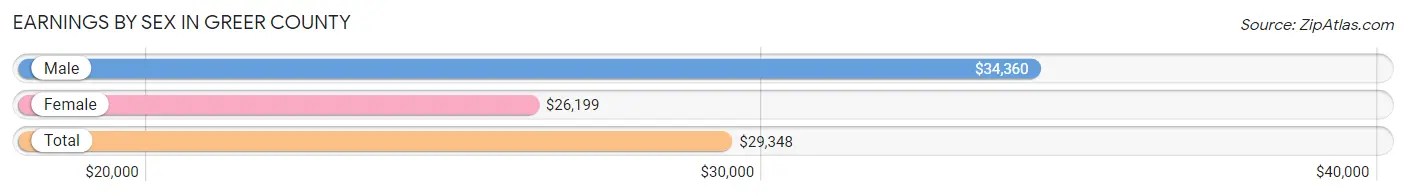
Earnings by Sex in Greer County
Average Earnings in Greer County are $29,348, $34,360 for men and $26,199 for women, a difference of 23.7%.
| Sex | Number | Average Earnings |
| Male | 1,294 (54.8%) | $34,360 |
| Female | 1,068 (45.2%) | $26,199 |
| Total | 2,362 (100.0%) | $29,348 |
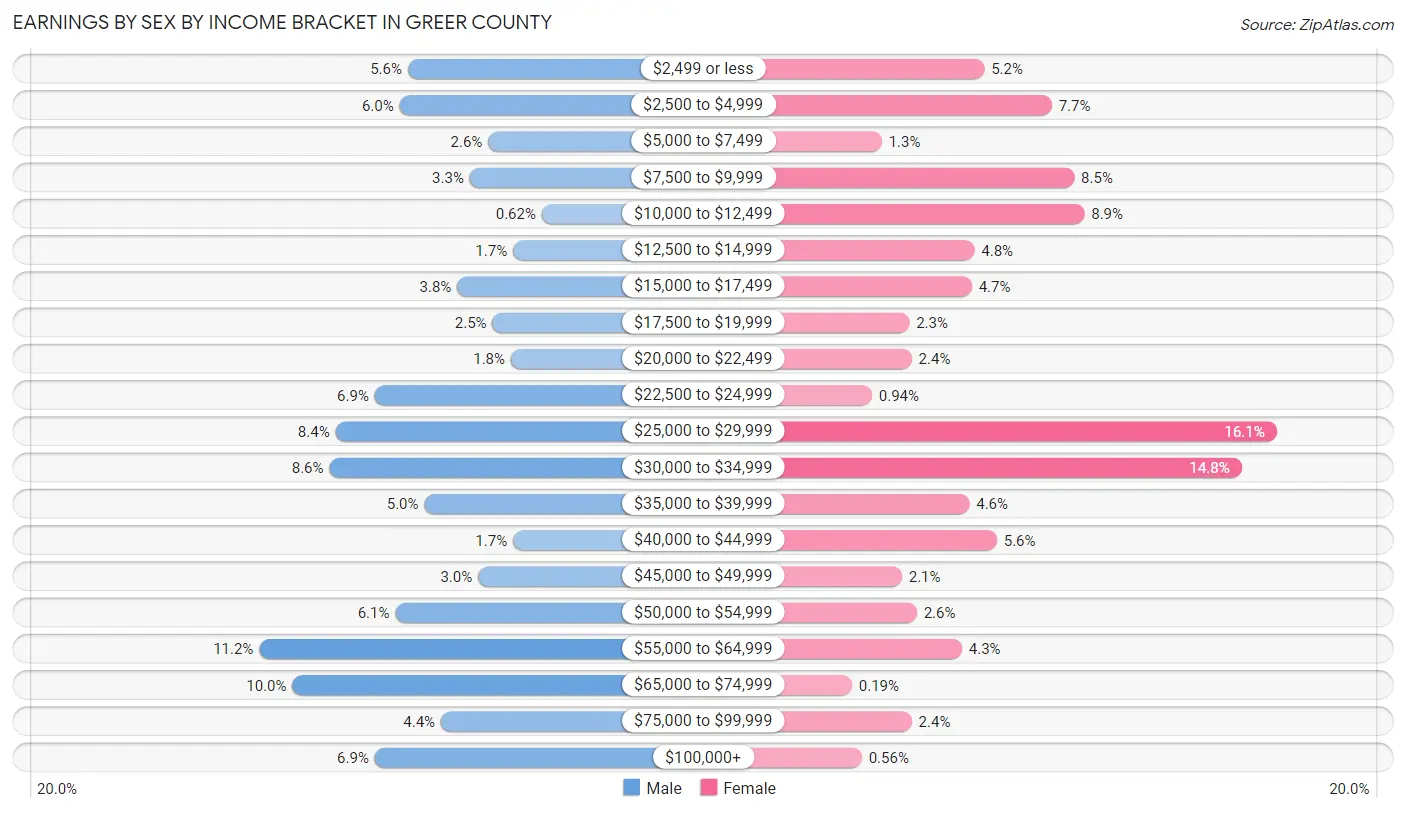
Earnings by Sex by Income Bracket in Greer County
The most common earnings brackets in Greer County are $55,000 to $64,999 for men (145 | 11.2%) and $25,000 to $29,999 for women (172 | 16.1%).
| Income | Male | Female |
| $2,499 or less | 73 (5.6%) | 55 (5.1%) |
| $2,500 to $4,999 | 77 (5.9%) | 82 (7.7%) |
| $5,000 to $7,499 | 34 (2.6%) | 14 (1.3%) |
| $7,500 to $9,999 | 43 (3.3%) | 91 (8.5%) |
| $10,000 to $12,499 | 8 (0.6%) | 95 (8.9%) |
| $12,500 to $14,999 | 22 (1.7%) | 51 (4.8%) |
| $15,000 to $17,499 | 49 (3.8%) | 50 (4.7%) |
| $17,500 to $19,999 | 32 (2.5%) | 25 (2.3%) |
| $20,000 to $22,499 | 23 (1.8%) | 26 (2.4%) |
| $22,500 to $24,999 | 89 (6.9%) | 10 (0.9%) |
| $25,000 to $29,999 | 108 (8.4%) | 172 (16.1%) |
| $30,000 to $34,999 | 111 (8.6%) | 158 (14.8%) |
| $35,000 to $39,999 | 65 (5.0%) | 49 (4.6%) |
| $40,000 to $44,999 | 22 (1.7%) | 60 (5.6%) |
| $45,000 to $49,999 | 39 (3.0%) | 22 (2.1%) |
| $50,000 to $54,999 | 79 (6.1%) | 28 (2.6%) |
| $55,000 to $64,999 | 145 (11.2%) | 46 (4.3%) |
| $65,000 to $74,999 | 129 (10.0%) | 2 (0.2%) |
| $75,000 to $99,999 | 57 (4.4%) | 26 (2.4%) |
| $100,000+ | 89 (6.9%) | 6 (0.6%) |
| Total | 1,294 (100.0%) | 1,068 (100.0%) |
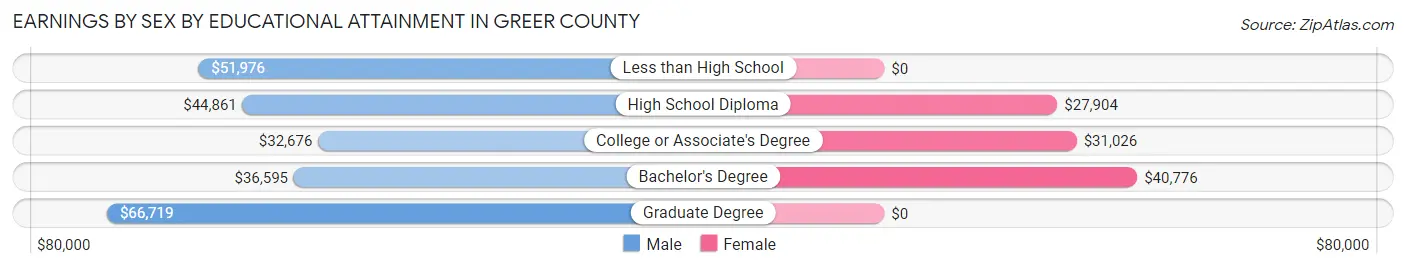
Earnings by Sex by Educational Attainment in Greer County
Average earnings in Greer County are $36,322 for men and $28,586 for women, a difference of 21.3%. Men with an educational attainment of graduate degree enjoy the highest average annual earnings of $66,719, while those with college or associate's degree education earn the least with $32,676. Women with an educational attainment of bachelor's degree earn the most with the average annual earnings of $40,776, while those with high school diploma education have the smallest earnings of $27,904.
| Educational Attainment | Male Income | Female Income |
| Less than High School | $51,976 | $0 |
| High School Diploma | $44,861 | $27,904 |
| College or Associate's Degree | $32,676 | $31,026 |
| Bachelor's Degree | $36,595 | $40,776 |
| Graduate Degree | $66,719 | $0 |
| Total | $36,322 | $28,586 |
Family Income in Greer County
Family Income Brackets in Greer County
According to the Greer County family income data, there are 401 families falling into the $50,000 to $74,999 income range, which is the most common income bracket and makes up 32.8% of all families. Conversely, the $10,000 to $14,999 income bracket is the least frequent group with only 15 families (1.2%) belonging to this category.
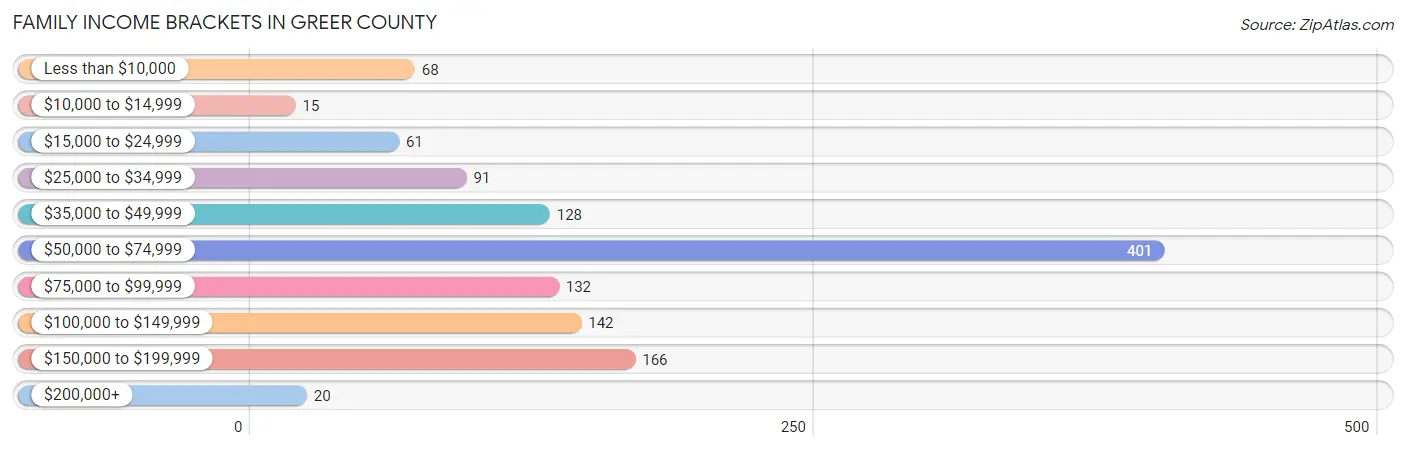
| Income Bracket | # Families | % Families |
| Less than $10,000 | 68 | 5.6% |
| $10,000 to $14,999 | 15 | 1.2% |
| $15,000 to $24,999 | 61 | 5.0% |
| $25,000 to $34,999 | 91 | 7.4% |
| $35,000 to $49,999 | 128 | 10.5% |
| $50,000 to $74,999 | 401 | 32.8% |
| $75,000 to $99,999 | 132 | 10.8% |
| $100,000 to $149,999 | 142 | 11.6% |
| $150,000 to $199,999 | 166 | 13.6% |
| $200,000+ | 20 | 1.6% |
Family Income by Famaliy Size in Greer County
5-person families (166 | 13.6%) account for the highest median family income in Greer County with $165,220 per family, while 5-person families (166 | 13.6%) have the highest median income of $33,044 per family member.
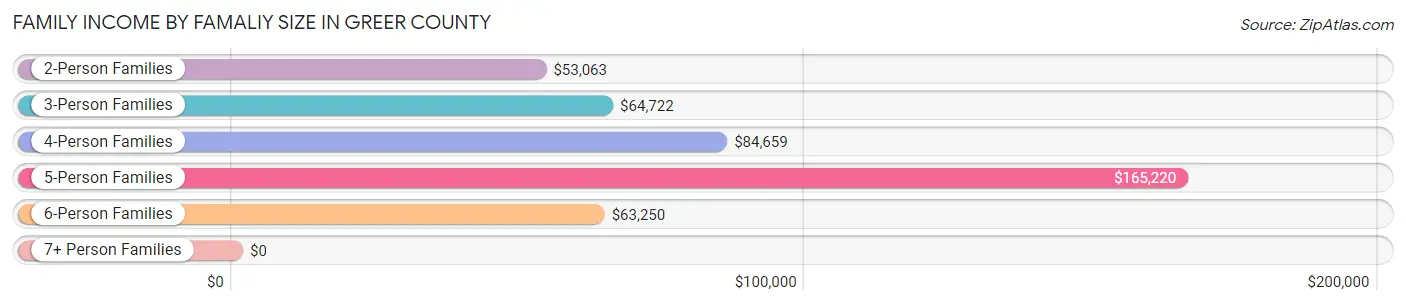
| Income Bracket | # Families | Median Income |
| 2-Person Families | 530 (43.3%) | $53,063 |
| 3-Person Families | 252 (20.6%) | $64,722 |
| 4-Person Families | 145 (11.9%) | $84,659 |
| 5-Person Families | 166 (13.6%) | $165,220 |
| 6-Person Families | 130 (10.6%) | $63,250 |
| 7+ Person Families | 0 (0.0%) | $0 |
| Total | 1,223 (100.0%) | $63,970 |
Family Income by Number of Earners in Greer County
The median family income in Greer County is $63,970, with families comprising 2 earners (525) having the highest median family income of $69,519, while families with no earners (174) have the lowest median family income of $27,500, accounting for 42.9% and 14.2% of families, respectively.
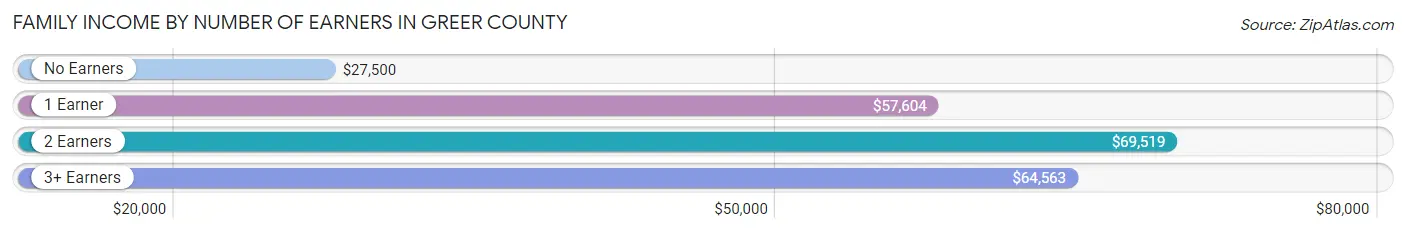
| Number of Earners | # Families | Median Income |
| No Earners | 174 (14.2%) | $27,500 |
| 1 Earner | 393 (32.1%) | $57,604 |
| 2 Earners | 525 (42.9%) | $69,519 |
| 3+ Earners | 131 (10.7%) | $64,563 |
| Total | 1,223 (100.0%) | $63,970 |
Household Income in Greer County
Household Income Brackets in Greer County
With 668 households falling in the category, the $50,000 to $74,999 income range is the most frequent in Greer County, accounting for 33.0% of all households. In contrast, only 18 households (0.9%) fall into the $200,000+ income bracket, making it the least populous group.
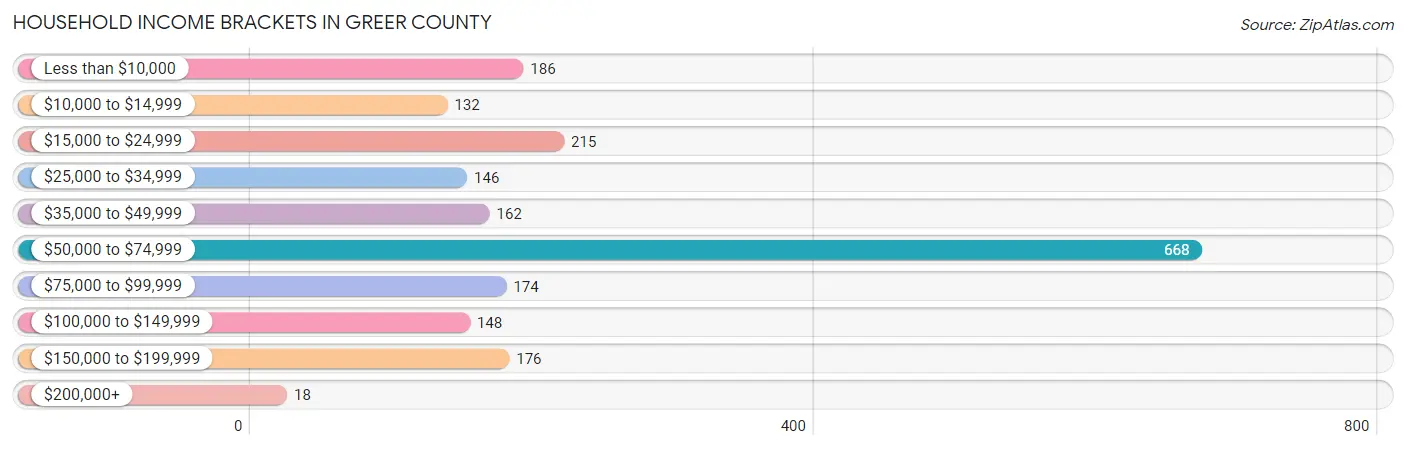
| Income Bracket | # Households | % Households |
| Less than $10,000 | 186 | 9.2% |
| $10,000 to $14,999 | 132 | 6.5% |
| $15,000 to $24,999 | 215 | 10.6% |
| $25,000 to $34,999 | 146 | 7.2% |
| $35,000 to $49,999 | 162 | 8.0% |
| $50,000 to $74,999 | 668 | 33.0% |
| $75,000 to $99,999 | 174 | 8.6% |
| $100,000 to $149,999 | 148 | 7.3% |
| $150,000 to $199,999 | 176 | 8.7% |
| $200,000+ | 18 | 0.9% |
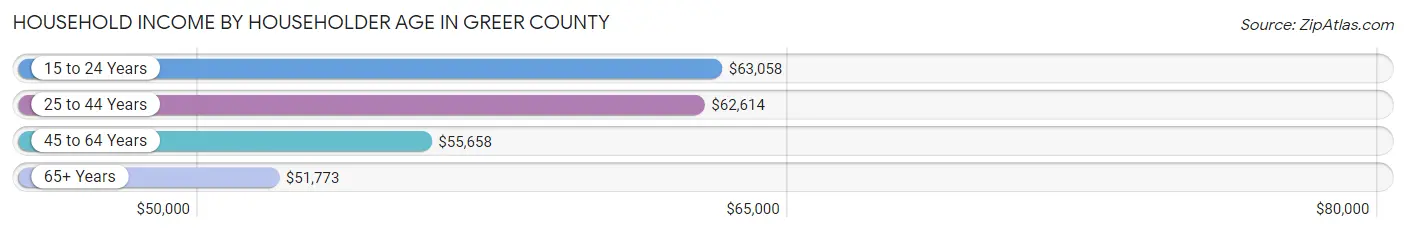
Household Income by Householder Age in Greer County
The median household income in Greer County is $55,204, with the highest median household income of $63,058 found in the 15 to 24 years age bracket for the primary householder. A total of 127 households (6.3%) fall into this category. Meanwhile, the 65+ years age bracket for the primary householder has the lowest median household income of $51,773, with 713 households (35.2%) in this group.
| Income Bracket | # Households | Median Income |
| 15 to 24 Years | 127 (6.3%) | $63,058 |
| 25 to 44 Years | 524 (25.9%) | $62,614 |
| 45 to 64 Years | 660 (32.6%) | $55,658 |
| 65+ Years | 713 (35.2%) | $51,773 |
| Total | 2,024 (100.0%) | $55,204 |
Poverty in Greer County
Income Below Poverty by Sex and Age in Greer County
With 13.4% poverty level for males and 19.5% for females among the residents of Greer County, under 5 year old males and 5 year old females are the most vulnerable to poverty, with 55 males (42.0%) and 9 females (42.9%) in their respective age groups living below the poverty level.
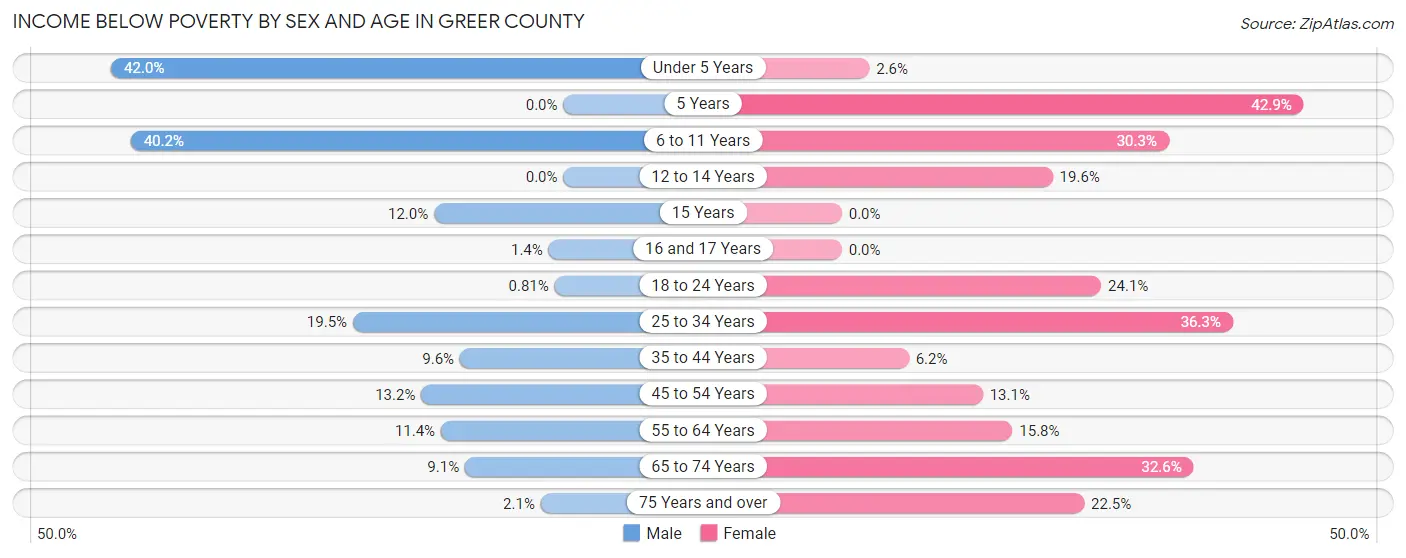
| Age Bracket | Male | Female |
| Under 5 Years | 55 (42.0%) | 4 (2.5%) |
| 5 Years | 0 (0.0%) | 9 (42.9%) |
| 6 to 11 Years | 55 (40.2%) | 54 (30.3%) |
| 12 to 14 Years | 0 (0.0%) | 18 (19.6%) |
| 15 Years | 3 (12.0%) | 0 (0.0%) |
| 16 and 17 Years | 1 (1.4%) | 0 (0.0%) |
| 18 to 24 Years | 1 (0.8%) | 52 (24.1%) |
| 25 to 34 Years | 58 (19.5%) | 82 (36.3%) |
| 35 to 44 Years | 29 (9.6%) | 18 (6.2%) |
| 45 to 54 Years | 36 (13.2%) | 31 (13.1%) |
| 55 to 64 Years | 30 (11.4%) | 57 (15.8%) |
| 65 to 74 Years | 20 (9.1%) | 78 (32.6%) |
| 75 Years and over | 3 (2.1%) | 56 (22.5%) |
| Total | 291 (13.4%) | 459 (19.5%) |
Income Above Poverty by Sex and Age in Greer County
According to the poverty statistics in Greer County, males aged 5 years and females aged 15 years are the age groups that are most secure financially, with 100.0% of males and 100.0% of females in these age groups living above the poverty line.
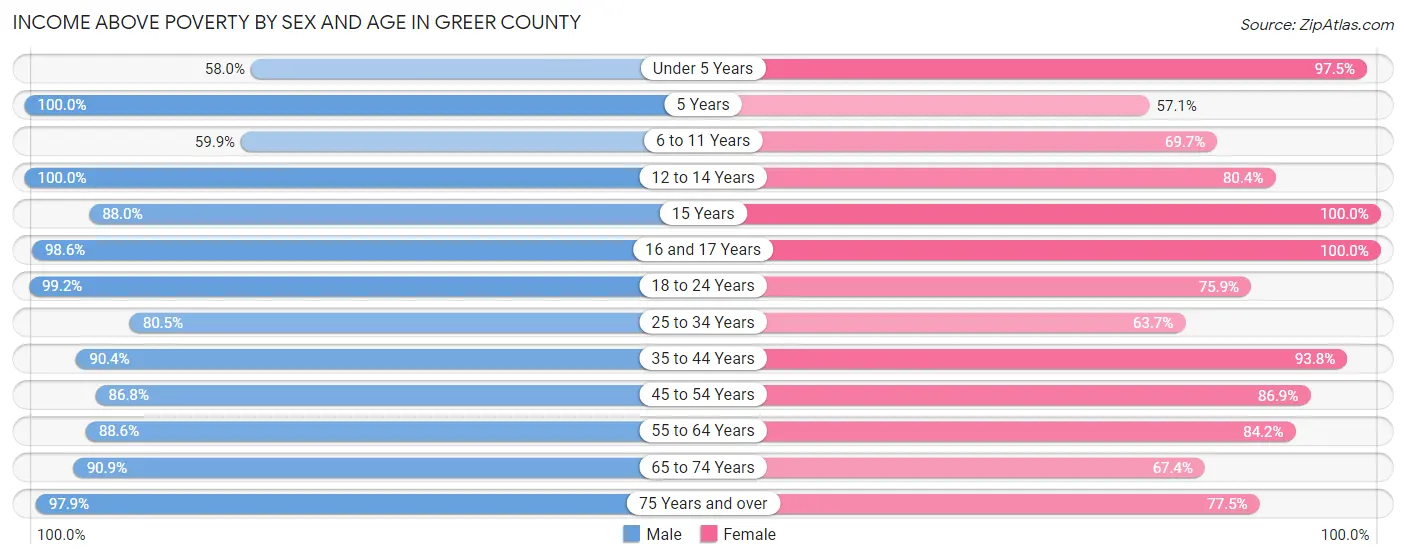
| Age Bracket | Male | Female |
| Under 5 Years | 76 (58.0%) | 153 (97.5%) |
| 5 Years | 82 (100.0%) | 12 (57.1%) |
| 6 to 11 Years | 82 (59.9%) | 124 (69.7%) |
| 12 to 14 Years | 101 (100.0%) | 74 (80.4%) |
| 15 Years | 22 (88.0%) | 32 (100.0%) |
| 16 and 17 Years | 72 (98.6%) | 58 (100.0%) |
| 18 to 24 Years | 123 (99.2%) | 164 (75.9%) |
| 25 to 34 Years | 239 (80.5%) | 144 (63.7%) |
| 35 to 44 Years | 273 (90.4%) | 272 (93.8%) |
| 45 to 54 Years | 237 (86.8%) | 206 (86.9%) |
| 55 to 64 Years | 234 (88.6%) | 303 (84.2%) |
| 65 to 74 Years | 199 (90.9%) | 161 (67.4%) |
| 75 Years and over | 140 (97.9%) | 193 (77.5%) |
| Total | 1,880 (86.6%) | 1,896 (80.5%) |
Income Below Poverty Among Married-Couple Families in Greer County
The poverty statistics for married-couple families in Greer County show that 4.5% or 41 of the total 908 families live below the poverty line. Families with no children have the highest poverty rate of 7.5%, comprising of 31 families. On the other hand, families with 1 or 2 children have the lowest poverty rate of 0.6%, which includes 2 families.
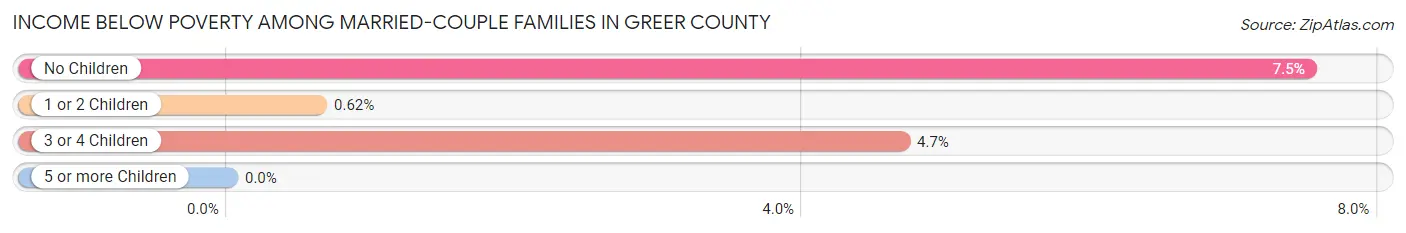
| Children | Above Poverty | Below Poverty |
| No Children | 382 (92.5%) | 31 (7.5%) |
| 1 or 2 Children | 322 (99.4%) | 2 (0.6%) |
| 3 or 4 Children | 163 (95.3%) | 8 (4.7%) |
| 5 or more Children | 0 (0.0%) | 0 (0.0%) |
| Total | 867 (95.5%) | 41 (4.5%) |
Income Below Poverty Among Single-Parent Households in Greer County
According to the poverty data in Greer County, 17.9% or 12 single-father households and 41.9% or 104 single-mother households are living below the poverty line. Among single-father households, those with 3 or 4 children have the highest poverty rate, with 5 households (100.0%) experiencing poverty. Likewise, among single-mother households, those with 3 or 4 children have the highest poverty rate, with 31 households (100.0%) falling below the poverty line.
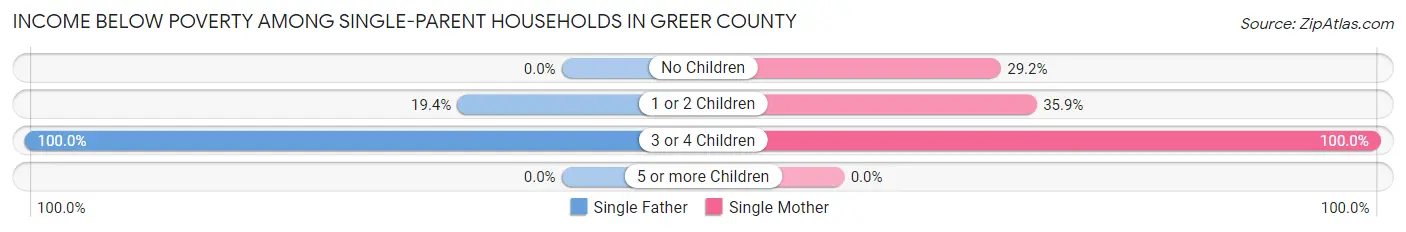
| Children | Single Father | Single Mother |
| No Children | 0 (0.0%) | 21 (29.2%) |
| 1 or 2 Children | 7 (19.4%) | 52 (35.9%) |
| 3 or 4 Children | 5 (100.0%) | 31 (100.0%) |
| 5 or more Children | 0 (0.0%) | 0 (0.0%) |
| Total | 12 (17.9%) | 104 (41.9%) |
Income Below Poverty Among Married-Couple vs Single-Parent Households in Greer County
The poverty data for Greer County shows that 41 of the married-couple family households (4.5%) and 116 of the single-parent households (36.8%) are living below the poverty level. Within the married-couple family households, those with no children have the highest poverty rate, with 31 households (7.5%) falling below the poverty line. Among the single-parent households, those with 3 or 4 children have the highest poverty rate, with 36 household (100.0%) living below poverty.
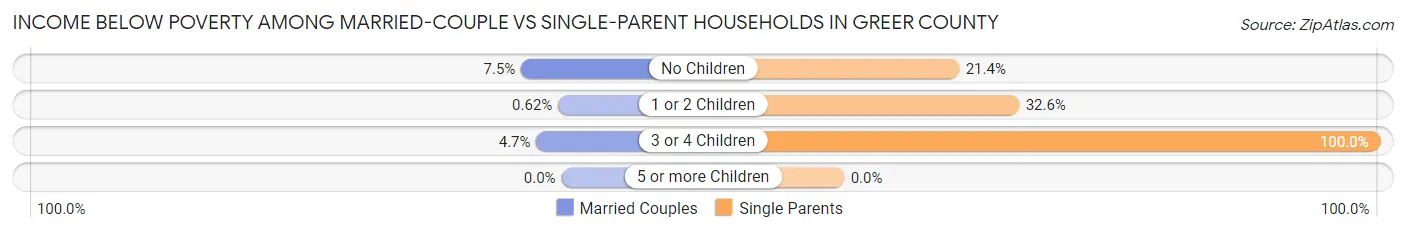
| Children | Married-Couple Families | Single-Parent Households |
| No Children | 31 (7.5%) | 21 (21.4%) |
| 1 or 2 Children | 2 (0.6%) | 59 (32.6%) |
| 3 or 4 Children | 8 (4.7%) | 36 (100.0%) |
| 5 or more Children | 0 (0.0%) | 0 (0.0%) |
| Total | 41 (4.5%) | 116 (36.8%) |
Race in Greer County
The most populous races in Greer County are White / Caucasian (4,498 | 81.3%), Hispanic or Latino (701 | 12.7%), and Two or more Races (462 | 8.4%).
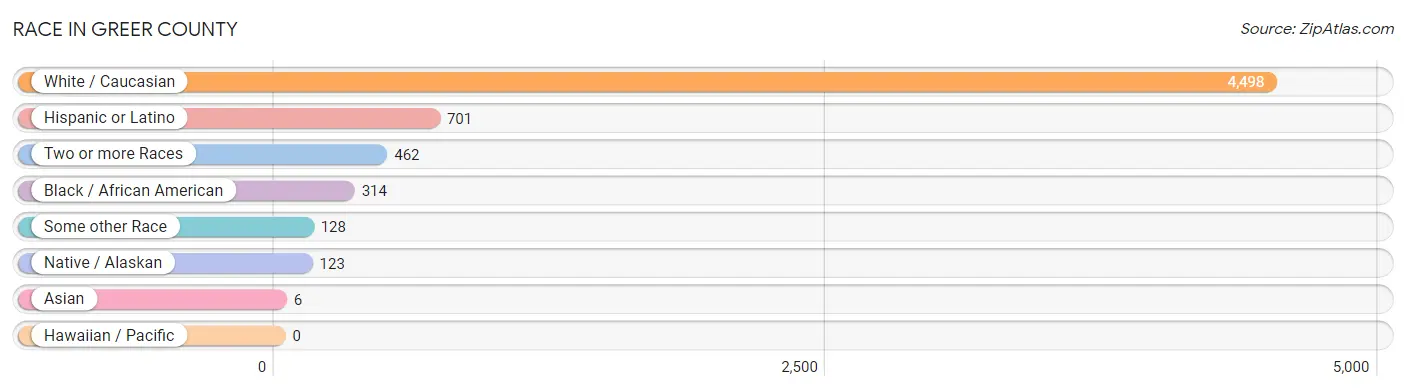
| Race | # Population | % Population |
| Asian | 6 | 0.1% |
| Black / African American | 314 | 5.7% |
| Hawaiian / Pacific | 0 | 0.0% |
| Hispanic or Latino | 701 | 12.7% |
| Native / Alaskan | 123 | 2.2% |
| White / Caucasian | 4,498 | 81.3% |
| Two or more Races | 462 | 8.4% |
| Some other Race | 128 | 2.3% |
| Total | 5,531 | 100.0% |
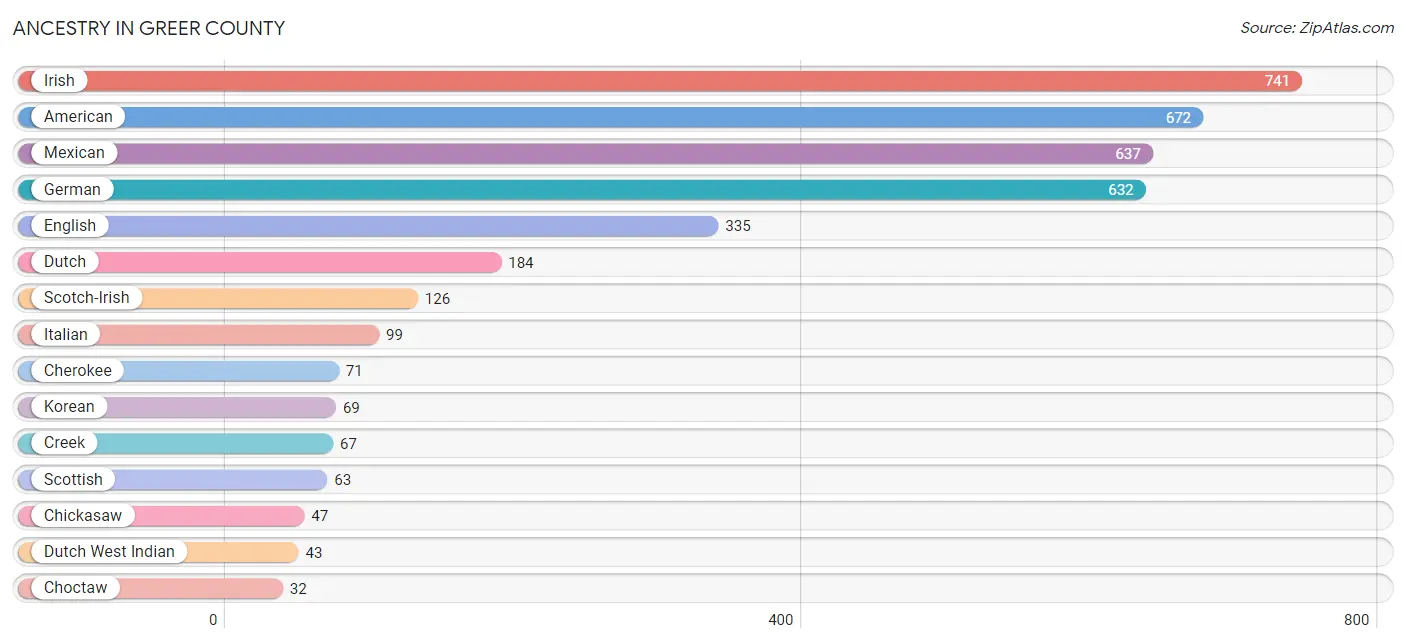
Ancestry in Greer County
The most populous ancestries reported in Greer County are Irish (741 | 13.4%), American (672 | 12.1%), Mexican (637 | 11.5%), German (632 | 11.4%), and English (335 | 6.1%), together accounting for 54.6% of all Greer County residents.
| Ancestry | # Population | % Population |
| African | 4 | 0.1% |
| Aleut | 7 | 0.1% |
| American | 672 | 12.1% |
| Apache | 13 | 0.2% |
| Arab | 4 | 0.1% |
| Austrian | 5 | 0.1% |
| British | 1 | 0.0% |
| Cherokee | 71 | 1.3% |
| Chickasaw | 47 | 0.9% |
| Choctaw | 32 | 0.6% |
| Comanche | 10 | 0.2% |
| Creek | 67 | 1.2% |
| Crow | 30 | 0.5% |
| Danish | 4 | 0.1% |
| Delaware | 8 | 0.1% |
| Dutch | 184 | 3.3% |
| Dutch West Indian | 43 | 0.8% |
| Eastern European | 6 | 0.1% |
| Egyptian | 4 | 0.1% |
| English | 335 | 6.1% |
| European | 28 | 0.5% |
| French | 29 | 0.5% |
| French Canadian | 5 | 0.1% |
| German | 632 | 11.4% |
| Guamanian / Chamorro | 9 | 0.2% |
| Indian (Asian) | 14 | 0.3% |
| Irish | 741 | 13.4% |
| Italian | 99 | 1.8% |
| Kiowa | 4 | 0.1% |
| Korean | 69 | 1.3% |
| Mexican | 637 | 11.5% |
| Mexican American Indian | 3 | 0.1% |
| Norwegian | 25 | 0.4% |
| Osage | 2 | 0.0% |
| Puerto Rican | 9 | 0.2% |
| Scotch-Irish | 126 | 2.3% |
| Scottish | 63 | 1.1% |
| Spaniard | 16 | 0.3% |
| Spanish | 12 | 0.2% |
| Subsaharan African | 4 | 0.1% |
| Swedish | 4 | 0.1% |
| Swiss | 12 | 0.2% |
| Welsh | 5 | 0.1% |
| Yuman | 2 | 0.0% | View All 44 Rows |
Immigrants in Greer County
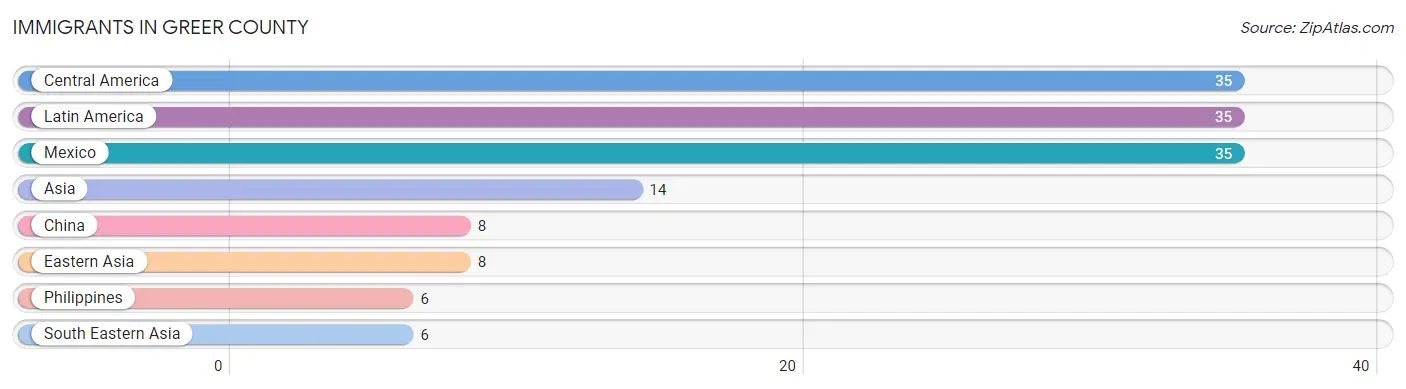
The most numerous immigrant groups reported in Greer County came from Central America (35 | 0.6%), Latin America (35 | 0.6%), Mexico (35 | 0.6%), Asia (14 | 0.3%), and China (8 | 0.1%), together accounting for 2.3% of all Greer County residents.
| Immigration Origin | # Population | % Population |
| Asia | 14 | 0.3% |
| Central America | 35 | 0.6% |
| China | 8 | 0.1% |
| Eastern Asia | 8 | 0.1% |
| Latin America | 35 | 0.6% |
| Mexico | 35 | 0.6% |
| Philippines | 6 | 0.1% |
| South Eastern Asia | 6 | 0.1% | View All 8 Rows |
Sex and Age in Greer County
Sex and Age in Greer County
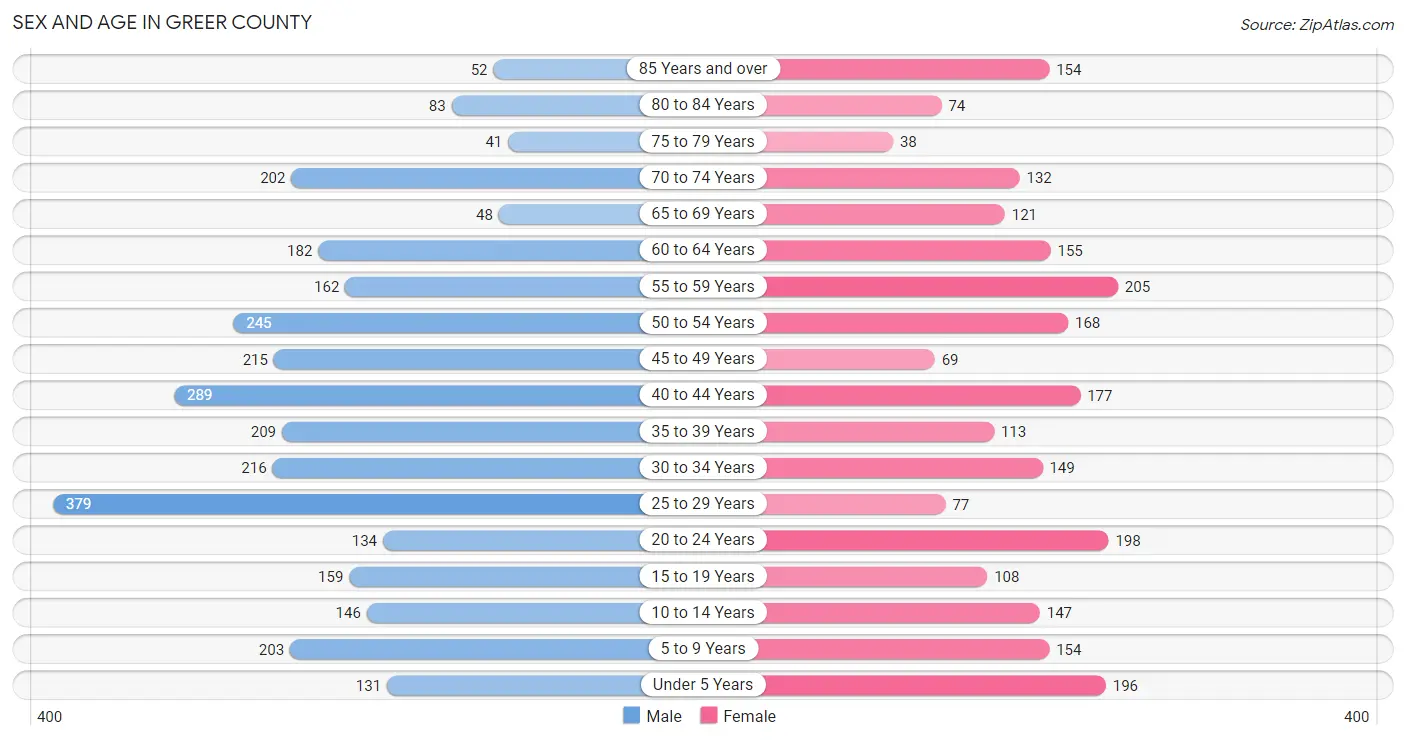
The most populous age groups in Greer County are 25 to 29 Years (379 | 12.2%) for men and 55 to 59 Years (205 | 8.4%) for women.
| Age Bracket | Male | Female |
| Under 5 Years | 131 (4.2%) | 196 (8.1%) |
| 5 to 9 Years | 203 (6.6%) | 154 (6.3%) |
| 10 to 14 Years | 146 (4.7%) | 147 (6.0%) |
| 15 to 19 Years | 159 (5.1%) | 108 (4.4%) |
| 20 to 24 Years | 134 (4.3%) | 198 (8.1%) |
| 25 to 29 Years | 379 (12.2%) | 77 (3.2%) |
| 30 to 34 Years | 216 (7.0%) | 149 (6.1%) |
| 35 to 39 Years | 209 (6.8%) | 113 (4.6%) |
| 40 to 44 Years | 289 (9.3%) | 177 (7.3%) |
| 45 to 49 Years | 215 (6.9%) | 69 (2.8%) |
| 50 to 54 Years | 245 (7.9%) | 168 (6.9%) |
| 55 to 59 Years | 162 (5.2%) | 205 (8.4%) |
| 60 to 64 Years | 182 (5.9%) | 155 (6.4%) |
| 65 to 69 Years | 48 (1.5%) | 121 (5.0%) |
| 70 to 74 Years | 202 (6.5%) | 132 (5.4%) |
| 75 to 79 Years | 41 (1.3%) | 38 (1.6%) |
| 80 to 84 Years | 83 (2.7%) | 74 (3.0%) |
| 85 Years and over | 52 (1.7%) | 154 (6.3%) |
| Total | 3,096 (100.0%) | 2,435 (100.0%) |
Families and Households in Greer County
Median Family Size in Greer County
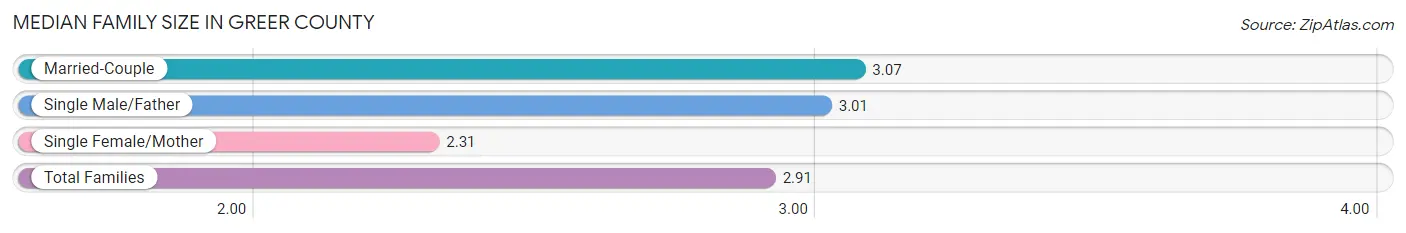
The median family size in Greer County is 2.91 persons per family, with married-couple families (908 | 74.2%) accounting for the largest median family size of 3.07 persons per family. On the other hand, single female/mother families (248 | 20.3%) represent the smallest median family size with 2.31 persons per family.
| Family Type | # Families | Family Size |
| Married-Couple | 908 (74.2%) | 3.07 |
| Single Male/Father | 67 (5.5%) | 3.01 |
| Single Female/Mother | 248 (20.3%) | 2.31 |
| Total Families | 1,223 (100.0%) | 2.91 |
Median Household Size in Greer County
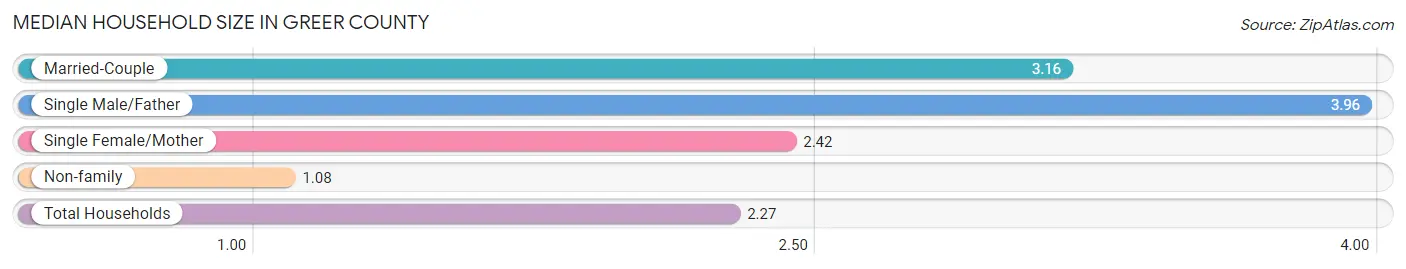
The median household size in Greer County is 2.27 persons per household, with single male/father households (67 | 3.3%) accounting for the largest median household size of 3.96 persons per household. non-family households (801 | 39.6%) represent the smallest median household size with 1.08 persons per household.
| Household Type | # Households | Household Size |
| Married-Couple | 908 (44.9%) | 3.16 |
| Single Male/Father | 67 (3.3%) | 3.96 |
| Single Female/Mother | 248 (12.2%) | 2.42 |
| Non-family | 801 (39.6%) | 1.08 |
| Total Households | 2,024 (100.0%) | 2.27 |
Household Size by Marriage Status in Greer County
Out of a total of 2,024 households in Greer County, 1,223 (60.4%) are family households, while 801 (39.6%) are nonfamily households. The most numerous type of family households are 2-person households, comprising 475, and the most common type of nonfamily households are 1-person households, comprising 750.
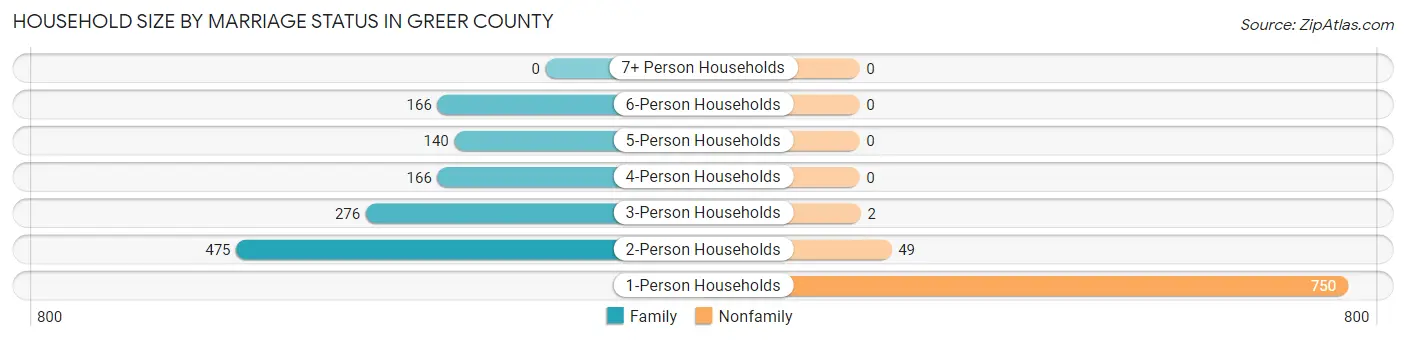
| Household Size | Family Households | Nonfamily Households |
| 1-Person Households | - | 750 (37.1%) |
| 2-Person Households | 475 (23.5%) | 49 (2.4%) |
| 3-Person Households | 276 (13.6%) | 2 (0.1%) |
| 4-Person Households | 166 (8.2%) | 0 (0.0%) |
| 5-Person Households | 140 (6.9%) | 0 (0.0%) |
| 6-Person Households | 166 (8.2%) | 0 (0.0%) |
| 7+ Person Households | 0 (0.0%) | 0 (0.0%) |
| Total | 1,223 (60.4%) | 801 (39.6%) |
Female Fertility in Greer County
Fertility by Age in Greer County
Average fertility rate in Greer County is 169.0 births per 1,000 women. Women in the age bracket of 20 to 34 years have the highest fertility rate with 377.0 births per 1,000 women. Women in the age bracket of 20 to 34 years acount for 100.0% of all women with births.
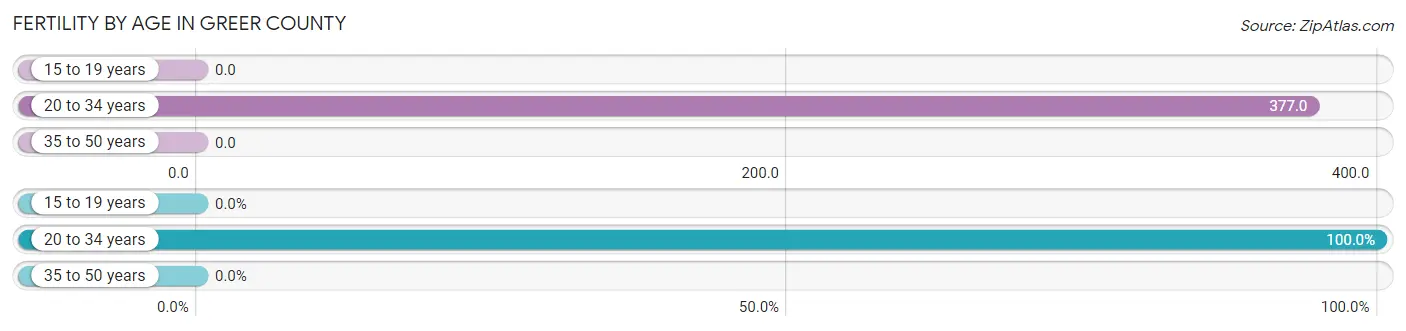
| Age Bracket | Women with Births | Births / 1,000 Women |
| 15 to 19 years | 0 (0.0%) | 0.0 |
| 20 to 34 years | 160 (100.0%) | 377.0 |
| 35 to 50 years | 0 (0.0%) | 0.0 |
| Total | 160 (100.0%) | 169.0 |
Fertility by Age by Marriage Status in Greer County
76.2% of women with births (160) in Greer County are married. The highest percentage of unmarried women with births falls into 20 to 34 years age bracket with 23.7% of them unmarried at the time of birth, while the lowest percentage of unmarried women with births belong to 20 to 34 years age bracket with 23.8% of them unmarried.
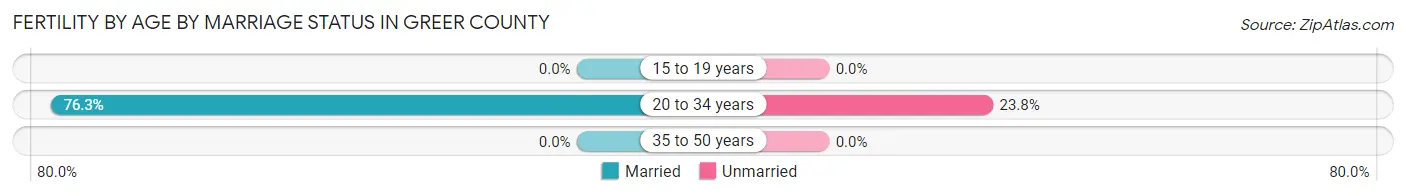
| Age Bracket | Married | Unmarried |
| 15 to 19 years | 0 (0.0%) | 0 (0.0%) |
| 20 to 34 years | 122 (76.2%) | 38 (23.7%) |
| 35 to 50 years | 0 (0.0%) | 0 (0.0%) |
| Total | 122 (76.2%) | 38 (23.7%) |
Fertility by Education in Greer County
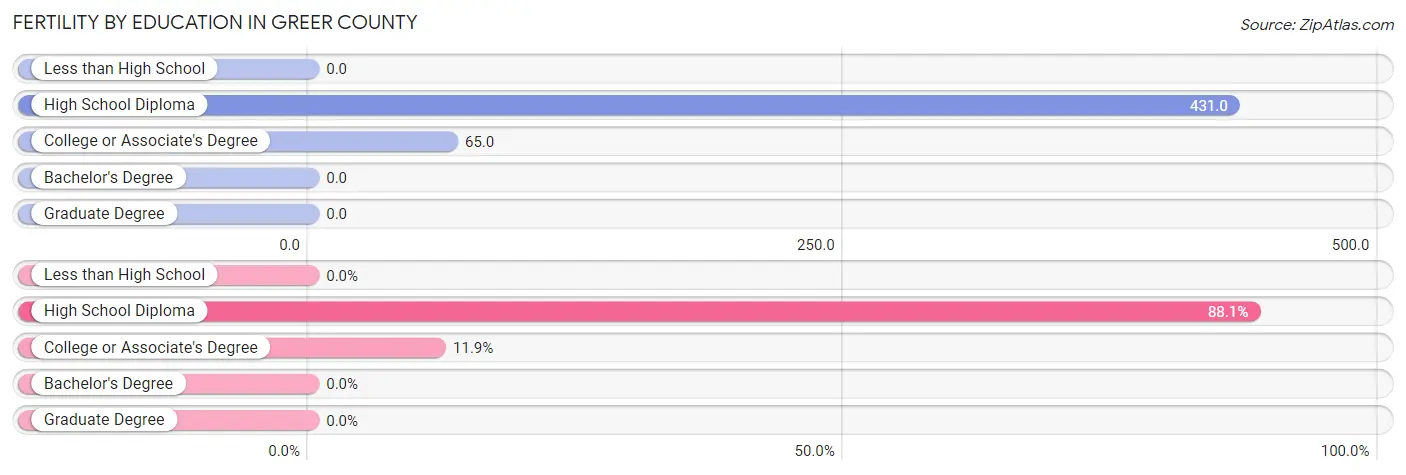
| Educational Attainment | Women with Births | Births / 1,000 Women |
| Less than High School | 0 (0.0%) | 0.0 |
| High School Diploma | 141 (88.1%) | 431.0 |
| College or Associate's Degree | 19 (11.9%) | 65.0 |
| Bachelor's Degree | 0 (0.0%) | 0.0 |
| Graduate Degree | 0 (0.0%) | 0.0 |
| Total | 160 (100.0%) | 169.0 |
Fertility by Education by Marriage Status in Greer County
23.7% of women with births in Greer County are unmarried. Women with the educational attainment of college or associate's degree are most likely to be married with 100.0% of them married at childbirth, while women with the educational attainment of high school diploma are least likely to be married with 27.0% of them unmarried at childbirth.
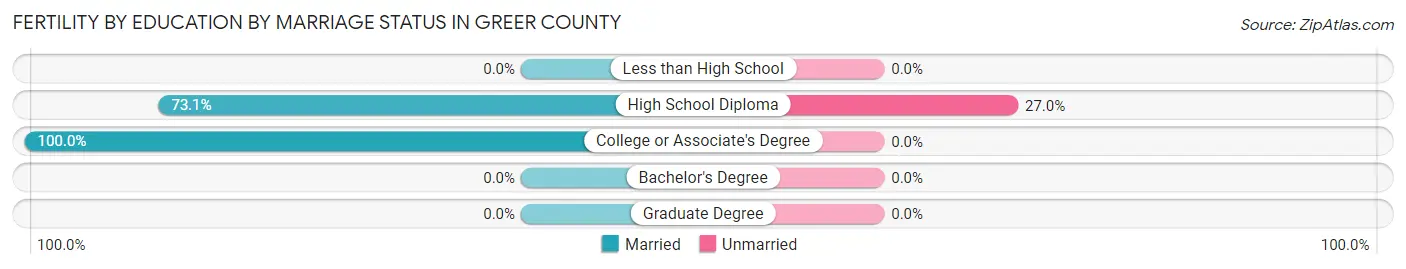
| Educational Attainment | Married | Unmarried |
| Less than High School | 0 (0.0%) | 0 (0.0%) |
| High School Diploma | 103 (73.1%) | 38 (27.0%) |
| College or Associate's Degree | 19 (100.0%) | 0 (0.0%) |
| Bachelor's Degree | 0 (0.0%) | 0 (0.0%) |
| Graduate Degree | 0 (0.0%) | 0 (0.0%) |
| Total | 122 (76.2%) | 38 (23.7%) |
Employment Characteristics in Greer County
Employment by Class of Employer in Greer County
Among the 1,926 employed individuals in Greer County, private company employees (1,036 | 53.8%), self-employed (not incorporated) (261 | 13.6%), and state government employees (195 | 10.1%) make up the most common classes of employment.
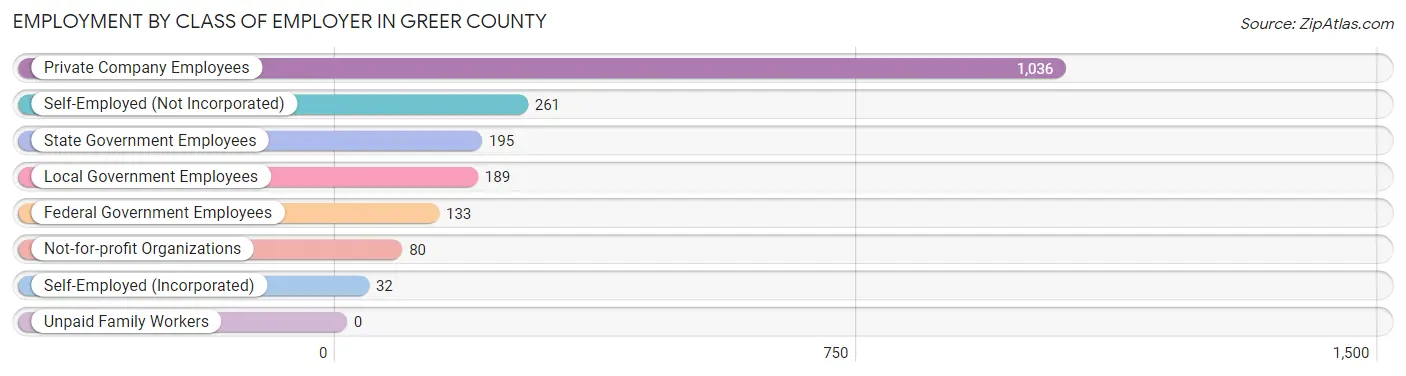
| Employer Class | # Employees | % Employees |
| Private Company Employees | 1,036 | 53.8% |
| Self-Employed (Incorporated) | 32 | 1.7% |
| Self-Employed (Not Incorporated) | 261 | 13.6% |
| Not-for-profit Organizations | 80 | 4.2% |
| Local Government Employees | 189 | 9.8% |
| State Government Employees | 195 | 10.1% |
| Federal Government Employees | 133 | 6.9% |
| Unpaid Family Workers | 0 | 0.0% |
| Total | 1,926 | 100.0% |
Employment Status by Age in Greer County
According to the labor force statistics for Greer County, out of the total population over 16 years of age (4,497), 45.9% or 2,064 individuals are in the labor force, with 5.8% or 120 of them unemployed. The age group with the highest labor force participation rate is 55 to 59 years, with 68.7% or 252 individuals in the labor force. Within the labor force, the 30 to 34 years age range has the highest percentage of unemployed individuals, with 25.3% or 56 of them being unemployed.
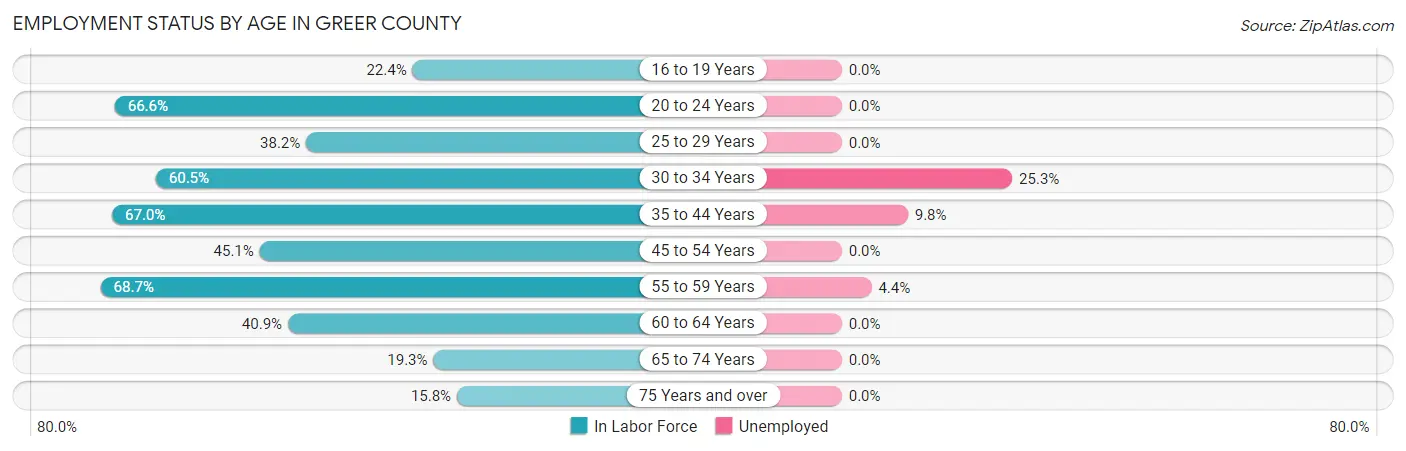
| Age Bracket | In Labor Force | Unemployed |
| 16 to 19 Years | 47 (22.4%) | 0 (0.0%) |
| 20 to 24 Years | 221 (66.6%) | 0 (0.0%) |
| 25 to 29 Years | 174 (38.2%) | 0 (0.0%) |
| 30 to 34 Years | 221 (60.5%) | 56 (25.3%) |
| 35 to 44 Years | 528 (67.0%) | 52 (9.8%) |
| 45 to 54 Years | 314 (45.1%) | 0 (0.0%) |
| 55 to 59 Years | 252 (68.7%) | 11 (4.4%) |
| 60 to 64 Years | 138 (40.9%) | 0 (0.0%) |
| 65 to 74 Years | 97 (19.3%) | 0 (0.0%) |
| 75 Years and over | 70 (15.8%) | 0 (0.0%) |
| Total | 2,064 (45.9%) | 120 (5.8%) |
Employment Status by Educational Attainment in Greer County
According to labor force statistics for Greer County, 54.1% of individuals (1,628) out of the total population between 25 and 64 years of age (3,010) are in the labor force, with 7.4% or 120 of them being unemployed. The group with the highest labor force participation rate are those with the educational attainment of bachelor's degree or higher, with 77.7% or 234 individuals in the labor force. Within the labor force, individuals with high school diploma education have the highest percentage of unemployment, with 9.3% or 56 of them being unemployed.
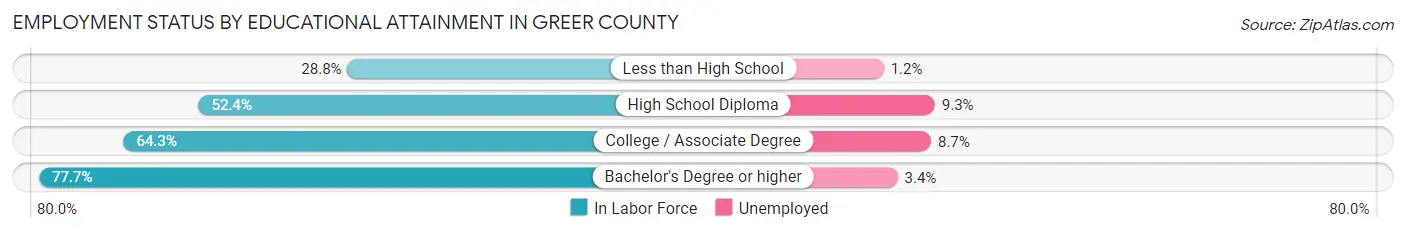
| Educational Attainment | In Labor Force | Unemployed |
| Less than High School | 172 (28.8%) | 7 (1.2%) |
| High School Diploma | 603 (52.4%) | 107 (9.3%) |
| College / Associate Degree | 618 (64.3%) | 84 (8.7%) |
| Bachelor's Degree or higher | 234 (77.7%) | 10 (3.4%) |
| Total | 1,628 (54.1%) | 223 (7.4%) |
Employment Occupations by Sex in Greer County
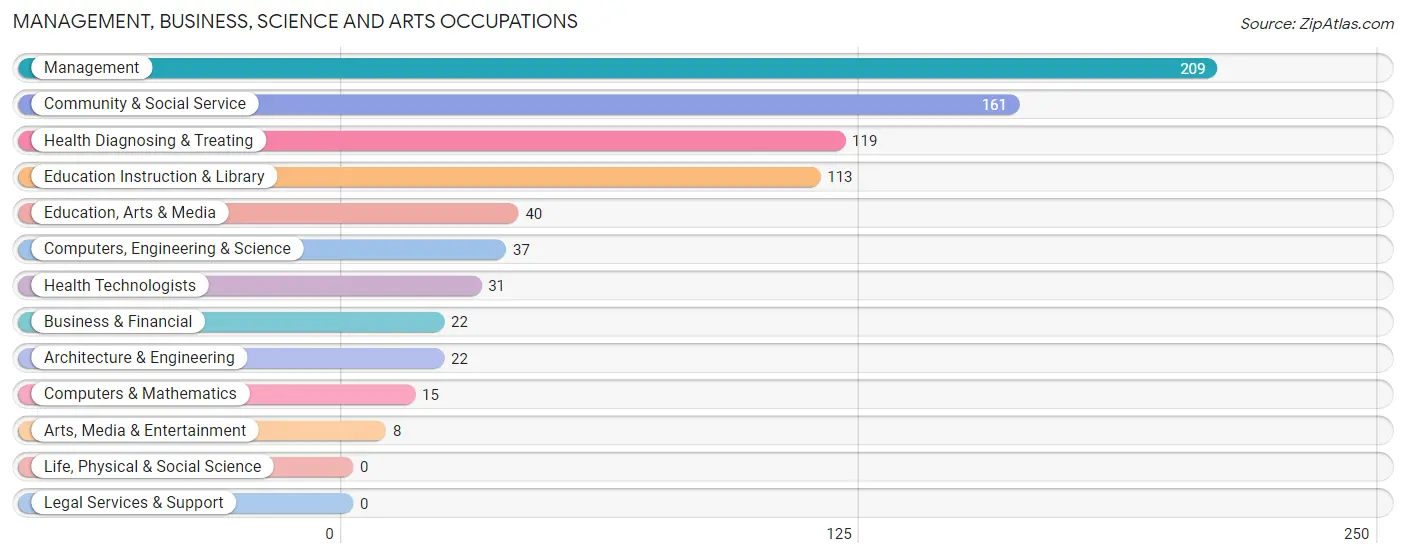
Management, Business, Science and Arts Occupations
The most common Management, Business, Science and Arts occupations in Greer County are Management (209 | 10.8%), Community & Social Service (161 | 8.3%), Health Diagnosing & Treating (119 | 6.1%), Education Instruction & Library (113 | 5.8%), and Education, Arts & Media (40 | 2.1%).
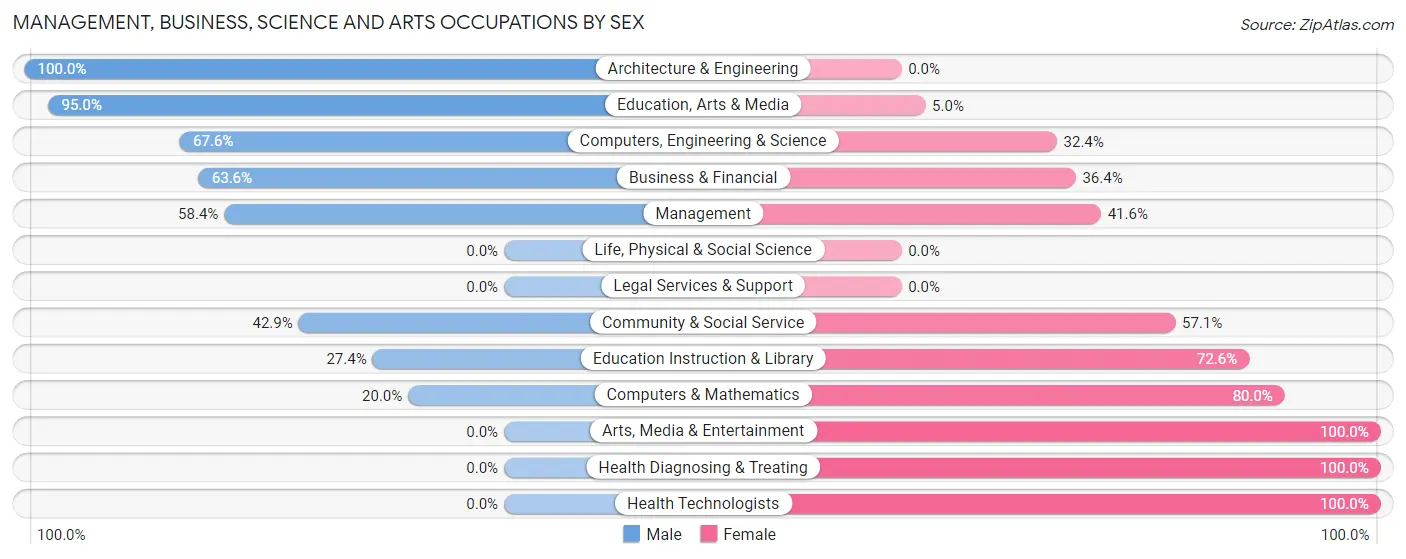
Management, Business, Science and Arts Occupations by Sex
Within the Management, Business, Science and Arts occupations in Greer County, the most male-oriented occupations are Architecture & Engineering (100.0%), Education, Arts & Media (95.0%), and Computers, Engineering & Science (67.6%), while the most female-oriented occupations are Arts, Media & Entertainment (100.0%), Health Diagnosing & Treating (100.0%), and Health Technologists (100.0%).
| Occupation | Male | Female |
| Management | 122 (58.4%) | 87 (41.6%) |
| Business & Financial | 14 (63.6%) | 8 (36.4%) |
| Computers, Engineering & Science | 25 (67.6%) | 12 (32.4%) |
| Computers & Mathematics | 3 (20.0%) | 12 (80.0%) |
| Architecture & Engineering | 22 (100.0%) | 0 (0.0%) |
| Life, Physical & Social Science | 0 (0.0%) | 0 (0.0%) |
| Community & Social Service | 69 (42.9%) | 92 (57.1%) |
| Education, Arts & Media | 38 (95.0%) | 2 (5.0%) |
| Legal Services & Support | 0 (0.0%) | 0 (0.0%) |
| Education Instruction & Library | 31 (27.4%) | 82 (72.6%) |
| Arts, Media & Entertainment | 0 (0.0%) | 8 (100.0%) |
| Health Diagnosing & Treating | 0 (0.0%) | 119 (100.0%) |
| Health Technologists | 0 (0.0%) | 31 (100.0%) |
| Total (Category) | 230 (42.0%) | 318 (58.0%) |
| Total (Overall) | 987 (51.0%) | 948 (49.0%) |
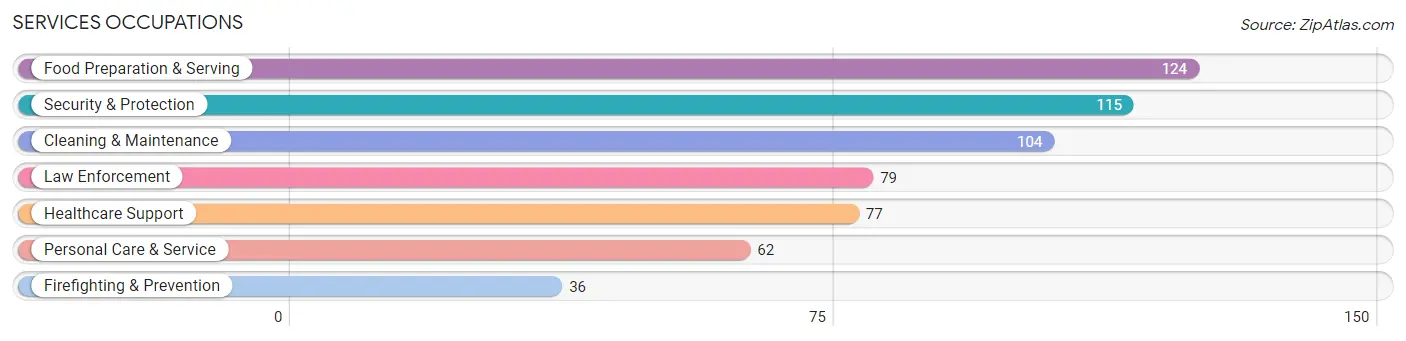
Services Occupations
The most common Services occupations in Greer County are Food Preparation & Serving (124 | 6.4%), Security & Protection (115 | 5.9%), Cleaning & Maintenance (104 | 5.4%), Law Enforcement (79 | 4.1%), and Healthcare Support (77 | 4.0%).
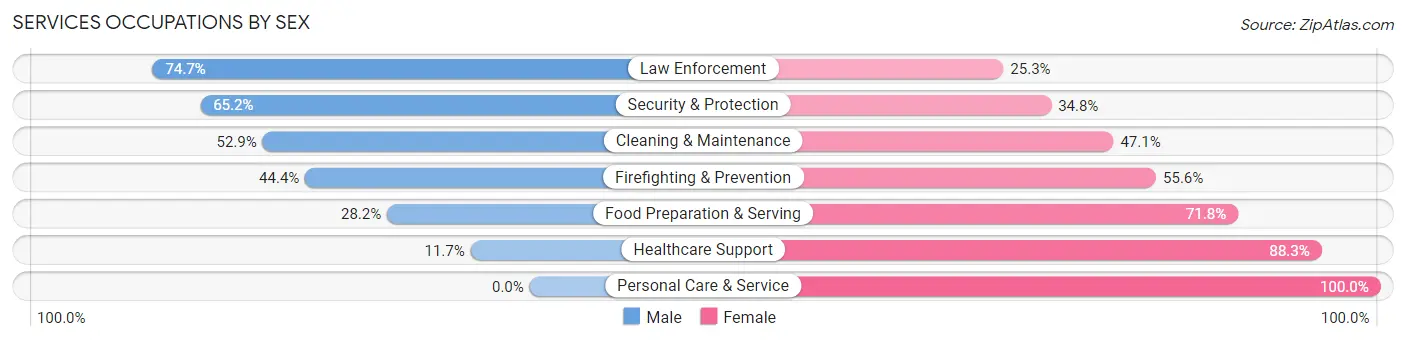
Services Occupations by Sex
Within the Services occupations in Greer County, the most male-oriented occupations are Law Enforcement (74.7%), Security & Protection (65.2%), and Cleaning & Maintenance (52.9%), while the most female-oriented occupations are Personal Care & Service (100.0%), Healthcare Support (88.3%), and Food Preparation & Serving (71.8%).
| Occupation | Male | Female |
| Healthcare Support | 9 (11.7%) | 68 (88.3%) |
| Security & Protection | 75 (65.2%) | 40 (34.8%) |
| Firefighting & Prevention | 16 (44.4%) | 20 (55.6%) |
| Law Enforcement | 59 (74.7%) | 20 (25.3%) |
| Food Preparation & Serving | 35 (28.2%) | 89 (71.8%) |
| Cleaning & Maintenance | 55 (52.9%) | 49 (47.1%) |
| Personal Care & Service | 0 (0.0%) | 62 (100.0%) |
| Total (Category) | 174 (36.1%) | 308 (63.9%) |
| Total (Overall) | 987 (51.0%) | 948 (49.0%) |
Sales and Office Occupations
The most common Sales and Office occupations in Greer County are Sales & Related (225 | 11.6%), and Office & Administration (220 | 11.4%).

Sales and Office Occupations by Sex

| Occupation | Male | Female |
| Sales & Related | 140 (62.2%) | 85 (37.8%) |
| Office & Administration | 34 (15.4%) | 186 (84.6%) |
| Total (Category) | 174 (39.1%) | 271 (60.9%) |
| Total (Overall) | 987 (51.0%) | 948 (49.0%) |
Natural Resources, Construction and Maintenance Occupations
The most common Natural Resources, Construction and Maintenance occupations in Greer County are Construction & Extraction (86 | 4.4%), Installation, Maintenance & Repair (56 | 2.9%), and Farming, Fishing & Forestry (43 | 2.2%).

Natural Resources, Construction and Maintenance Occupations by Sex
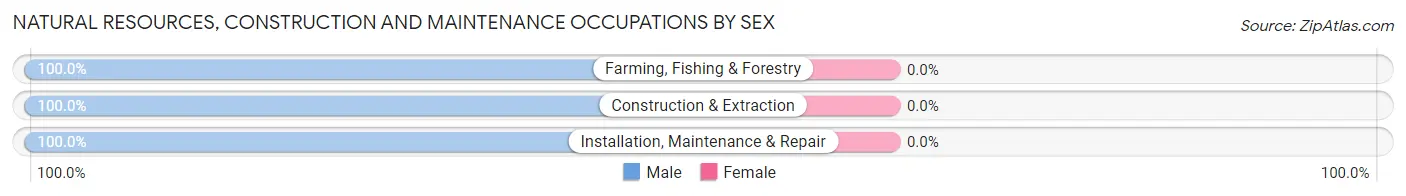
| Occupation | Male | Female |
| Farming, Fishing & Forestry | 43 (100.0%) | 0 (0.0%) |
| Construction & Extraction | 86 (100.0%) | 0 (0.0%) |
| Installation, Maintenance & Repair | 56 (100.0%) | 0 (0.0%) |
| Total (Category) | 185 (100.0%) | 0 (0.0%) |
| Total (Overall) | 987 (51.0%) | 948 (49.0%) |
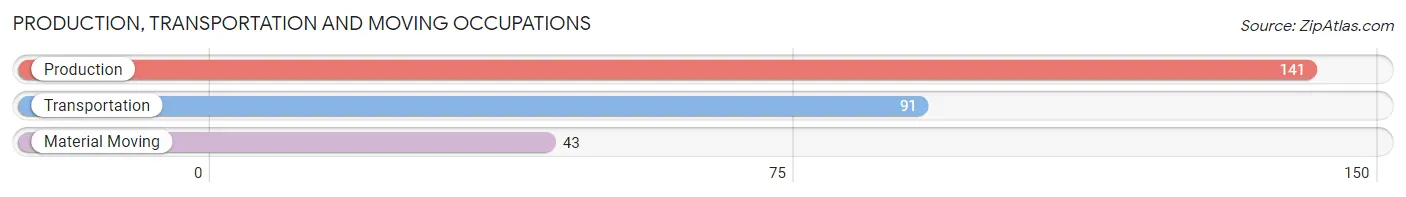
Production, Transportation and Moving Occupations
The most common Production, Transportation and Moving occupations in Greer County are Production (141 | 7.3%), Transportation (91 | 4.7%), and Material Moving (43 | 2.2%).
Production, Transportation and Moving Occupations by Sex
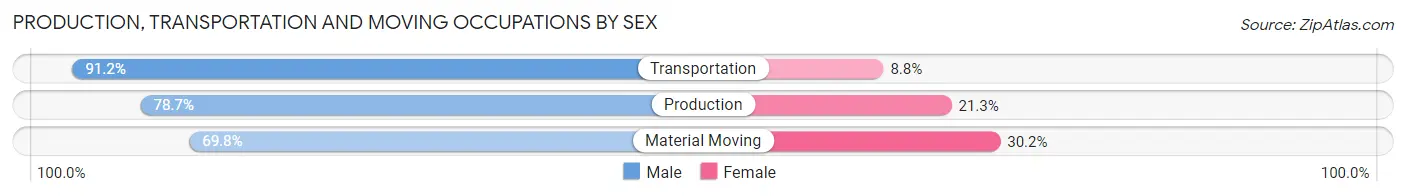
| Occupation | Male | Female |
| Production | 111 (78.7%) | 30 (21.3%) |
| Transportation | 83 (91.2%) | 8 (8.8%) |
| Material Moving | 30 (69.8%) | 13 (30.2%) |
| Total (Category) | 224 (81.5%) | 51 (18.5%) |
| Total (Overall) | 987 (51.0%) | 948 (49.0%) |
Employment Industries by Sex in Greer County
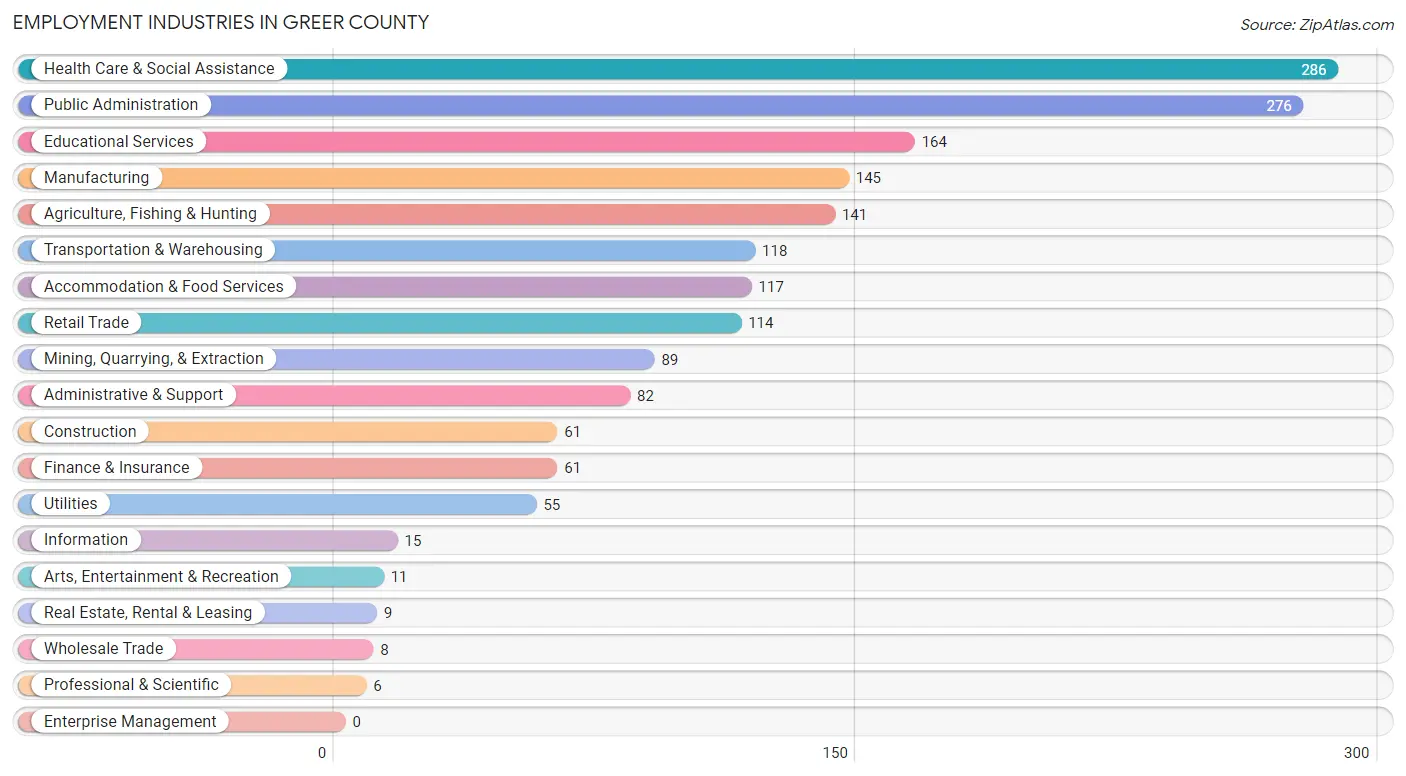
Employment Industries in Greer County
The major employment industries in Greer County include Health Care & Social Assistance (286 | 14.8%), Public Administration (276 | 14.3%), Educational Services (164 | 8.5%), Manufacturing (145 | 7.5%), and Agriculture, Fishing & Hunting (141 | 7.3%).
Employment Industries by Sex in Greer County
The Greer County industries that see more men than women are Construction (100.0%), Wholesale Trade (100.0%), and Utilities (100.0%), whereas the industries that tend to have a higher number of women are Information (100.0%), Health Care & Social Assistance (95.5%), and Retail Trade (89.5%).
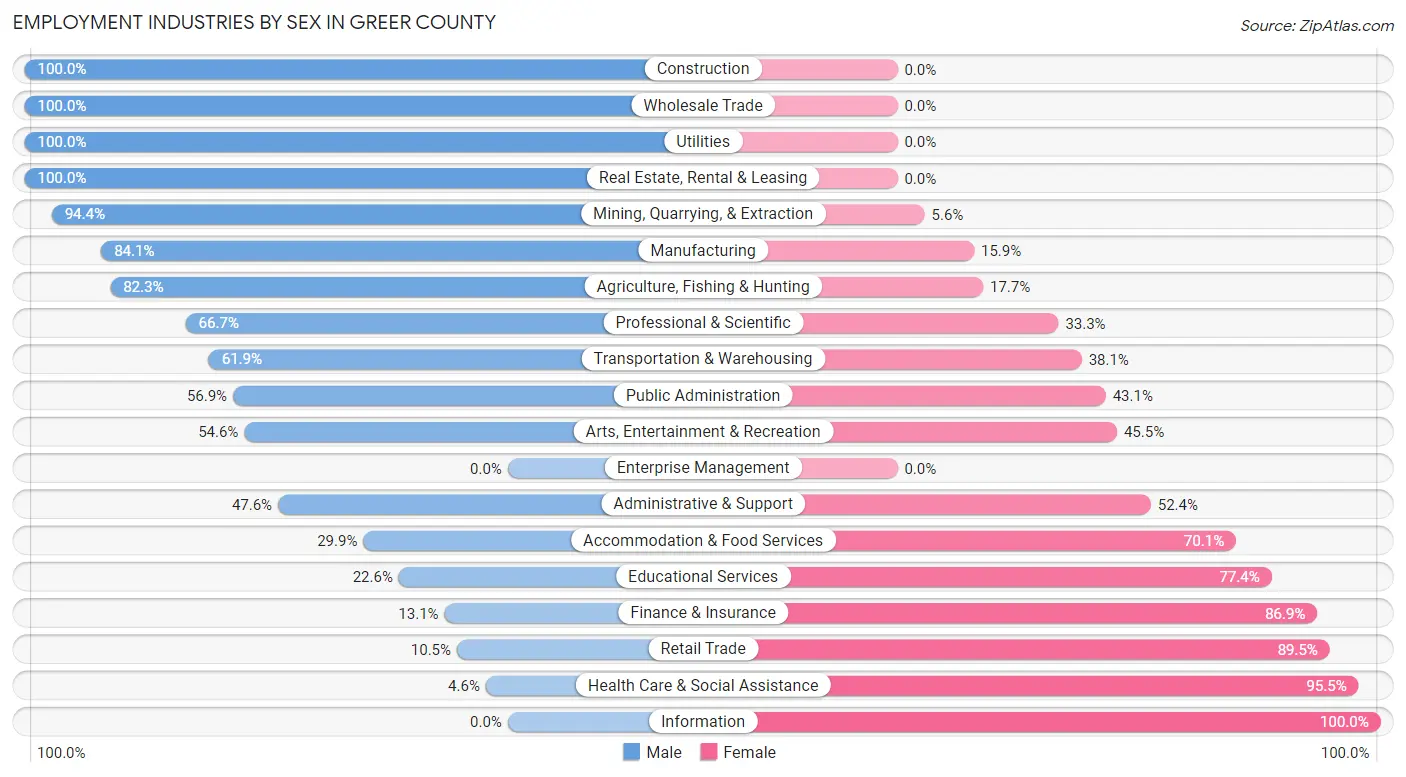
| Industry | Male | Female |
| Agriculture, Fishing & Hunting | 116 (82.3%) | 25 (17.7%) |
| Mining, Quarrying, & Extraction | 84 (94.4%) | 5 (5.6%) |
| Construction | 61 (100.0%) | 0 (0.0%) |
| Manufacturing | 122 (84.1%) | 23 (15.9%) |
| Wholesale Trade | 8 (100.0%) | 0 (0.0%) |
| Retail Trade | 12 (10.5%) | 102 (89.5%) |
| Transportation & Warehousing | 73 (61.9%) | 45 (38.1%) |
| Utilities | 55 (100.0%) | 0 (0.0%) |
| Information | 0 (0.0%) | 15 (100.0%) |
| Finance & Insurance | 8 (13.1%) | 53 (86.9%) |
| Real Estate, Rental & Leasing | 9 (100.0%) | 0 (0.0%) |
| Professional & Scientific | 4 (66.7%) | 2 (33.3%) |
| Enterprise Management | 0 (0.0%) | 0 (0.0%) |
| Administrative & Support | 39 (47.6%) | 43 (52.4%) |
| Educational Services | 37 (22.6%) | 127 (77.4%) |
| Health Care & Social Assistance | 13 (4.5%) | 273 (95.5%) |
| Arts, Entertainment & Recreation | 6 (54.5%) | 5 (45.5%) |
| Accommodation & Food Services | 35 (29.9%) | 82 (70.1%) |
| Public Administration | 157 (56.9%) | 119 (43.1%) |
| Total | 987 (51.0%) | 948 (49.0%) |
Education in Greer County
School Enrollment in Greer County
The most common levels of schooling among the 1,060 students in Greer County are elementary school (309 | 29.1%), high school (306 | 28.9%), and nursery / preschool (148 | 14.0%).
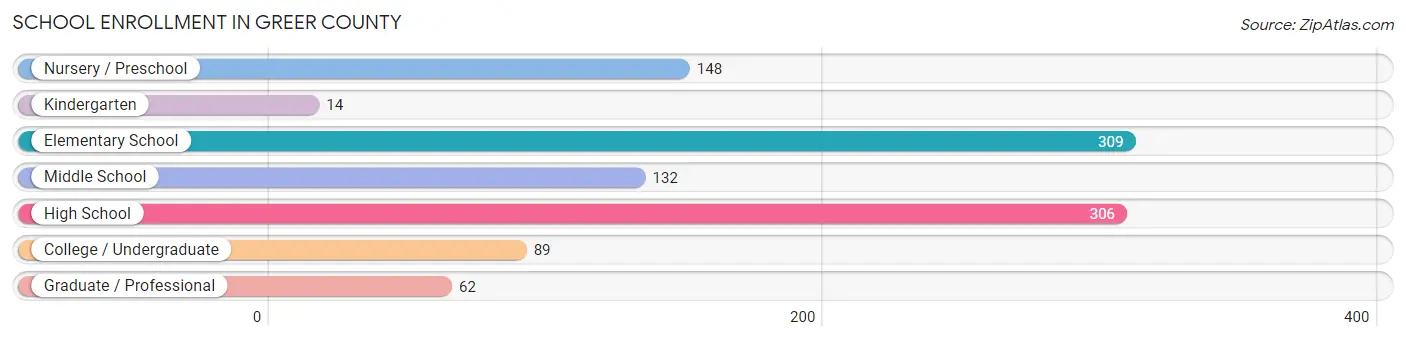
| School Level | # Students | % Students |
| Nursery / Preschool | 148 | 14.0% |
| Kindergarten | 14 | 1.3% |
| Elementary School | 309 | 29.1% |
| Middle School | 132 | 12.4% |
| High School | 306 | 28.9% |
| College / Undergraduate | 89 | 8.4% |
| Graduate / Professional | 62 | 5.9% |
| Total | 1,060 | 100.0% |
School Enrollment by Age by Funding Source in Greer County
Out of a total of 1,060 students who are enrolled in schools in Greer County, 75 (7.1%) attend a private institution, while the remaining 985 (92.9%) are enrolled in public schools. The age group of 35 years and over has the highest likelihood of being enrolled in private schools, with 59 (63.4% in the age bracket) enrolled. Conversely, the age group of 3 to 4 year olds has the lowest likelihood of being enrolled in a private school, with 60 (100.0% in the age bracket) attending a public institution.
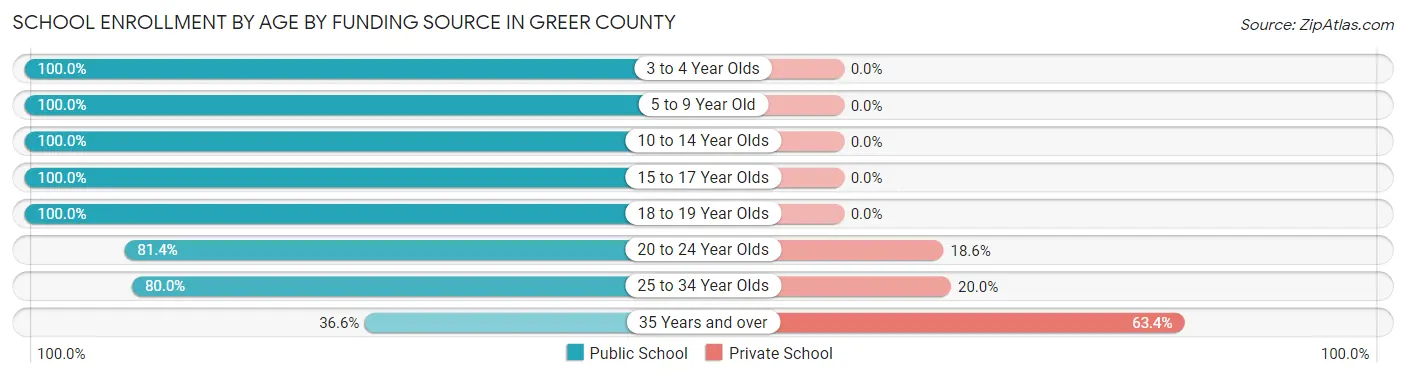
| Age Bracket | Public School | Private School |
| 3 to 4 Year Olds | 60 (100.0%) | 0 (0.0%) |
| 5 to 9 Year Old | 354 (100.0%) | 0 (0.0%) |
| 10 to 14 Year Olds | 241 (100.0%) | 0 (0.0%) |
| 15 to 17 Year Olds | 152 (100.0%) | 0 (0.0%) |
| 18 to 19 Year Olds | 77 (100.0%) | 0 (0.0%) |
| 20 to 24 Year Olds | 35 (81.4%) | 8 (18.6%) |
| 25 to 34 Year Olds | 32 (80.0%) | 8 (20.0%) |
| 35 Years and over | 34 (36.6%) | 59 (63.4%) |
| Total | 985 (92.9%) | 75 (7.1%) |
Educational Attainment by Field of Study in Greer County
Education (153 | 40.5%), arts & humanities (50 | 13.2%), bio, nature & agricultural (47 | 12.4%), psychology (38 | 10.1%), and science & technology (25 | 6.6%) are the most common fields of study among 378 individuals in Greer County who have obtained a bachelor's degree or higher.
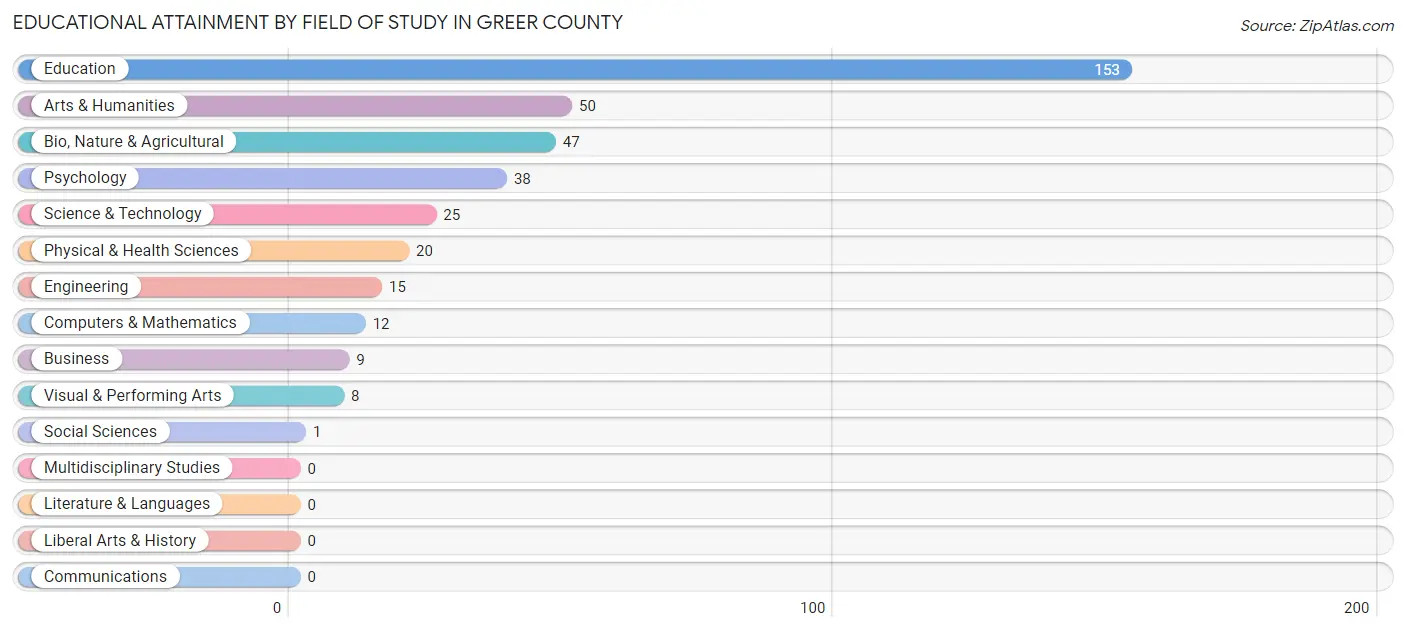
| Field of Study | # Graduates | % Graduates |
| Computers & Mathematics | 12 | 3.2% |
| Bio, Nature & Agricultural | 47 | 12.4% |
| Physical & Health Sciences | 20 | 5.3% |
| Psychology | 38 | 10.1% |
| Social Sciences | 1 | 0.3% |
| Engineering | 15 | 4.0% |
| Multidisciplinary Studies | 0 | 0.0% |
| Science & Technology | 25 | 6.6% |
| Business | 9 | 2.4% |
| Education | 153 | 40.5% |
| Literature & Languages | 0 | 0.0% |
| Liberal Arts & History | 0 | 0.0% |
| Visual & Performing Arts | 8 | 2.1% |
| Communications | 0 | 0.0% |
| Arts & Humanities | 50 | 13.2% |
| Total | 378 | 100.0% |
Transportation & Commute in Greer County
Vehicle Availability by Sex in Greer County
The most prevalent vehicle ownership categories in Greer County are males with 2 vehicles (286, accounting for 28.7%) and females with 2 vehicles (273, making up 30.7%).

| Vehicles Available | Male | Female |
| No Vehicle | 17 (1.7%) | 13 (1.4%) |
| 1 Vehicle | 172 (17.3%) | 231 (24.8%) |
| 2 Vehicles | 286 (28.7%) | 273 (29.3%) |
| 3 Vehicles | 249 (25.0%) | 211 (22.7%) |
| 4 Vehicles | 163 (16.4%) | 133 (14.3%) |
| 5 or more Vehicles | 108 (10.8%) | 70 (7.5%) |
| Total | 995 (100.0%) | 931 (100.0%) |
Commute Time in Greer County
The most frequently occuring commute durations in Greer County are 5 to 9 minutes (389 commuters, 21.5%), 20 to 24 minutes (253 commuters, 14.0%), and 30 to 34 minutes (246 commuters, 13.6%).
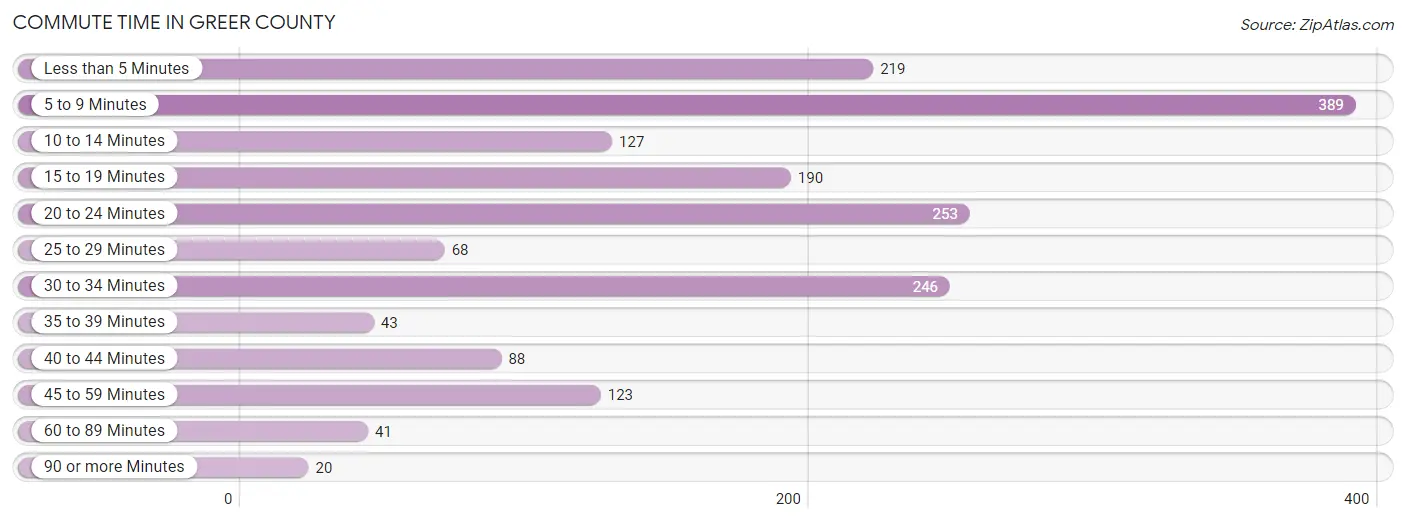
| Commute Time | # Commuters | % Commuters |
| Less than 5 Minutes | 219 | 12.1% |
| 5 to 9 Minutes | 389 | 21.5% |
| 10 to 14 Minutes | 127 | 7.0% |
| 15 to 19 Minutes | 190 | 10.5% |
| 20 to 24 Minutes | 253 | 14.0% |
| 25 to 29 Minutes | 68 | 3.8% |
| 30 to 34 Minutes | 246 | 13.6% |
| 35 to 39 Minutes | 43 | 2.4% |
| 40 to 44 Minutes | 88 | 4.9% |
| 45 to 59 Minutes | 123 | 6.8% |
| 60 to 89 Minutes | 41 | 2.3% |
| 90 or more Minutes | 20 | 1.1% |
Commute Time by Sex in Greer County
The most common commute times in Greer County are 20 to 24 minutes (159 commuters, 17.7%) for males and 5 to 9 minutes (257 commuters, 28.3%) for females.
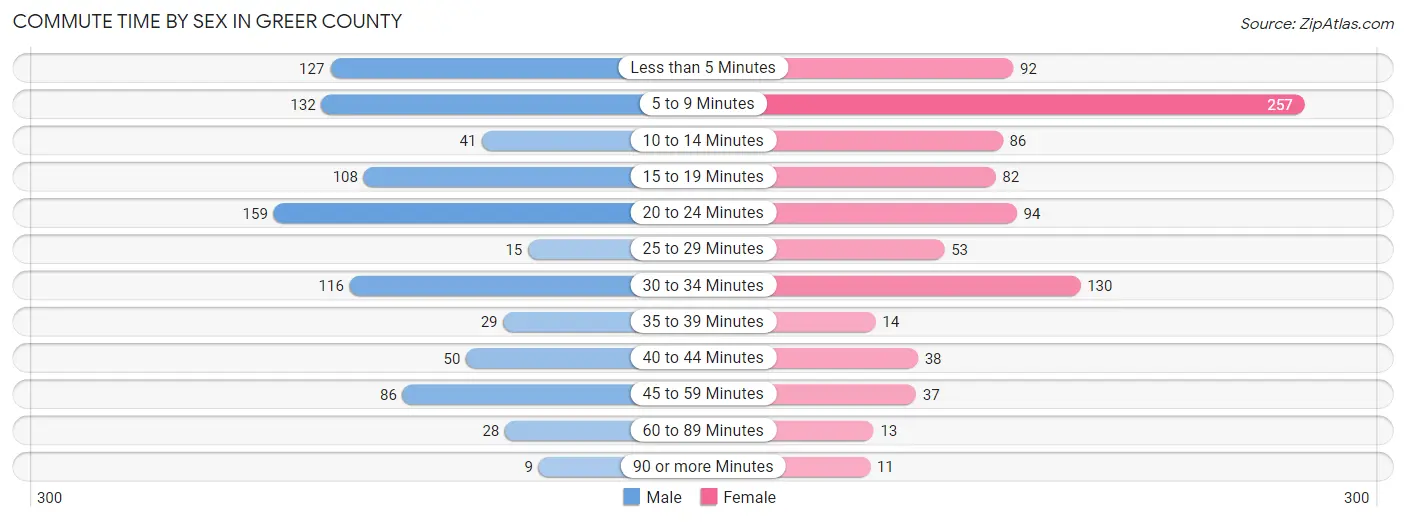
| Commute Time | Male | Female |
| Less than 5 Minutes | 127 (14.1%) | 92 (10.1%) |
| 5 to 9 Minutes | 132 (14.7%) | 257 (28.3%) |
| 10 to 14 Minutes | 41 (4.6%) | 86 (9.5%) |
| 15 to 19 Minutes | 108 (12.0%) | 82 (9.0%) |
| 20 to 24 Minutes | 159 (17.7%) | 94 (10.4%) |
| 25 to 29 Minutes | 15 (1.7%) | 53 (5.8%) |
| 30 to 34 Minutes | 116 (12.9%) | 130 (14.3%) |
| 35 to 39 Minutes | 29 (3.2%) | 14 (1.5%) |
| 40 to 44 Minutes | 50 (5.6%) | 38 (4.2%) |
| 45 to 59 Minutes | 86 (9.6%) | 37 (4.1%) |
| 60 to 89 Minutes | 28 (3.1%) | 13 (1.4%) |
| 90 or more Minutes | 9 (1.0%) | 11 (1.2%) |
Time of Departure to Work by Sex in Greer County
The most frequent times of departure to work in Greer County are 7:30 AM to 7:59 AM (221, 24.6%) for males and 7:00 AM to 7:29 AM (303, 33.4%) for females.
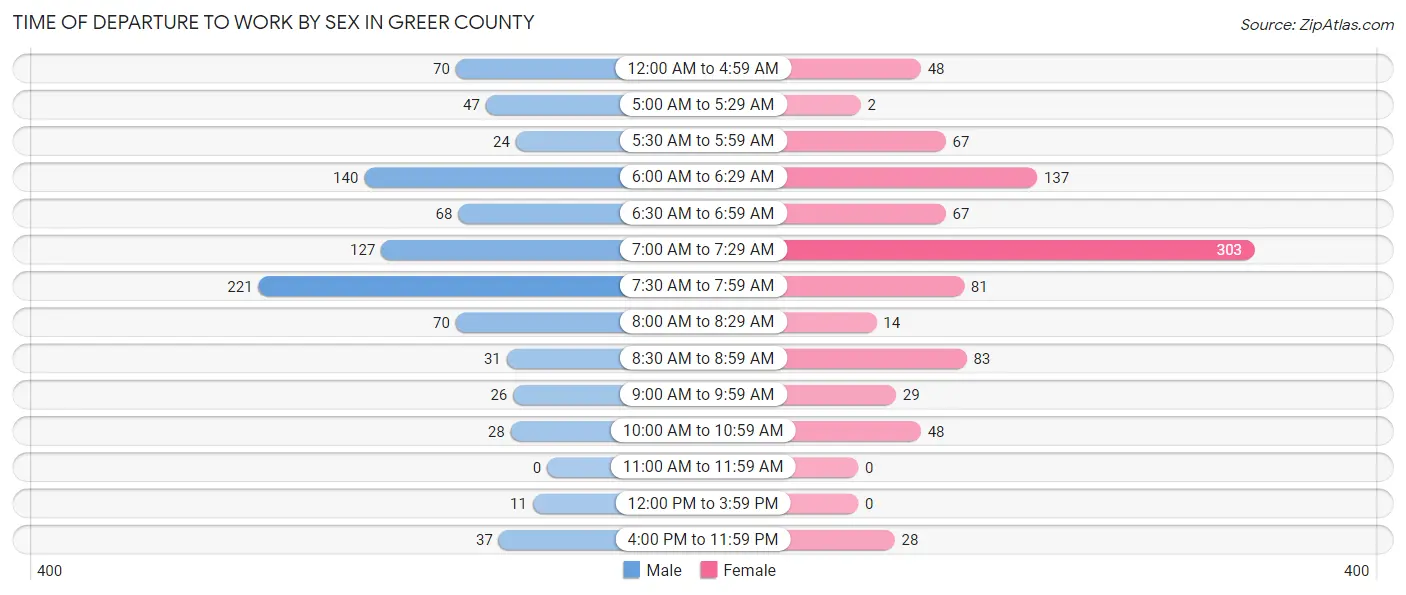
| Time of Departure | Male | Female |
| 12:00 AM to 4:59 AM | 70 (7.8%) | 48 (5.3%) |
| 5:00 AM to 5:29 AM | 47 (5.2%) | 2 (0.2%) |
| 5:30 AM to 5:59 AM | 24 (2.7%) | 67 (7.4%) |
| 6:00 AM to 6:29 AM | 140 (15.6%) | 137 (15.1%) |
| 6:30 AM to 6:59 AM | 68 (7.6%) | 67 (7.4%) |
| 7:00 AM to 7:29 AM | 127 (14.1%) | 303 (33.4%) |
| 7:30 AM to 7:59 AM | 221 (24.6%) | 81 (8.9%) |
| 8:00 AM to 8:29 AM | 70 (7.8%) | 14 (1.5%) |
| 8:30 AM to 8:59 AM | 31 (3.4%) | 83 (9.1%) |
| 9:00 AM to 9:59 AM | 26 (2.9%) | 29 (3.2%) |
| 10:00 AM to 10:59 AM | 28 (3.1%) | 48 (5.3%) |
| 11:00 AM to 11:59 AM | 0 (0.0%) | 0 (0.0%) |
| 12:00 PM to 3:59 PM | 11 (1.2%) | 0 (0.0%) |
| 4:00 PM to 11:59 PM | 37 (4.1%) | 28 (3.1%) |
| Total | 900 (100.0%) | 907 (100.0%) |
Housing Occupancy in Greer County
Occupancy by Ownership in Greer County
Of the total 2,024 dwellings in Greer County, owner-occupied units account for 1,450 (71.6%), while renter-occupied units make up 574 (28.4%).
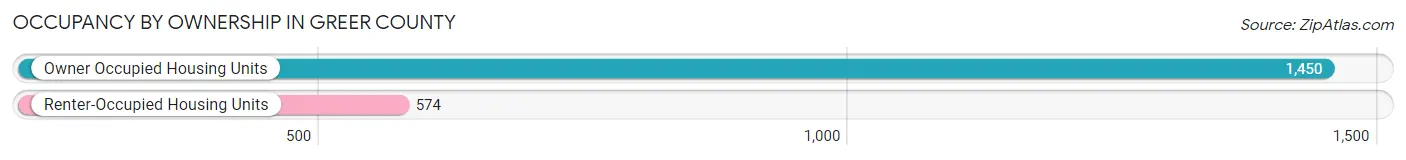
| Occupancy | # Housing Units | % Housing Units |
| Owner Occupied Housing Units | 1,450 | 71.6% |
| Renter-Occupied Housing Units | 574 | 28.4% |
| Total Occupied Housing Units | 2,024 | 100.0% |
Occupancy by Household Size in Greer County
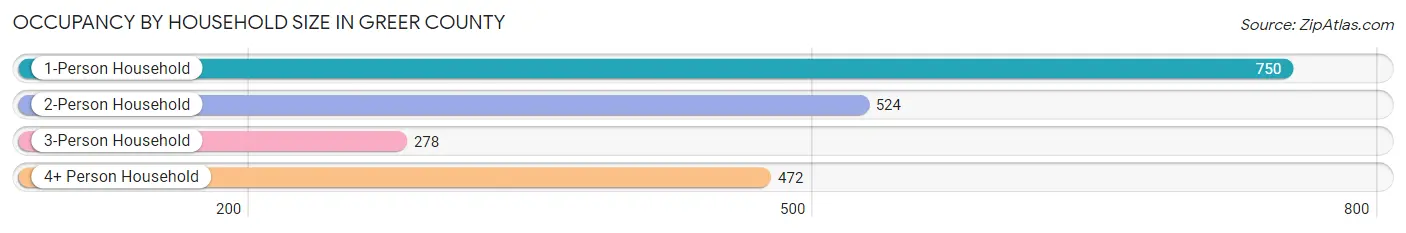
| Household Size | # Housing Units | % Housing Units |
| 1-Person Household | 750 | 37.1% |
| 2-Person Household | 524 | 25.9% |
| 3-Person Household | 278 | 13.7% |
| 4+ Person Household | 472 | 23.3% |
| Total Housing Units | 2,024 | 100.0% |
Occupancy by Ownership by Household Size in Greer County
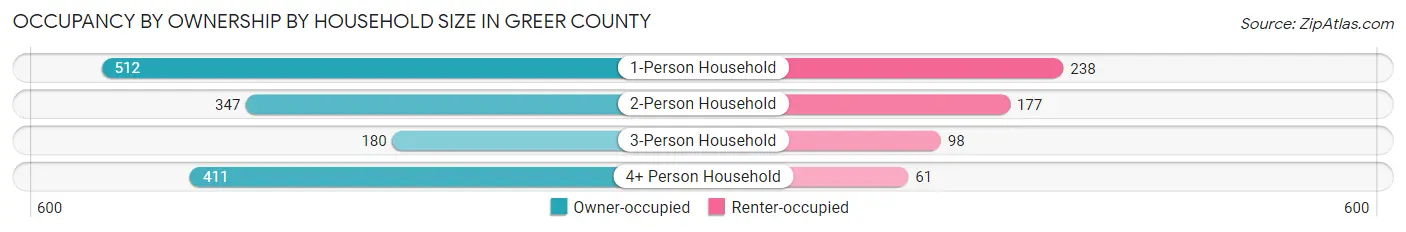
| Household Size | Owner-occupied | Renter-occupied |
| 1-Person Household | 512 (68.3%) | 238 (31.7%) |
| 2-Person Household | 347 (66.2%) | 177 (33.8%) |
| 3-Person Household | 180 (64.7%) | 98 (35.2%) |
| 4+ Person Household | 411 (87.1%) | 61 (12.9%) |
| Total Housing Units | 1,450 (71.6%) | 574 (28.4%) |
Occupancy by Educational Attainment in Greer County
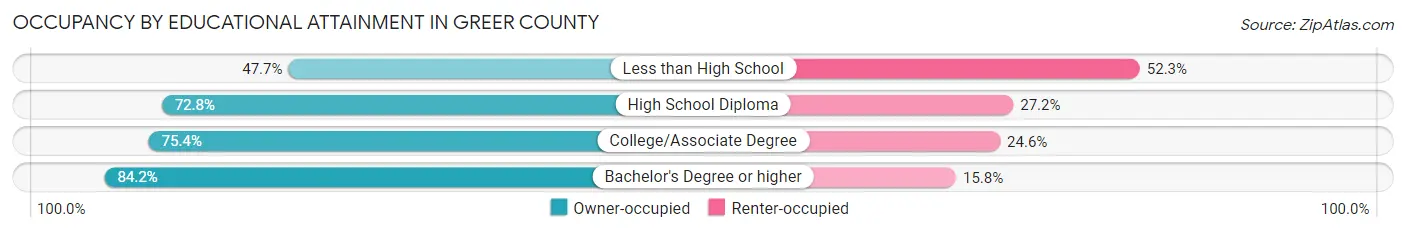
| Household Size | Owner-occupied | Renter-occupied |
| Less than High School | 136 (47.7%) | 149 (52.3%) |
| High School Diploma | 423 (72.8%) | 158 (27.2%) |
| College/Associate Degree | 721 (75.4%) | 235 (24.6%) |
| Bachelor's Degree or higher | 170 (84.2%) | 32 (15.8%) |
Occupancy by Age of Householder in Greer County
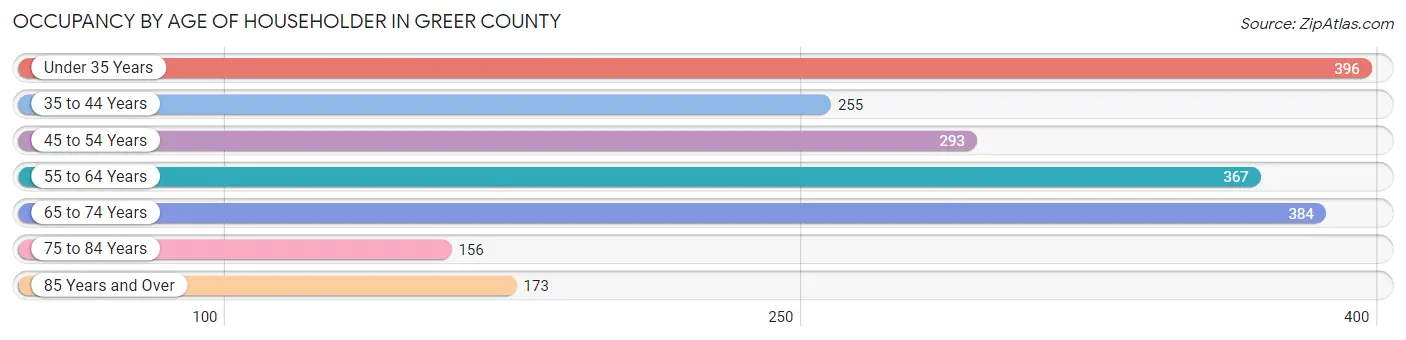
| Age Bracket | # Households | % Households |
| Under 35 Years | 396 | 19.6% |
| 35 to 44 Years | 255 | 12.6% |
| 45 to 54 Years | 293 | 14.5% |
| 55 to 64 Years | 367 | 18.1% |
| 65 to 74 Years | 384 | 19.0% |
| 75 to 84 Years | 156 | 7.7% |
| 85 Years and Over | 173 | 8.6% |
| Total | 2,024 | 100.0% |
Housing Finances in Greer County
Median Income by Occupancy in Greer County
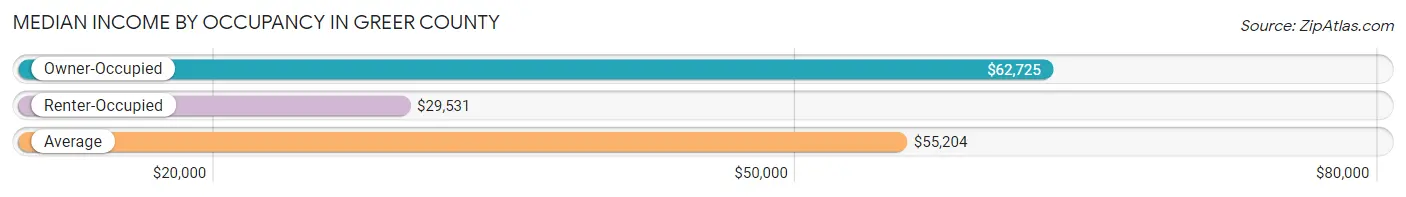
| Occupancy Type | # Households | Median Income |
| Owner-Occupied | 1,450 (71.6%) | $62,725 |
| Renter-Occupied | 574 (28.4%) | $29,531 |
| Average | 2,024 (100.0%) | $55,204 |
Occupancy by Householder Income Bracket in Greer County
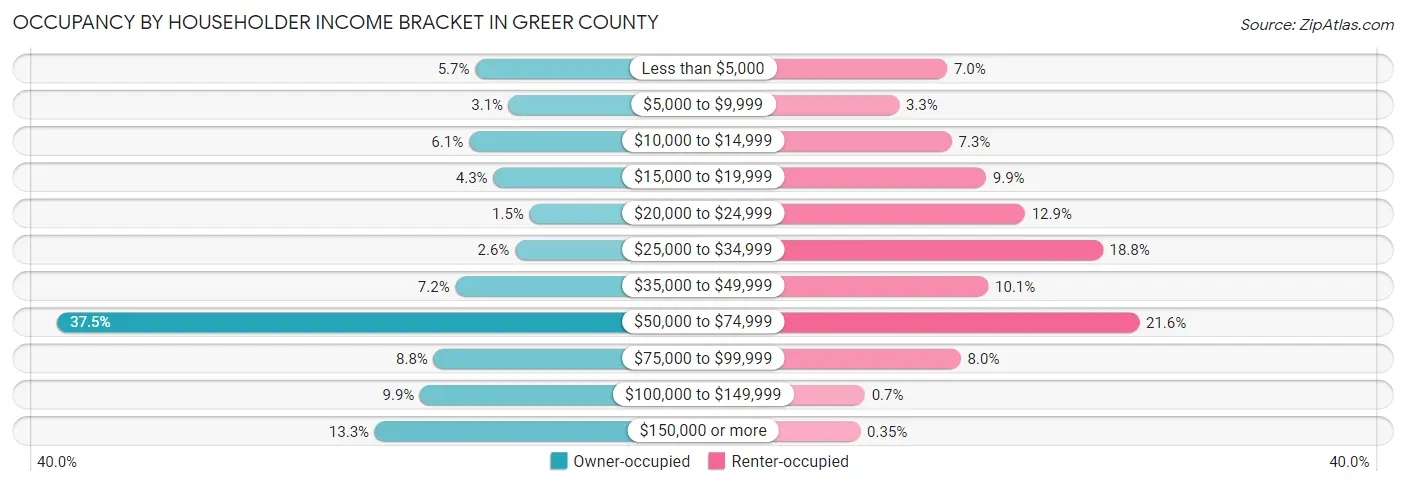
| Income Bracket | Owner-occupied | Renter-occupied |
| Less than $5,000 | 82 (5.7%) | 40 (7.0%) |
| $5,000 to $9,999 | 45 (3.1%) | 19 (3.3%) |
| $10,000 to $14,999 | 89 (6.1%) | 42 (7.3%) |
| $15,000 to $19,999 | 62 (4.3%) | 57 (9.9%) |
| $20,000 to $24,999 | 22 (1.5%) | 74 (12.9%) |
| $25,000 to $34,999 | 38 (2.6%) | 108 (18.8%) |
| $35,000 to $49,999 | 104 (7.2%) | 58 (10.1%) |
| $50,000 to $74,999 | 544 (37.5%) | 124 (21.6%) |
| $75,000 to $99,999 | 128 (8.8%) | 46 (8.0%) |
| $100,000 to $149,999 | 143 (9.9%) | 4 (0.7%) |
| $150,000 or more | 193 (13.3%) | 2 (0.4%) |
| Total | 1,450 (100.0%) | 574 (100.0%) |
Monthly Housing Cost Tiers in Greer County
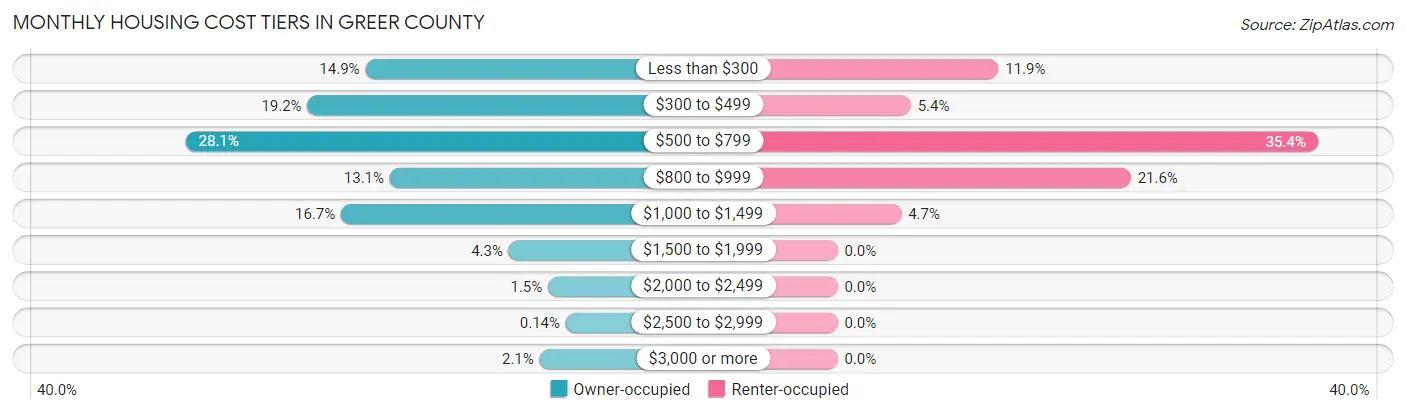
| Monthly Cost | Owner-occupied | Renter-occupied |
| Less than $300 | 216 (14.9%) | 68 (11.8%) |
| $300 to $499 | 278 (19.2%) | 31 (5.4%) |
| $500 to $799 | 408 (28.1%) | 203 (35.4%) |
| $800 to $999 | 190 (13.1%) | 124 (21.6%) |
| $1,000 to $1,499 | 242 (16.7%) | 27 (4.7%) |
| $1,500 to $1,999 | 63 (4.3%) | 0 (0.0%) |
| $2,000 to $2,499 | 21 (1.5%) | 0 (0.0%) |
| $2,500 to $2,999 | 2 (0.1%) | 0 (0.0%) |
| $3,000 or more | 30 (2.1%) | 0 (0.0%) |
| Total | 1,450 (100.0%) | 574 (100.0%) |
Physical Housing Characteristics in Greer County
Housing Structures in Greer County
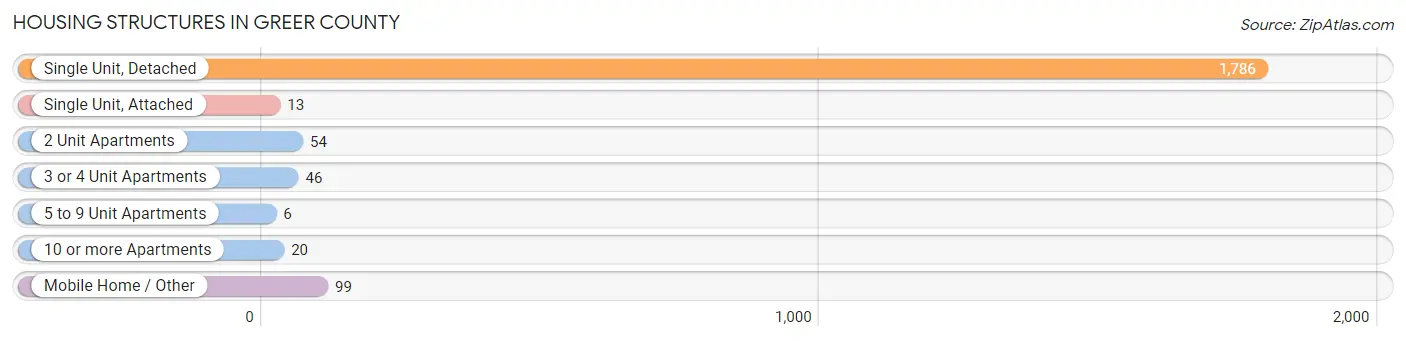
| Structure Type | # Housing Units | % Housing Units |
| Single Unit, Detached | 1,786 | 88.2% |
| Single Unit, Attached | 13 | 0.6% |
| 2 Unit Apartments | 54 | 2.7% |
| 3 or 4 Unit Apartments | 46 | 2.3% |
| 5 to 9 Unit Apartments | 6 | 0.3% |
| 10 or more Apartments | 20 | 1.0% |
| Mobile Home / Other | 99 | 4.9% |
| Total | 2,024 | 100.0% |
Housing Structures by Occupancy in Greer County
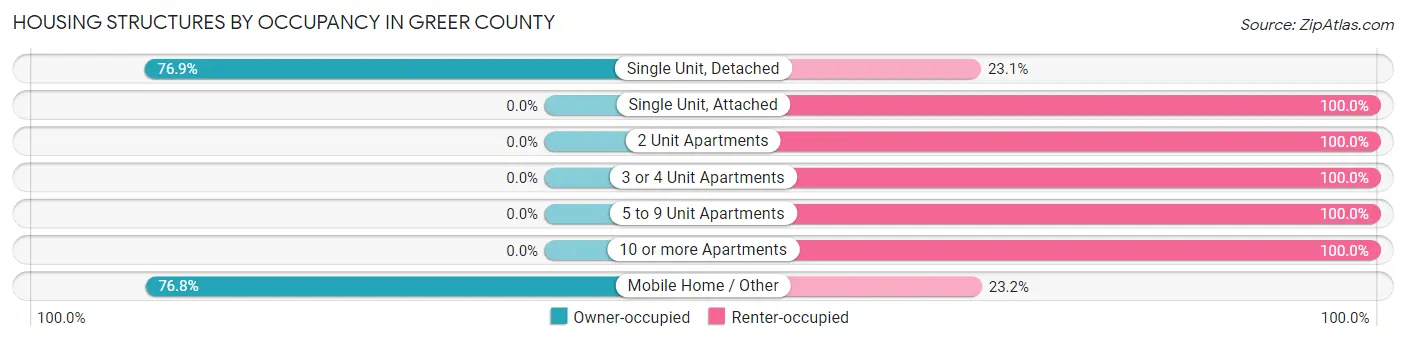
| Structure Type | Owner-occupied | Renter-occupied |
| Single Unit, Detached | 1,374 (76.9%) | 412 (23.1%) |
| Single Unit, Attached | 0 (0.0%) | 13 (100.0%) |
| 2 Unit Apartments | 0 (0.0%) | 54 (100.0%) |
| 3 or 4 Unit Apartments | 0 (0.0%) | 46 (100.0%) |
| 5 to 9 Unit Apartments | 0 (0.0%) | 6 (100.0%) |
| 10 or more Apartments | 0 (0.0%) | 20 (100.0%) |
| Mobile Home / Other | 76 (76.8%) | 23 (23.2%) |
| Total | 1,450 (71.6%) | 574 (28.4%) |
Housing Structures by Number of Rooms in Greer County
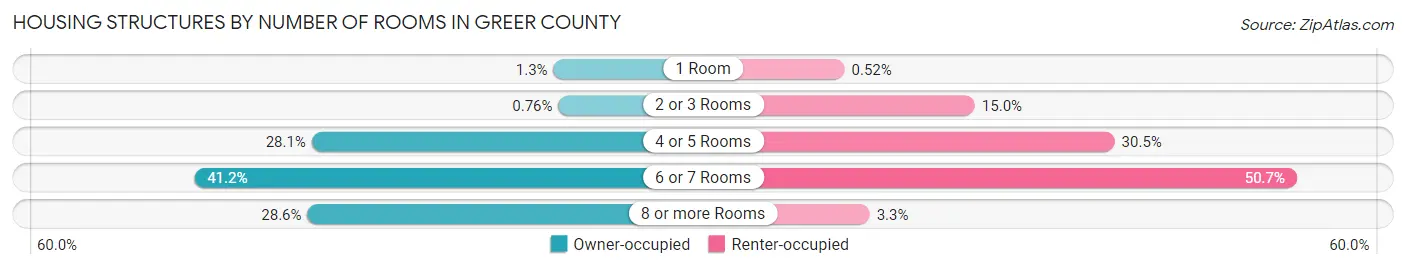
| Number of Rooms | Owner-occupied | Renter-occupied |
| 1 Room | 19 (1.3%) | 3 (0.5%) |
| 2 or 3 Rooms | 11 (0.8%) | 86 (15.0%) |
| 4 or 5 Rooms | 408 (28.1%) | 175 (30.5%) |
| 6 or 7 Rooms | 597 (41.2%) | 291 (50.7%) |
| 8 or more Rooms | 415 (28.6%) | 19 (3.3%) |
| Total | 1,450 (100.0%) | 574 (100.0%) |
Housing Structure by Heating Type in Greer County
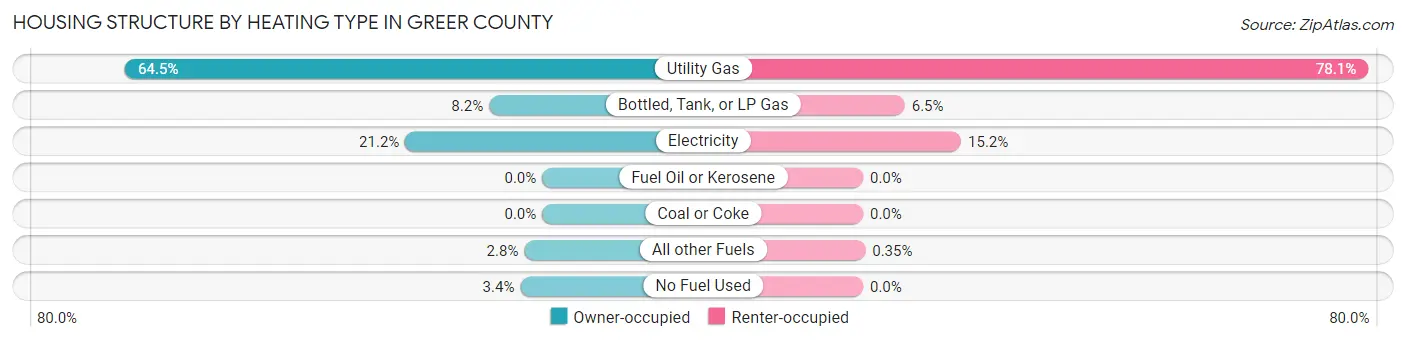
| Heating Type | Owner-occupied | Renter-occupied |
| Utility Gas | 935 (64.5%) | 448 (78.0%) |
| Bottled, Tank, or LP Gas | 119 (8.2%) | 37 (6.5%) |
| Electricity | 307 (21.2%) | 87 (15.2%) |
| Fuel Oil or Kerosene | 0 (0.0%) | 0 (0.0%) |
| Coal or Coke | 0 (0.0%) | 0 (0.0%) |
| All other Fuels | 40 (2.8%) | 2 (0.4%) |
| No Fuel Used | 49 (3.4%) | 0 (0.0%) |
| Total | 1,450 (100.0%) | 574 (100.0%) |
Household Vehicle Usage in Greer County
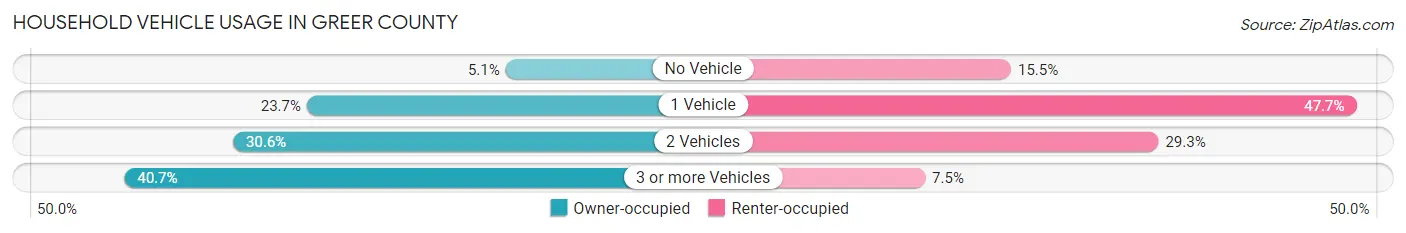
| Vehicles per Household | Owner-occupied | Renter-occupied |
| No Vehicle | 74 (5.1%) | 89 (15.5%) |
| 1 Vehicle | 343 (23.7%) | 274 (47.7%) |
| 2 Vehicles | 443 (30.5%) | 168 (29.3%) |
| 3 or more Vehicles | 590 (40.7%) | 43 (7.5%) |
| Total | 1,450 (100.0%) | 574 (100.0%) |
Real Estate & Mortgages in Greer County
Real Estate and Mortgage Overview in Greer County
| Characteristic | Without Mortgage | With Mortgage |
| Housing Units | 960 | 490 |
| Median Property Value | $95,700 | $98,500 |
| Median Household Income | $59,018 | $73 |
| Monthly Housing Costs | $503 | $15 |
| Real Estate Taxes | $546 | $47 |
Property Value by Mortgage Status in Greer County
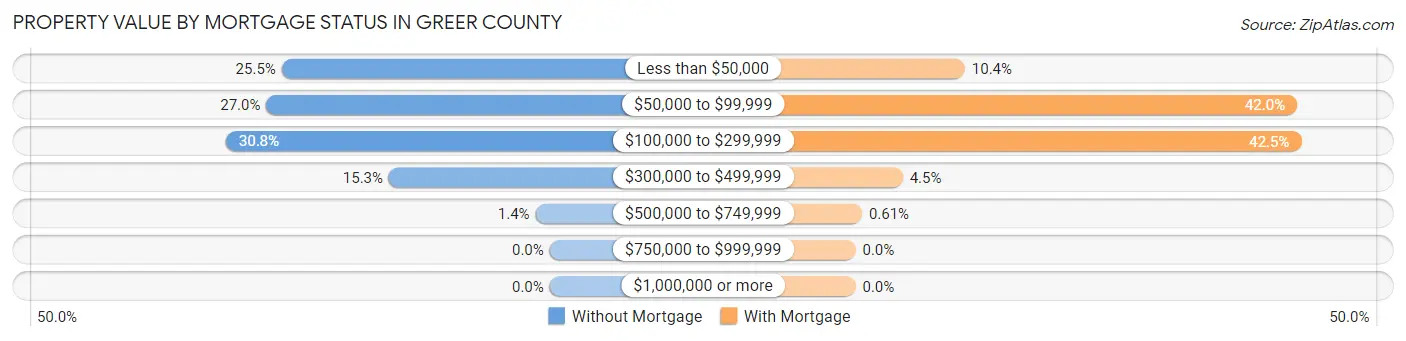
| Property Value | Without Mortgage | With Mortgage |
| Less than $50,000 | 245 (25.5%) | 51 (10.4%) |
| $50,000 to $99,999 | 259 (27.0%) | 206 (42.0%) |
| $100,000 to $299,999 | 296 (30.8%) | 208 (42.4%) |
| $300,000 to $499,999 | 147 (15.3%) | 22 (4.5%) |
| $500,000 to $749,999 | 13 (1.3%) | 3 (0.6%) |
| $750,000 to $999,999 | 0 (0.0%) | 0 (0.0%) |
| $1,000,000 or more | 0 (0.0%) | 0 (0.0%) |
| Total | 960 (100.0%) | 490 (100.0%) |
Household Income by Mortgage Status in Greer County
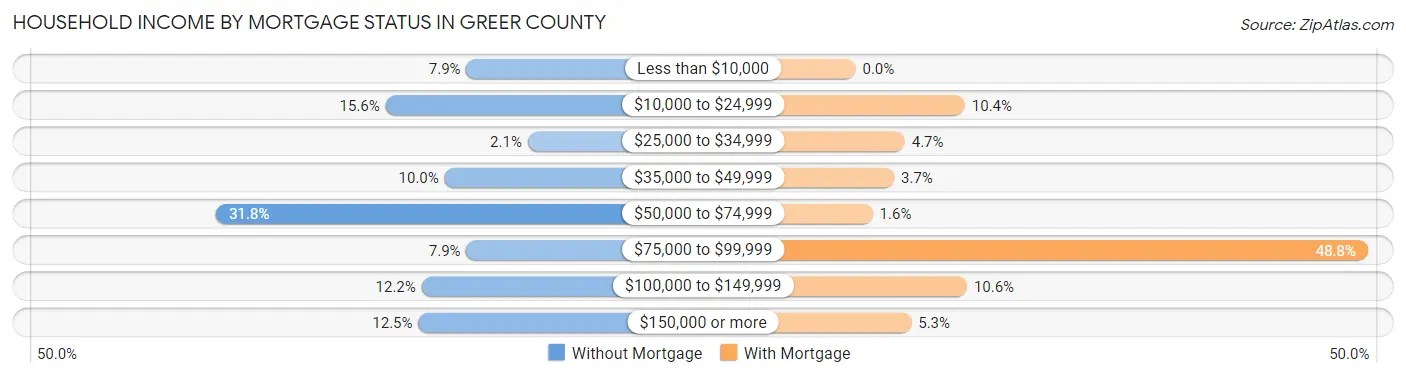
| Household Income | Without Mortgage | With Mortgage |
| Less than $10,000 | 76 (7.9%) | 0 (0.0%) |
| $10,000 to $24,999 | 150 (15.6%) | 51 (10.4%) |
| $25,000 to $34,999 | 20 (2.1%) | 23 (4.7%) |
| $35,000 to $49,999 | 96 (10.0%) | 18 (3.7%) |
| $50,000 to $74,999 | 305 (31.8%) | 8 (1.6%) |
| $75,000 to $99,999 | 76 (7.9%) | 239 (48.8%) |
| $100,000 to $149,999 | 117 (12.2%) | 52 (10.6%) |
| $150,000 or more | 120 (12.5%) | 26 (5.3%) |
| Total | 960 (100.0%) | 490 (100.0%) |
Property Value to Household Income Ratio in Greer County
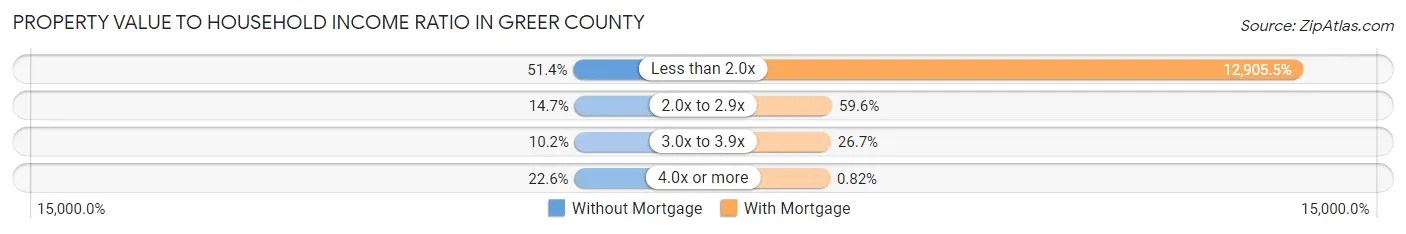
| Value-to-Income Ratio | Without Mortgage | With Mortgage |
| Less than 2.0x | 493 (51.3%) | 63,237 (12,905.5%) |
| 2.0x to 2.9x | 141 (14.7%) | 292 (59.6%) |
| 3.0x to 3.9x | 98 (10.2%) | 131 (26.7%) |
| 4.0x or more | 217 (22.6%) | 4 (0.8%) |
| Total | 960 (100.0%) | 490 (100.0%) |
Real Estate Taxes by Mortgage Status in Greer County
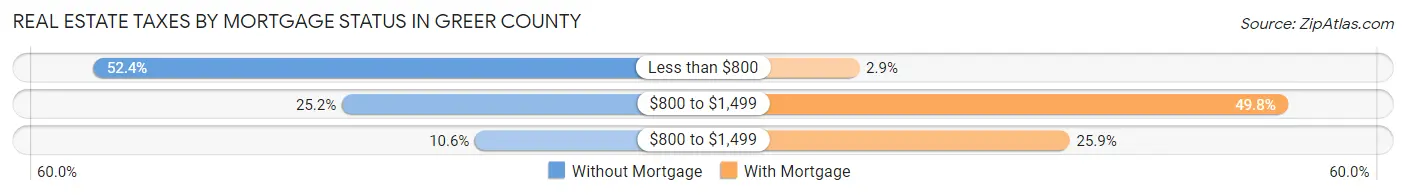
| Property Taxes | Without Mortgage | With Mortgage |
| Less than $800 | 503 (52.4%) | 14 (2.9%) |
| $800 to $1,499 | 242 (25.2%) | 244 (49.8%) |
| $800 to $1,499 | 102 (10.6%) | 127 (25.9%) |
| Total | 960 (100.0%) | 490 (100.0%) |
Health & Disability in Greer County
Health Insurance Coverage by Age in Greer County
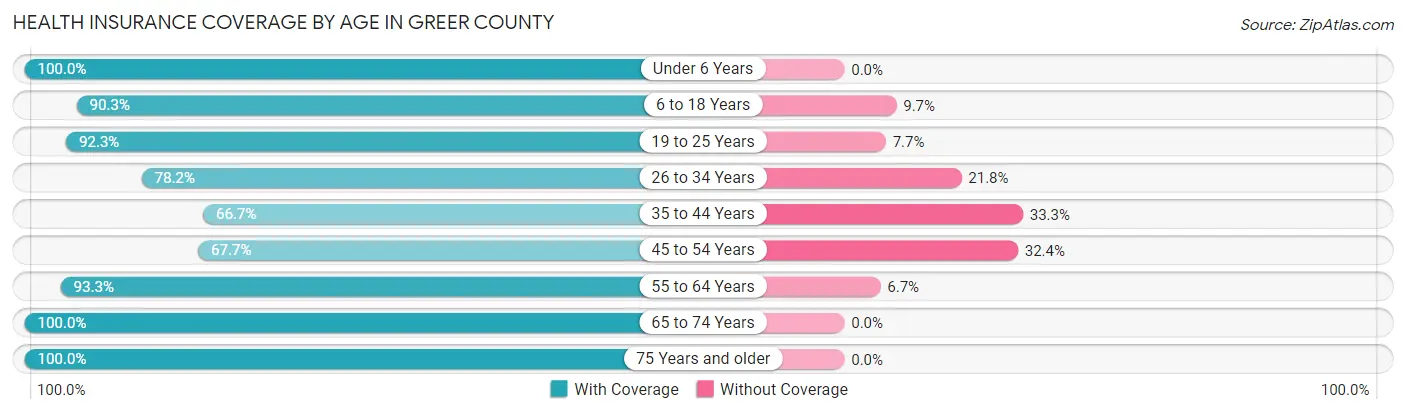
| Age Bracket | With Coverage | Without Coverage |
| Under 6 Years | 430 (100.0%) | 0 (0.0%) |
| 6 to 18 Years | 718 (90.3%) | 77 (9.7%) |
| 19 to 25 Years | 311 (92.3%) | 26 (7.7%) |
| 26 to 34 Years | 358 (78.2%) | 100 (21.8%) |
| 35 to 44 Years | 395 (66.7%) | 197 (33.3%) |
| 45 to 54 Years | 345 (67.6%) | 165 (32.4%) |
| 55 to 64 Years | 582 (93.3%) | 42 (6.7%) |
| 65 to 74 Years | 458 (100.0%) | 0 (0.0%) |
| 75 Years and older | 392 (100.0%) | 0 (0.0%) |
| Total | 3,989 (86.8%) | 607 (13.2%) |
Health Insurance Coverage by Citizenship Status in Greer County
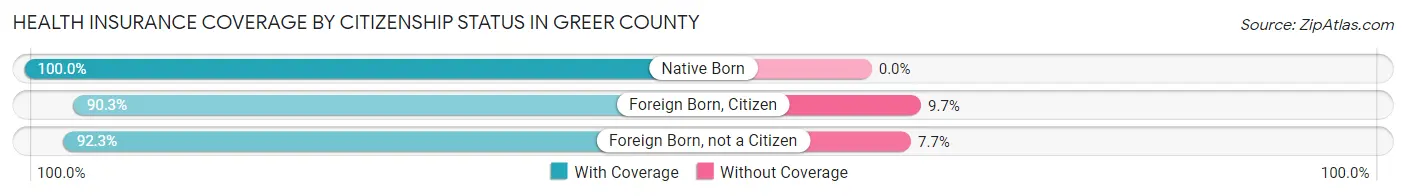
| Citizenship Status | With Coverage | Without Coverage |
| Native Born | 430 (100.0%) | 0 (0.0%) |
| Foreign Born, Citizen | 718 (90.3%) | 77 (9.7%) |
| Foreign Born, not a Citizen | 311 (92.3%) | 26 (7.7%) |
Health Insurance Coverage by Household Income in Greer County
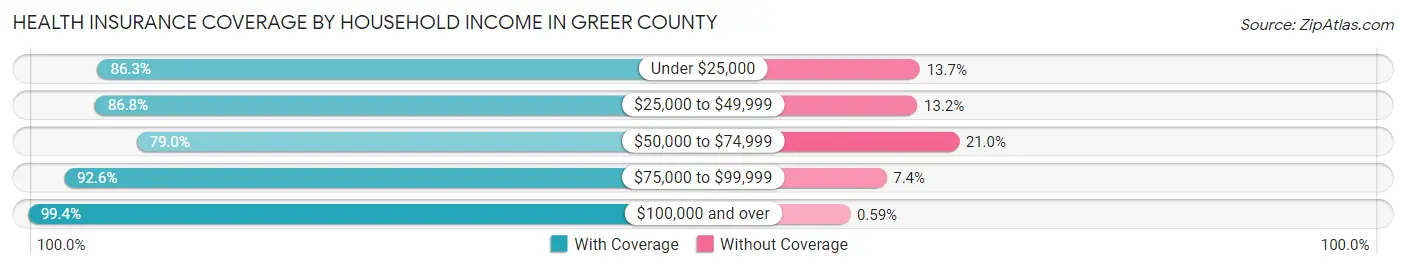
| Household Income | With Coverage | Without Coverage |
| Under $25,000 | 676 (86.3%) | 107 (13.7%) |
| $25,000 to $49,999 | 692 (86.8%) | 105 (13.2%) |
| $50,000 to $74,999 | 1,333 (79.0%) | 354 (21.0%) |
| $75,000 to $99,999 | 438 (92.6%) | 35 (7.4%) |
| $100,000 and over | 848 (99.4%) | 5 (0.6%) |
Public vs Private Health Insurance Coverage by Age in Greer County
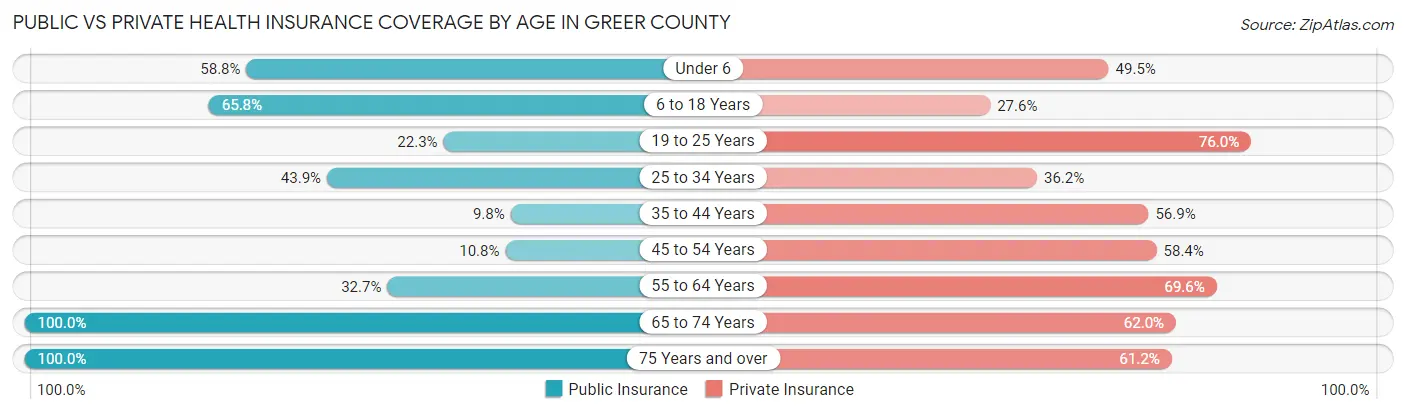
| Age Bracket | Public Insurance | Private Insurance |
| Under 6 | 253 (58.8%) | 213 (49.5%) |
| 6 to 18 Years | 523 (65.8%) | 219 (27.6%) |
| 19 to 25 Years | 75 (22.3%) | 256 (76.0%) |
| 25 to 34 Years | 201 (43.9%) | 166 (36.2%) |
| 35 to 44 Years | 58 (9.8%) | 337 (56.9%) |
| 45 to 54 Years | 55 (10.8%) | 298 (58.4%) |
| 55 to 64 Years | 204 (32.7%) | 434 (69.6%) |
| 65 to 74 Years | 458 (100.0%) | 284 (62.0%) |
| 75 Years and over | 392 (100.0%) | 240 (61.2%) |
| Total | 2,219 (48.3%) | 2,447 (53.2%) |
Disability Status by Sex by Age in Greer County
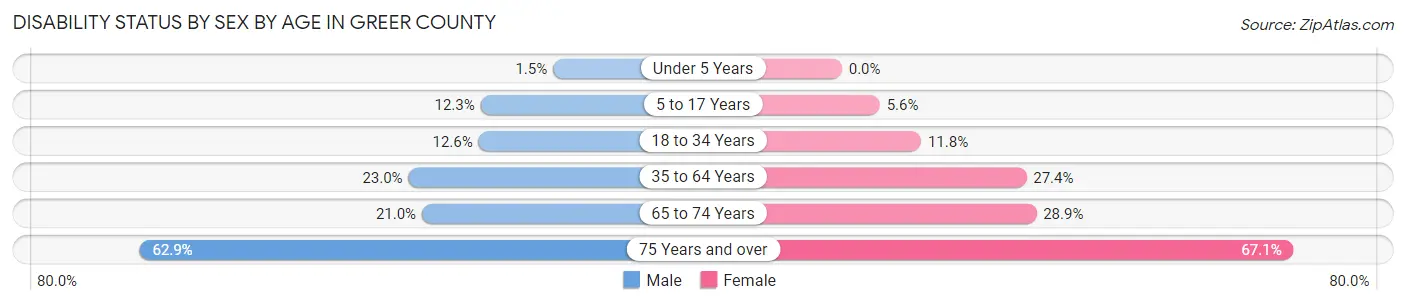
| Age Bracket | Male | Female |
| Under 5 Years | 2 (1.5%) | 0 (0.0%) |
| 5 to 17 Years | 55 (12.3%) | 22 (5.6%) |
| 18 to 34 Years | 52 (12.6%) | 52 (11.8%) |
| 35 to 64 Years | 193 (23.0%) | 243 (27.4%) |
| 65 to 74 Years | 46 (21.0%) | 69 (28.9%) |
| 75 Years and over | 90 (62.9%) | 167 (67.1%) |
Disability Class by Sex by Age in Greer County
Disability Class: Hearing Difficulty
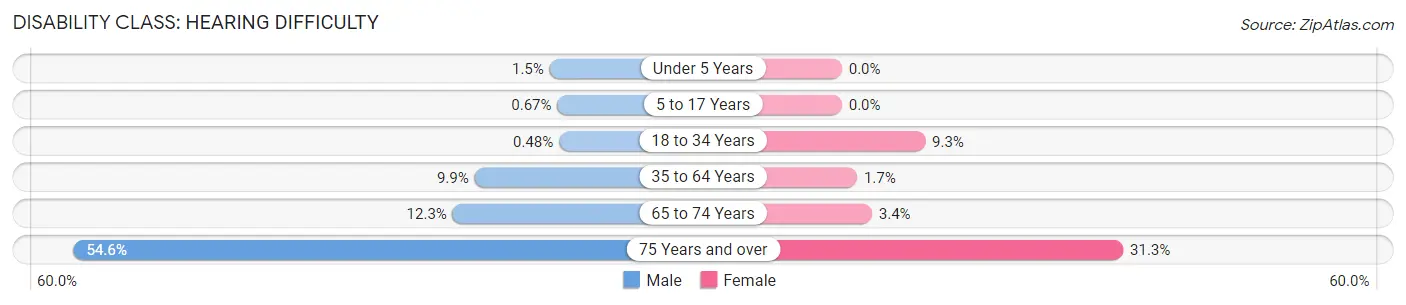
| Age Bracket | Male | Female |
| Under 5 Years | 2 (1.5%) | 0 (0.0%) |
| 5 to 17 Years | 3 (0.7%) | 0 (0.0%) |
| 18 to 34 Years | 2 (0.5%) | 41 (9.3%) |
| 35 to 64 Years | 83 (9.9%) | 15 (1.7%) |
| 65 to 74 Years | 27 (12.3%) | 8 (3.4%) |
| 75 Years and over | 78 (54.5%) | 78 (31.3%) |
Disability Class: Vision Difficulty
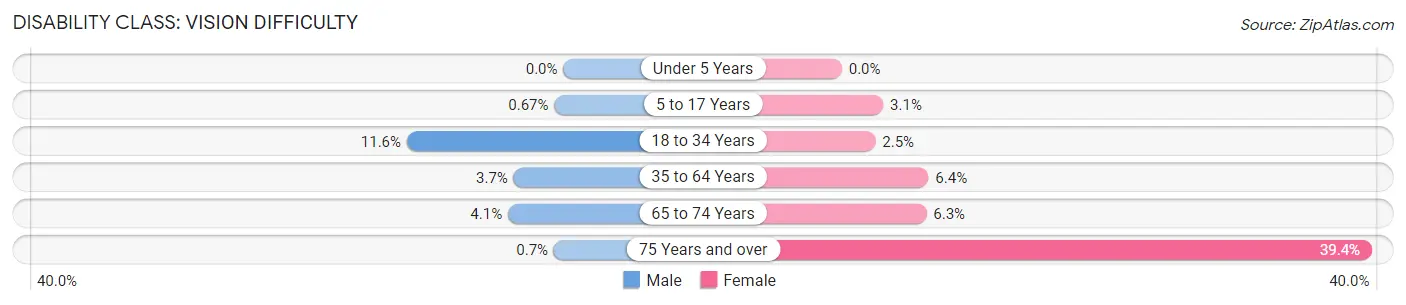
| Age Bracket | Male | Female |
| Under 5 Years | 0 (0.0%) | 0 (0.0%) |
| 5 to 17 Years | 3 (0.7%) | 12 (3.1%) |
| 18 to 34 Years | 48 (11.6%) | 11 (2.5%) |
| 35 to 64 Years | 31 (3.7%) | 57 (6.4%) |
| 65 to 74 Years | 9 (4.1%) | 15 (6.3%) |
| 75 Years and over | 1 (0.7%) | 98 (39.4%) |
Disability Class: Cognitive Difficulty
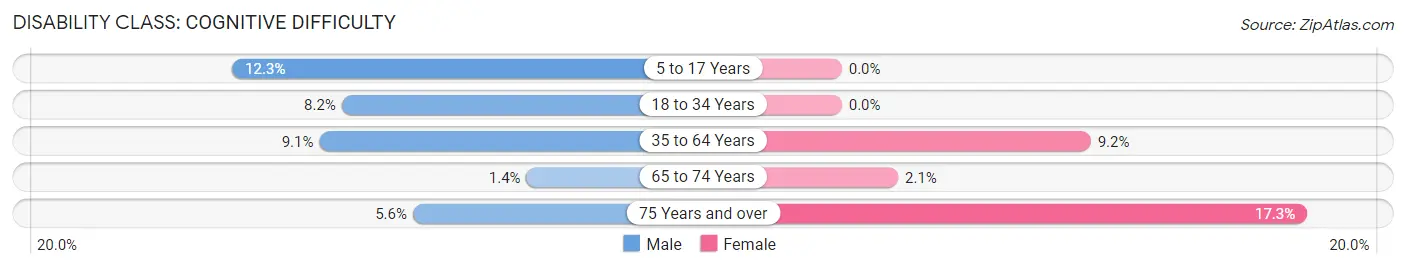
| Age Bracket | Male | Female |
| 5 to 17 Years | 55 (12.3%) | 0 (0.0%) |
| 18 to 34 Years | 34 (8.2%) | 0 (0.0%) |
| 35 to 64 Years | 76 (9.1%) | 82 (9.2%) |
| 65 to 74 Years | 3 (1.4%) | 5 (2.1%) |
| 75 Years and over | 8 (5.6%) | 43 (17.3%) |
Disability Class: Ambulatory Difficulty
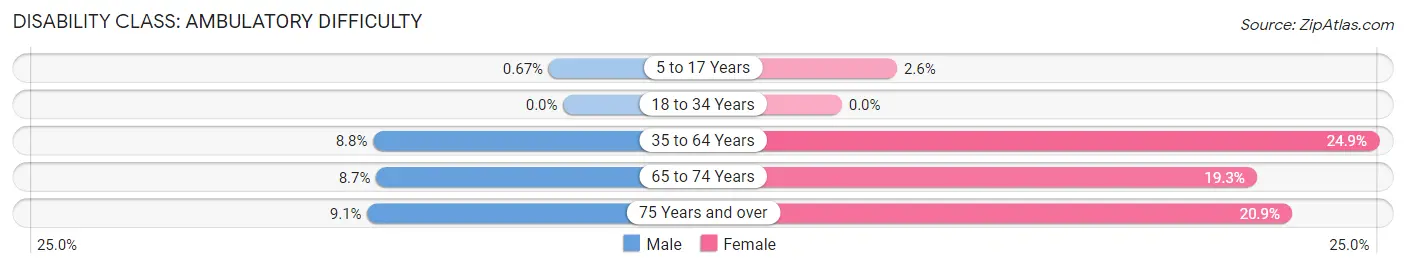
| Age Bracket | Male | Female |
| 5 to 17 Years | 3 (0.7%) | 10 (2.6%) |
| 18 to 34 Years | 0 (0.0%) | 0 (0.0%) |
| 35 to 64 Years | 74 (8.8%) | 221 (24.9%) |
| 65 to 74 Years | 19 (8.7%) | 46 (19.3%) |
| 75 Years and over | 13 (9.1%) | 52 (20.9%) |
Disability Class: Self-Care Difficulty
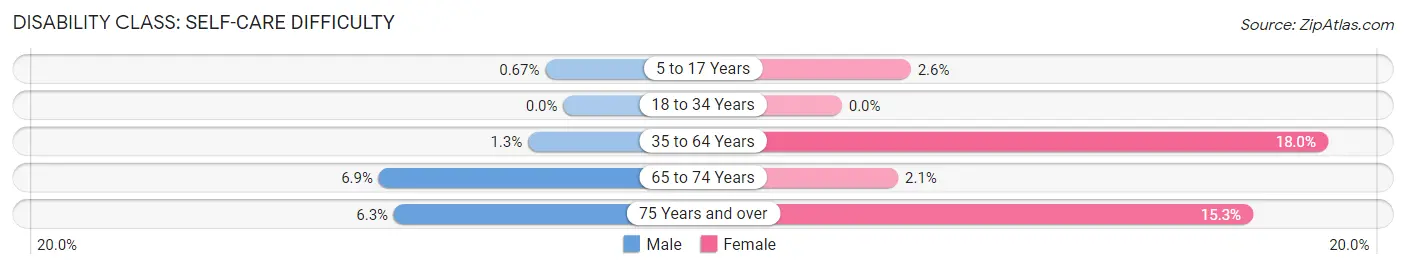
| Age Bracket | Male | Female |
| 5 to 17 Years | 3 (0.7%) | 10 (2.6%) |
| 18 to 34 Years | 0 (0.0%) | 0 (0.0%) |
| 35 to 64 Years | 11 (1.3%) | 160 (18.0%) |
| 65 to 74 Years | 15 (6.9%) | 5 (2.1%) |
| 75 Years and over | 9 (6.3%) | 38 (15.3%) |
Technology Access in Greer County
Computing Device Access in Greer County
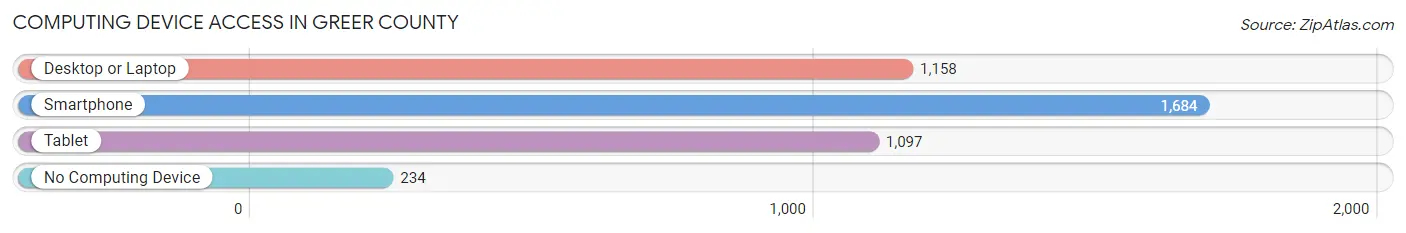
| Device Type | # Households | % Households |
| Desktop or Laptop | 1,158 | 57.2% |
| Smartphone | 1,684 | 83.2% |
| Tablet | 1,097 | 54.2% |
| No Computing Device | 234 | 11.6% |
| Total | 2,024 | 100.0% |
Internet Access in Greer County
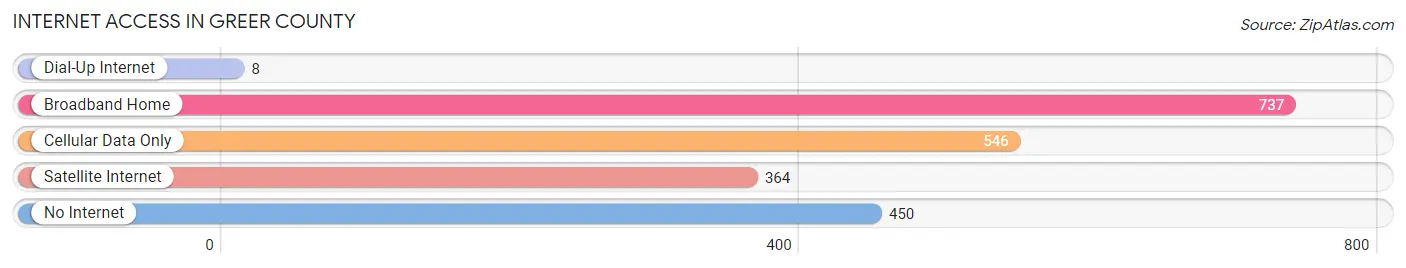
| Internet Type | # Households | % Households |
| Dial-Up Internet | 8 | 0.4% |
| Broadband Home | 737 | 36.4% |
| Cellular Data Only | 546 | 27.0% |
| Satellite Internet | 364 | 18.0% |
| No Internet | 450 | 22.2% |
| Total | 2,024 | 100.0% |
Greer County Summary
Greer County is located in the southwestern corner of Oklahoma, and is bordered by Texas to the south and west, and Beckham County to the north and east. The county seat is Mangum, and the county is named for John A. Greer, a former Governor of Tennessee. Greer County covers an area of 845 square miles, and has a population of approximately 6,000 people.
Geography
Greer County is located in the Red Bed Plains region of Oklahoma, and is characterized by rolling hills and flat plains. The county is drained by the North Fork of the Red River, which flows through the county from north to south. The county is also home to several small lakes, including Lake Altus-Lugert, Lake Mangum, and Lake Greer.
The climate of Greer County is semi-arid, with hot summers and mild winters. The average annual temperature is around 65 degrees Fahrenheit, and the average annual precipitation is around 25 inches.
Economy
The economy of Greer County is largely based on agriculture, with wheat, cotton, and sorghum being the main crops. The county is also home to several oil and gas fields, and there are several small businesses in the county, including a few restaurants and retail stores.
Demographics
As of the 2010 census, Greer County had a population of 6,239 people. The racial makeup of the county was 88.3% White, 0.3% African American, 8.2% Native American, 0.2% Asian, 0.1% Pacific Islander, 0.7% from other races, and 2.4% from two or more races. Hispanic or Latino of any race were 2.7% of the population.
The median income for a household in Greer County was $30,938, and the median income for a family was $36,944. The per capita income for the county was $15,945. About 16.2% of families and 19.7% of the population were below the poverty line, including 25.2% of those under age 18 and 14.2% of those age 65 or over.
Education
Greer County is served by the Mangum Public School District, which includes Mangum High School, Mangum Middle School, and Mangum Elementary School. The county is also home to several private schools, including Greer County Christian Academy and Greer County Academy.
Conclusion
Greer County is a rural county located in the southwestern corner of Oklahoma. The county is characterized by rolling hills and flat plains, and is home to several small lakes. The economy of Greer County is largely based on agriculture, with wheat, cotton, and sorghum being the main crops. The population of Greer County is approximately 6,000 people, and the county is served by the Mangum Public School District.
Common Questions
What is Per Capita Income in Greer County?
Per Capita income in Greer County is $22,721.
What is the Median Family Income in Greer County?
Median Family Income in Greer County is $63,970.
What is the Median Household income in Greer County?
Median Household Income in Greer County is $55,204.
What is Income or Wage Gap in Greer County?
Income or Wage Gap in Greer County is 23.8%.
Women in Greer County earn 76.2 cents for every dollar earned by a man.
What is Inequality or Gini Index in Greer County?
Inequality or Gini Index in Greer County is 0.42.
What is the Total Population of Greer County?
Total Population of Greer County is 5,531.
What is the Total Male Population of Greer County?
Total Male Population of Greer County is 3,096.
What is the Total Female Population of Greer County?
Total Female Population of Greer County is 2,435.
What is the Ratio of Males per 100 Females in Greer County?
There are 127.15 Males per 100 Females in Greer County.
What is the Ratio of Females per 100 Males in Greer County?
There are 78.65 Females per 100 Males in Greer County.
What is the Median Population Age in Greer County?
Median Population Age in Greer County is 41.0 Years.
What is the Average Family Size in Greer County
Average Family Size in Greer County is 2.9 People.
What is the Average Household Size in Greer County
Average Household Size in Greer County is 2.3 People.
How Large is the Labor Force in Greer County?
There are 2,064 People in the Labor Forcein in Greer County.
What is the Percentage of People in the Labor Force in Greer County?
45.9% of People are in the Labor Force in Greer County.
What is the Unemployment Rate in Greer County?
Unemployment Rate in Greer County is 5.8%.