Garvin County, OK Map & Demographics
Garvin County Map
Garvin County Overview
$29,270
PER CAPITA INCOME
$64,615
AVG FAMILY INCOME
$53,600
AVG HOUSEHOLD INCOME
34.2%
WAGE / INCOME GAP [ % ]
65.8¢/ $1
WAGE / INCOME GAP [ $ ]
$11,873
FAMILY INCOME DEFICIT
0.44
INEQUALITY / GINI INDEX
25,806
TOTAL POPULATION
12,882
MALE POPULATION
12,924
FEMALE POPULATION
99.68
MALES / 100 FEMALES
100.33
FEMALES / 100 MALES
38.8
MEDIAN AGE
3.2
AVG FAMILY SIZE
2.6
AVG HOUSEHOLD SIZE
11,118
LABOR FORCE [ PEOPLE ]
55.1%
PERCENT IN LABOR FORCE
2.8%
UNEMPLOYMENT RATE
Income in Garvin County
Income Overview in Garvin County
Per Capita Income in Garvin County is $29,270, while median incomes of families and households are $64,615 and $53,600 respectively.
| Characteristic | Number | Measure |
| Per Capita Income | 25,806 | $29,270 |
| Median Family Income | 6,336 | $64,615 |
| Mean Family Income | 6,336 | $83,629 |
| Median Household Income | 9,906 | $53,600 |
| Mean Household Income | 9,906 | $72,476 |
| Income Deficit | 6,336 | $11,873 |
| Wage / Income Gap (%) | 25,806 | 34.25% |
| Wage / Income Gap ($) | 25,806 | 65.75¢ per $1 |
| Gini / Inequality Index | 25,806 | 0.44 |
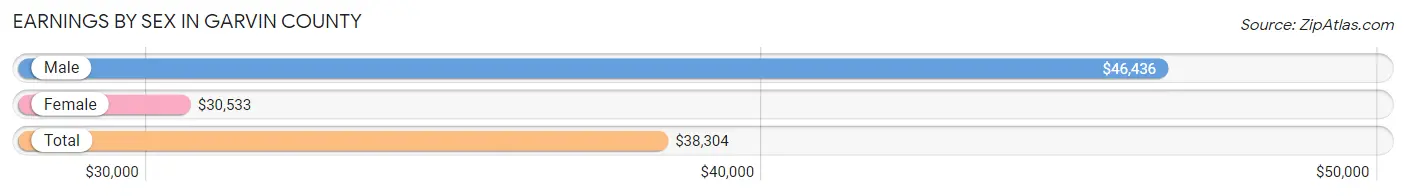
Earnings by Sex in Garvin County
Average Earnings in Garvin County are $38,304, $46,436 for men and $30,533 for women, a difference of 34.3%.
| Sex | Number | Average Earnings |
| Male | 6,337 (55.9%) | $46,436 |
| Female | 5,006 (44.1%) | $30,533 |
| Total | 11,343 (100.0%) | $38,304 |
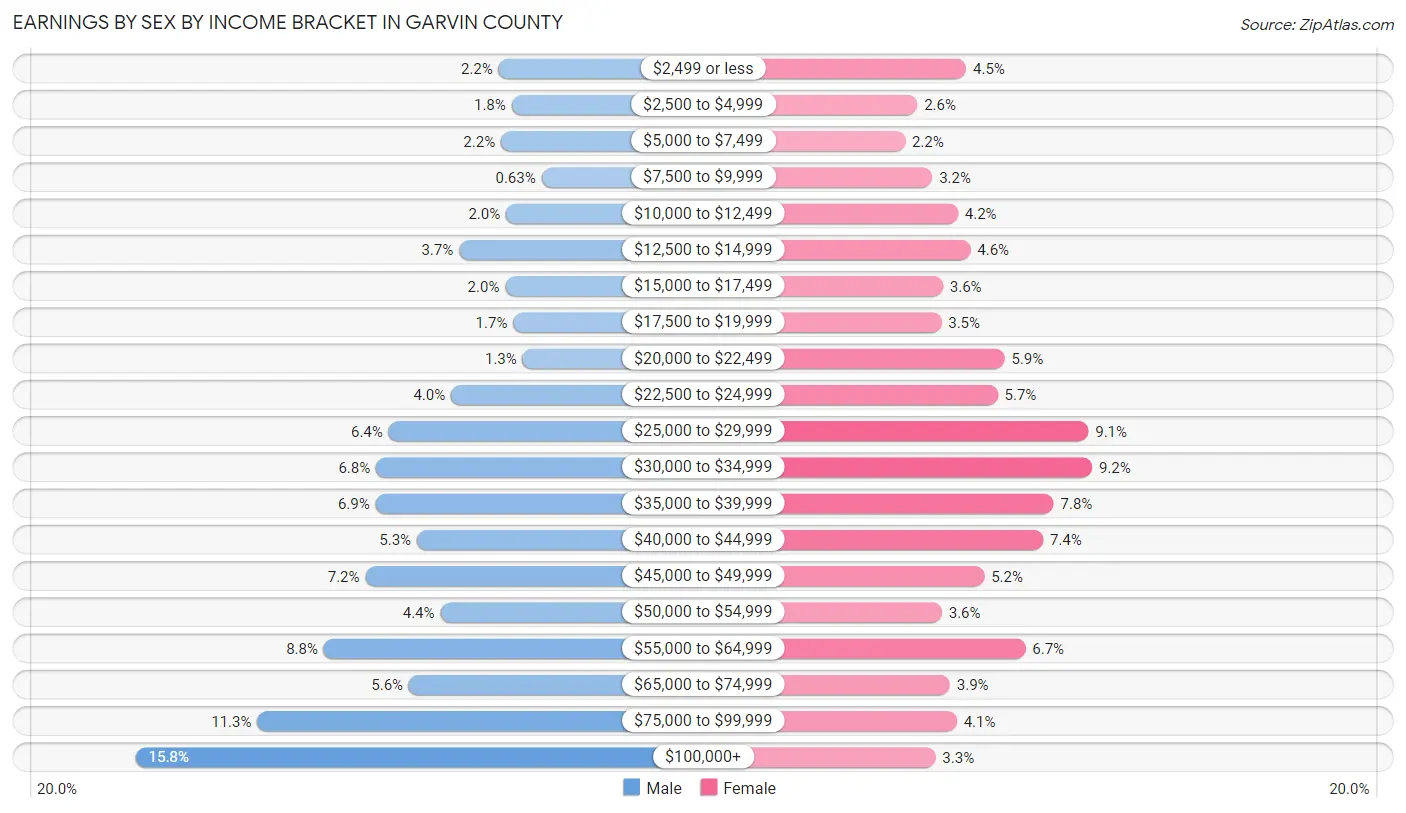
Earnings by Sex by Income Bracket in Garvin County
The most common earnings brackets in Garvin County are $100,000+ for men (1,004 | 15.8%) and $30,000 to $34,999 for women (460 | 9.2%).
| Income | Male | Female |
| $2,499 or less | 142 (2.2%) | 224 (4.5%) |
| $2,500 to $4,999 | 111 (1.8%) | 132 (2.6%) |
| $5,000 to $7,499 | 136 (2.1%) | 109 (2.2%) |
| $7,500 to $9,999 | 40 (0.6%) | 160 (3.2%) |
| $10,000 to $12,499 | 124 (2.0%) | 208 (4.2%) |
| $12,500 to $14,999 | 236 (3.7%) | 232 (4.6%) |
| $15,000 to $17,499 | 126 (2.0%) | 180 (3.6%) |
| $17,500 to $19,999 | 107 (1.7%) | 177 (3.5%) |
| $20,000 to $22,499 | 85 (1.3%) | 296 (5.9%) |
| $22,500 to $24,999 | 255 (4.0%) | 283 (5.7%) |
| $25,000 to $29,999 | 403 (6.4%) | 453 (9.0%) |
| $30,000 to $34,999 | 433 (6.8%) | 460 (9.2%) |
| $35,000 to $39,999 | 434 (6.9%) | 388 (7.7%) |
| $40,000 to $44,999 | 336 (5.3%) | 368 (7.3%) |
| $45,000 to $49,999 | 458 (7.2%) | 258 (5.1%) |
| $50,000 to $54,999 | 280 (4.4%) | 178 (3.6%) |
| $55,000 to $64,999 | 557 (8.8%) | 335 (6.7%) |
| $65,000 to $74,999 | 355 (5.6%) | 193 (3.9%) |
| $75,000 to $99,999 | 715 (11.3%) | 206 (4.1%) |
| $100,000+ | 1,004 (15.8%) | 166 (3.3%) |
| Total | 6,337 (100.0%) | 5,006 (100.0%) |
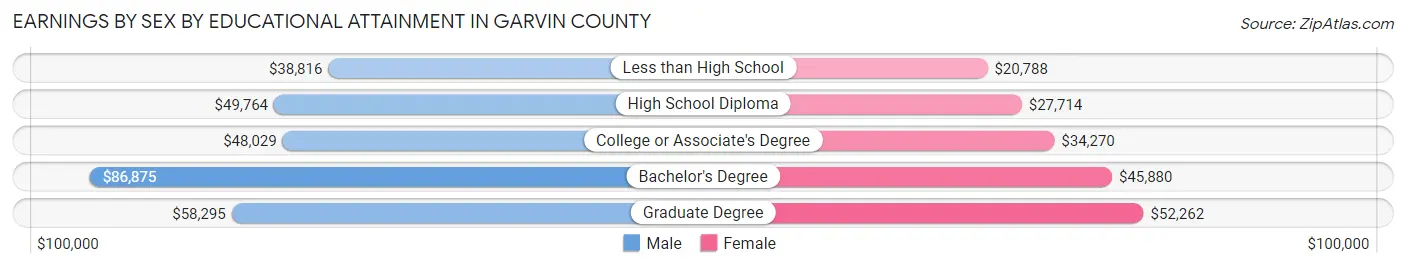
Earnings by Sex by Educational Attainment in Garvin County
Average earnings in Garvin County are $51,173 for men and $33,991 for women, a difference of 33.6%. Men with an educational attainment of bachelor's degree enjoy the highest average annual earnings of $86,875, while those with less than high school education earn the least with $38,816. Women with an educational attainment of graduate degree earn the most with the average annual earnings of $52,262, while those with less than high school education have the smallest earnings of $20,788.
| Educational Attainment | Male Income | Female Income |
| Less than High School | $38,816 | $20,788 |
| High School Diploma | $49,764 | $27,714 |
| College or Associate's Degree | $48,029 | $34,270 |
| Bachelor's Degree | $86,875 | $45,880 |
| Graduate Degree | $58,295 | $52,262 |
| Total | $51,173 | $33,991 |
Family Income in Garvin County
Family Income Brackets in Garvin County
According to the Garvin County family income data, there are 1,255 families falling into the $50,000 to $74,999 income range, which is the most common income bracket and makes up 19.8% of all families. Conversely, the $10,000 to $14,999 income bracket is the least frequent group with only 158 families (2.5%) belonging to this category.
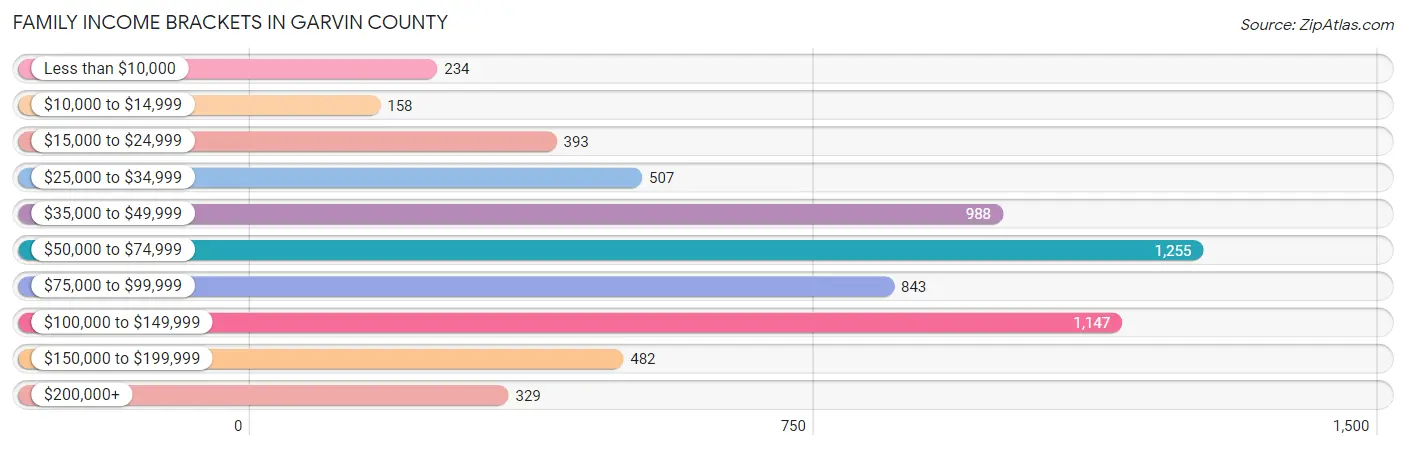
| Income Bracket | # Families | % Families |
| Less than $10,000 | 234 | 3.7% |
| $10,000 to $14,999 | 158 | 2.5% |
| $15,000 to $24,999 | 393 | 6.2% |
| $25,000 to $34,999 | 507 | 8.0% |
| $35,000 to $49,999 | 988 | 15.6% |
| $50,000 to $74,999 | 1,255 | 19.8% |
| $75,000 to $99,999 | 843 | 13.3% |
| $100,000 to $149,999 | 1,147 | 18.1% |
| $150,000 to $199,999 | 482 | 7.6% |
| $200,000+ | 329 | 5.2% |
Family Income by Famaliy Size in Garvin County
5-person families (560 | 8.8%) account for the highest median family income in Garvin County with $100,833 per family, while 2-person families (3,179 | 50.2%) have the highest median income of $28,880 per family member.
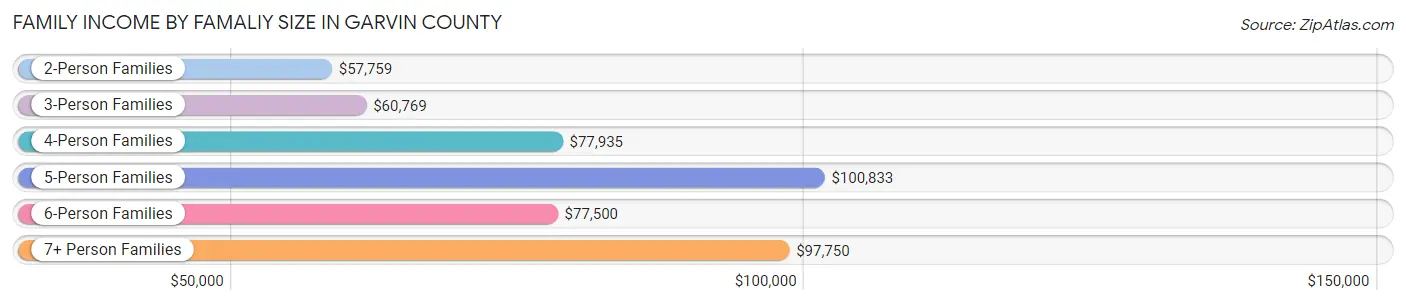
| Income Bracket | # Families | Median Income |
| 2-Person Families | 3,179 (50.2%) | $57,759 |
| 3-Person Families | 1,224 (19.3%) | $60,769 |
| 4-Person Families | 1,136 (17.9%) | $77,935 |
| 5-Person Families | 560 (8.8%) | $100,833 |
| 6-Person Families | 150 (2.4%) | $77,500 |
| 7+ Person Families | 87 (1.4%) | $97,750 |
| Total | 6,336 (100.0%) | $64,615 |
Family Income by Number of Earners in Garvin County
The median family income in Garvin County is $64,615, with families comprising 3+ earners (350) having the highest median family income of $115,000, while families with no earners (1,414) have the lowest median family income of $38,813, accounting for 5.5% and 22.3% of families, respectively.
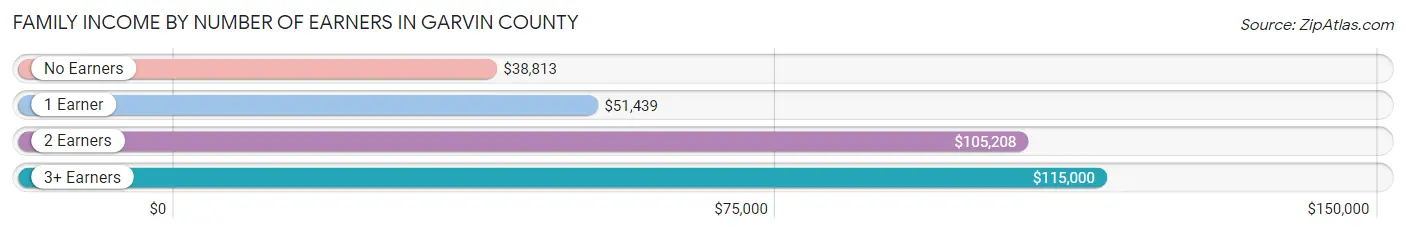
| Number of Earners | # Families | Median Income |
| No Earners | 1,414 (22.3%) | $38,813 |
| 1 Earner | 2,381 (37.6%) | $51,439 |
| 2 Earners | 2,191 (34.6%) | $105,208 |
| 3+ Earners | 350 (5.5%) | $115,000 |
| Total | 6,336 (100.0%) | $64,615 |
Household Income in Garvin County
Household Income Brackets in Garvin County
With 1,803 households falling in the category, the $50,000 to $74,999 income range is the most frequent in Garvin County, accounting for 18.2% of all households. In contrast, only 416 households (4.2%) fall into the less than $10,000 income bracket, making it the least populous group.
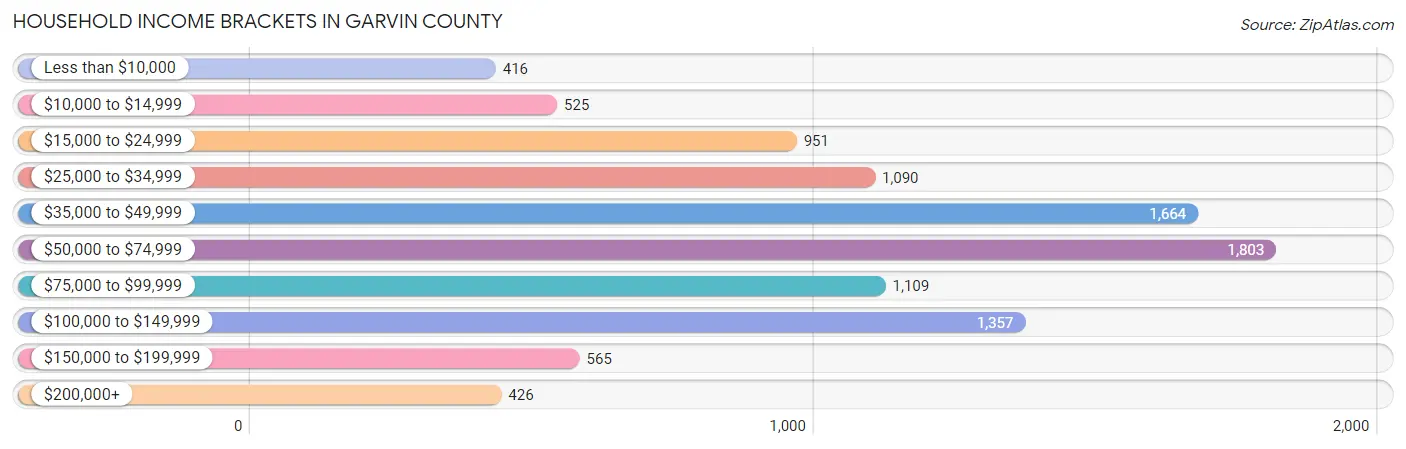
| Income Bracket | # Households | % Households |
| Less than $10,000 | 416 | 4.2% |
| $10,000 to $14,999 | 525 | 5.3% |
| $15,000 to $24,999 | 951 | 9.6% |
| $25,000 to $34,999 | 1,090 | 11.0% |
| $35,000 to $49,999 | 1,664 | 16.8% |
| $50,000 to $74,999 | 1,803 | 18.2% |
| $75,000 to $99,999 | 1,109 | 11.2% |
| $100,000 to $149,999 | 1,357 | 13.7% |
| $150,000 to $199,999 | 565 | 5.7% |
| $200,000+ | 426 | 4.3% |
Household Income by Householder Age in Garvin County
The median household income in Garvin County is $53,600, with the highest median household income of $62,781 found in the 45 to 64 years age bracket for the primary householder. A total of 3,557 households (35.9%) fall into this category. Meanwhile, the 15 to 24 years age bracket for the primary householder has the lowest median household income of $38,333, with 422 households (4.3%) in this group.
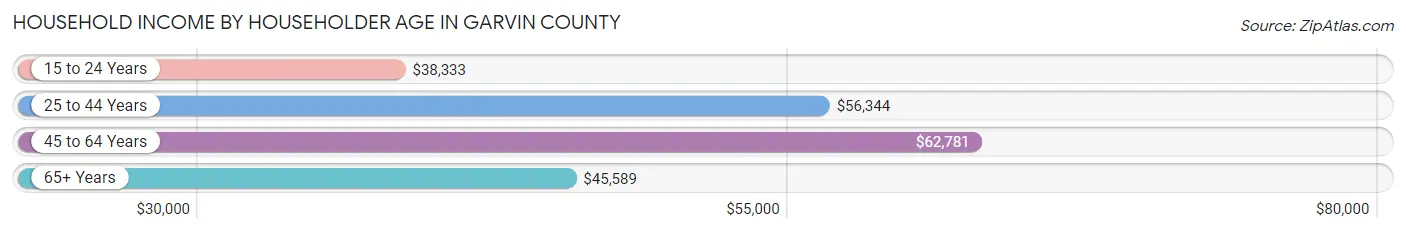
| Income Bracket | # Households | Median Income |
| 15 to 24 Years | 422 (4.3%) | $38,333 |
| 25 to 44 Years | 3,088 (31.2%) | $56,344 |
| 45 to 64 Years | 3,557 (35.9%) | $62,781 |
| 65+ Years | 2,839 (28.7%) | $45,589 |
| Total | 9,906 (100.0%) | $53,600 |
Poverty in Garvin County
Income Below Poverty by Sex and Age in Garvin County
With 13.1% poverty level for males and 16.3% for females among the residents of Garvin County, under 5 year old males and 5 year old females are the most vulnerable to poverty, with 222 males (29.4%) and 37 females (31.4%) in their respective age groups living below the poverty level.
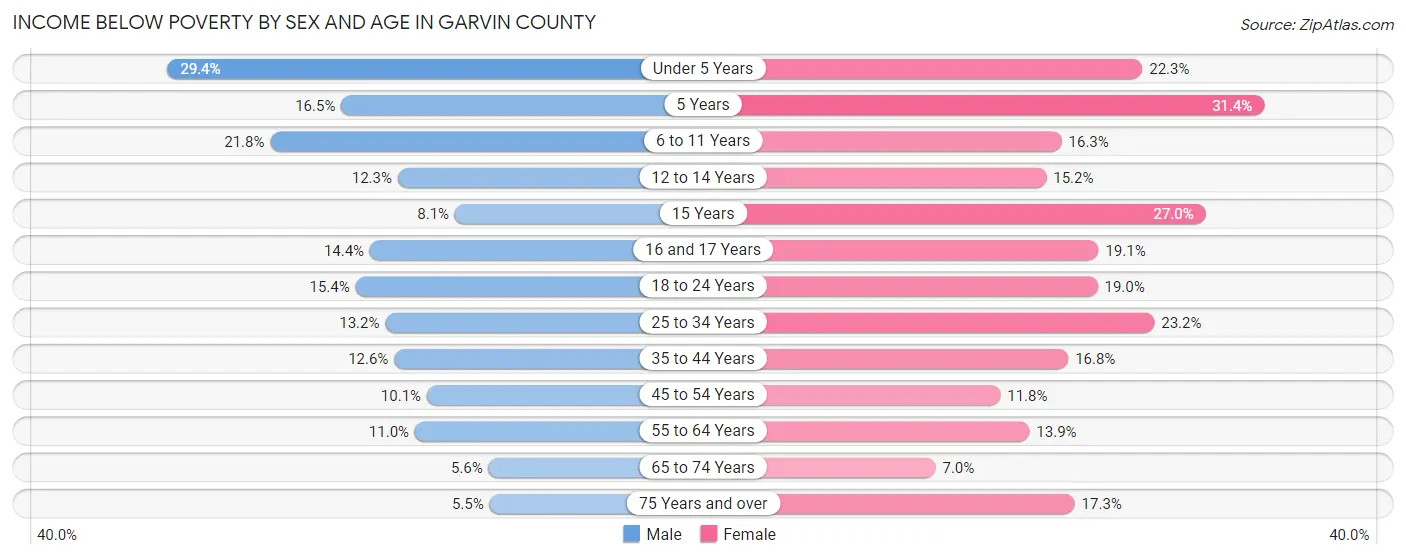
| Age Bracket | Male | Female |
| Under 5 Years | 222 (29.4%) | 162 (22.3%) |
| 5 Years | 32 (16.5%) | 37 (31.4%) |
| 6 to 11 Years | 223 (21.8%) | 180 (16.3%) |
| 12 to 14 Years | 79 (12.3%) | 78 (15.2%) |
| 15 Years | 12 (8.1%) | 47 (27.0%) |
| 16 and 17 Years | 59 (14.4%) | 73 (19.1%) |
| 18 to 24 Years | 173 (15.4%) | 191 (19.0%) |
| 25 to 34 Years | 189 (13.2%) | 347 (23.2%) |
| 35 to 44 Years | 215 (12.6%) | 267 (16.8%) |
| 45 to 54 Years | 160 (10.1%) | 171 (11.8%) |
| 55 to 64 Years | 167 (11.0%) | 243 (13.9%) |
| 65 to 74 Years | 70 (5.6%) | 94 (7.0%) |
| 75 Years and over | 43 (5.5%) | 191 (17.3%) |
| Total | 1,644 (13.1%) | 2,081 (16.3%) |
Income Above Poverty by Sex and Age in Garvin County
According to the poverty statistics in Garvin County, males aged 75 years and over and females aged 65 to 74 years are the age groups that are most secure financially, with 94.5% of males and 93.0% of females in these age groups living above the poverty line.
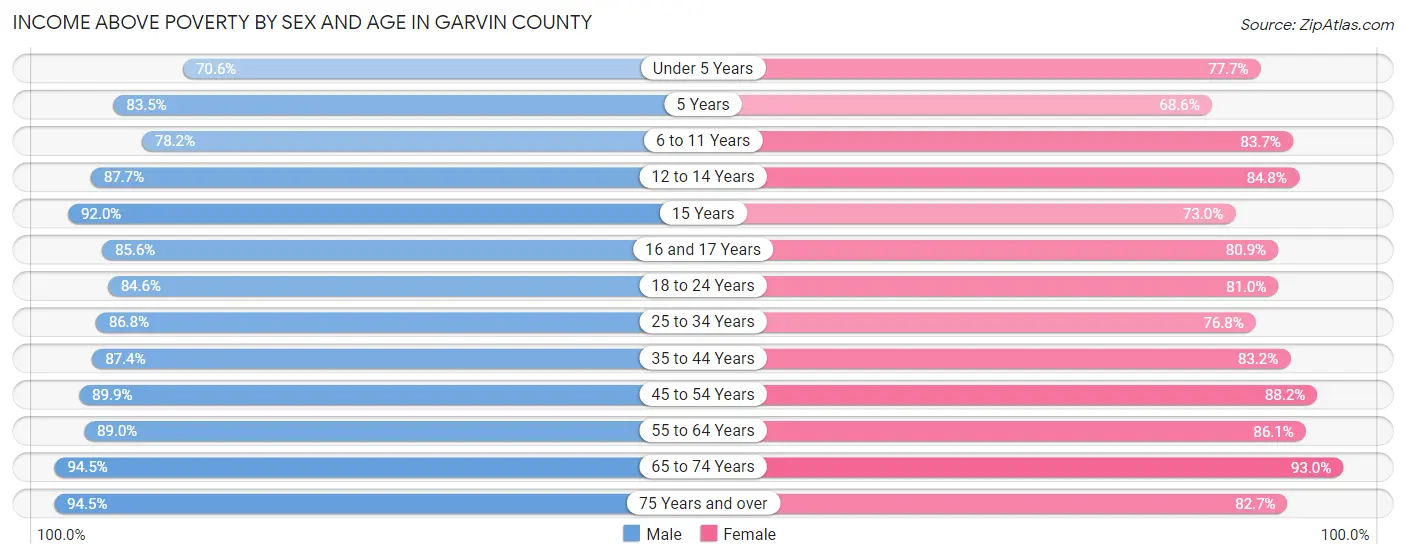
| Age Bracket | Male | Female |
| Under 5 Years | 533 (70.6%) | 564 (77.7%) |
| 5 Years | 162 (83.5%) | 81 (68.6%) |
| 6 to 11 Years | 802 (78.2%) | 923 (83.7%) |
| 12 to 14 Years | 564 (87.7%) | 436 (84.8%) |
| 15 Years | 137 (91.9%) | 127 (73.0%) |
| 16 and 17 Years | 352 (85.6%) | 310 (80.9%) |
| 18 to 24 Years | 948 (84.6%) | 815 (81.0%) |
| 25 to 34 Years | 1,241 (86.8%) | 1,149 (76.8%) |
| 35 to 44 Years | 1,497 (87.4%) | 1,321 (83.2%) |
| 45 to 54 Years | 1,420 (89.9%) | 1,282 (88.2%) |
| 55 to 64 Years | 1,349 (89.0%) | 1,502 (86.1%) |
| 65 to 74 Years | 1,192 (94.5%) | 1,257 (93.0%) |
| 75 Years and over | 742 (94.5%) | 914 (82.7%) |
| Total | 10,939 (86.9%) | 10,681 (83.7%) |
Income Below Poverty Among Married-Couple Families in Garvin County
The poverty statistics for married-couple families in Garvin County show that 4.9% or 225 of the total 4,609 families live below the poverty line. Families with 5 or more children have the highest poverty rate of 12.1%, comprising of 4 families. On the other hand, families with no children have the lowest poverty rate of 2.8%, which includes 77 families.
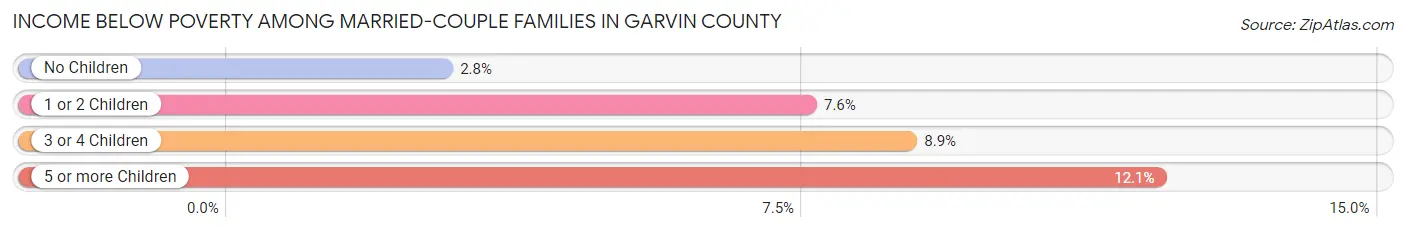
| Children | Above Poverty | Below Poverty |
| No Children | 2,664 (97.2%) | 77 (2.8%) |
| 1 or 2 Children | 1,321 (92.4%) | 108 (7.6%) |
| 3 or 4 Children | 370 (91.1%) | 36 (8.9%) |
| 5 or more Children | 29 (87.9%) | 4 (12.1%) |
| Total | 4,384 (95.1%) | 225 (4.9%) |
Income Below Poverty Among Single-Parent Households in Garvin County
According to the poverty data in Garvin County, 14.5% or 71 single-father households and 30.9% or 382 single-mother households are living below the poverty line. Among single-father households, those with 3 or 4 children have the highest poverty rate, with 9 households (15.0%) experiencing poverty. Likewise, among single-mother households, those with 5 or more children have the highest poverty rate, with 16 households (66.7%) falling below the poverty line.
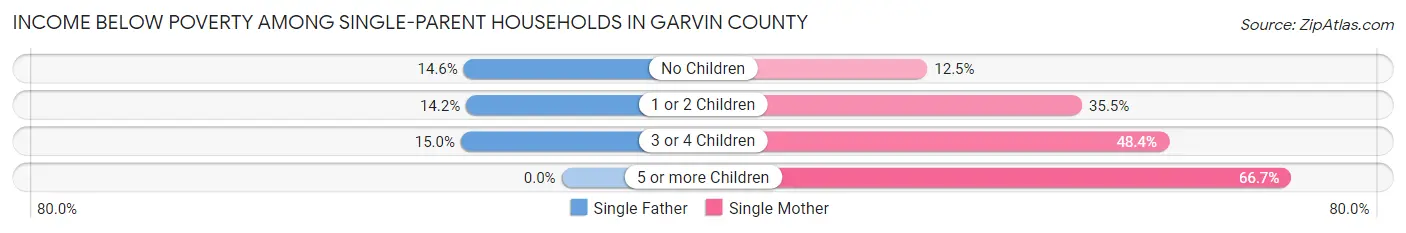
| Children | Single Father | Single Mother |
| No Children | 28 (14.6%) | 46 (12.5%) |
| 1 or 2 Children | 34 (14.2%) | 243 (35.5%) |
| 3 or 4 Children | 9 (15.0%) | 77 (48.4%) |
| 5 or more Children | 0 (0.0%) | 16 (66.7%) |
| Total | 71 (14.5%) | 382 (30.9%) |
Income Below Poverty Among Married-Couple vs Single-Parent Households in Garvin County
The poverty data for Garvin County shows that 225 of the married-couple family households (4.9%) and 453 of the single-parent households (26.2%) are living below the poverty level. Within the married-couple family households, those with 5 or more children have the highest poverty rate, with 4 households (12.1%) falling below the poverty line. Among the single-parent households, those with 5 or more children have the highest poverty rate, with 16 household (66.7%) living below poverty.
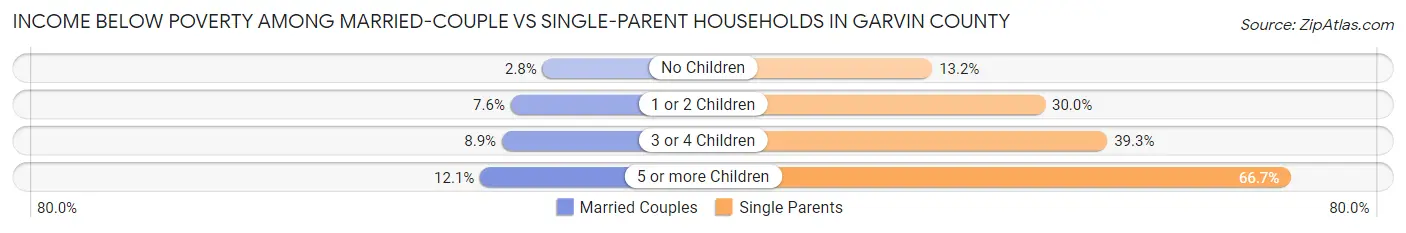
| Children | Married-Couple Families | Single-Parent Households |
| No Children | 77 (2.8%) | 74 (13.2%) |
| 1 or 2 Children | 108 (7.6%) | 277 (30.0%) |
| 3 or 4 Children | 36 (8.9%) | 86 (39.3%) |
| 5 or more Children | 4 (12.1%) | 16 (66.7%) |
| Total | 225 (4.9%) | 453 (26.2%) |
Race in Garvin County
The most populous races in Garvin County are White / Caucasian (20,654 | 80.0%), Two or more Races (3,187 | 12.3%), and Hispanic or Latino (2,617 | 10.1%).
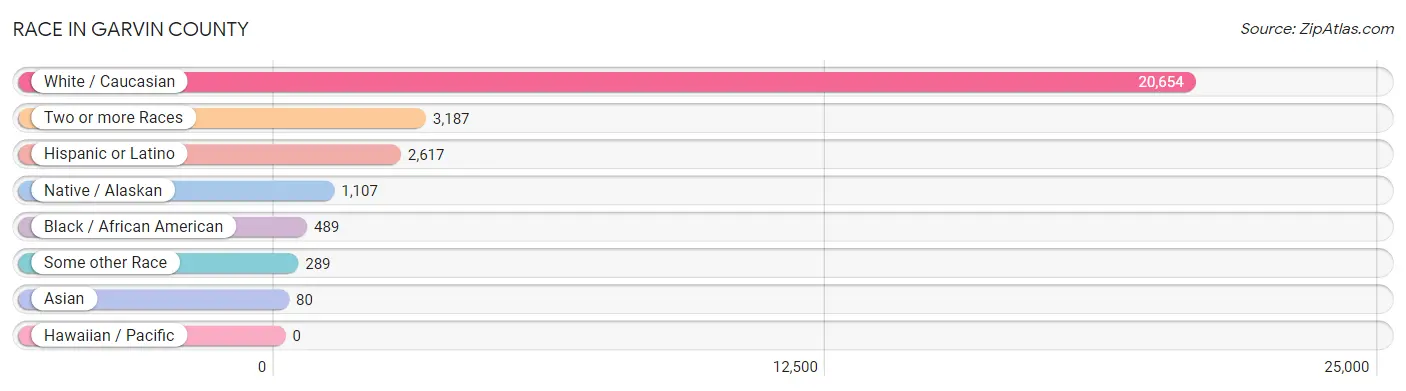
| Race | # Population | % Population |
| Asian | 80 | 0.3% |
| Black / African American | 489 | 1.9% |
| Hawaiian / Pacific | 0 | 0.0% |
| Hispanic or Latino | 2,617 | 10.1% |
| Native / Alaskan | 1,107 | 4.3% |
| White / Caucasian | 20,654 | 80.0% |
| Two or more Races | 3,187 | 12.3% |
| Some other Race | 289 | 1.1% |
| Total | 25,806 | 100.0% |
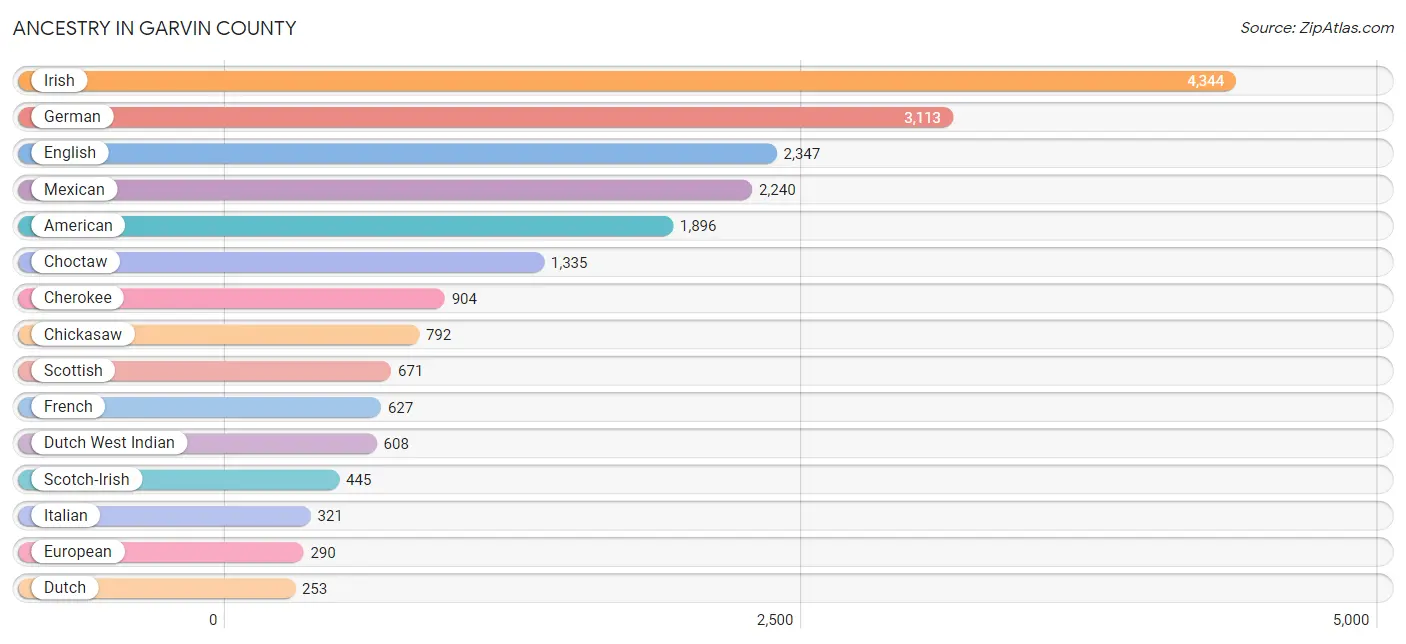
Ancestry in Garvin County
The most populous ancestries reported in Garvin County are Irish (4,344 | 16.8%), German (3,113 | 12.1%), English (2,347 | 9.1%), Mexican (2,240 | 8.7%), and American (1,896 | 7.3%), together accounting for 54.0% of all Garvin County residents.
| Ancestry | # Population | % Population |
| African | 16 | 0.1% |
| Albanian | 5 | 0.0% |
| American | 1,896 | 7.3% |
| Apache | 30 | 0.1% |
| Arab | 18 | 0.1% |
| Arapaho | 7 | 0.0% |
| Armenian | 15 | 0.1% |
| Assyrian / Chaldean / Syriac | 10 | 0.0% |
| Austrian | 47 | 0.2% |
| Barbadian | 11 | 0.0% |
| Belgian | 10 | 0.0% |
| Blackfeet | 12 | 0.1% |
| British | 117 | 0.4% |
| Cajun | 2 | 0.0% |
| Canadian | 2 | 0.0% |
| Central American | 187 | 0.7% |
| Cherokee | 904 | 3.5% |
| Cheyenne | 36 | 0.1% |
| Chickasaw | 792 | 3.1% |
| Choctaw | 1,335 | 5.2% |
| Colombian | 1 | 0.0% |
| Comanche | 46 | 0.2% |
| Creek | 92 | 0.4% |
| Cuban | 5 | 0.0% |
| Czech | 30 | 0.1% |
| Czechoslovakian | 85 | 0.3% |
| Danish | 28 | 0.1% |
| Delaware | 10 | 0.0% |
| Dutch | 253 | 1.0% |
| Dutch West Indian | 608 | 2.4% |
| Eastern European | 53 | 0.2% |
| English | 2,347 | 9.1% |
| European | 290 | 1.1% |
| Filipino | 24 | 0.1% |
| Finnish | 3 | 0.0% |
| French | 627 | 2.4% |
| French Canadian | 30 | 0.1% |
| German | 3,113 | 12.1% |
| German Russian | 1 | 0.0% |
| Greek | 13 | 0.1% |
| Guatemalan | 14 | 0.1% |
| Honduran | 23 | 0.1% |
| Houma | 12 | 0.1% |
| Hungarian | 11 | 0.0% |
| Indian (Asian) | 41 | 0.2% |
| Irish | 4,344 | 16.8% |
| Israeli | 10 | 0.0% |
| Italian | 321 | 1.2% |
| Kiowa | 1 | 0.0% |
| Korean | 69 | 0.3% |
| Lebanese | 14 | 0.1% |
| Mexican | 2,240 | 8.7% |
| Navajo | 9 | 0.0% |
| Nigerian | 4 | 0.0% |
| Northern European | 8 | 0.0% |
| Norwegian | 86 | 0.3% |
| Osage | 13 | 0.1% |
| Pakistani | 19 | 0.1% |
| Pennsylvania German | 7 | 0.0% |
| Pima | 6 | 0.0% |
| Polish | 126 | 0.5% |
| Portuguese | 44 | 0.2% |
| Potawatomi | 87 | 0.3% |
| Pueblo | 1 | 0.0% |
| Puerto Rican | 20 | 0.1% |
| Russian | 138 | 0.5% |
| Salvadoran | 150 | 0.6% |
| Samoan | 1 | 0.0% |
| Scandinavian | 133 | 0.5% |
| Scotch-Irish | 445 | 1.7% |
| Scottish | 671 | 2.6% |
| Seminole | 24 | 0.1% |
| Shoshone | 2 | 0.0% |
| Sioux | 8 | 0.0% |
| Slavic | 11 | 0.0% |
| Slovak | 10 | 0.0% |
| South American | 1 | 0.0% |
| Spaniard | 102 | 0.4% |
| Spanish | 36 | 0.1% |
| Spanish American | 3 | 0.0% |
| Sri Lankan | 25 | 0.1% |
| Subsaharan African | 20 | 0.1% |
| Swedish | 148 | 0.6% |
| Swiss | 11 | 0.0% |
| Thai | 41 | 0.2% |
| Turkish | 2 | 0.0% |
| Welsh | 83 | 0.3% |
| West Indian | 5 | 0.0% |
| Yuman | 5 | 0.0% | View All 89 Rows |
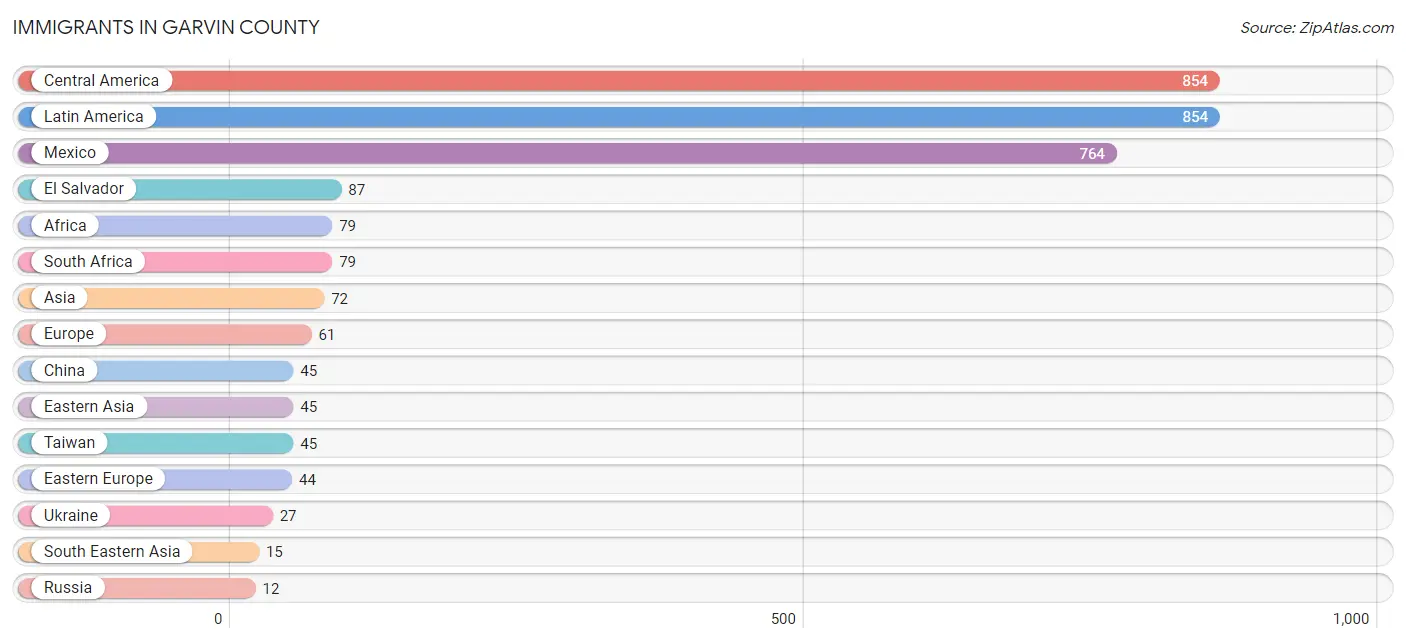
Immigrants in Garvin County
The most numerous immigrant groups reported in Garvin County came from Central America (854 | 3.3%), Latin America (854 | 3.3%), Mexico (764 | 3.0%), El Salvador (87 | 0.3%), and Africa (79 | 0.3%), together accounting for 10.2% of all Garvin County residents.
| Immigration Origin | # Population | % Population |
| Africa | 79 | 0.3% |
| Asia | 72 | 0.3% |
| Central America | 854 | 3.3% |
| China | 45 | 0.2% |
| Eastern Asia | 45 | 0.2% |
| Eastern Europe | 44 | 0.2% |
| El Salvador | 87 | 0.3% |
| Europe | 61 | 0.2% |
| Germany | 4 | 0.0% |
| Guatemala | 3 | 0.0% |
| India | 8 | 0.0% |
| Jordan | 2 | 0.0% |
| Latin America | 854 | 3.3% |
| Mexico | 764 | 3.0% |
| Netherlands | 4 | 0.0% |
| Northern Europe | 9 | 0.0% |
| Philippines | 8 | 0.0% |
| Russia | 12 | 0.1% |
| South Africa | 79 | 0.3% |
| South Central Asia | 8 | 0.0% |
| South Eastern Asia | 15 | 0.1% |
| Syria | 2 | 0.0% |
| Taiwan | 45 | 0.2% |
| Thailand | 7 | 0.0% |
| Ukraine | 27 | 0.1% |
| Western Asia | 4 | 0.0% |
| Western Europe | 8 | 0.0% | View All 27 Rows |
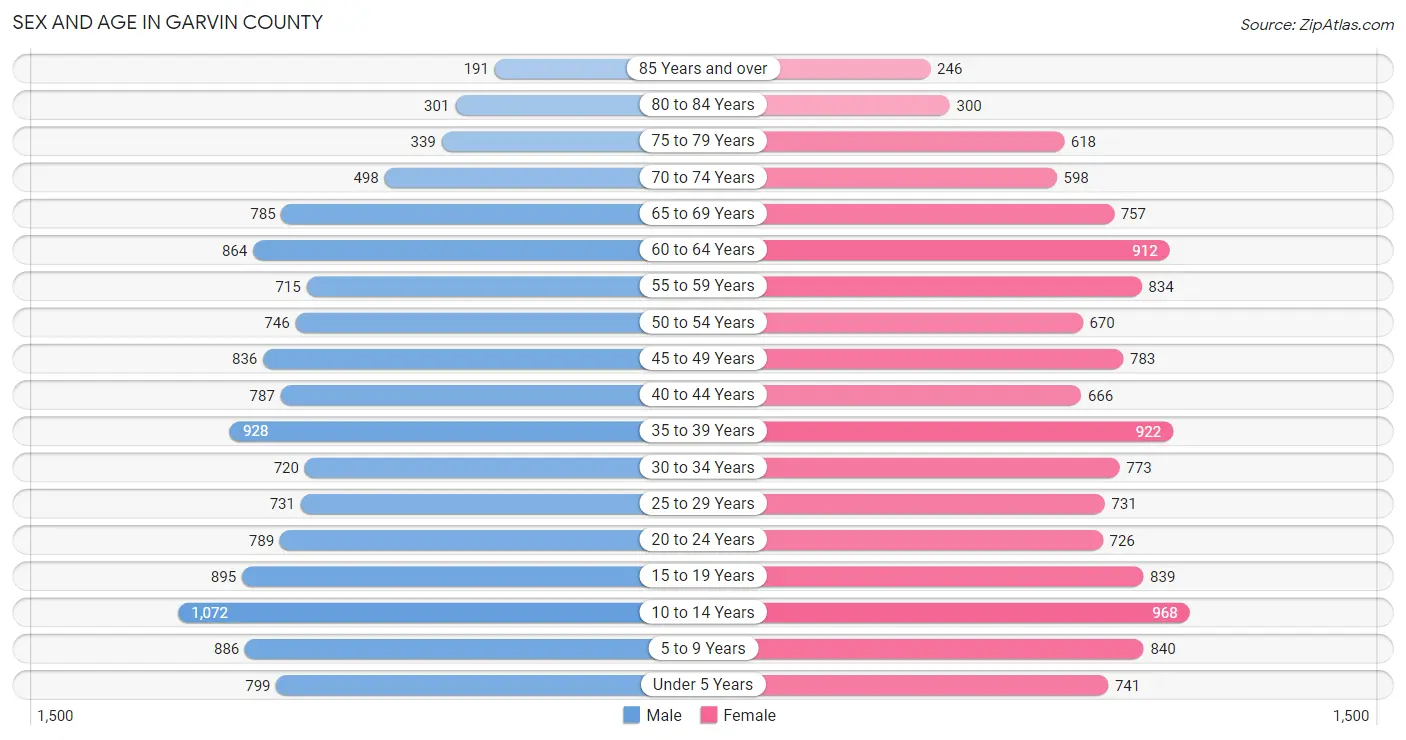
Sex and Age in Garvin County
Sex and Age in Garvin County
The most populous age groups in Garvin County are 10 to 14 Years (1,072 | 8.3%) for men and 10 to 14 Years (968 | 7.5%) for women.
| Age Bracket | Male | Female |
| Under 5 Years | 799 (6.2%) | 741 (5.7%) |
| 5 to 9 Years | 886 (6.9%) | 840 (6.5%) |
| 10 to 14 Years | 1,072 (8.3%) | 968 (7.5%) |
| 15 to 19 Years | 895 (7.0%) | 839 (6.5%) |
| 20 to 24 Years | 789 (6.1%) | 726 (5.6%) |
| 25 to 29 Years | 731 (5.7%) | 731 (5.7%) |
| 30 to 34 Years | 720 (5.6%) | 773 (6.0%) |
| 35 to 39 Years | 928 (7.2%) | 922 (7.1%) |
| 40 to 44 Years | 787 (6.1%) | 666 (5.1%) |
| 45 to 49 Years | 836 (6.5%) | 783 (6.1%) |
| 50 to 54 Years | 746 (5.8%) | 670 (5.2%) |
| 55 to 59 Years | 715 (5.6%) | 834 (6.5%) |
| 60 to 64 Years | 864 (6.7%) | 912 (7.1%) |
| 65 to 69 Years | 785 (6.1%) | 757 (5.9%) |
| 70 to 74 Years | 498 (3.9%) | 598 (4.6%) |
| 75 to 79 Years | 339 (2.6%) | 618 (4.8%) |
| 80 to 84 Years | 301 (2.3%) | 300 (2.3%) |
| 85 Years and over | 191 (1.5%) | 246 (1.9%) |
| Total | 12,882 (100.0%) | 12,924 (100.0%) |
Families and Households in Garvin County
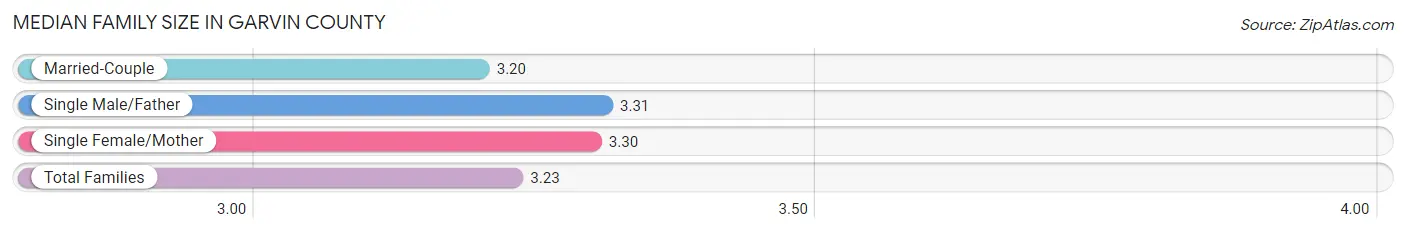
Median Family Size in Garvin County
The median family size in Garvin County is 3.23 persons per family, with single male/father families (491 | 7.7%) accounting for the largest median family size of 3.31 persons per family. On the other hand, married-couple families (4,609 | 72.7%) represent the smallest median family size with 3.20 persons per family.
| Family Type | # Families | Family Size |
| Married-Couple | 4,609 (72.7%) | 3.20 |
| Single Male/Father | 491 (7.7%) | 3.31 |
| Single Female/Mother | 1,236 (19.5%) | 3.30 |
| Total Families | 6,336 (100.0%) | 3.23 |
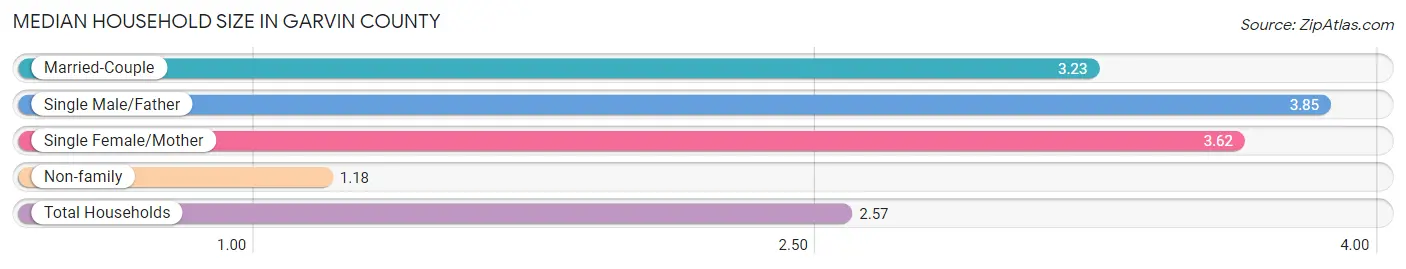
Median Household Size in Garvin County
The median household size in Garvin County is 2.57 persons per household, with single male/father households (491 | 5.0%) accounting for the largest median household size of 3.85 persons per household. non-family households (3,570 | 36.0%) represent the smallest median household size with 1.18 persons per household.
| Household Type | # Households | Household Size |
| Married-Couple | 4,609 (46.5%) | 3.23 |
| Single Male/Father | 491 (5.0%) | 3.85 |
| Single Female/Mother | 1,236 (12.5%) | 3.62 |
| Non-family | 3,570 (36.0%) | 1.18 |
| Total Households | 9,906 (100.0%) | 2.57 |
Household Size by Marriage Status in Garvin County
Out of a total of 9,906 households in Garvin County, 6,336 (64.0%) are family households, while 3,570 (36.0%) are nonfamily households. The most numerous type of family households are 2-person households, comprising 2,995, and the most common type of nonfamily households are 1-person households, comprising 3,151.
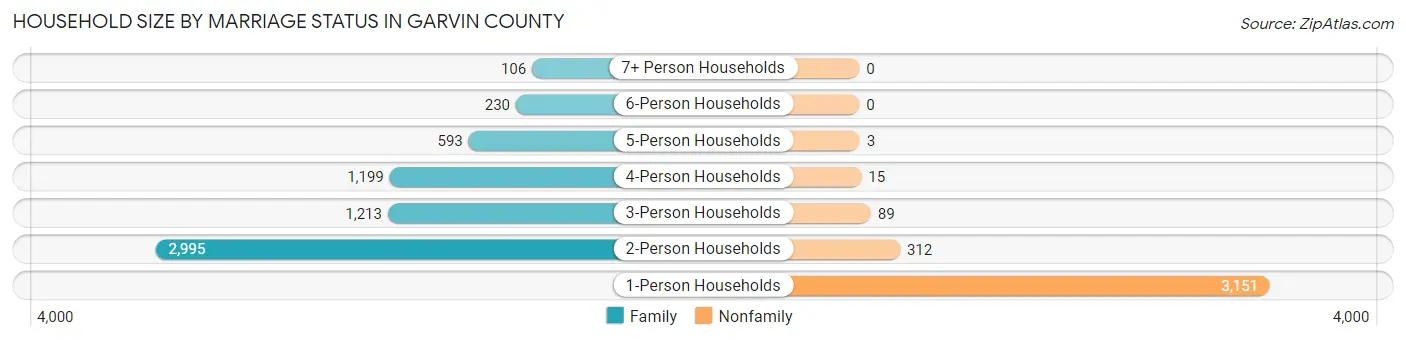
| Household Size | Family Households | Nonfamily Households |
| 1-Person Households | - | 3,151 (31.8%) |
| 2-Person Households | 2,995 (30.2%) | 312 (3.2%) |
| 3-Person Households | 1,213 (12.2%) | 89 (0.9%) |
| 4-Person Households | 1,199 (12.1%) | 15 (0.2%) |
| 5-Person Households | 593 (6.0%) | 3 (0.0%) |
| 6-Person Households | 230 (2.3%) | 0 (0.0%) |
| 7+ Person Households | 106 (1.1%) | 0 (0.0%) |
| Total | 6,336 (64.0%) | 3,570 (36.0%) |
Female Fertility in Garvin County
Fertility by Age in Garvin County
Average fertility rate in Garvin County is 53.0 births per 1,000 women. Women in the age bracket of 20 to 34 years have the highest fertility rate with 79.0 births per 1,000 women. Women in the age bracket of 20 to 34 years acount for 59.1% of all women with births.
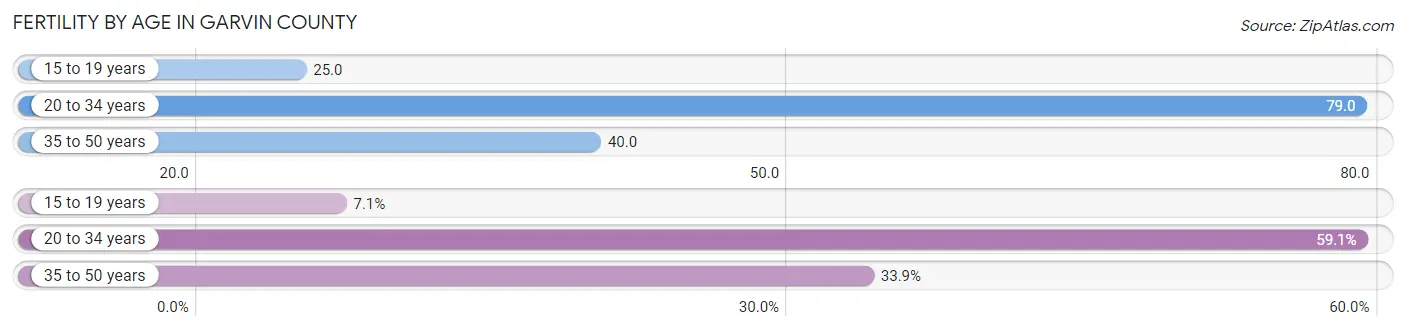
| Age Bracket | Women with Births | Births / 1,000 Women |
| 15 to 19 years | 21 (7.0%) | 25.0 |
| 20 to 34 years | 176 (59.1%) | 79.0 |
| 35 to 50 years | 101 (33.9%) | 40.0 |
| Total | 298 (100.0%) | 53.0 |
Fertility by Age by Marriage Status in Garvin County
61.1% of women with births (298) in Garvin County are married. The highest percentage of unmarried women with births falls into 15 to 19 years age bracket with 100.0% of them unmarried at the time of birth, while the lowest percentage of unmarried women with births belong to 20 to 34 years age bracket with 30.1% of them unmarried.
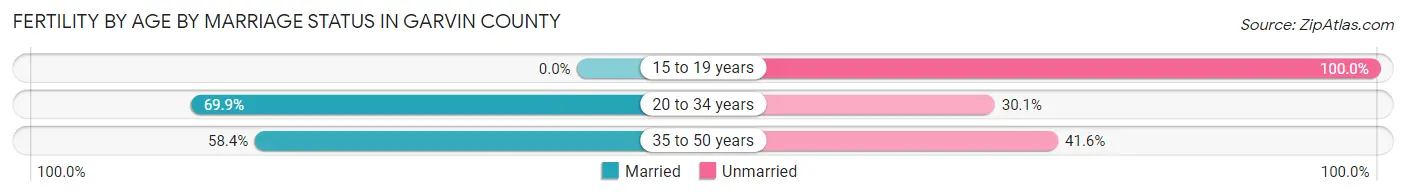
| Age Bracket | Married | Unmarried |
| 15 to 19 years | 0 (0.0%) | 21 (100.0%) |
| 20 to 34 years | 123 (69.9%) | 53 (30.1%) |
| 35 to 50 years | 59 (58.4%) | 42 (41.6%) |
| Total | 182 (61.1%) | 116 (38.9%) |
Fertility by Education in Garvin County
Average fertility rate in Garvin County is 53.0 births per 1,000 women. Women with the education attainment of high school diploma have the highest fertility rate of 62.0 births per 1,000 women, while women with the education attainment of bachelor's degree have the lowest fertility at 47.0 births per 1,000 women. Women with the education attainment of high school diploma represent 34.9% of all women with births.
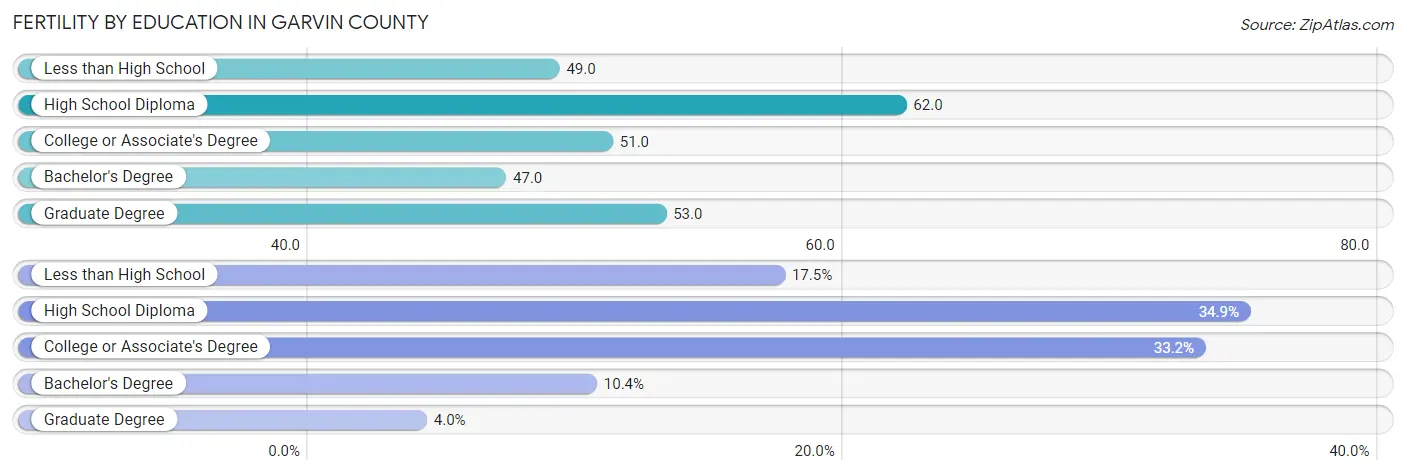
| Educational Attainment | Women with Births | Births / 1,000 Women |
| Less than High School | 52 (17.4%) | 49.0 |
| High School Diploma | 104 (34.9%) | 62.0 |
| College or Associate's Degree | 99 (33.2%) | 51.0 |
| Bachelor's Degree | 31 (10.4%) | 47.0 |
| Graduate Degree | 12 (4.0%) | 53.0 |
| Total | 298 (100.0%) | 53.0 |
Fertility by Education by Marriage Status in Garvin County
38.9% of women with births in Garvin County are unmarried. Women with the educational attainment of graduate degree are most likely to be married with 100.0% of them married at childbirth, while women with the educational attainment of less than high school are least likely to be married with 61.5% of them unmarried at childbirth.
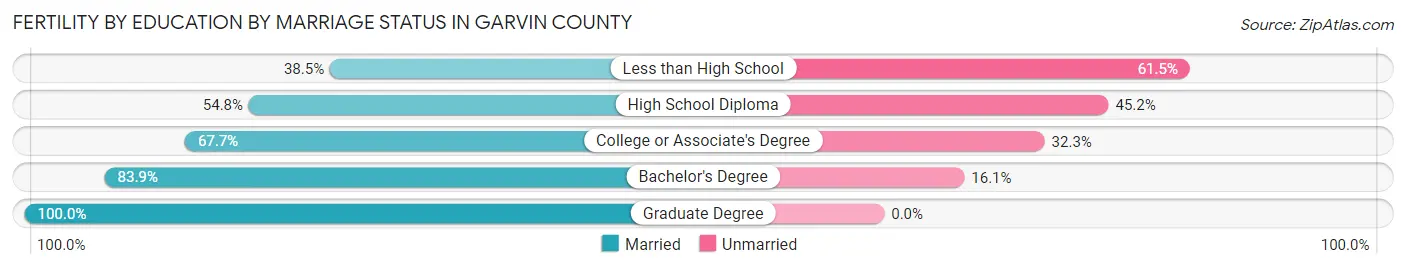
| Educational Attainment | Married | Unmarried |
| Less than High School | 20 (38.5%) | 32 (61.5%) |
| High School Diploma | 57 (54.8%) | 47 (45.2%) |
| College or Associate's Degree | 67 (67.7%) | 32 (32.3%) |
| Bachelor's Degree | 26 (83.9%) | 5 (16.1%) |
| Graduate Degree | 12 (100.0%) | 0 (0.0%) |
| Total | 182 (61.1%) | 116 (38.9%) |
Employment Characteristics in Garvin County
Employment by Class of Employer in Garvin County
Among the 10,699 employed individuals in Garvin County, private company employees (7,407 | 69.2%), self-employed (not incorporated) (1,004 | 9.4%), and local government employees (779 | 7.3%) make up the most common classes of employment.
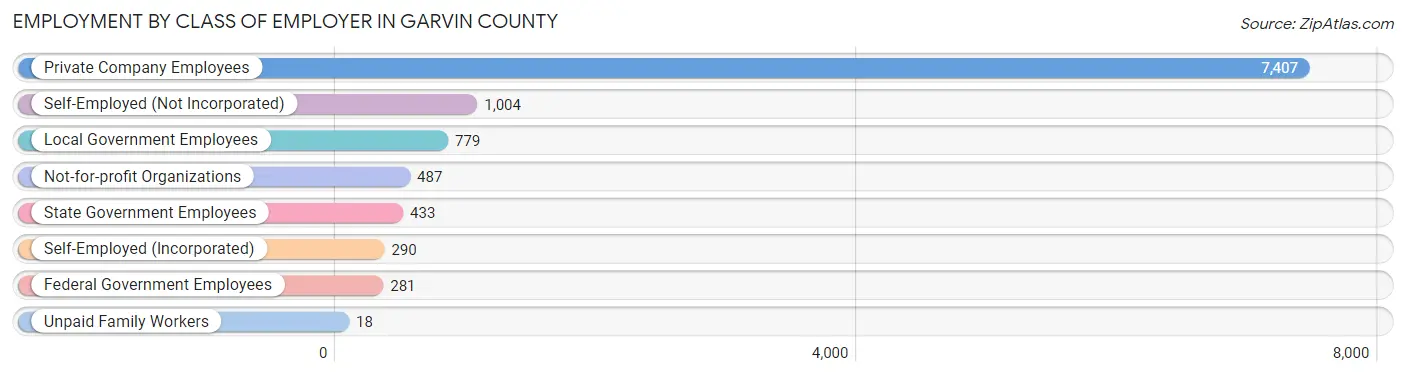
| Employer Class | # Employees | % Employees |
| Private Company Employees | 7,407 | 69.2% |
| Self-Employed (Incorporated) | 290 | 2.7% |
| Self-Employed (Not Incorporated) | 1,004 | 9.4% |
| Not-for-profit Organizations | 487 | 4.5% |
| Local Government Employees | 779 | 7.3% |
| State Government Employees | 433 | 4.1% |
| Federal Government Employees | 281 | 2.6% |
| Unpaid Family Workers | 18 | 0.2% |
| Total | 10,699 | 100.0% |
Employment Status by Age in Garvin County
According to the labor force statistics for Garvin County, out of the total population over 16 years of age (20,177), 55.1% or 11,118 individuals are in the labor force, with 2.8% or 311 of them unemployed. The age group with the highest labor force participation rate is 35 to 44 years, with 77.2% or 2,550 individuals in the labor force. Within the labor force, the 75 years and over age range has the highest percentage of unemployed individuals, with 18.8% or 12 of them being unemployed.
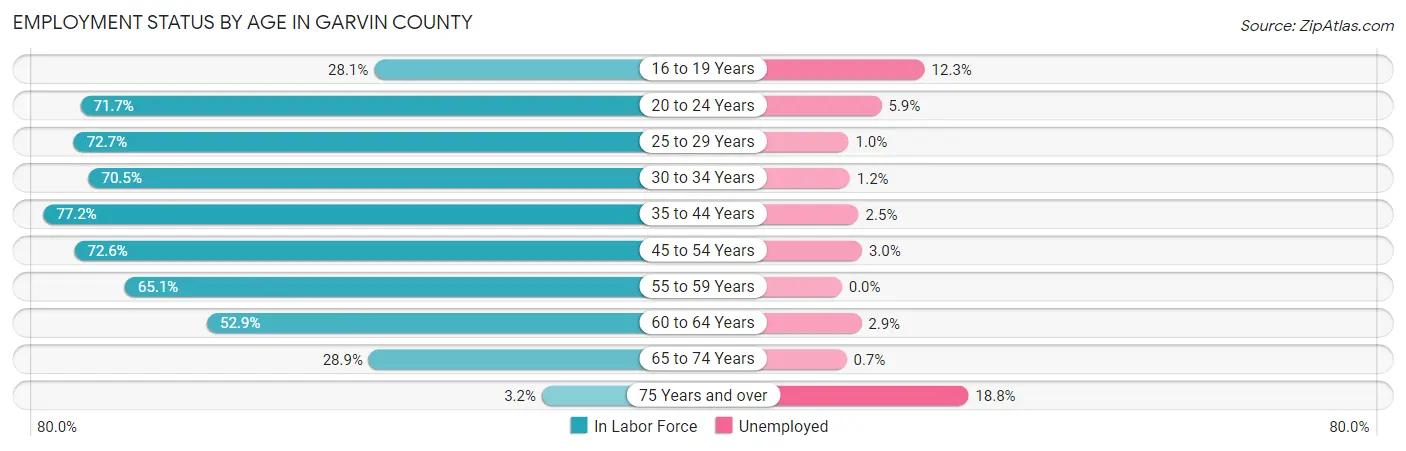
| Age Bracket | In Labor Force | Unemployed |
| 16 to 19 Years | 396 (28.1%) | 49 (12.3%) |
| 20 to 24 Years | 1,086 (71.7%) | 64 (5.9%) |
| 25 to 29 Years | 1,063 (72.7%) | 11 (1.0%) |
| 30 to 34 Years | 1,053 (70.5%) | 13 (1.2%) |
| 35 to 44 Years | 2,550 (77.2%) | 64 (2.5%) |
| 45 to 54 Years | 2,203 (72.6%) | 66 (3.0%) |
| 55 to 59 Years | 1,008 (65.1%) | 0 (0.0%) |
| 60 to 64 Years | 940 (52.9%) | 27 (2.9%) |
| 65 to 74 Years | 762 (28.9%) | 5 (0.7%) |
| 75 Years and over | 64 (3.2%) | 12 (18.8%) |
| Total | 11,118 (55.1%) | 311 (2.8%) |
Employment Status by Educational Attainment in Garvin County
According to labor force statistics for Garvin County, 69.9% of individuals (8,820) out of the total population between 25 and 64 years of age (12,618) are in the labor force, with 2.0% or 176 of them being unemployed. The group with the highest labor force participation rate are those with the educational attainment of bachelor's degree or higher, with 83.4% or 1,676 individuals in the labor force. Within the labor force, individuals with less than high school education have the highest percentage of unemployment, with 7.1% or 71 of them being unemployed.
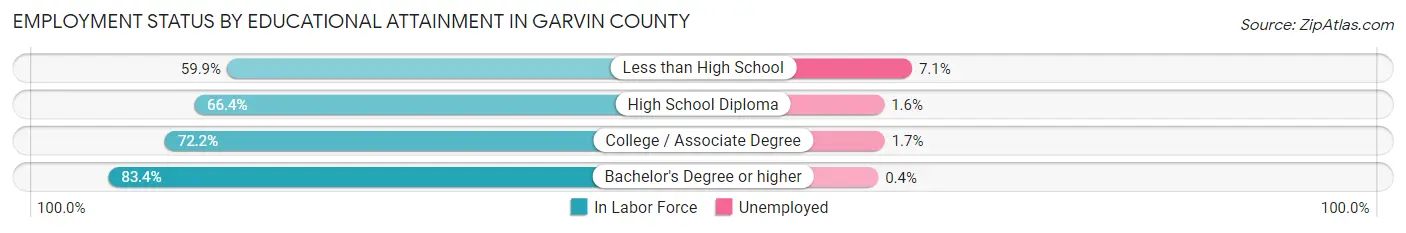
| Educational Attainment | In Labor Force | Unemployed |
| Less than High School | 1,003 (59.9%) | 119 (7.1%) |
| High School Diploma | 3,594 (66.4%) | 87 (1.6%) |
| College / Associate Degree | 2,541 (72.2%) | 60 (1.7%) |
| Bachelor's Degree or higher | 1,676 (83.4%) | 8 (0.4%) |
| Total | 8,820 (69.9%) | 252 (2.0%) |
Employment Occupations by Sex in Garvin County
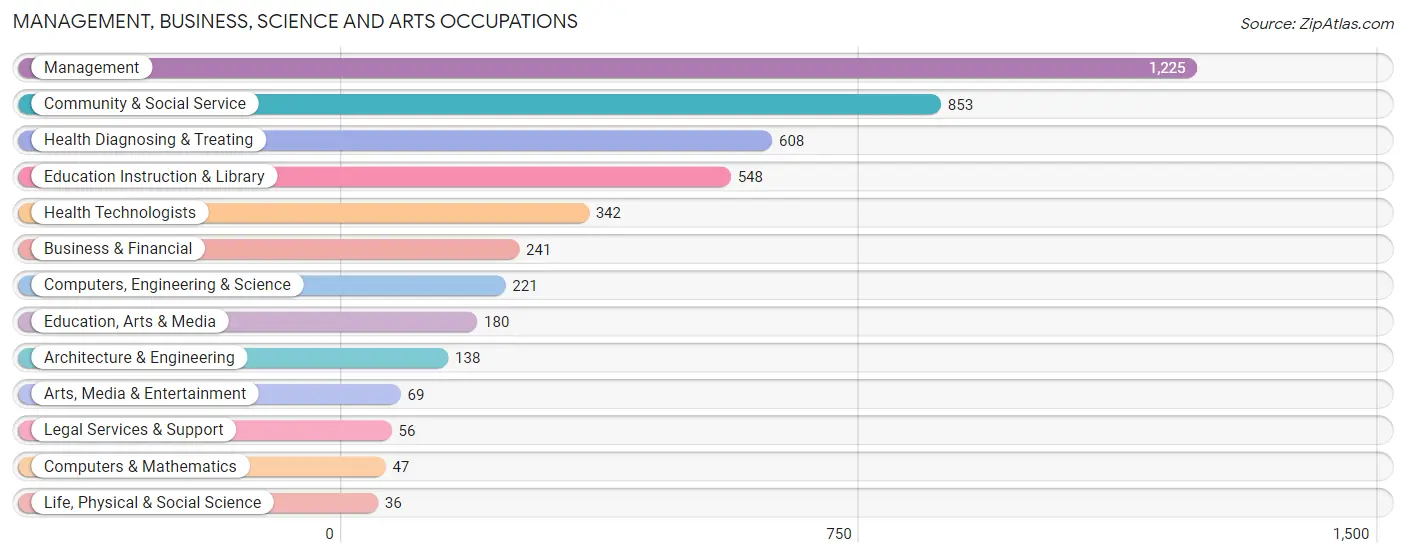
Management, Business, Science and Arts Occupations
The most common Management, Business, Science and Arts occupations in Garvin County are Management (1,225 | 11.3%), Community & Social Service (853 | 7.9%), Health Diagnosing & Treating (608 | 5.6%), Education Instruction & Library (548 | 5.1%), and Health Technologists (342 | 3.2%).
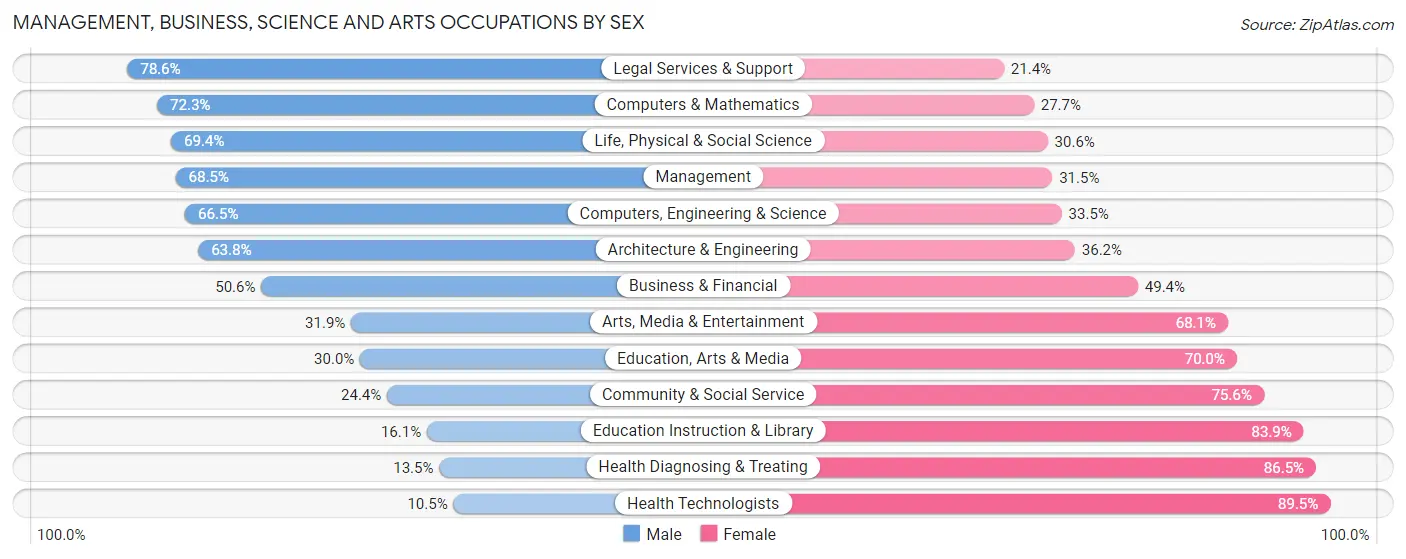
Management, Business, Science and Arts Occupations by Sex
Within the Management, Business, Science and Arts occupations in Garvin County, the most male-oriented occupations are Legal Services & Support (78.6%), Computers & Mathematics (72.3%), and Life, Physical & Social Science (69.4%), while the most female-oriented occupations are Health Technologists (89.5%), Health Diagnosing & Treating (86.5%), and Education Instruction & Library (83.9%).
| Occupation | Male | Female |
| Management | 839 (68.5%) | 386 (31.5%) |
| Business & Financial | 122 (50.6%) | 119 (49.4%) |
| Computers, Engineering & Science | 147 (66.5%) | 74 (33.5%) |
| Computers & Mathematics | 34 (72.3%) | 13 (27.7%) |
| Architecture & Engineering | 88 (63.8%) | 50 (36.2%) |
| Life, Physical & Social Science | 25 (69.4%) | 11 (30.6%) |
| Community & Social Service | 208 (24.4%) | 645 (75.6%) |
| Education, Arts & Media | 54 (30.0%) | 126 (70.0%) |
| Legal Services & Support | 44 (78.6%) | 12 (21.4%) |
| Education Instruction & Library | 88 (16.1%) | 460 (83.9%) |
| Arts, Media & Entertainment | 22 (31.9%) | 47 (68.1%) |
| Health Diagnosing & Treating | 82 (13.5%) | 526 (86.5%) |
| Health Technologists | 36 (10.5%) | 306 (89.5%) |
| Total (Category) | 1,398 (44.4%) | 1,750 (55.6%) |
| Total (Overall) | 6,070 (56.1%) | 4,740 (43.9%) |
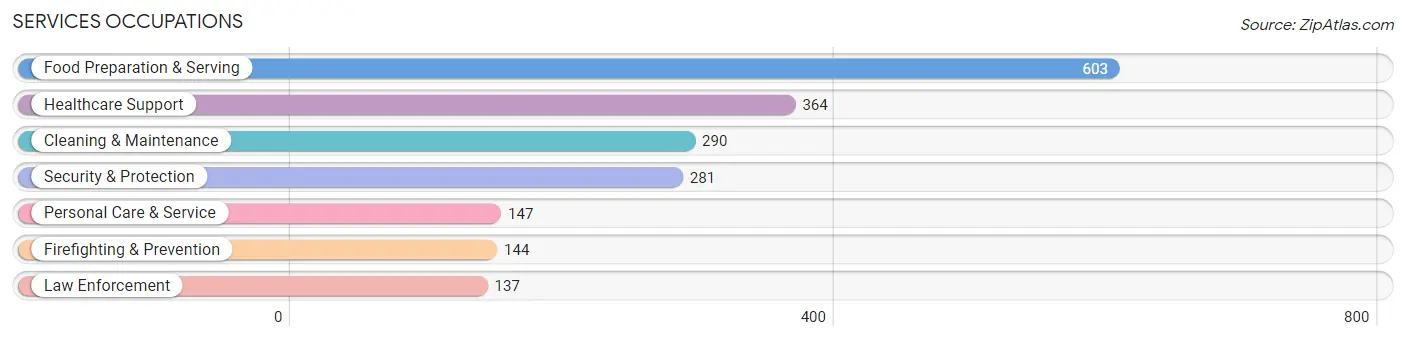
Services Occupations
The most common Services occupations in Garvin County are Food Preparation & Serving (603 | 5.6%), Healthcare Support (364 | 3.4%), Cleaning & Maintenance (290 | 2.7%), Security & Protection (281 | 2.6%), and Personal Care & Service (147 | 1.4%).
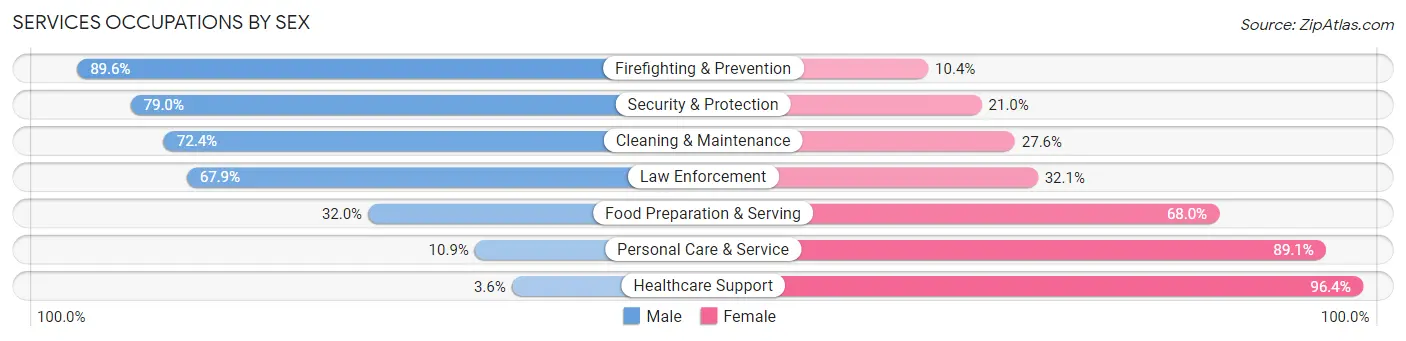
Services Occupations by Sex
Within the Services occupations in Garvin County, the most male-oriented occupations are Firefighting & Prevention (89.6%), Security & Protection (79.0%), and Cleaning & Maintenance (72.4%), while the most female-oriented occupations are Healthcare Support (96.4%), Personal Care & Service (89.1%), and Food Preparation & Serving (68.0%).
| Occupation | Male | Female |
| Healthcare Support | 13 (3.6%) | 351 (96.4%) |
| Security & Protection | 222 (79.0%) | 59 (21.0%) |
| Firefighting & Prevention | 129 (89.6%) | 15 (10.4%) |
| Law Enforcement | 93 (67.9%) | 44 (32.1%) |
| Food Preparation & Serving | 193 (32.0%) | 410 (68.0%) |
| Cleaning & Maintenance | 210 (72.4%) | 80 (27.6%) |
| Personal Care & Service | 16 (10.9%) | 131 (89.1%) |
| Total (Category) | 654 (38.8%) | 1,031 (61.2%) |
| Total (Overall) | 6,070 (56.1%) | 4,740 (43.9%) |
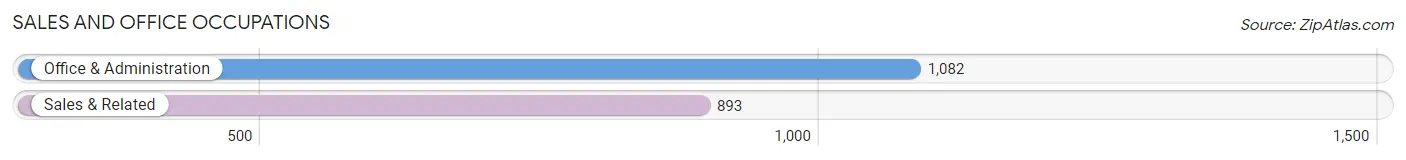
Sales and Office Occupations
The most common Sales and Office occupations in Garvin County are Office & Administration (1,082 | 10.0%), and Sales & Related (893 | 8.3%).
Sales and Office Occupations by Sex
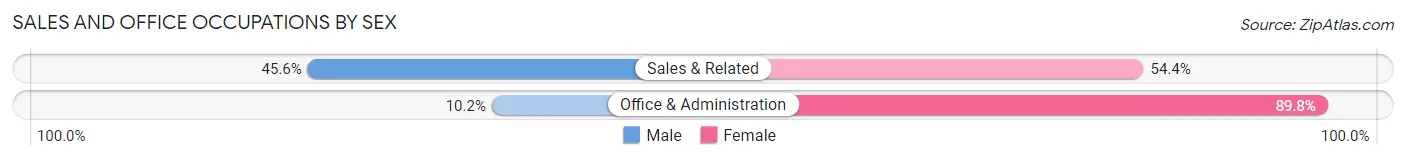
| Occupation | Male | Female |
| Sales & Related | 407 (45.6%) | 486 (54.4%) |
| Office & Administration | 110 (10.2%) | 972 (89.8%) |
| Total (Category) | 517 (26.2%) | 1,458 (73.8%) |
| Total (Overall) | 6,070 (56.1%) | 4,740 (43.9%) |
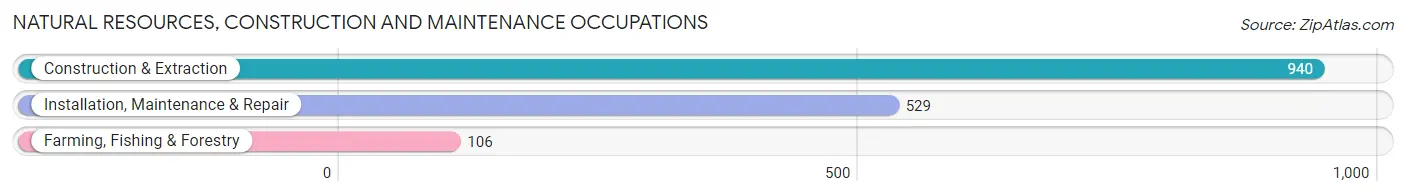
Natural Resources, Construction and Maintenance Occupations
The most common Natural Resources, Construction and Maintenance occupations in Garvin County are Construction & Extraction (940 | 8.7%), Installation, Maintenance & Repair (529 | 4.9%), and Farming, Fishing & Forestry (106 | 1.0%).
Natural Resources, Construction and Maintenance Occupations by Sex
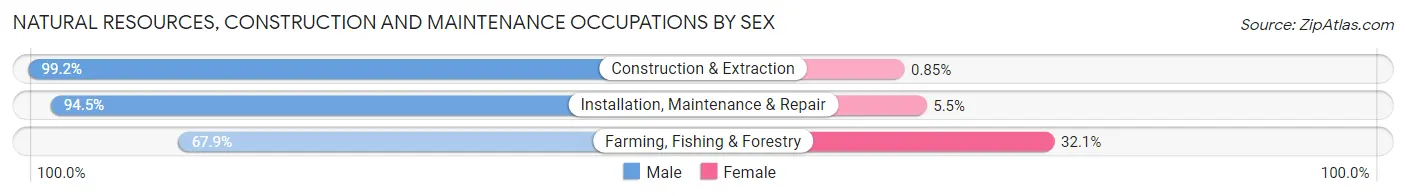
| Occupation | Male | Female |
| Farming, Fishing & Forestry | 72 (67.9%) | 34 (32.1%) |
| Construction & Extraction | 932 (99.2%) | 8 (0.9%) |
| Installation, Maintenance & Repair | 500 (94.5%) | 29 (5.5%) |
| Total (Category) | 1,504 (95.5%) | 71 (4.5%) |
| Total (Overall) | 6,070 (56.1%) | 4,740 (43.9%) |
Production, Transportation and Moving Occupations
The most common Production, Transportation and Moving occupations in Garvin County are Production (972 | 9.0%), Material Moving (733 | 6.8%), and Transportation (722 | 6.7%).
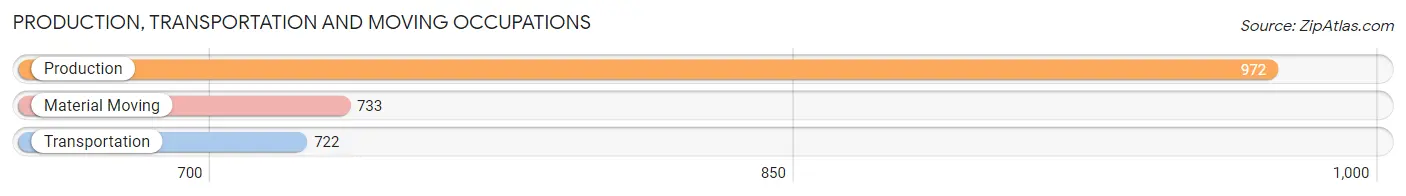
Production, Transportation and Moving Occupations by Sex
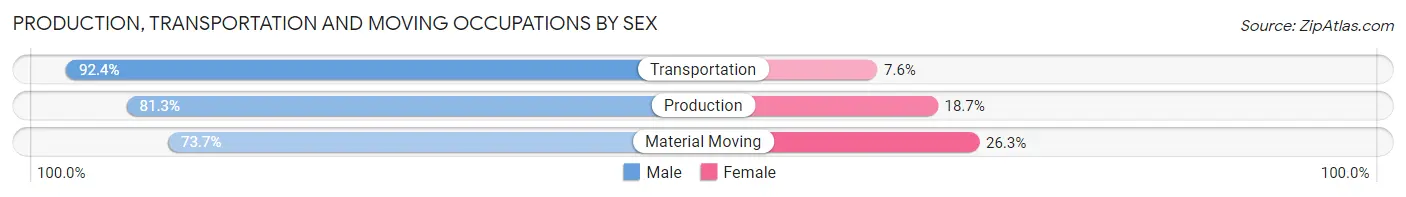
| Occupation | Male | Female |
| Production | 790 (81.3%) | 182 (18.7%) |
| Transportation | 667 (92.4%) | 55 (7.6%) |
| Material Moving | 540 (73.7%) | 193 (26.3%) |
| Total (Category) | 1,997 (82.3%) | 430 (17.7%) |
| Total (Overall) | 6,070 (56.1%) | 4,740 (43.9%) |
Employment Industries by Sex in Garvin County
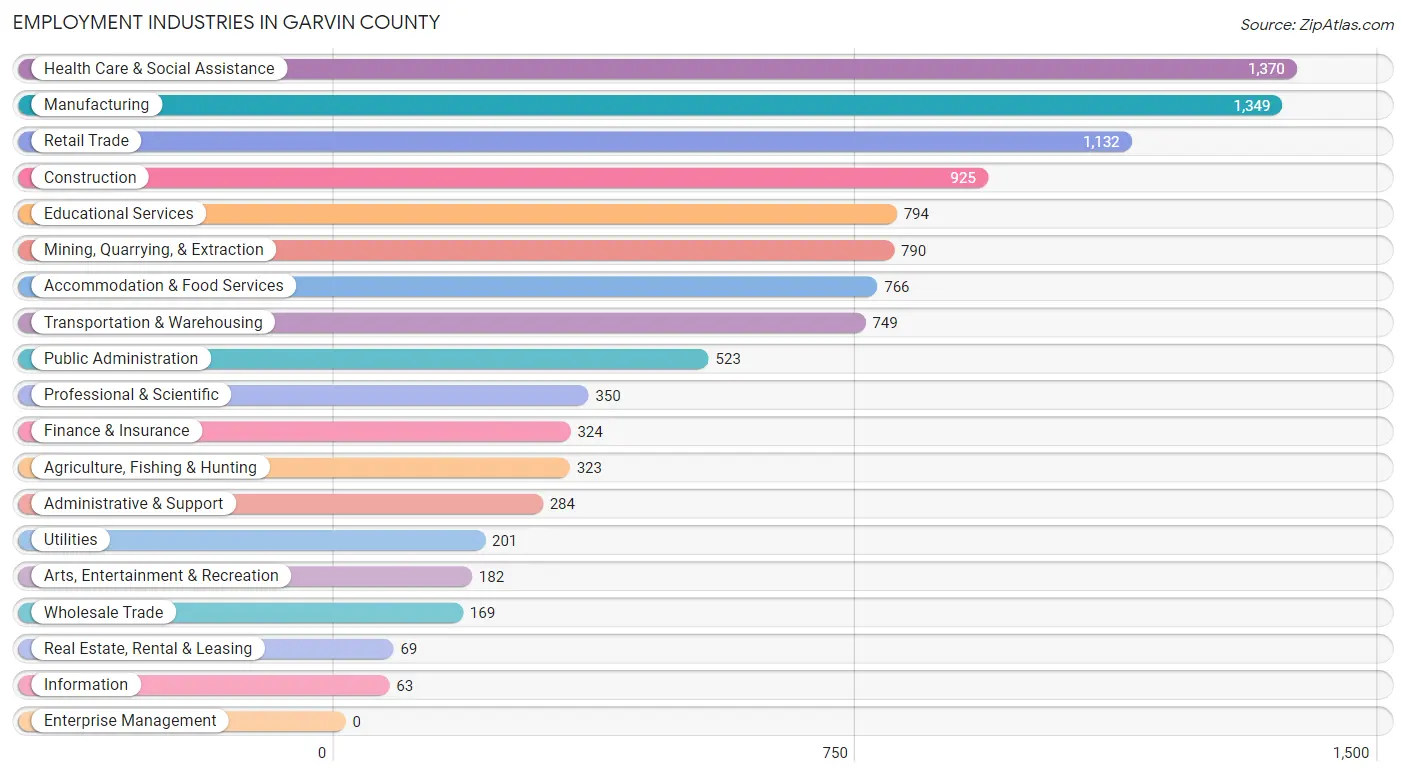
Employment Industries in Garvin County
The major employment industries in Garvin County include Health Care & Social Assistance (1,370 | 12.7%), Manufacturing (1,349 | 12.5%), Retail Trade (1,132 | 10.5%), Construction (925 | 8.6%), and Educational Services (794 | 7.3%).
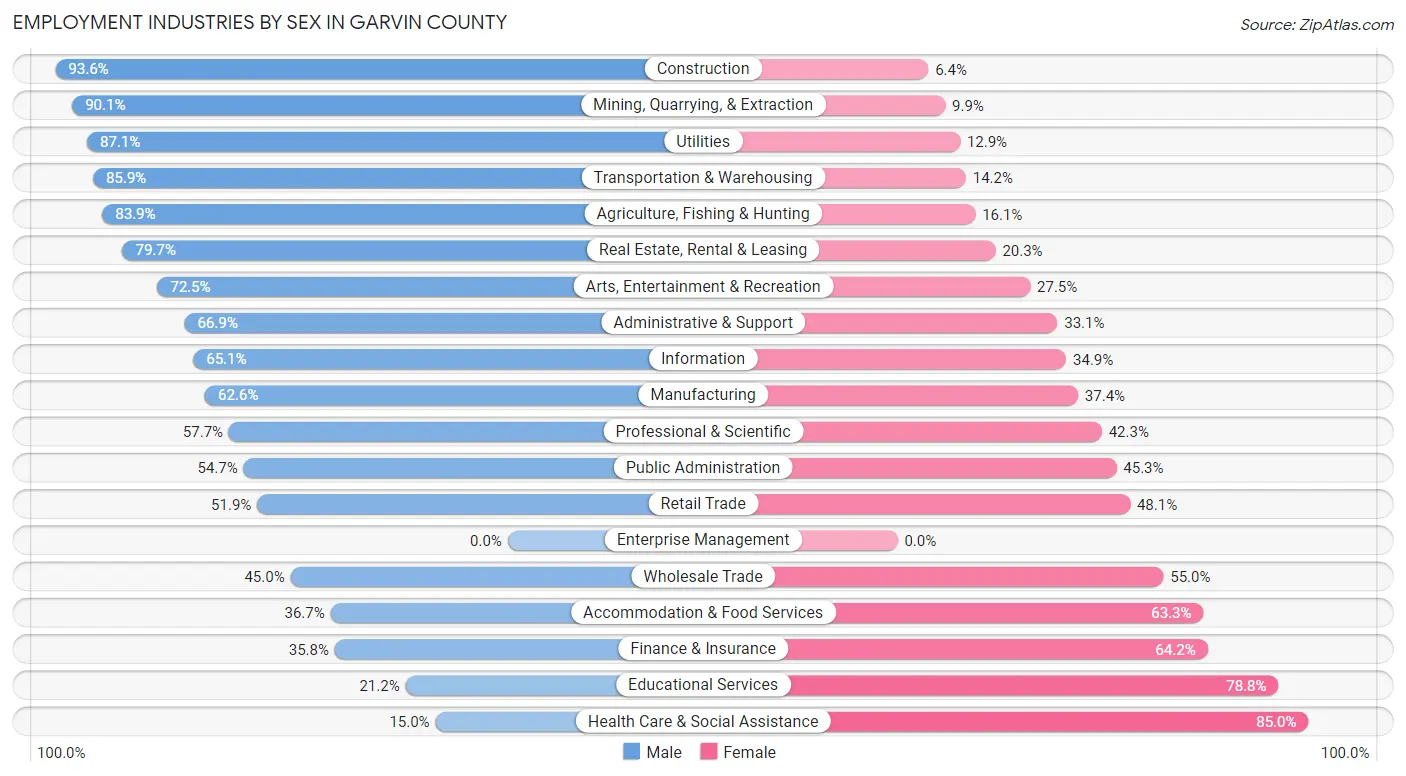
Employment Industries by Sex in Garvin County
The Garvin County industries that see more men than women are Construction (93.6%), Mining, Quarrying, & Extraction (90.1%), and Utilities (87.1%), whereas the industries that tend to have a higher number of women are Health Care & Social Assistance (85.0%), Educational Services (78.8%), and Finance & Insurance (64.2%).
| Industry | Male | Female |
| Agriculture, Fishing & Hunting | 271 (83.9%) | 52 (16.1%) |
| Mining, Quarrying, & Extraction | 712 (90.1%) | 78 (9.9%) |
| Construction | 866 (93.6%) | 59 (6.4%) |
| Manufacturing | 845 (62.6%) | 504 (37.4%) |
| Wholesale Trade | 76 (45.0%) | 93 (55.0%) |
| Retail Trade | 587 (51.9%) | 545 (48.1%) |
| Transportation & Warehousing | 643 (85.9%) | 106 (14.1%) |
| Utilities | 175 (87.1%) | 26 (12.9%) |
| Information | 41 (65.1%) | 22 (34.9%) |
| Finance & Insurance | 116 (35.8%) | 208 (64.2%) |
| Real Estate, Rental & Leasing | 55 (79.7%) | 14 (20.3%) |
| Professional & Scientific | 202 (57.7%) | 148 (42.3%) |
| Enterprise Management | 0 (0.0%) | 0 (0.0%) |
| Administrative & Support | 190 (66.9%) | 94 (33.1%) |
| Educational Services | 168 (21.2%) | 626 (78.8%) |
| Health Care & Social Assistance | 205 (15.0%) | 1,165 (85.0%) |
| Arts, Entertainment & Recreation | 132 (72.5%) | 50 (27.5%) |
| Accommodation & Food Services | 281 (36.7%) | 485 (63.3%) |
| Public Administration | 286 (54.7%) | 237 (45.3%) |
| Total | 6,070 (56.1%) | 4,740 (43.9%) |
Education in Garvin County
School Enrollment in Garvin County
The most common levels of schooling among the 5,642 students in Garvin County are middle school (1,592 | 28.2%), elementary school (1,488 | 26.4%), and high school (1,375 | 24.4%).
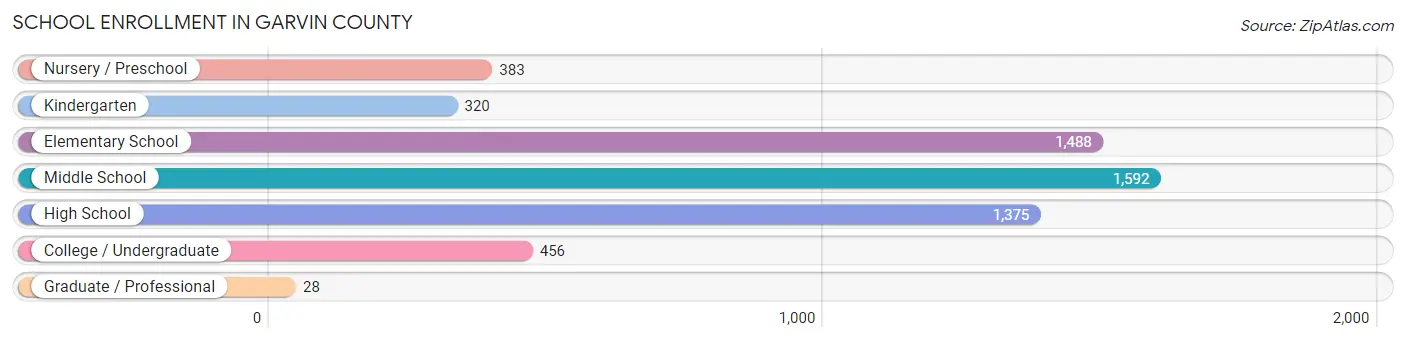
| School Level | # Students | % Students |
| Nursery / Preschool | 383 | 6.8% |
| Kindergarten | 320 | 5.7% |
| Elementary School | 1,488 | 26.4% |
| Middle School | 1,592 | 28.2% |
| High School | 1,375 | 24.4% |
| College / Undergraduate | 456 | 8.1% |
| Graduate / Professional | 28 | 0.5% |
| Total | 5,642 | 100.0% |
School Enrollment by Age by Funding Source in Garvin County
Out of a total of 5,642 students who are enrolled in schools in Garvin County, 265 (4.7%) attend a private institution, while the remaining 5,377 (95.3%) are enrolled in public schools. The age group of 20 to 24 year olds has the highest likelihood of being enrolled in private schools, with 27 (13.0% in the age bracket) enrolled. Conversely, the age group of 3 to 4 year olds has the lowest likelihood of being enrolled in a private school, with 286 (100.0% in the age bracket) attending a public institution.
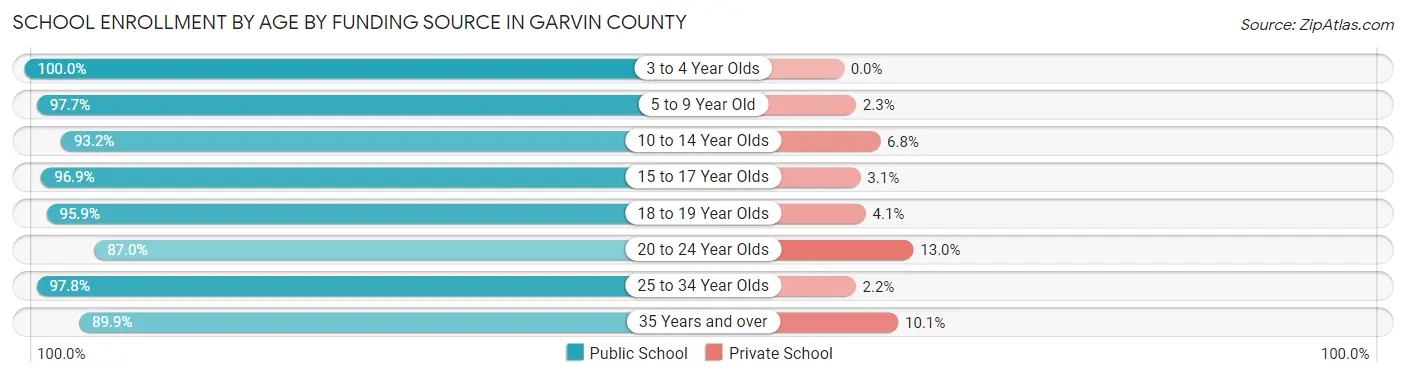
| Age Bracket | Public School | Private School |
| 3 to 4 Year Olds | 286 (100.0%) | 0 (0.0%) |
| 5 to 9 Year Old | 1,499 (97.7%) | 35 (2.3%) |
| 10 to 14 Year Olds | 1,815 (93.2%) | 132 (6.8%) |
| 15 to 17 Year Olds | 962 (96.9%) | 31 (3.1%) |
| 18 to 19 Year Olds | 352 (95.9%) | 15 (4.1%) |
| 20 to 24 Year Olds | 181 (87.0%) | 27 (13.0%) |
| 25 to 34 Year Olds | 88 (97.8%) | 2 (2.2%) |
| 35 Years and over | 195 (89.9%) | 22 (10.1%) |
| Total | 5,377 (95.3%) | 265 (4.7%) |
Educational Attainment by Field of Study in Garvin County
Education (798 | 26.0%), business (555 | 18.1%), science & technology (409 | 13.3%), arts & humanities (282 | 9.2%), and bio, nature & agricultural (197 | 6.4%) are the most common fields of study among 3,069 individuals in Garvin County who have obtained a bachelor's degree or higher.
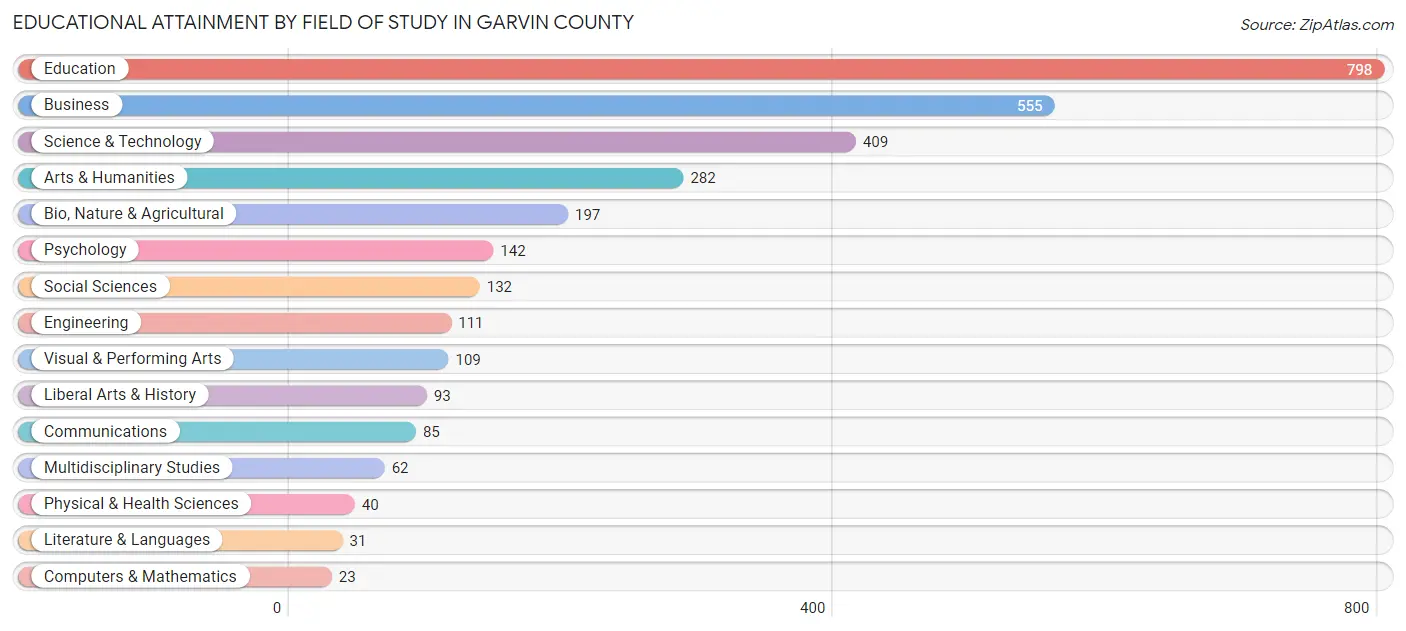
| Field of Study | # Graduates | % Graduates |
| Computers & Mathematics | 23 | 0.7% |
| Bio, Nature & Agricultural | 197 | 6.4% |
| Physical & Health Sciences | 40 | 1.3% |
| Psychology | 142 | 4.6% |
| Social Sciences | 132 | 4.3% |
| Engineering | 111 | 3.6% |
| Multidisciplinary Studies | 62 | 2.0% |
| Science & Technology | 409 | 13.3% |
| Business | 555 | 18.1% |
| Education | 798 | 26.0% |
| Literature & Languages | 31 | 1.0% |
| Liberal Arts & History | 93 | 3.0% |
| Visual & Performing Arts | 109 | 3.5% |
| Communications | 85 | 2.8% |
| Arts & Humanities | 282 | 9.2% |
| Total | 3,069 | 100.0% |
Transportation & Commute in Garvin County
Vehicle Availability by Sex in Garvin County
The most prevalent vehicle ownership categories in Garvin County are males with 2 vehicles (2,261, accounting for 37.7%) and females with 2 vehicles (1,680, making up 48.2%).
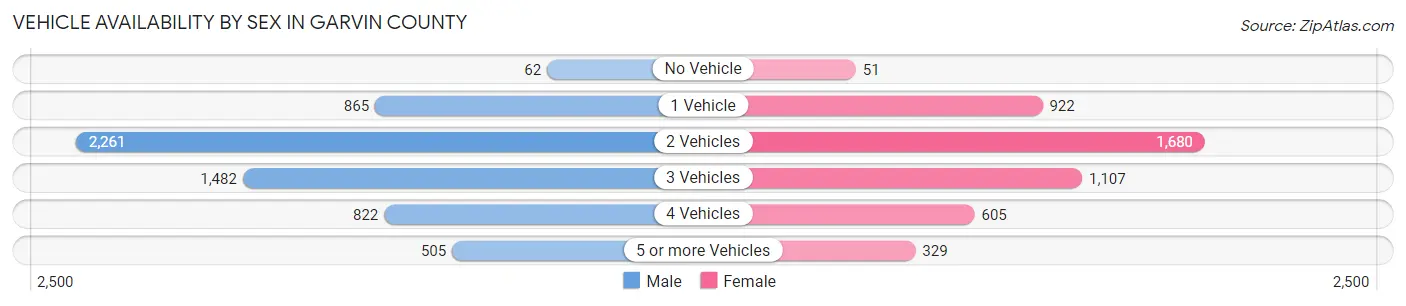
| Vehicles Available | Male | Female |
| No Vehicle | 62 (1.0%) | 51 (1.1%) |
| 1 Vehicle | 865 (14.4%) | 922 (19.6%) |
| 2 Vehicles | 2,261 (37.7%) | 1,680 (35.8%) |
| 3 Vehicles | 1,482 (24.7%) | 1,107 (23.6%) |
| 4 Vehicles | 822 (13.7%) | 605 (12.9%) |
| 5 or more Vehicles | 505 (8.4%) | 329 (7.0%) |
| Total | 5,997 (100.0%) | 4,694 (100.0%) |
Commute Time in Garvin County
The most frequently occuring commute durations in Garvin County are 10 to 14 minutes (1,663 commuters, 16.7%), 15 to 19 minutes (1,518 commuters, 15.3%), and 5 to 9 minutes (1,346 commuters, 13.5%).
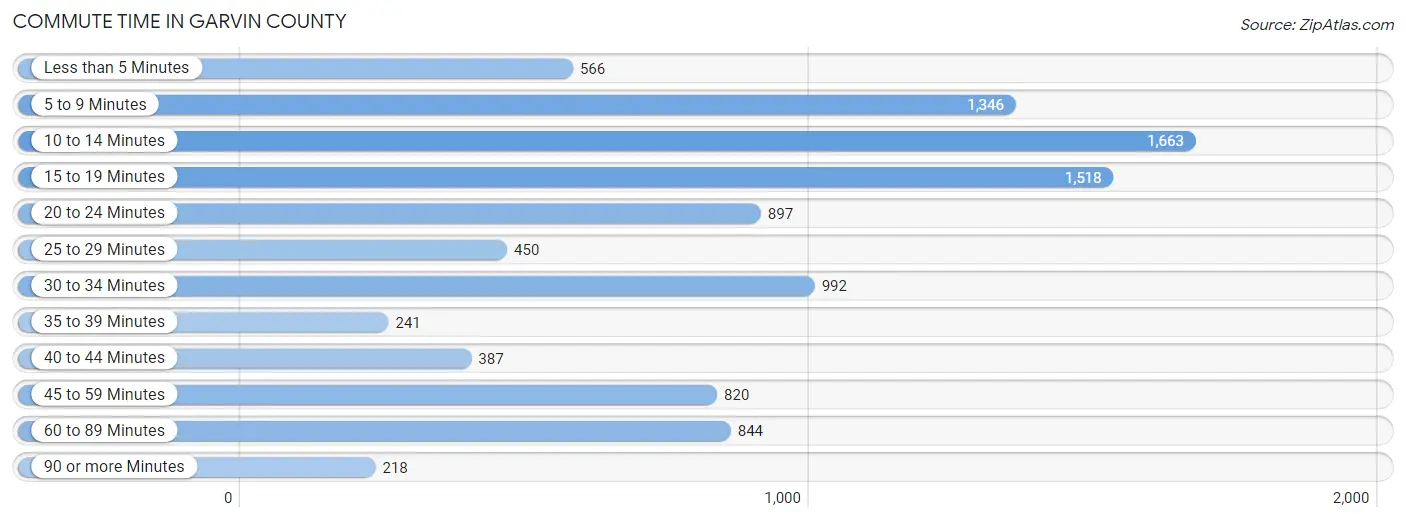
| Commute Time | # Commuters | % Commuters |
| Less than 5 Minutes | 566 | 5.7% |
| 5 to 9 Minutes | 1,346 | 13.5% |
| 10 to 14 Minutes | 1,663 | 16.7% |
| 15 to 19 Minutes | 1,518 | 15.3% |
| 20 to 24 Minutes | 897 | 9.0% |
| 25 to 29 Minutes | 450 | 4.5% |
| 30 to 34 Minutes | 992 | 10.0% |
| 35 to 39 Minutes | 241 | 2.4% |
| 40 to 44 Minutes | 387 | 3.9% |
| 45 to 59 Minutes | 820 | 8.3% |
| 60 to 89 Minutes | 844 | 8.5% |
| 90 or more Minutes | 218 | 2.2% |
Commute Time by Sex in Garvin County
The most common commute times in Garvin County are 10 to 14 minutes (832 commuters, 14.9%) for males and 10 to 14 minutes (831 commuters, 19.1%) for females.
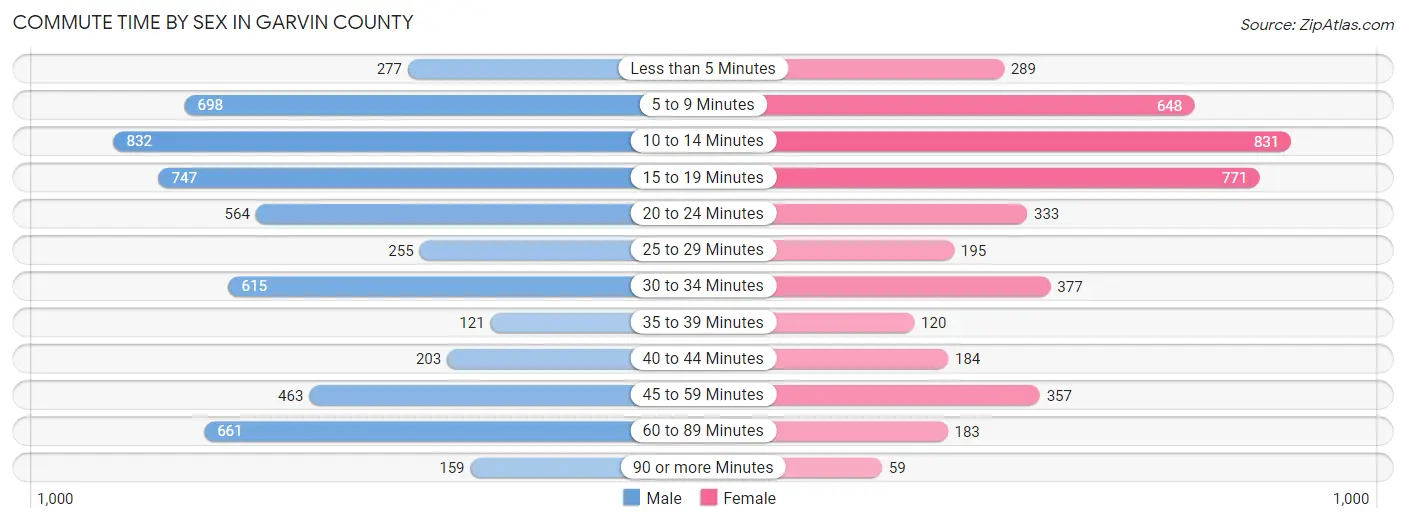
| Commute Time | Male | Female |
| Less than 5 Minutes | 277 (5.0%) | 289 (6.7%) |
| 5 to 9 Minutes | 698 (12.5%) | 648 (14.9%) |
| 10 to 14 Minutes | 832 (14.9%) | 831 (19.1%) |
| 15 to 19 Minutes | 747 (13.4%) | 771 (17.7%) |
| 20 to 24 Minutes | 564 (10.1%) | 333 (7.7%) |
| 25 to 29 Minutes | 255 (4.6%) | 195 (4.5%) |
| 30 to 34 Minutes | 615 (11.0%) | 377 (8.7%) |
| 35 to 39 Minutes | 121 (2.2%) | 120 (2.8%) |
| 40 to 44 Minutes | 203 (3.6%) | 184 (4.2%) |
| 45 to 59 Minutes | 463 (8.3%) | 357 (8.2%) |
| 60 to 89 Minutes | 661 (11.8%) | 183 (4.2%) |
| 90 or more Minutes | 159 (2.8%) | 59 (1.4%) |
Time of Departure to Work by Sex in Garvin County
The most frequent times of departure to work in Garvin County are 6:00 AM to 6:29 AM (1,025, 18.3%) for males and 7:00 AM to 7:29 AM (880, 20.2%) for females.
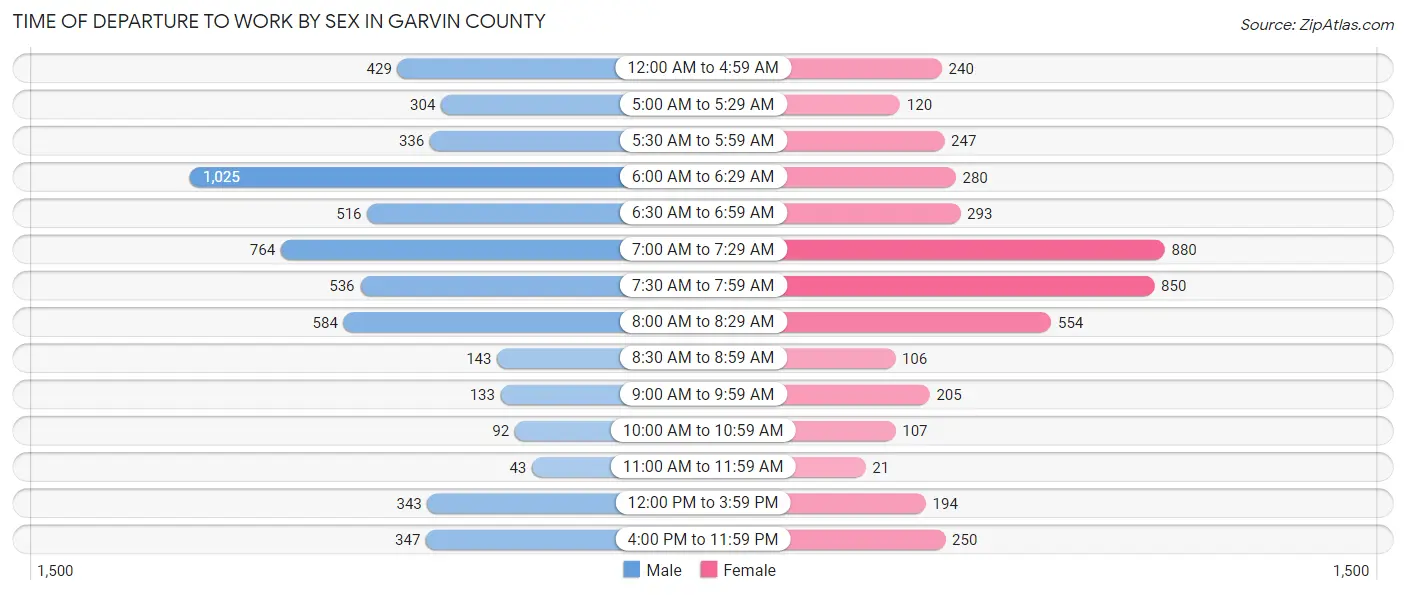
| Time of Departure | Male | Female |
| 12:00 AM to 4:59 AM | 429 (7.7%) | 240 (5.5%) |
| 5:00 AM to 5:29 AM | 304 (5.4%) | 120 (2.8%) |
| 5:30 AM to 5:59 AM | 336 (6.0%) | 247 (5.7%) |
| 6:00 AM to 6:29 AM | 1,025 (18.3%) | 280 (6.4%) |
| 6:30 AM to 6:59 AM | 516 (9.2%) | 293 (6.7%) |
| 7:00 AM to 7:29 AM | 764 (13.7%) | 880 (20.2%) |
| 7:30 AM to 7:59 AM | 536 (9.6%) | 850 (19.6%) |
| 8:00 AM to 8:29 AM | 584 (10.4%) | 554 (12.7%) |
| 8:30 AM to 8:59 AM | 143 (2.6%) | 106 (2.4%) |
| 9:00 AM to 9:59 AM | 133 (2.4%) | 205 (4.7%) |
| 10:00 AM to 10:59 AM | 92 (1.6%) | 107 (2.5%) |
| 11:00 AM to 11:59 AM | 43 (0.8%) | 21 (0.5%) |
| 12:00 PM to 3:59 PM | 343 (6.1%) | 194 (4.5%) |
| 4:00 PM to 11:59 PM | 347 (6.2%) | 250 (5.8%) |
| Total | 5,595 (100.0%) | 4,347 (100.0%) |
Housing Occupancy in Garvin County
Occupancy by Ownership in Garvin County
Of the total 9,906 dwellings in Garvin County, owner-occupied units account for 6,803 (68.7%), while renter-occupied units make up 3,103 (31.3%).
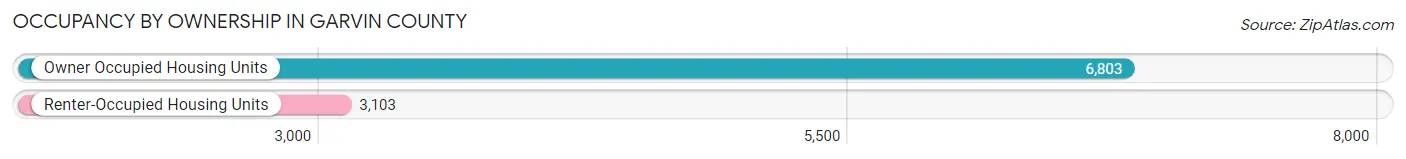
| Occupancy | # Housing Units | % Housing Units |
| Owner Occupied Housing Units | 6,803 | 68.7% |
| Renter-Occupied Housing Units | 3,103 | 31.3% |
| Total Occupied Housing Units | 9,906 | 100.0% |
Occupancy by Household Size in Garvin County
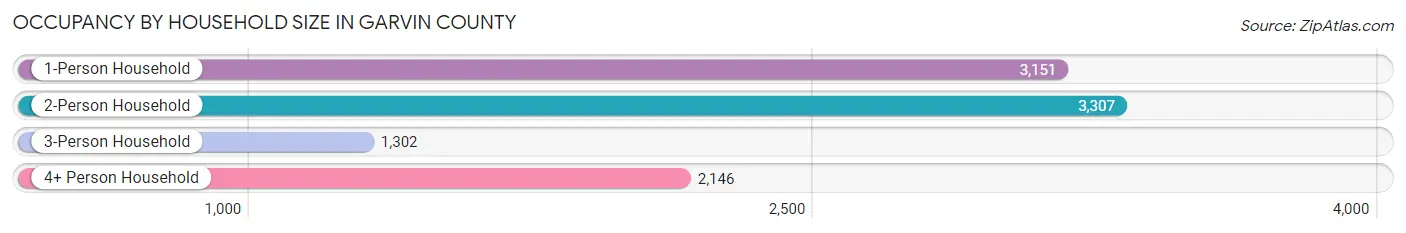
| Household Size | # Housing Units | % Housing Units |
| 1-Person Household | 3,151 | 31.8% |
| 2-Person Household | 3,307 | 33.4% |
| 3-Person Household | 1,302 | 13.1% |
| 4+ Person Household | 2,146 | 21.7% |
| Total Housing Units | 9,906 | 100.0% |
Occupancy by Ownership by Household Size in Garvin County
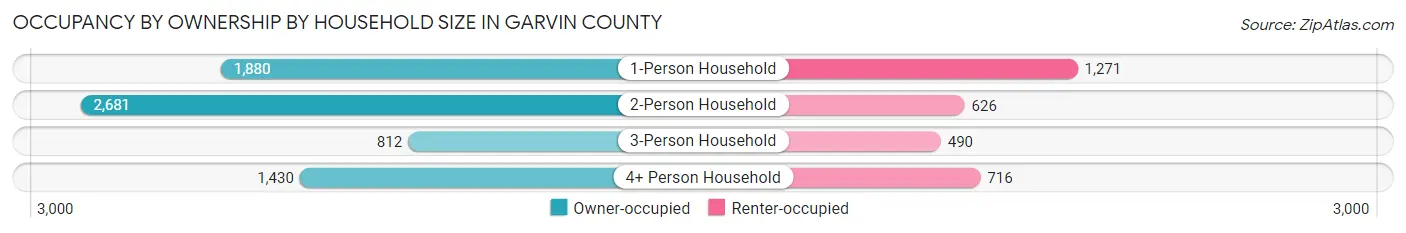
| Household Size | Owner-occupied | Renter-occupied |
| 1-Person Household | 1,880 (59.7%) | 1,271 (40.3%) |
| 2-Person Household | 2,681 (81.1%) | 626 (18.9%) |
| 3-Person Household | 812 (62.4%) | 490 (37.6%) |
| 4+ Person Household | 1,430 (66.6%) | 716 (33.4%) |
| Total Housing Units | 6,803 (68.7%) | 3,103 (31.3%) |
Occupancy by Educational Attainment in Garvin County
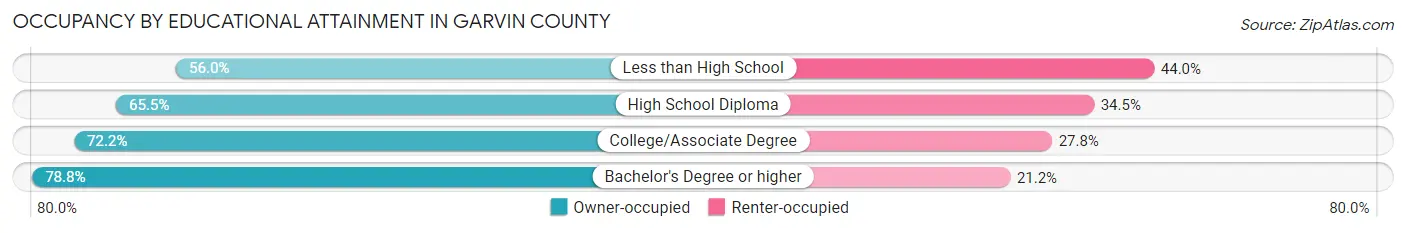
| Household Size | Owner-occupied | Renter-occupied |
| Less than High School | 704 (56.0%) | 554 (44.0%) |
| High School Diploma | 2,545 (65.5%) | 1,341 (34.5%) |
| College/Associate Degree | 2,151 (72.2%) | 830 (27.8%) |
| Bachelor's Degree or higher | 1,403 (78.8%) | 378 (21.2%) |
Occupancy by Age of Householder in Garvin County
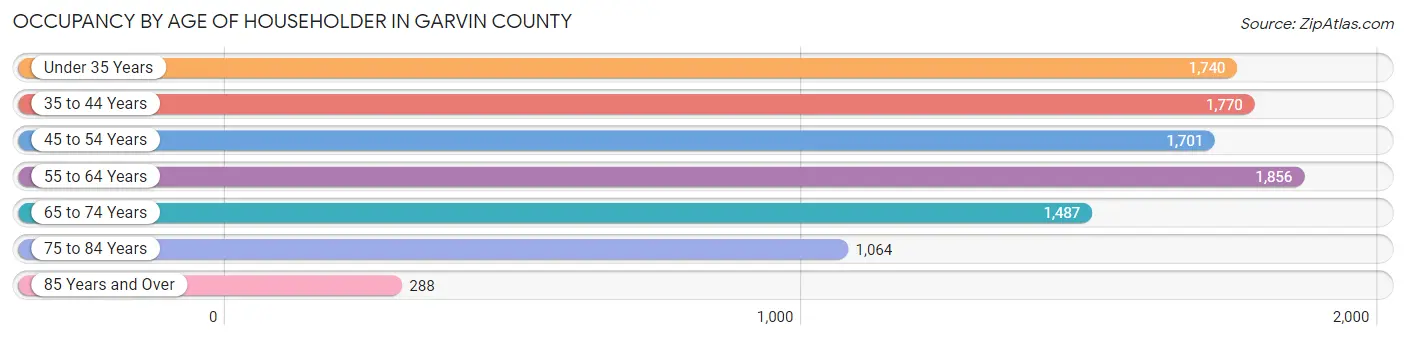
| Age Bracket | # Households | % Households |
| Under 35 Years | 1,740 | 17.6% |
| 35 to 44 Years | 1,770 | 17.9% |
| 45 to 54 Years | 1,701 | 17.2% |
| 55 to 64 Years | 1,856 | 18.7% |
| 65 to 74 Years | 1,487 | 15.0% |
| 75 to 84 Years | 1,064 | 10.7% |
| 85 Years and Over | 288 | 2.9% |
| Total | 9,906 | 100.0% |
Housing Finances in Garvin County
Median Income by Occupancy in Garvin County
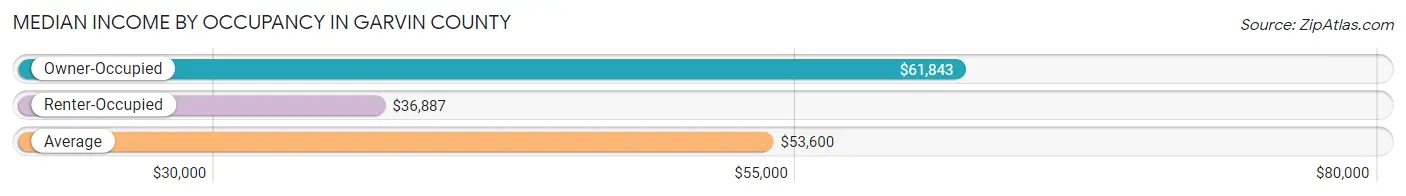
| Occupancy Type | # Households | Median Income |
| Owner-Occupied | 6,803 (68.7%) | $61,843 |
| Renter-Occupied | 3,103 (31.3%) | $36,887 |
| Average | 9,906 (100.0%) | $53,600 |
Occupancy by Householder Income Bracket in Garvin County
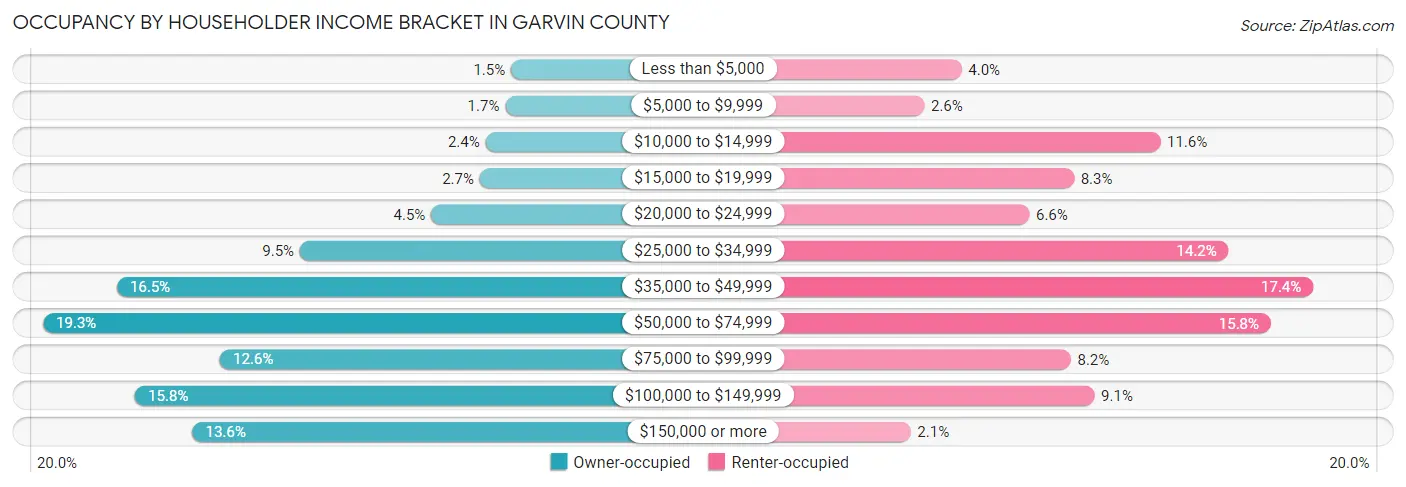
| Income Bracket | Owner-occupied | Renter-occupied |
| Less than $5,000 | 100 (1.5%) | 125 (4.0%) |
| $5,000 to $9,999 | 115 (1.7%) | 81 (2.6%) |
| $10,000 to $14,999 | 166 (2.4%) | 360 (11.6%) |
| $15,000 to $19,999 | 181 (2.7%) | 258 (8.3%) |
| $20,000 to $24,999 | 307 (4.5%) | 205 (6.6%) |
| $25,000 to $34,999 | 647 (9.5%) | 441 (14.2%) |
| $35,000 to $49,999 | 1,121 (16.5%) | 541 (17.4%) |
| $50,000 to $74,999 | 1,313 (19.3%) | 491 (15.8%) |
| $75,000 to $99,999 | 854 (12.6%) | 254 (8.2%) |
| $100,000 to $149,999 | 1,074 (15.8%) | 282 (9.1%) |
| $150,000 or more | 925 (13.6%) | 65 (2.1%) |
| Total | 6,803 (100.0%) | 3,103 (100.0%) |
Monthly Housing Cost Tiers in Garvin County
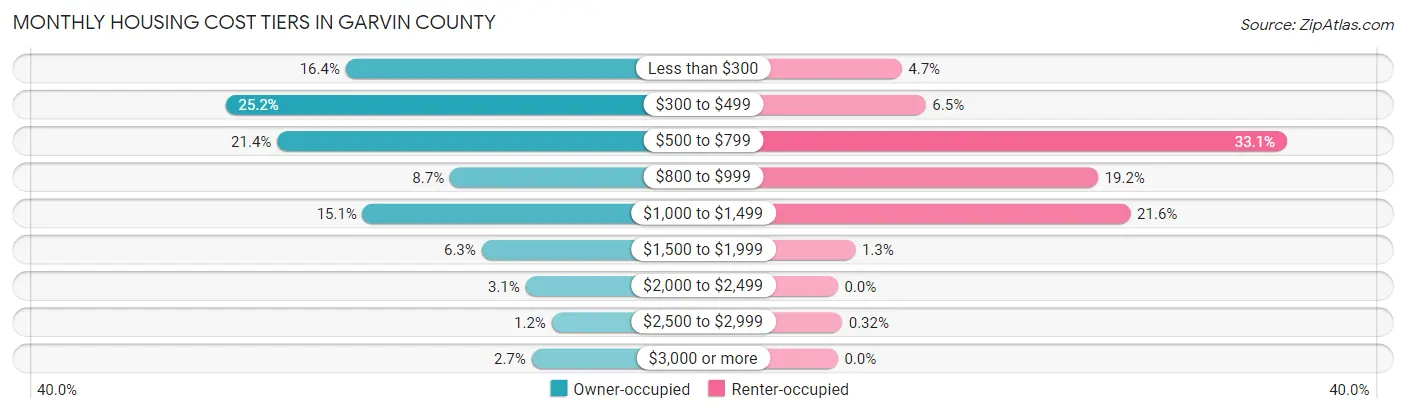
| Monthly Cost | Owner-occupied | Renter-occupied |
| Less than $300 | 1,112 (16.4%) | 146 (4.7%) |
| $300 to $499 | 1,715 (25.2%) | 201 (6.5%) |
| $500 to $799 | 1,456 (21.4%) | 1,027 (33.1%) |
| $800 to $999 | 590 (8.7%) | 595 (19.2%) |
| $1,000 to $1,499 | 1,027 (15.1%) | 669 (21.6%) |
| $1,500 to $1,999 | 431 (6.3%) | 40 (1.3%) |
| $2,000 to $2,499 | 211 (3.1%) | 0 (0.0%) |
| $2,500 to $2,999 | 80 (1.2%) | 10 (0.3%) |
| $3,000 or more | 181 (2.7%) | 0 (0.0%) |
| Total | 6,803 (100.0%) | 3,103 (100.0%) |
Physical Housing Characteristics in Garvin County
Housing Structures in Garvin County
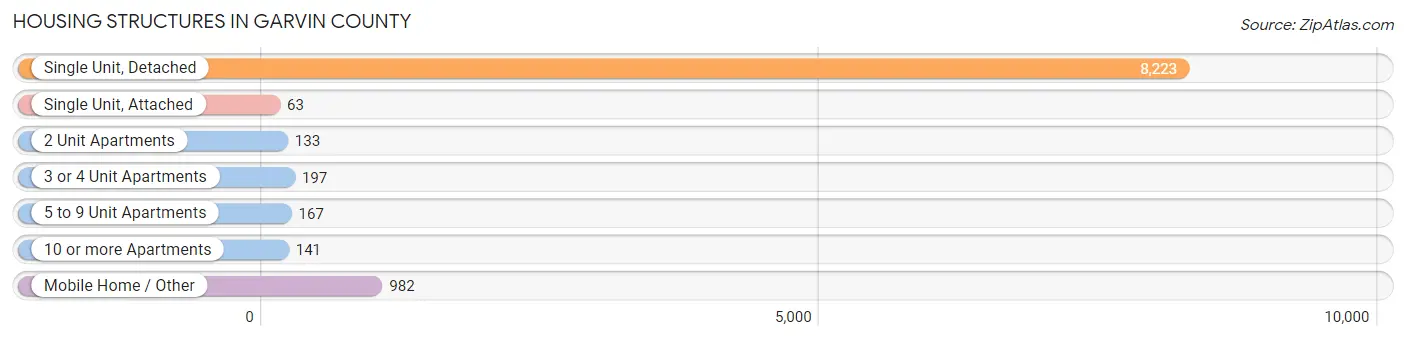
| Structure Type | # Housing Units | % Housing Units |
| Single Unit, Detached | 8,223 | 83.0% |
| Single Unit, Attached | 63 | 0.6% |
| 2 Unit Apartments | 133 | 1.3% |
| 3 or 4 Unit Apartments | 197 | 2.0% |
| 5 to 9 Unit Apartments | 167 | 1.7% |
| 10 or more Apartments | 141 | 1.4% |
| Mobile Home / Other | 982 | 9.9% |
| Total | 9,906 | 100.0% |
Housing Structures by Occupancy in Garvin County
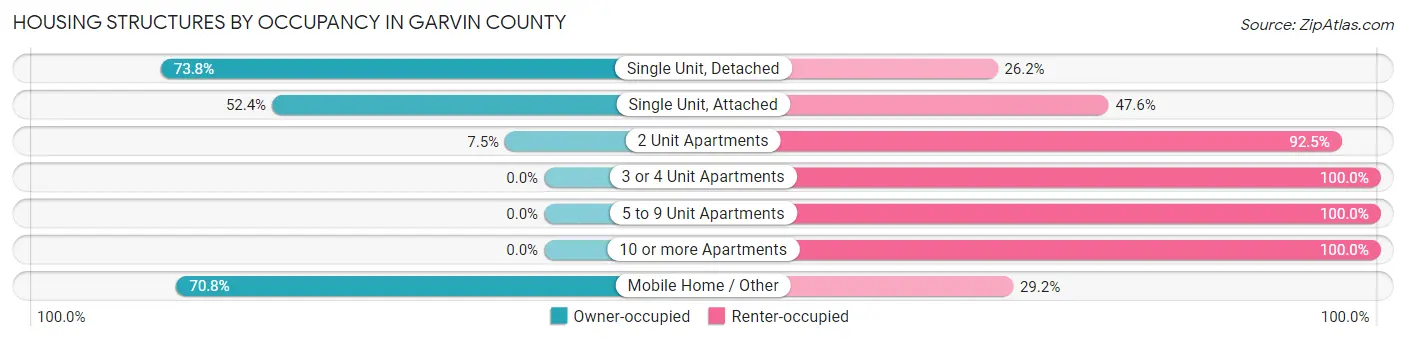
| Structure Type | Owner-occupied | Renter-occupied |
| Single Unit, Detached | 6,065 (73.8%) | 2,158 (26.2%) |
| Single Unit, Attached | 33 (52.4%) | 30 (47.6%) |
| 2 Unit Apartments | 10 (7.5%) | 123 (92.5%) |
| 3 or 4 Unit Apartments | 0 (0.0%) | 197 (100.0%) |
| 5 to 9 Unit Apartments | 0 (0.0%) | 167 (100.0%) |
| 10 or more Apartments | 0 (0.0%) | 141 (100.0%) |
| Mobile Home / Other | 695 (70.8%) | 287 (29.2%) |
| Total | 6,803 (68.7%) | 3,103 (31.3%) |
Housing Structures by Number of Rooms in Garvin County
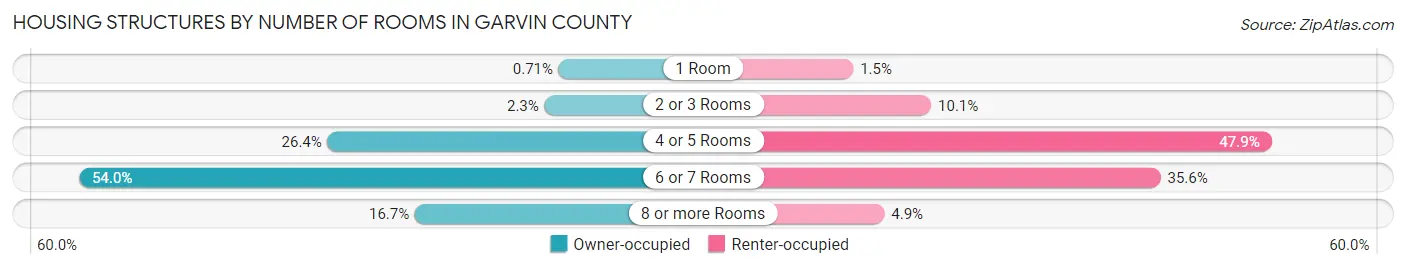
| Number of Rooms | Owner-occupied | Renter-occupied |
| 1 Room | 48 (0.7%) | 46 (1.5%) |
| 2 or 3 Rooms | 156 (2.3%) | 314 (10.1%) |
| 4 or 5 Rooms | 1,794 (26.4%) | 1,486 (47.9%) |
| 6 or 7 Rooms | 3,671 (54.0%) | 1,104 (35.6%) |
| 8 or more Rooms | 1,134 (16.7%) | 153 (4.9%) |
| Total | 6,803 (100.0%) | 3,103 (100.0%) |
Housing Structure by Heating Type in Garvin County
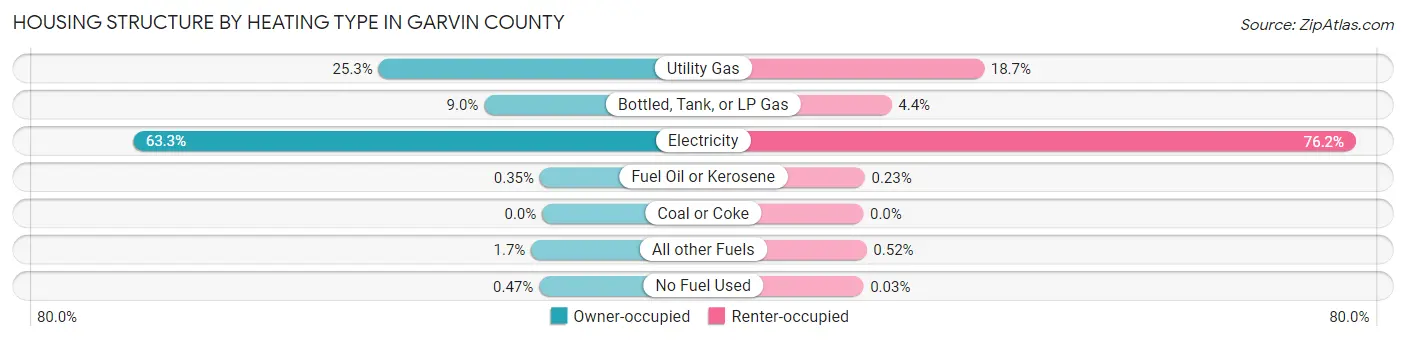
| Heating Type | Owner-occupied | Renter-occupied |
| Utility Gas | 1,719 (25.3%) | 579 (18.7%) |
| Bottled, Tank, or LP Gas | 609 (8.9%) | 136 (4.4%) |
| Electricity | 4,304 (63.3%) | 2,364 (76.2%) |
| Fuel Oil or Kerosene | 24 (0.4%) | 7 (0.2%) |
| Coal or Coke | 0 (0.0%) | 0 (0.0%) |
| All other Fuels | 115 (1.7%) | 16 (0.5%) |
| No Fuel Used | 32 (0.5%) | 1 (0.0%) |
| Total | 6,803 (100.0%) | 3,103 (100.0%) |
Household Vehicle Usage in Garvin County
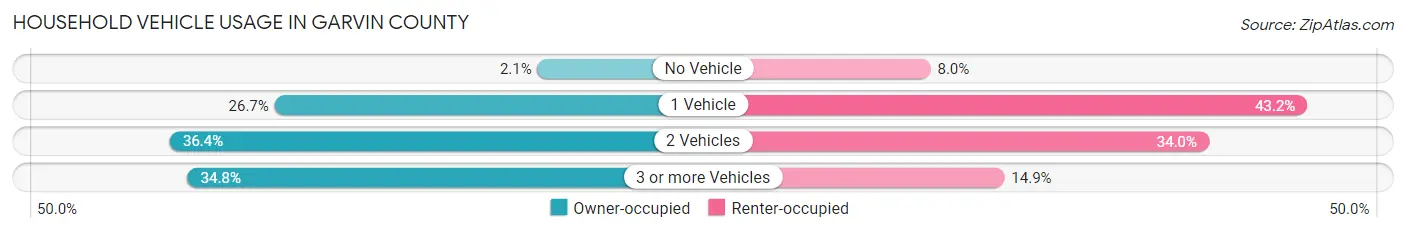
| Vehicles per Household | Owner-occupied | Renter-occupied |
| No Vehicle | 144 (2.1%) | 248 (8.0%) |
| 1 Vehicle | 1,814 (26.7%) | 1,339 (43.1%) |
| 2 Vehicles | 2,479 (36.4%) | 1,054 (34.0%) |
| 3 or more Vehicles | 2,366 (34.8%) | 462 (14.9%) |
| Total | 6,803 (100.0%) | 3,103 (100.0%) |
Real Estate & Mortgages in Garvin County
Real Estate and Mortgage Overview in Garvin County
| Characteristic | Without Mortgage | With Mortgage |
| Housing Units | 4,057 | 2,746 |
| Median Property Value | $107,900 | $150,000 |
| Median Household Income | $52,272 | $546 |
| Monthly Housing Costs | $400 | $142 |
| Real Estate Taxes | $571 | $53 |
Property Value by Mortgage Status in Garvin County
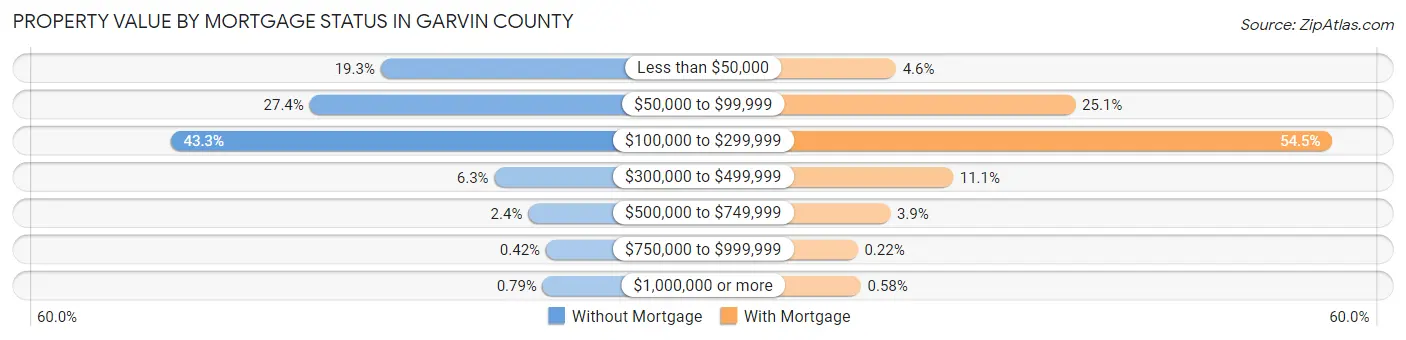
| Property Value | Without Mortgage | With Mortgage |
| Less than $50,000 | 783 (19.3%) | 126 (4.6%) |
| $50,000 to $99,999 | 1,113 (27.4%) | 689 (25.1%) |
| $100,000 to $299,999 | 1,757 (43.3%) | 1,496 (54.5%) |
| $300,000 to $499,999 | 256 (6.3%) | 305 (11.1%) |
| $500,000 to $749,999 | 99 (2.4%) | 108 (3.9%) |
| $750,000 to $999,999 | 17 (0.4%) | 6 (0.2%) |
| $1,000,000 or more | 32 (0.8%) | 16 (0.6%) |
| Total | 4,057 (100.0%) | 2,746 (100.0%) |
Household Income by Mortgage Status in Garvin County
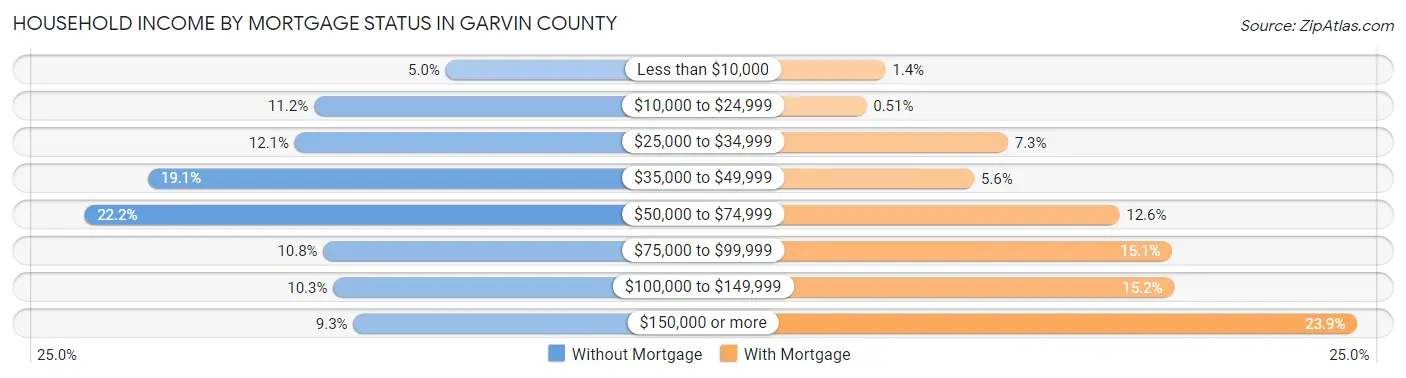
| Household Income | Without Mortgage | With Mortgage |
| Less than $10,000 | 201 (5.0%) | 39 (1.4%) |
| $10,000 to $24,999 | 455 (11.2%) | 14 (0.5%) |
| $25,000 to $34,999 | 492 (12.1%) | 199 (7.2%) |
| $35,000 to $49,999 | 776 (19.1%) | 155 (5.6%) |
| $50,000 to $74,999 | 899 (22.2%) | 345 (12.6%) |
| $75,000 to $99,999 | 437 (10.8%) | 414 (15.1%) |
| $100,000 to $149,999 | 418 (10.3%) | 417 (15.2%) |
| $150,000 or more | 379 (9.3%) | 656 (23.9%) |
| Total | 4,057 (100.0%) | 2,746 (100.0%) |
Property Value to Household Income Ratio in Garvin County
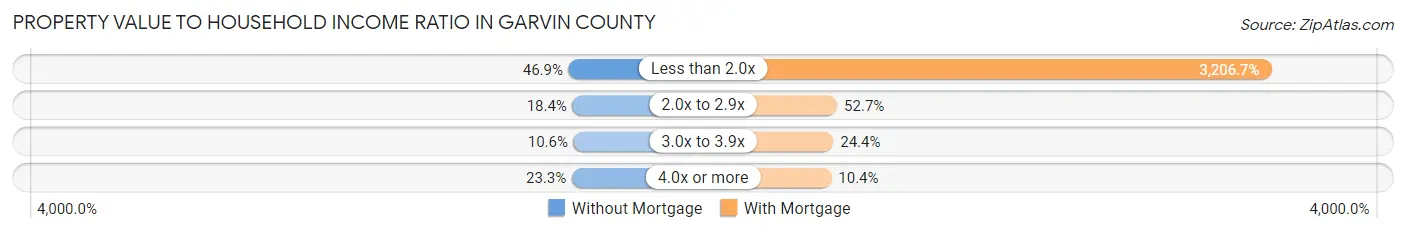
| Value-to-Income Ratio | Without Mortgage | With Mortgage |
| Less than 2.0x | 1,901 (46.9%) | 88,056 (3,206.7%) |
| 2.0x to 2.9x | 745 (18.4%) | 1,448 (52.7%) |
| 3.0x to 3.9x | 428 (10.5%) | 669 (24.4%) |
| 4.0x or more | 944 (23.3%) | 286 (10.4%) |
| Total | 4,057 (100.0%) | 2,746 (100.0%) |
Real Estate Taxes by Mortgage Status in Garvin County
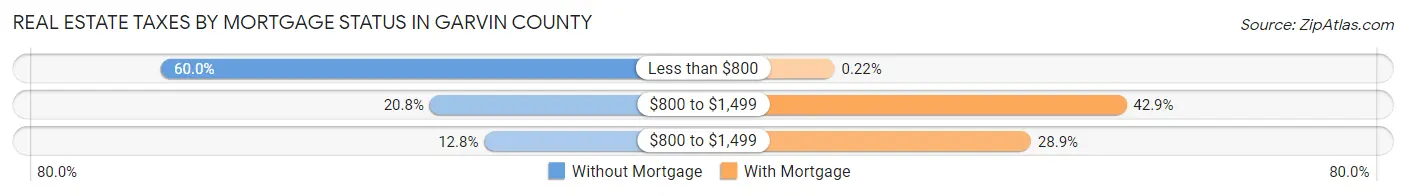
| Property Taxes | Without Mortgage | With Mortgage |
| Less than $800 | 2,436 (60.0%) | 6 (0.2%) |
| $800 to $1,499 | 844 (20.8%) | 1,177 (42.9%) |
| $800 to $1,499 | 521 (12.8%) | 794 (28.9%) |
| Total | 4,057 (100.0%) | 2,746 (100.0%) |
Health & Disability in Garvin County
Health Insurance Coverage by Age in Garvin County
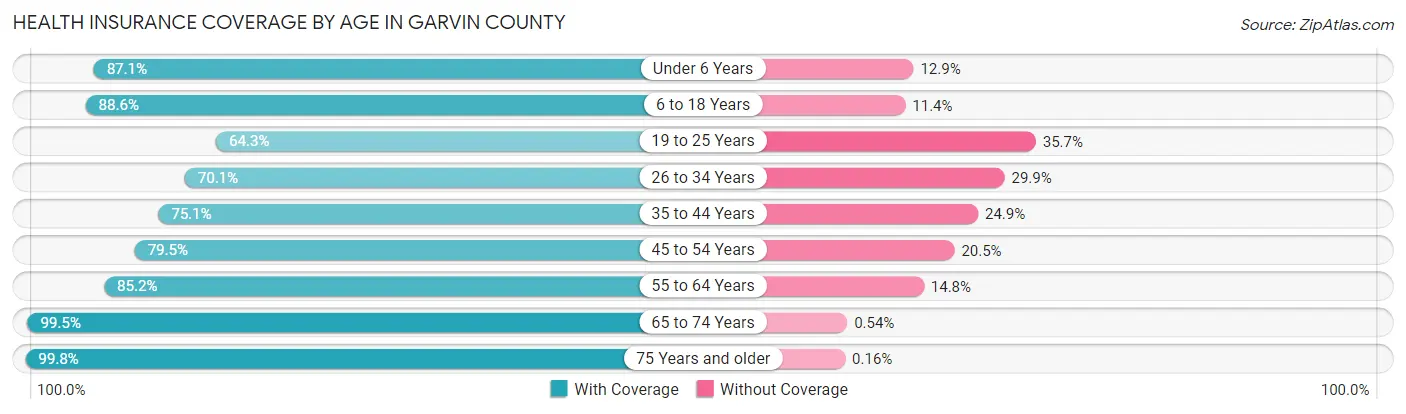
| Age Bracket | With Coverage | Without Coverage |
| Under 6 Years | 1,613 (87.1%) | 239 (12.9%) |
| 6 to 18 Years | 4,349 (88.6%) | 559 (11.4%) |
| 19 to 25 Years | 1,316 (64.3%) | 731 (35.7%) |
| 26 to 34 Years | 1,867 (70.1%) | 796 (29.9%) |
| 35 to 44 Years | 2,477 (75.1%) | 823 (24.9%) |
| 45 to 54 Years | 2,410 (79.5%) | 623 (20.5%) |
| 55 to 64 Years | 2,777 (85.2%) | 484 (14.8%) |
| 65 to 74 Years | 2,599 (99.5%) | 14 (0.5%) |
| 75 Years and older | 1,887 (99.8%) | 3 (0.2%) |
| Total | 21,295 (83.3%) | 4,272 (16.7%) |
Health Insurance Coverage by Citizenship Status in Garvin County
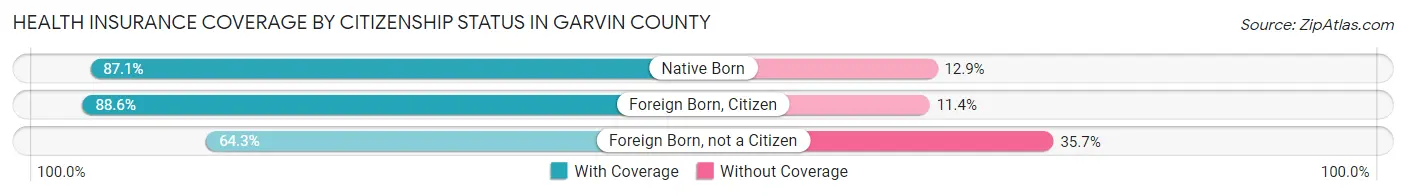
| Citizenship Status | With Coverage | Without Coverage |
| Native Born | 1,613 (87.1%) | 239 (12.9%) |
| Foreign Born, Citizen | 4,349 (88.6%) | 559 (11.4%) |
| Foreign Born, not a Citizen | 1,316 (64.3%) | 731 (35.7%) |
Health Insurance Coverage by Household Income in Garvin County
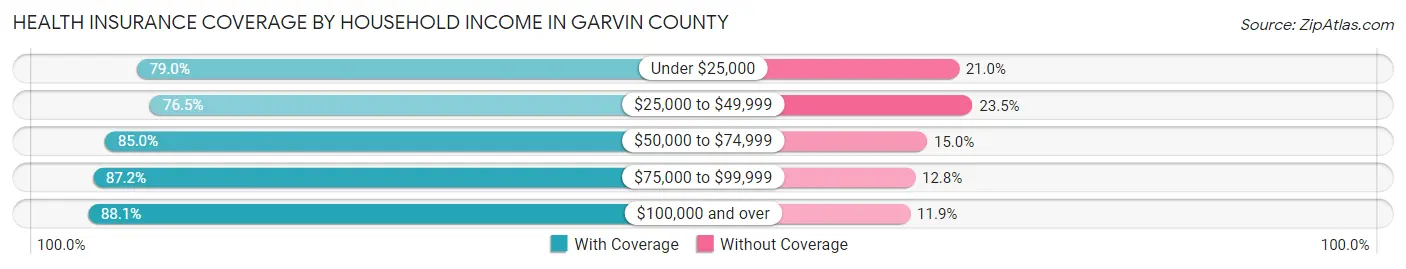
| Household Income | With Coverage | Without Coverage |
| Under $25,000 | 2,767 (79.0%) | 734 (21.0%) |
| $25,000 to $49,999 | 4,832 (76.5%) | 1,487 (23.5%) |
| $50,000 to $74,999 | 3,819 (85.0%) | 676 (15.0%) |
| $75,000 to $99,999 | 3,106 (87.2%) | 455 (12.8%) |
| $100,000 and over | 6,704 (88.1%) | 903 (11.9%) |
Public vs Private Health Insurance Coverage by Age in Garvin County
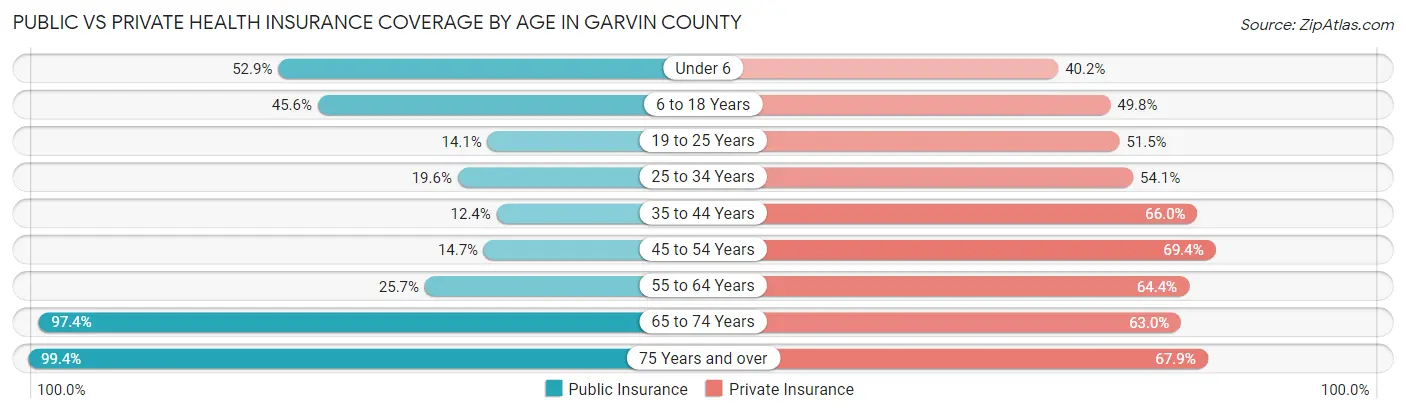
| Age Bracket | Public Insurance | Private Insurance |
| Under 6 | 980 (52.9%) | 744 (40.2%) |
| 6 to 18 Years | 2,237 (45.6%) | 2,446 (49.8%) |
| 19 to 25 Years | 288 (14.1%) | 1,055 (51.5%) |
| 25 to 34 Years | 522 (19.6%) | 1,440 (54.1%) |
| 35 to 44 Years | 409 (12.4%) | 2,178 (66.0%) |
| 45 to 54 Years | 447 (14.7%) | 2,104 (69.4%) |
| 55 to 64 Years | 838 (25.7%) | 2,101 (64.4%) |
| 65 to 74 Years | 2,546 (97.4%) | 1,646 (63.0%) |
| 75 Years and over | 1,878 (99.4%) | 1,283 (67.9%) |
| Total | 10,145 (39.7%) | 14,997 (58.7%) |
Disability Status by Sex by Age in Garvin County
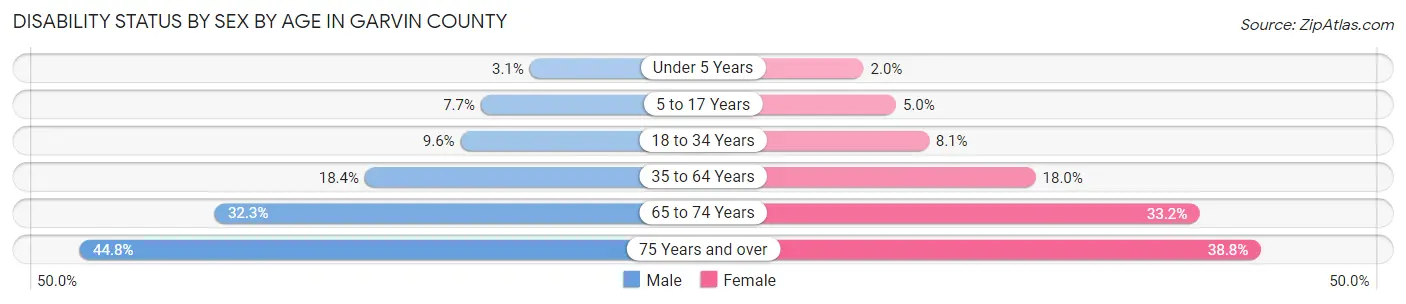
| Age Bracket | Male | Female |
| Under 5 Years | 25 (3.1%) | 15 (2.0%) |
| 5 to 17 Years | 193 (7.7%) | 119 (5.0%) |
| 18 to 34 Years | 243 (9.6%) | 202 (8.1%) |
| 35 to 64 Years | 886 (18.4%) | 861 (18.0%) |
| 65 to 74 Years | 408 (32.3%) | 448 (33.2%) |
| 75 Years and over | 352 (44.8%) | 429 (38.8%) |
Disability Class by Sex by Age in Garvin County
Disability Class: Hearing Difficulty
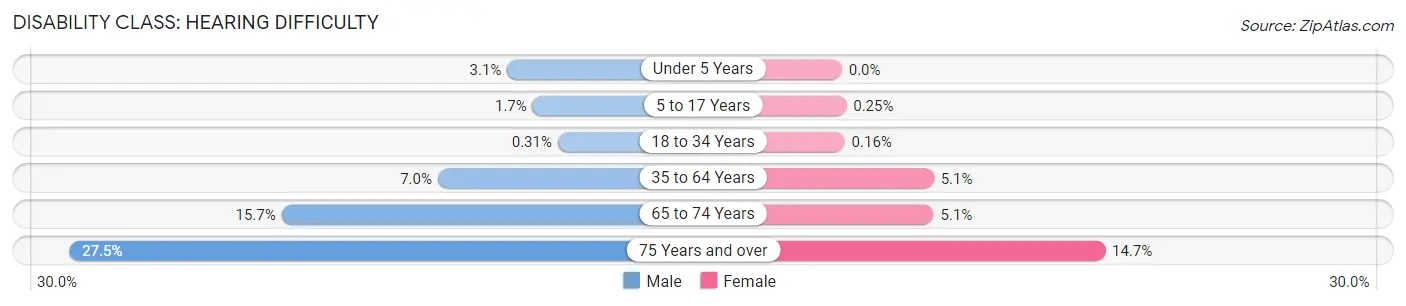
| Age Bracket | Male | Female |
| Under 5 Years | 25 (3.1%) | 0 (0.0%) |
| 5 to 17 Years | 43 (1.7%) | 6 (0.3%) |
| 18 to 34 Years | 8 (0.3%) | 4 (0.2%) |
| 35 to 64 Years | 336 (7.0%) | 245 (5.1%) |
| 65 to 74 Years | 198 (15.7%) | 69 (5.1%) |
| 75 Years and over | 216 (27.5%) | 162 (14.7%) |
Disability Class: Vision Difficulty
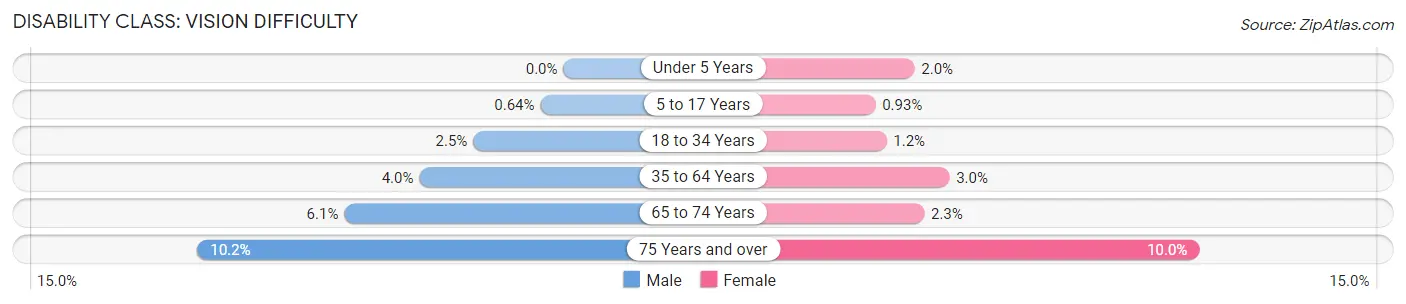
| Age Bracket | Male | Female |
| Under 5 Years | 0 (0.0%) | 15 (2.0%) |
| 5 to 17 Years | 16 (0.6%) | 22 (0.9%) |
| 18 to 34 Years | 64 (2.5%) | 31 (1.2%) |
| 35 to 64 Years | 193 (4.0%) | 143 (3.0%) |
| 65 to 74 Years | 77 (6.1%) | 31 (2.3%) |
| 75 Years and over | 80 (10.2%) | 110 (10.0%) |
Disability Class: Cognitive Difficulty
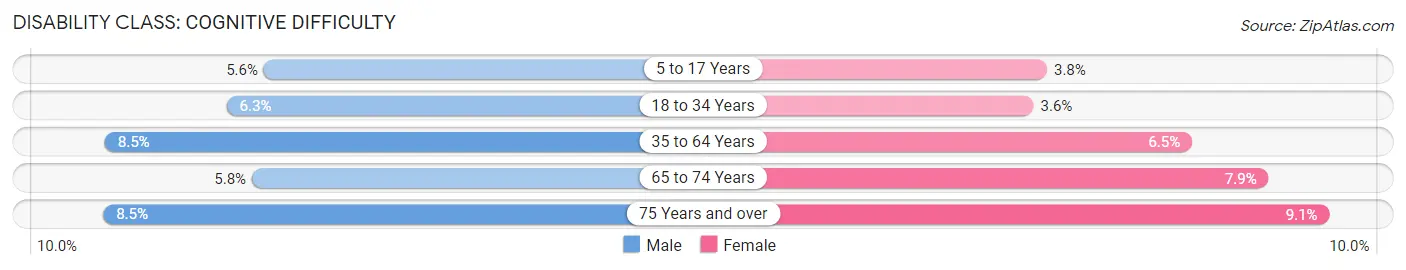
| Age Bracket | Male | Female |
| 5 to 17 Years | 140 (5.6%) | 90 (3.8%) |
| 18 to 34 Years | 159 (6.2%) | 89 (3.6%) |
| 35 to 64 Years | 409 (8.5%) | 311 (6.5%) |
| 65 to 74 Years | 73 (5.8%) | 107 (7.9%) |
| 75 Years and over | 67 (8.5%) | 100 (9.0%) |
Disability Class: Ambulatory Difficulty
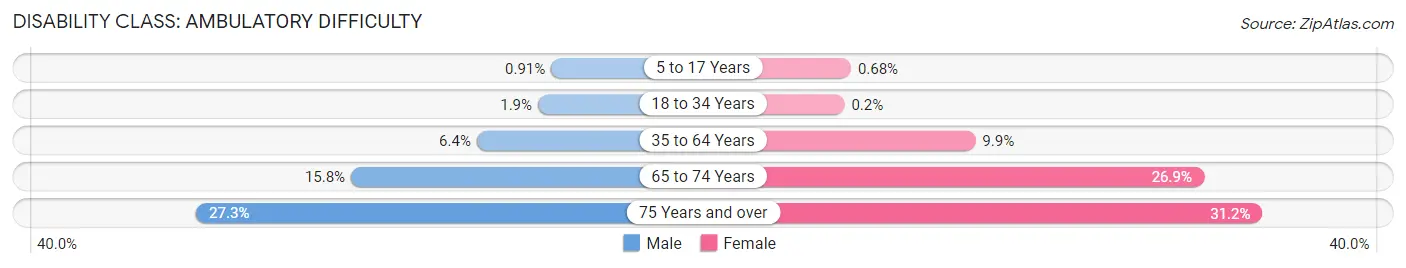
| Age Bracket | Male | Female |
| 5 to 17 Years | 23 (0.9%) | 16 (0.7%) |
| 18 to 34 Years | 48 (1.9%) | 5 (0.2%) |
| 35 to 64 Years | 309 (6.4%) | 475 (9.9%) |
| 65 to 74 Years | 199 (15.8%) | 363 (26.9%) |
| 75 Years and over | 214 (27.3%) | 345 (31.2%) |
Disability Class: Self-Care Difficulty
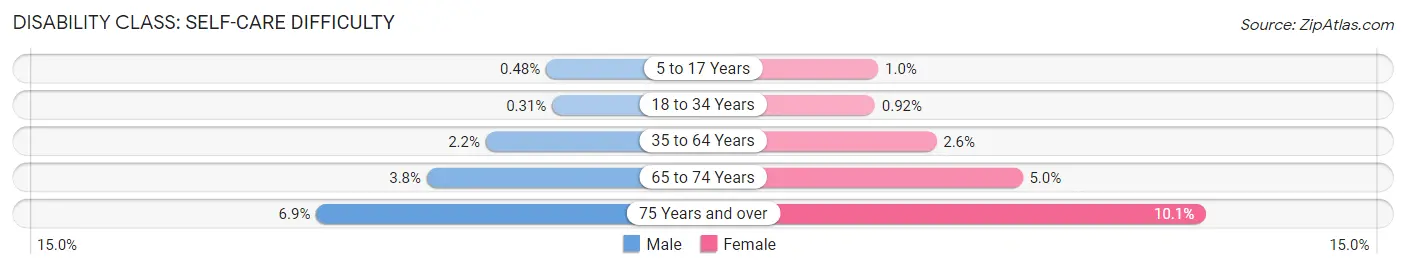
| Age Bracket | Male | Female |
| 5 to 17 Years | 12 (0.5%) | 24 (1.0%) |
| 18 to 34 Years | 8 (0.3%) | 23 (0.9%) |
| 35 to 64 Years | 104 (2.2%) | 126 (2.6%) |
| 65 to 74 Years | 48 (3.8%) | 68 (5.0%) |
| 75 Years and over | 54 (6.9%) | 112 (10.1%) |
Technology Access in Garvin County
Computing Device Access in Garvin County
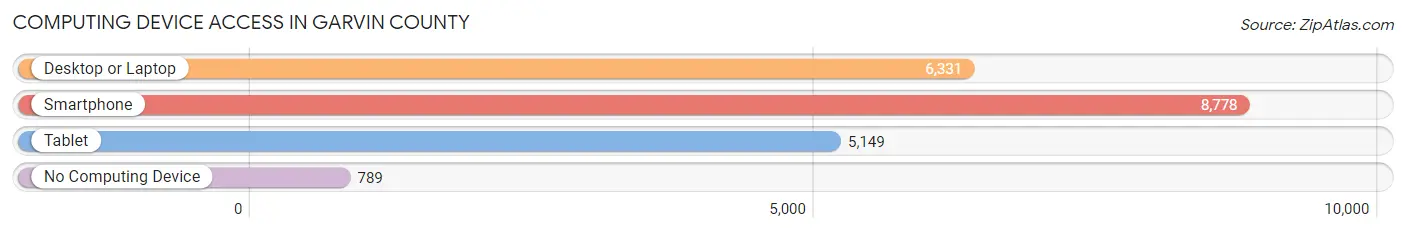
| Device Type | # Households | % Households |
| Desktop or Laptop | 6,331 | 63.9% |
| Smartphone | 8,778 | 88.6% |
| Tablet | 5,149 | 52.0% |
| No Computing Device | 789 | 8.0% |
| Total | 9,906 | 100.0% |
Internet Access in Garvin County
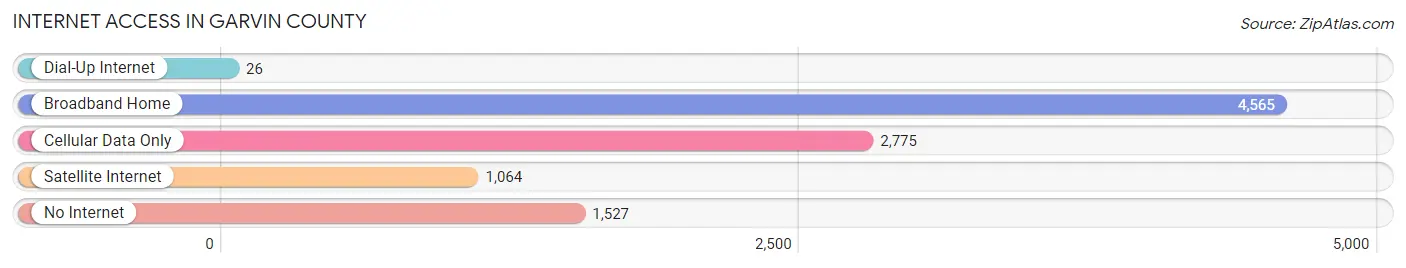
| Internet Type | # Households | % Households |
| Dial-Up Internet | 26 | 0.3% |
| Broadband Home | 4,565 | 46.1% |
| Cellular Data Only | 2,775 | 28.0% |
| Satellite Internet | 1,064 | 10.7% |
| No Internet | 1,527 | 15.4% |
| Total | 9,906 | 100.0% |
Garvin County Summary
Garvin County is located in south-central Oklahoma and is part of the Arbuckle Mountains region. It is bordered by Murray County to the north, Carter County to the east, Johnston County to the south, and Stephens County to the west. The county seat is Pauls Valley, and the largest city is Pauls Valley. The county was named for Samuel A. Garvin, a Confederate brigadier general from Arkansas.
Geography
Garvin County covers an area of 845 square miles and is located in the Arbuckle Mountains region of Oklahoma. The county is mostly hilly and is drained by the Washita River and its tributaries. The highest point in the county is located in the Arbuckle Mountains, at an elevation of 1,890 feet. The county is mostly covered in grassland, with some areas of forest.
Climate
Garvin County has a humid subtropical climate, with hot summers and mild winters. The average annual temperature is 64°F, and the average annual precipitation is 37 inches.
Demographics
As of the 2010 census, the population of Garvin County was 27,576, an increase of 8.3% from the 2000 census. The population density was 32.5 people per square mile. The racial makeup of the county was 81.2% White, 8.2% African American, 5.2% Native American, 0.5% Asian, 0.1% Pacific Islander, and 4.8% from other races. Hispanic or Latino of any race were 5.7% of the population.
The median household income was $37,945, and the median family income was $45,845. The per capita income was $18,845. About 14.2% of the population was below the poverty line.
Economy
The economy of Garvin County is largely based on agriculture and manufacturing. The county is home to several large farms, which produce a variety of crops, including cotton, corn, soybeans, and wheat. The county is also home to several manufacturing plants, which produce a variety of products, including automotive parts, furniture, and clothing.
The county is also home to several tourist attractions, including the Chickasaw National Recreation Area, the Arbuckle Mountains, and the Turner Falls Park. These attractions bring in a significant amount of tourism revenue to the county.
History
Garvin County was created in 1907 from parts of Murray, Carter, Johnston, and Stephens counties. The county was named for Samuel A. Garvin, a Confederate brigadier general from Arkansas.
The county was largely rural until the early 20th century, when oil was discovered in the area. This led to a boom in the local economy, and the population of the county grew rapidly. The county seat, Pauls Valley, was incorporated in 1910.
In the 1930s, the Great Depression hit the county hard, and the population declined. The economy slowly recovered in the 1940s and 1950s, and the population began to grow again.
In the 1960s, the county experienced another oil boom, and the population grew rapidly. The county has continued to grow since then, and the population is now more than double what it was in 1960.
Common Questions
What is Per Capita Income in Garvin County?
Per Capita income in Garvin County is $29,270.
What is the Median Family Income in Garvin County?
Median Family Income in Garvin County is $64,615.
What is the Median Household income in Garvin County?
Median Household Income in Garvin County is $53,600.
What is Income or Wage Gap in Garvin County?
Income or Wage Gap in Garvin County is 34.2%.
Women in Garvin County earn 65.8 cents for every dollar earned by a man.
What is Family Income Deficit in Garvin County?
Family Income Deficit in Garvin County is $11,873.
Families that are below poverty line in Garvin County earn $11,873 less on average than the poverty threshold level.
What is Inequality or Gini Index in Garvin County?
Inequality or Gini Index in Garvin County is 0.44.
What is the Total Population of Garvin County?
Total Population of Garvin County is 25,806.
What is the Total Male Population of Garvin County?
Total Male Population of Garvin County is 12,882.
What is the Total Female Population of Garvin County?
Total Female Population of Garvin County is 12,924.
What is the Ratio of Males per 100 Females in Garvin County?
There are 99.68 Males per 100 Females in Garvin County.
What is the Ratio of Females per 100 Males in Garvin County?
There are 100.33 Females per 100 Males in Garvin County.
What is the Median Population Age in Garvin County?
Median Population Age in Garvin County is 38.8 Years.
What is the Average Family Size in Garvin County
Average Family Size in Garvin County is 3.2 People.
What is the Average Household Size in Garvin County
Average Household Size in Garvin County is 2.6 People.
How Large is the Labor Force in Garvin County?
There are 11,118 People in the Labor Forcein in Garvin County.
What is the Percentage of People in the Labor Force in Garvin County?
55.1% of People are in the Labor Force in Garvin County.
What is the Unemployment Rate in Garvin County?
Unemployment Rate in Garvin County is 2.8%.