Craig County, OK Map & Demographics
Craig County Map
Craig County Overview
$24,199
PER CAPITA INCOME
$56,307
AVG FAMILY INCOME
$48,018
AVG HOUSEHOLD INCOME
22.4%
WAGE / INCOME GAP [ % ]
77.6¢/ $1
WAGE / INCOME GAP [ $ ]
$9,100
FAMILY INCOME DEFICIT
0.42
INEQUALITY / GINI INDEX
14,144
TOTAL POPULATION
7,269
MALE POPULATION
6,875
FEMALE POPULATION
105.73
MALES / 100 FEMALES
94.58
FEMALES / 100 MALES
41.2
MEDIAN AGE
3.0
AVG FAMILY SIZE
2.5
AVG HOUSEHOLD SIZE
5,653
LABOR FORCE [ PEOPLE ]
49.4%
PERCENT IN LABOR FORCE
4.6%
UNEMPLOYMENT RATE
Craig County Area Codes
Income in Craig County
Income Overview in Craig County
Per Capita Income in Craig County is $24,199, while median incomes of families and households are $56,307 and $48,018 respectively.
| Characteristic | Number | Measure |
| Per Capita Income | 14,144 | $24,199 |
| Median Family Income | 3,369 | $56,307 |
| Mean Family Income | 3,369 | $69,464 |
| Median Household Income | 5,176 | $48,018 |
| Mean Household Income | 5,176 | $61,657 |
| Income Deficit | 3,369 | $9,100 |
| Wage / Income Gap (%) | 14,144 | 22.37% |
| Wage / Income Gap ($) | 14,144 | 77.63¢ per $1 |
| Gini / Inequality Index | 14,144 | 0.42 |
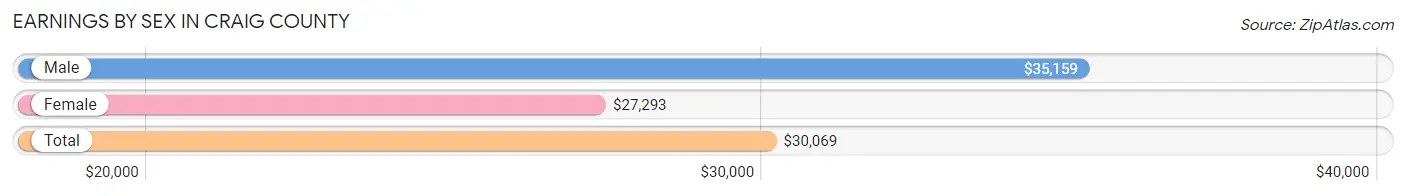
Earnings by Sex in Craig County
Average Earnings in Craig County are $30,069, $35,159 for men and $27,293 for women, a difference of 22.4%.
| Sex | Number | Average Earnings |
| Male | 3,056 (50.3%) | $35,159 |
| Female | 3,016 (49.7%) | $27,293 |
| Total | 6,072 (100.0%) | $30,069 |
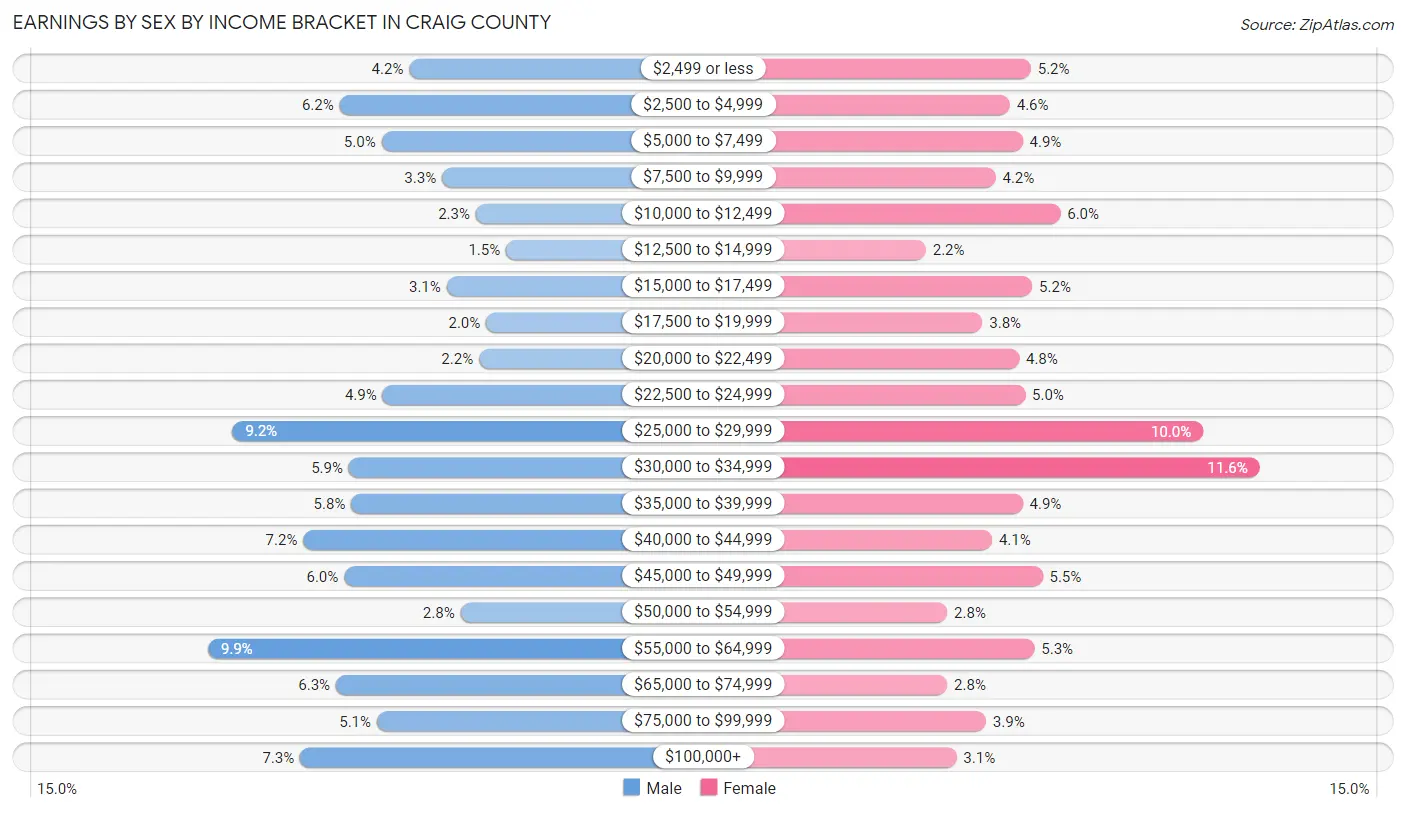
Earnings by Sex by Income Bracket in Craig County
The most common earnings brackets in Craig County are $55,000 to $64,999 for men (301 | 9.9%) and $30,000 to $34,999 for women (350 | 11.6%).
| Income | Male | Female |
| $2,499 or less | 128 (4.2%) | 156 (5.2%) |
| $2,500 to $4,999 | 188 (6.1%) | 138 (4.6%) |
| $5,000 to $7,499 | 152 (5.0%) | 149 (4.9%) |
| $7,500 to $9,999 | 100 (3.3%) | 126 (4.2%) |
| $10,000 to $12,499 | 71 (2.3%) | 181 (6.0%) |
| $12,500 to $14,999 | 45 (1.5%) | 67 (2.2%) |
| $15,000 to $17,499 | 96 (3.1%) | 157 (5.2%) |
| $17,500 to $19,999 | 62 (2.0%) | 115 (3.8%) |
| $20,000 to $22,499 | 68 (2.2%) | 146 (4.8%) |
| $22,500 to $24,999 | 151 (4.9%) | 151 (5.0%) |
| $25,000 to $29,999 | 280 (9.2%) | 302 (10.0%) |
| $30,000 to $34,999 | 180 (5.9%) | 350 (11.6%) |
| $35,000 to $39,999 | 178 (5.8%) | 149 (4.9%) |
| $40,000 to $44,999 | 219 (7.2%) | 123 (4.1%) |
| $45,000 to $49,999 | 184 (6.0%) | 166 (5.5%) |
| $50,000 to $54,999 | 84 (2.8%) | 85 (2.8%) |
| $55,000 to $64,999 | 301 (9.9%) | 159 (5.3%) |
| $65,000 to $74,999 | 191 (6.2%) | 85 (2.8%) |
| $75,000 to $99,999 | 156 (5.1%) | 118 (3.9%) |
| $100,000+ | 222 (7.3%) | 93 (3.1%) |
| Total | 3,056 (100.0%) | 3,016 (100.0%) |
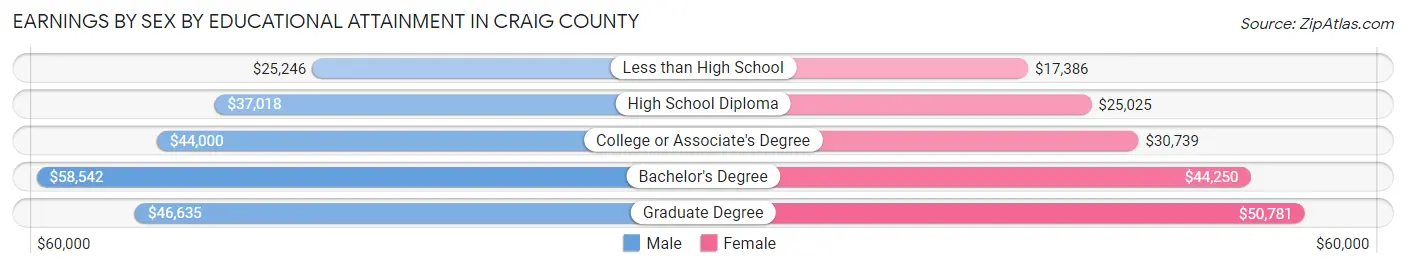
Earnings by Sex by Educational Attainment in Craig County
Average earnings in Craig County are $39,577 for men and $29,623 for women, a difference of 25.2%. Men with an educational attainment of bachelor's degree enjoy the highest average annual earnings of $58,542, while those with less than high school education earn the least with $25,246. Women with an educational attainment of graduate degree earn the most with the average annual earnings of $50,781, while those with less than high school education have the smallest earnings of $17,386.
| Educational Attainment | Male Income | Female Income |
| Less than High School | $25,246 | $17,386 |
| High School Diploma | $37,018 | $25,025 |
| College or Associate's Degree | $44,000 | $30,739 |
| Bachelor's Degree | $58,542 | $44,250 |
| Graduate Degree | $46,635 | $50,781 |
| Total | $39,577 | $29,623 |
Family Income in Craig County
Family Income Brackets in Craig County
According to the Craig County family income data, there are 751 families falling into the $50,000 to $74,999 income range, which is the most common income bracket and makes up 22.3% of all families. Conversely, the $10,000 to $14,999 income bracket is the least frequent group with only 74 families (2.2%) belonging to this category.
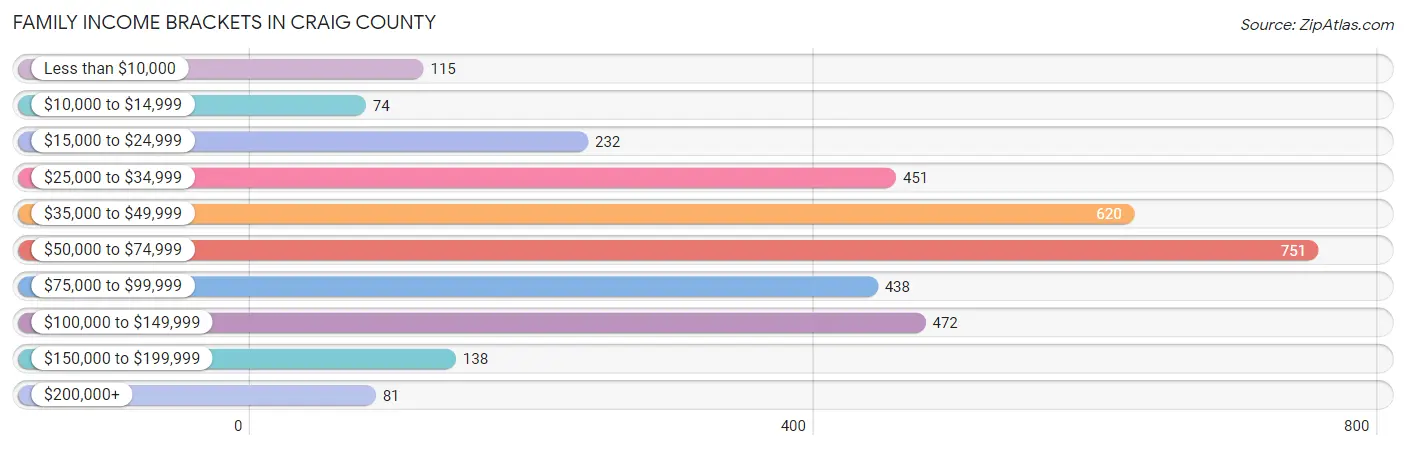
| Income Bracket | # Families | % Families |
| Less than $10,000 | 115 | 3.4% |
| $10,000 to $14,999 | 74 | 2.2% |
| $15,000 to $24,999 | 232 | 6.9% |
| $25,000 to $34,999 | 451 | 13.4% |
| $35,000 to $49,999 | 620 | 18.4% |
| $50,000 to $74,999 | 751 | 22.3% |
| $75,000 to $99,999 | 438 | 13.0% |
| $100,000 to $149,999 | 472 | 14.0% |
| $150,000 to $199,999 | 138 | 4.1% |
| $200,000+ | 81 | 2.4% |
Family Income by Famaliy Size in Craig County
4-person families (525 | 15.6%) account for the highest median family income in Craig County with $74,129 per family, while 2-person families (1,790 | 53.1%) have the highest median income of $25,608 per family member.
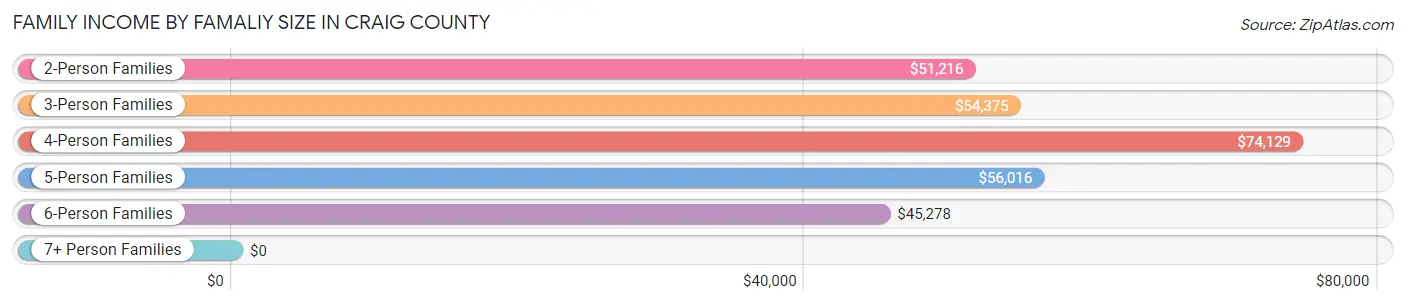
| Income Bracket | # Families | Median Income |
| 2-Person Families | 1,790 (53.1%) | $51,216 |
| 3-Person Families | 732 (21.7%) | $54,375 |
| 4-Person Families | 525 (15.6%) | $74,129 |
| 5-Person Families | 231 (6.9%) | $56,016 |
| 6-Person Families | 76 (2.3%) | $45,278 |
| 7+ Person Families | 15 (0.4%) | $0 |
| Total | 3,369 (100.0%) | $56,307 |
Family Income by Number of Earners in Craig County
The median family income in Craig County is $56,307, with families comprising 3+ earners (235) having the highest median family income of $102,292, while families with no earners (693) have the lowest median family income of $36,133, accounting for 7.0% and 20.6% of families, respectively.
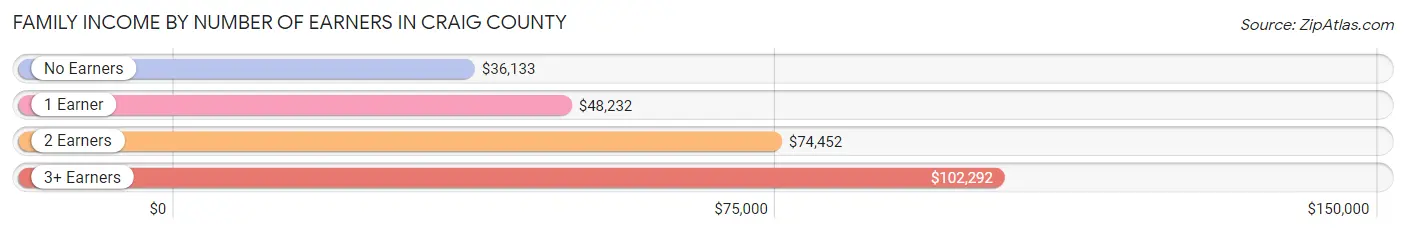
| Number of Earners | # Families | Median Income |
| No Earners | 693 (20.6%) | $36,133 |
| 1 Earner | 1,266 (37.6%) | $48,232 |
| 2 Earners | 1,175 (34.9%) | $74,452 |
| 3+ Earners | 235 (7.0%) | $102,292 |
| Total | 3,369 (100.0%) | $56,307 |
Household Income in Craig County
Household Income Brackets in Craig County
With 1,046 households falling in the category, the $50,000 to $74,999 income range is the most frequent in Craig County, accounting for 20.2% of all households. In contrast, only 114 households (2.2%) fall into the $200,000+ income bracket, making it the least populous group.
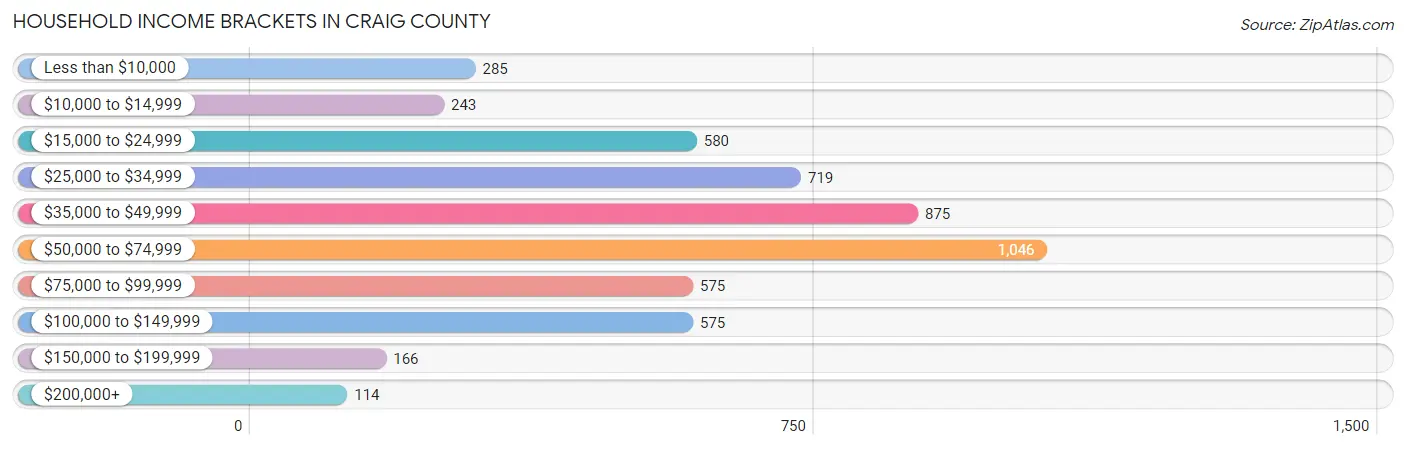
| Income Bracket | # Households | % Households |
| Less than $10,000 | 285 | 5.5% |
| $10,000 to $14,999 | 243 | 4.7% |
| $15,000 to $24,999 | 580 | 11.2% |
| $25,000 to $34,999 | 719 | 13.9% |
| $35,000 to $49,999 | 875 | 16.9% |
| $50,000 to $74,999 | 1,046 | 20.2% |
| $75,000 to $99,999 | 575 | 11.1% |
| $100,000 to $149,999 | 575 | 11.1% |
| $150,000 to $199,999 | 166 | 3.2% |
| $200,000+ | 114 | 2.2% |
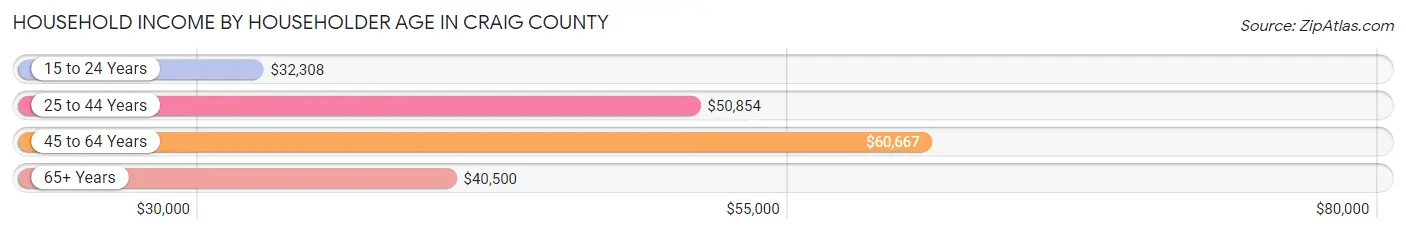
Household Income by Householder Age in Craig County
The median household income in Craig County is $48,018, with the highest median household income of $60,667 found in the 45 to 64 years age bracket for the primary householder. A total of 1,828 households (35.3%) fall into this category. Meanwhile, the 15 to 24 years age bracket for the primary householder has the lowest median household income of $32,308, with 212 households (4.1%) in this group.
| Income Bracket | # Households | Median Income |
| 15 to 24 Years | 212 (4.1%) | $32,308 |
| 25 to 44 Years | 1,448 (28.0%) | $50,854 |
| 45 to 64 Years | 1,828 (35.3%) | $60,667 |
| 65+ Years | 1,688 (32.6%) | $40,500 |
| Total | 5,176 (100.0%) | $48,018 |
Poverty in Craig County
Income Below Poverty by Sex and Age in Craig County
With 19.6% poverty level for males and 18.9% for females among the residents of Craig County, under 5 year old males and 6 to 11 year old females are the most vulnerable to poverty, with 119 males (31.8%) and 191 females (33.5%) in their respective age groups living below the poverty level.
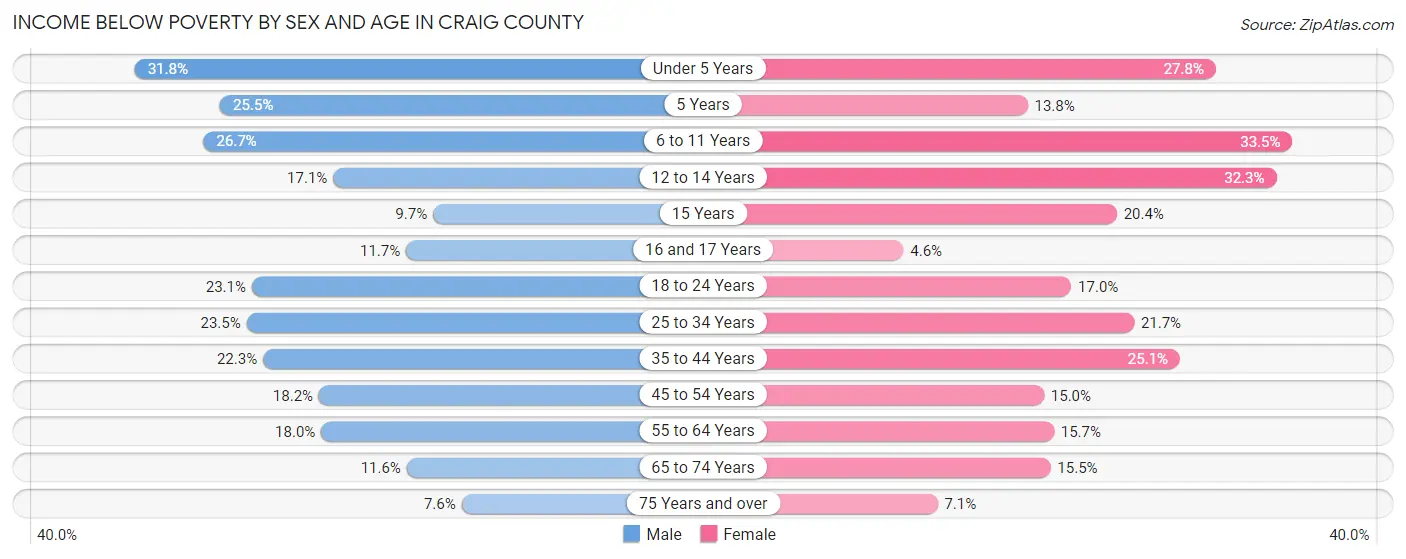
| Age Bracket | Male | Female |
| Under 5 Years | 119 (31.8%) | 93 (27.8%) |
| 5 Years | 13 (25.5%) | 8 (13.8%) |
| 6 to 11 Years | 167 (26.7%) | 191 (33.5%) |
| 12 to 14 Years | 40 (17.1%) | 60 (32.3%) |
| 15 Years | 6 (9.7%) | 20 (20.4%) |
| 16 and 17 Years | 25 (11.7%) | 8 (4.6%) |
| 18 to 24 Years | 136 (23.1%) | 85 (17.0%) |
| 25 to 34 Years | 175 (23.5%) | 175 (21.7%) |
| 35 to 44 Years | 169 (22.3%) | 196 (25.1%) |
| 45 to 54 Years | 137 (18.1%) | 126 (15.0%) |
| 55 to 64 Years | 164 (18.0%) | 150 (15.7%) |
| 65 to 74 Years | 79 (11.6%) | 112 (15.5%) |
| 75 Years and over | 34 (7.6%) | 50 (7.1%) |
| Total | 1,264 (19.6%) | 1,274 (18.9%) |
Income Above Poverty by Sex and Age in Craig County
According to the poverty statistics in Craig County, males aged 75 years and over and females aged 16 and 17 years are the age groups that are most secure financially, with 92.4% of males and 95.4% of females in these age groups living above the poverty line.
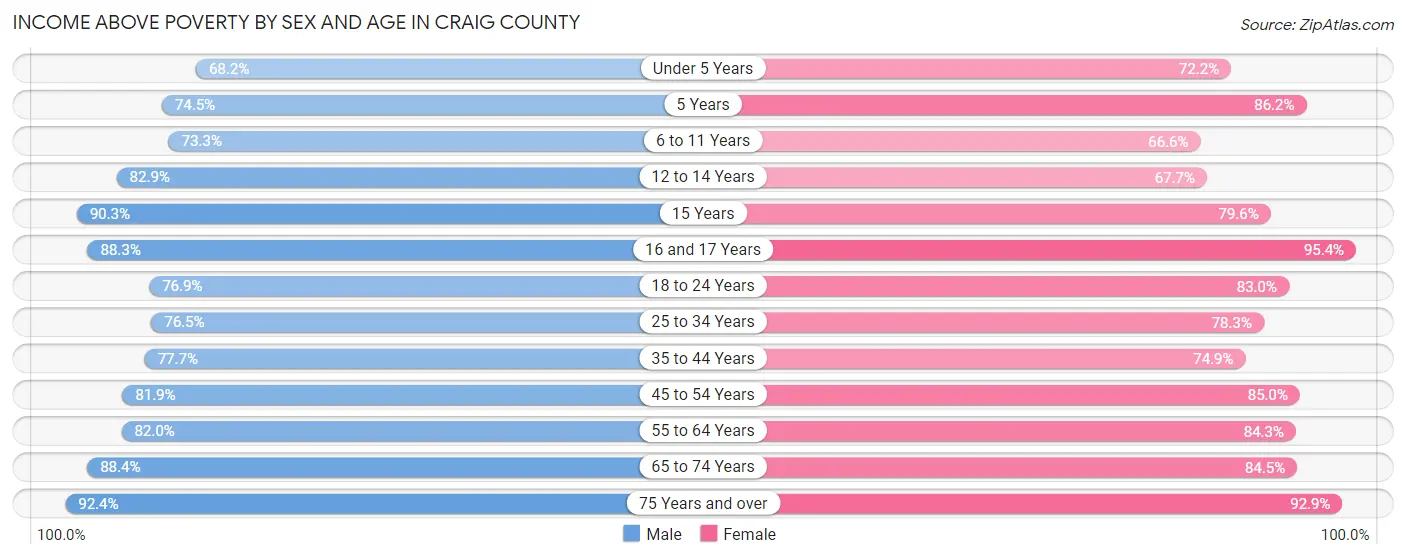
| Age Bracket | Male | Female |
| Under 5 Years | 255 (68.2%) | 242 (72.2%) |
| 5 Years | 38 (74.5%) | 50 (86.2%) |
| 6 to 11 Years | 458 (73.3%) | 380 (66.5%) |
| 12 to 14 Years | 194 (82.9%) | 126 (67.7%) |
| 15 Years | 56 (90.3%) | 78 (79.6%) |
| 16 and 17 Years | 189 (88.3%) | 167 (95.4%) |
| 18 to 24 Years | 452 (76.9%) | 414 (83.0%) |
| 25 to 34 Years | 569 (76.5%) | 632 (78.3%) |
| 35 to 44 Years | 589 (77.7%) | 585 (74.9%) |
| 45 to 54 Years | 618 (81.9%) | 714 (85.0%) |
| 55 to 64 Years | 748 (82.0%) | 803 (84.3%) |
| 65 to 74 Years | 600 (88.4%) | 611 (84.5%) |
| 75 Years and over | 416 (92.4%) | 654 (92.9%) |
| Total | 5,182 (80.4%) | 5,456 (81.1%) |
Income Below Poverty Among Married-Couple Families in Craig County
The poverty statistics for married-couple families in Craig County show that 9.3% or 228 of the total 2,439 families live below the poverty line. Families with 5 or more children have the highest poverty rate of 83.3%, comprising of 10 families. On the other hand, families with no children have the lowest poverty rate of 6.5%, which includes 101 families.
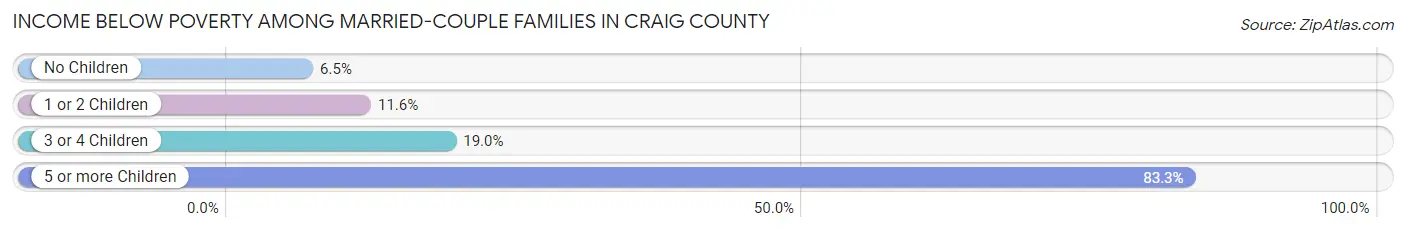
| Children | Above Poverty | Below Poverty |
| No Children | 1,444 (93.5%) | 101 (6.5%) |
| 1 or 2 Children | 603 (88.4%) | 79 (11.6%) |
| 3 or 4 Children | 162 (81.0%) | 38 (19.0%) |
| 5 or more Children | 2 (16.7%) | 10 (83.3%) |
| Total | 2,211 (90.6%) | 228 (9.3%) |
Income Below Poverty Among Single-Parent Households in Craig County
According to the poverty data in Craig County, 26.1% or 86 single-father households and 21.7% or 130 single-mother households are living below the poverty line. Among single-father households, those with 3 or 4 children have the highest poverty rate, with 33 households (60.0%) experiencing poverty. Likewise, among single-mother households, those with 3 or 4 children have the highest poverty rate, with 29 households (63.0%) falling below the poverty line.
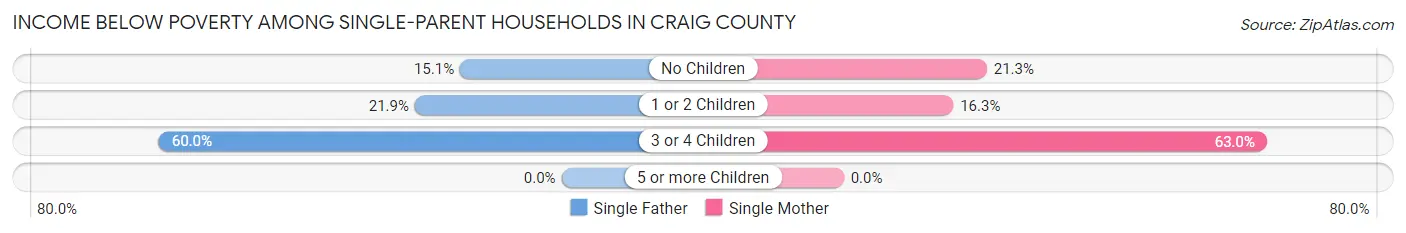
| Children | Single Father | Single Mother |
| No Children | 13 (15.1%) | 45 (21.3%) |
| 1 or 2 Children | 40 (21.9%) | 56 (16.3%) |
| 3 or 4 Children | 33 (60.0%) | 29 (63.0%) |
| 5 or more Children | 0 (0.0%) | 0 (0.0%) |
| Total | 86 (26.1%) | 130 (21.7%) |
Income Below Poverty Among Married-Couple vs Single-Parent Households in Craig County
The poverty data for Craig County shows that 228 of the married-couple family households (9.3%) and 216 of the single-parent households (23.2%) are living below the poverty level. Within the married-couple family households, those with 5 or more children have the highest poverty rate, with 10 households (83.3%) falling below the poverty line. Among the single-parent households, those with 3 or 4 children have the highest poverty rate, with 62 household (61.4%) living below poverty.
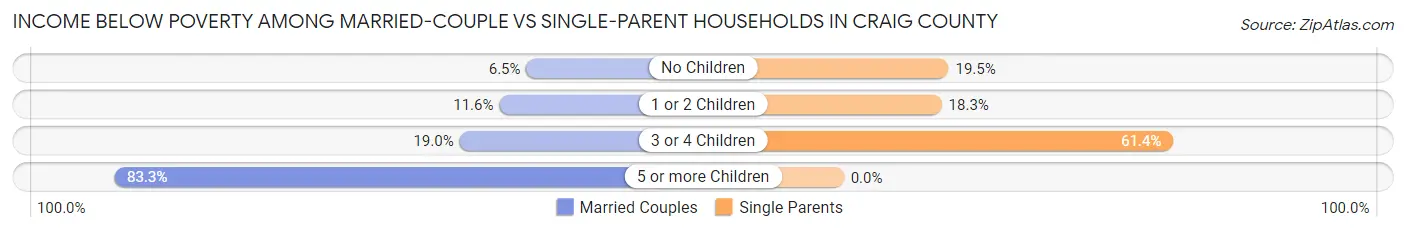
| Children | Married-Couple Families | Single-Parent Households |
| No Children | 101 (6.5%) | 58 (19.5%) |
| 1 or 2 Children | 79 (11.6%) | 96 (18.2%) |
| 3 or 4 Children | 38 (19.0%) | 62 (61.4%) |
| 5 or more Children | 10 (83.3%) | 0 (0.0%) |
| Total | 228 (9.3%) | 216 (23.2%) |
Race in Craig County
The most populous races in Craig County are White / Caucasian (8,756 | 61.9%), Native / Alaskan (3,052 | 21.6%), and Two or more Races (1,441 | 10.2%).
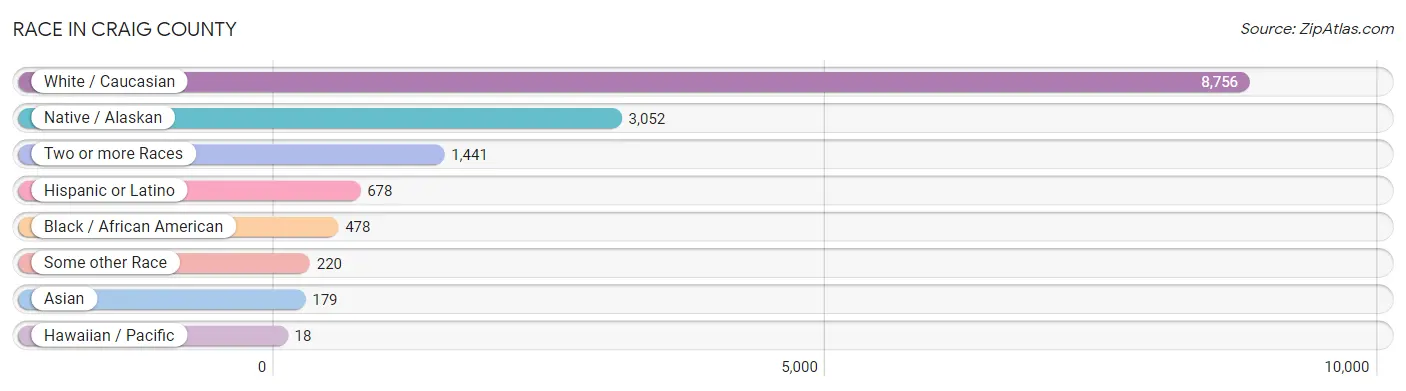
| Race | # Population | % Population |
| Asian | 179 | 1.3% |
| Black / African American | 478 | 3.4% |
| Hawaiian / Pacific | 18 | 0.1% |
| Hispanic or Latino | 678 | 4.8% |
| Native / Alaskan | 3,052 | 21.6% |
| White / Caucasian | 8,756 | 61.9% |
| Two or more Races | 1,441 | 10.2% |
| Some other Race | 220 | 1.6% |
| Total | 14,144 | 100.0% |
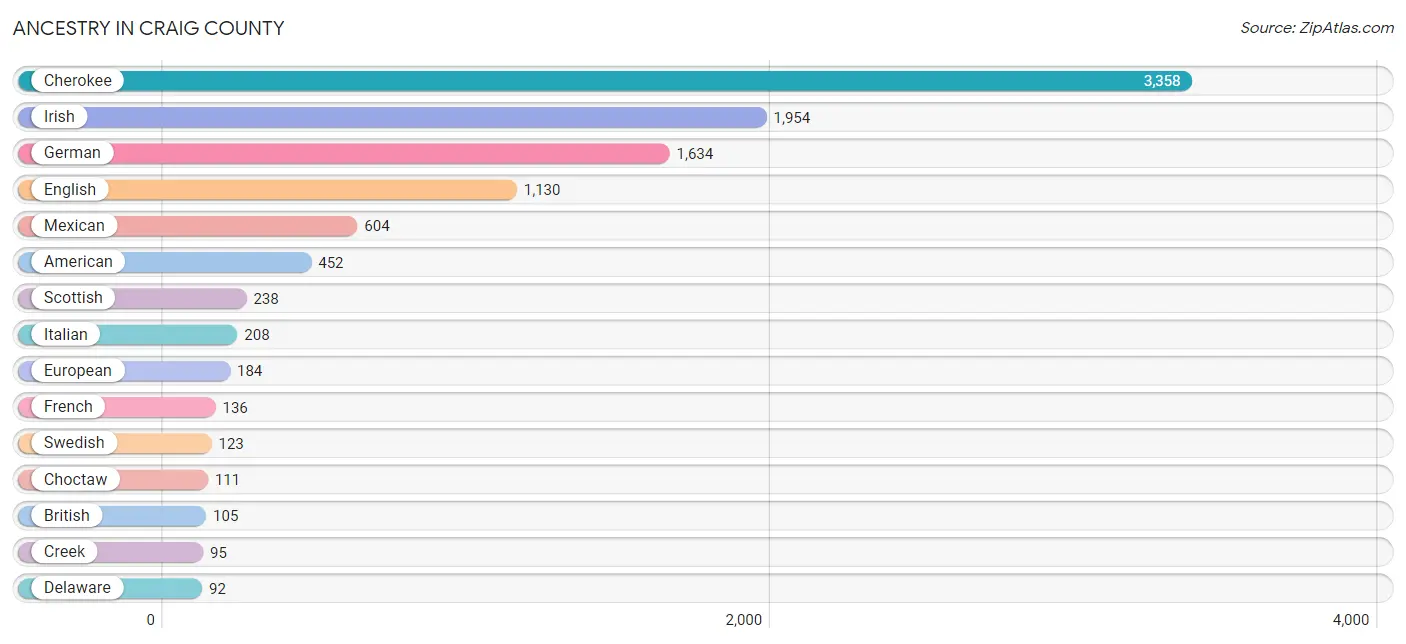
Ancestry in Craig County
The most populous ancestries reported in Craig County are Cherokee (3,358 | 23.7%), Irish (1,954 | 13.8%), German (1,634 | 11.6%), English (1,130 | 8.0%), and Mexican (604 | 4.3%), together accounting for 61.4% of all Craig County residents.
| Ancestry | # Population | % Population |
| African | 35 | 0.3% |
| Alsatian | 1 | 0.0% |
| American | 452 | 3.2% |
| Apache | 4 | 0.0% |
| Bangladeshi | 65 | 0.5% |
| Blackfeet | 10 | 0.1% |
| British | 105 | 0.7% |
| Burmese | 16 | 0.1% |
| Cajun | 19 | 0.1% |
| Canadian | 17 | 0.1% |
| Celtic | 6 | 0.0% |
| Cherokee | 3,358 | 23.7% |
| Cheyenne | 4 | 0.0% |
| Chickasaw | 8 | 0.1% |
| Choctaw | 111 | 0.8% |
| Colombian | 28 | 0.2% |
| Comanche | 24 | 0.2% |
| Creek | 95 | 0.7% |
| Czech | 13 | 0.1% |
| Czechoslovakian | 4 | 0.0% |
| Danish | 3 | 0.0% |
| Delaware | 92 | 0.6% |
| Dutch | 90 | 0.6% |
| Dutch West Indian | 23 | 0.2% |
| Eastern European | 40 | 0.3% |
| English | 1,130 | 8.0% |
| European | 184 | 1.3% |
| Finnish | 4 | 0.0% |
| French | 136 | 1.0% |
| French Canadian | 10 | 0.1% |
| German | 1,634 | 11.6% |
| Haitian | 10 | 0.1% |
| Indian (Asian) | 30 | 0.2% |
| Irish | 1,954 | 13.8% |
| Iroquois | 53 | 0.4% |
| Israeli | 5 | 0.0% |
| Italian | 208 | 1.5% |
| Jamaican | 25 | 0.2% |
| Kiowa | 11 | 0.1% |
| Korean | 18 | 0.1% |
| Laotian | 23 | 0.2% |
| Latvian | 39 | 0.3% |
| Malaysian | 5 | 0.0% |
| Mexican | 604 | 4.3% |
| Native Hawaiian | 18 | 0.1% |
| Navajo | 4 | 0.0% |
| Nigerian | 2 | 0.0% |
| Northern European | 16 | 0.1% |
| Norwegian | 76 | 0.5% |
| Osage | 3 | 0.0% |
| Ottawa | 47 | 0.3% |
| Pakistani | 4 | 0.0% |
| Peruvian | 3 | 0.0% |
| Polish | 9 | 0.1% |
| Portuguese | 25 | 0.2% |
| Potawatomi | 34 | 0.2% |
| Puerto Rican | 13 | 0.1% |
| Russian | 13 | 0.1% |
| Samoan | 6 | 0.0% |
| Scandinavian | 21 | 0.2% |
| Scotch-Irish | 78 | 0.5% |
| Scottish | 238 | 1.7% |
| Sioux | 4 | 0.0% |
| Slovak | 5 | 0.0% |
| South American | 38 | 0.3% |
| Spaniard | 11 | 0.1% |
| Spanish | 6 | 0.0% |
| Sri Lankan | 52 | 0.4% |
| Subsaharan African | 37 | 0.3% |
| Swedish | 123 | 0.9% |
| Swiss | 10 | 0.1% |
| Venezuelan | 7 | 0.1% |
| Welsh | 12 | 0.1% | View All 73 Rows |
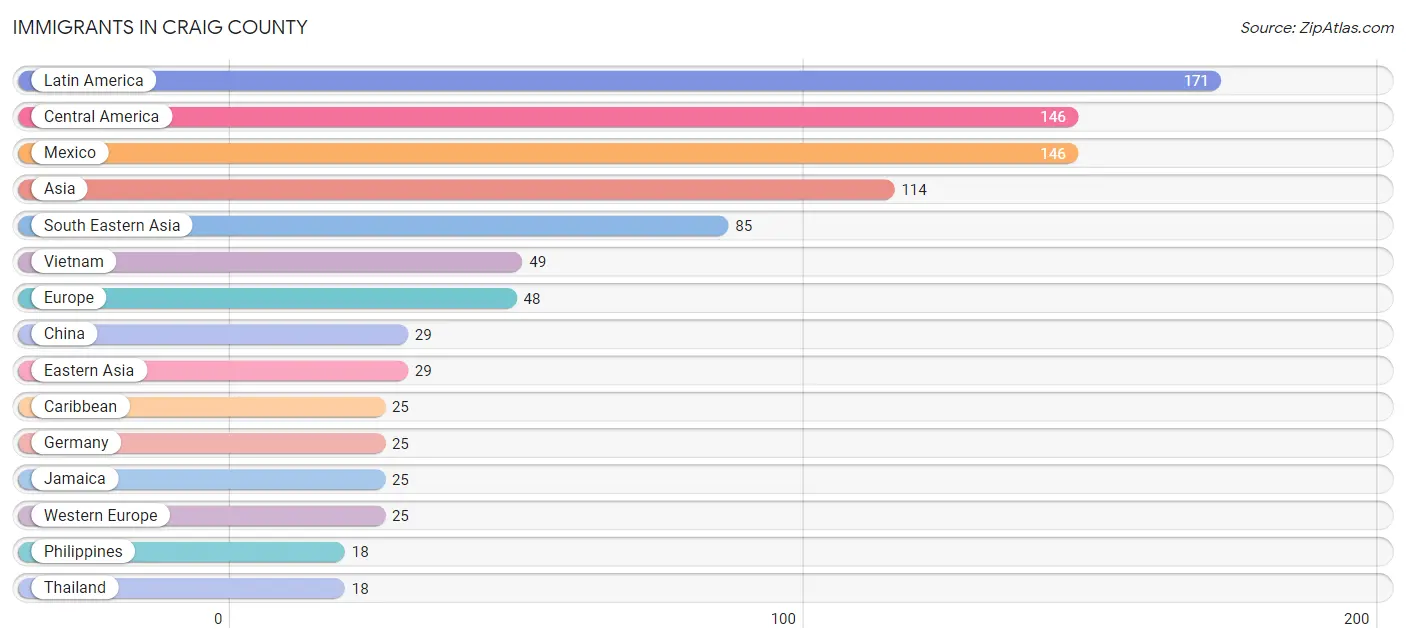
Immigrants in Craig County
The most numerous immigrant groups reported in Craig County came from Latin America (171 | 1.2%), Central America (146 | 1.0%), Mexico (146 | 1.0%), Asia (114 | 0.8%), and South Eastern Asia (85 | 0.6%), together accounting for 4.7% of all Craig County residents.
| Immigration Origin | # Population | % Population |
| Africa | 3 | 0.0% |
| Asia | 114 | 0.8% |
| Australia | 12 | 0.1% |
| Canada | 2 | 0.0% |
| Caribbean | 25 | 0.2% |
| Central America | 146 | 1.0% |
| China | 29 | 0.2% |
| Czechoslovakia | 6 | 0.0% |
| Eastern Africa | 3 | 0.0% |
| Eastern Asia | 29 | 0.2% |
| Eastern Europe | 9 | 0.1% |
| Europe | 48 | 0.3% |
| Germany | 25 | 0.2% |
| Jamaica | 25 | 0.2% |
| Latin America | 171 | 1.2% |
| Mexico | 146 | 1.0% |
| Northern Europe | 5 | 0.0% |
| Oceania | 12 | 0.1% |
| Philippines | 18 | 0.1% |
| Portugal | 9 | 0.1% |
| Russia | 3 | 0.0% |
| Scotland | 3 | 0.0% |
| South Eastern Asia | 85 | 0.6% |
| Southern Europe | 9 | 0.1% |
| Sweden | 2 | 0.0% |
| Thailand | 18 | 0.1% |
| Vietnam | 49 | 0.4% |
| Western Europe | 25 | 0.2% |
| Zimbabwe | 3 | 0.0% | View All 29 Rows |
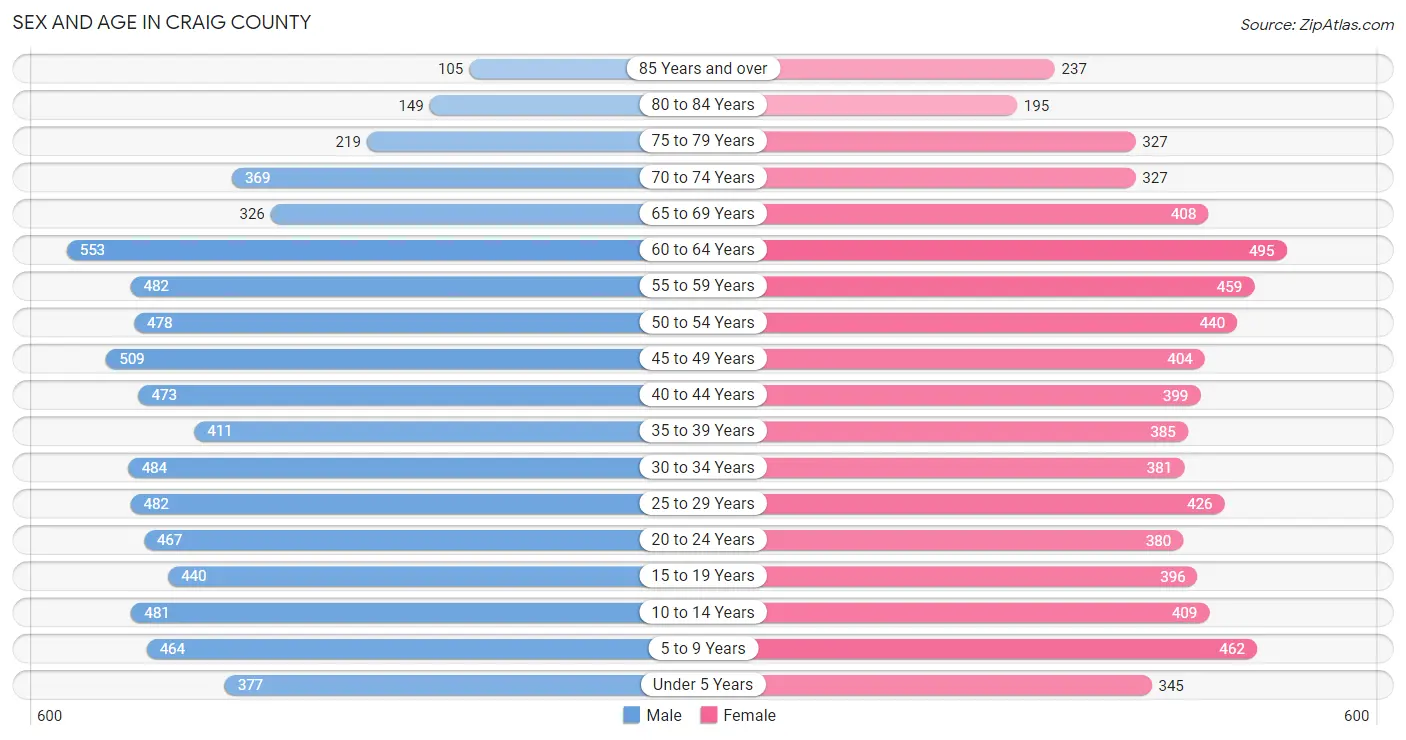
Sex and Age in Craig County
Sex and Age in Craig County
The most populous age groups in Craig County are 60 to 64 Years (553 | 7.6%) for men and 60 to 64 Years (495 | 7.2%) for women.
| Age Bracket | Male | Female |
| Under 5 Years | 377 (5.2%) | 345 (5.0%) |
| 5 to 9 Years | 464 (6.4%) | 462 (6.7%) |
| 10 to 14 Years | 481 (6.6%) | 409 (5.9%) |
| 15 to 19 Years | 440 (6.0%) | 396 (5.8%) |
| 20 to 24 Years | 467 (6.4%) | 380 (5.5%) |
| 25 to 29 Years | 482 (6.6%) | 426 (6.2%) |
| 30 to 34 Years | 484 (6.7%) | 381 (5.5%) |
| 35 to 39 Years | 411 (5.7%) | 385 (5.6%) |
| 40 to 44 Years | 473 (6.5%) | 399 (5.8%) |
| 45 to 49 Years | 509 (7.0%) | 404 (5.9%) |
| 50 to 54 Years | 478 (6.6%) | 440 (6.4%) |
| 55 to 59 Years | 482 (6.6%) | 459 (6.7%) |
| 60 to 64 Years | 553 (7.6%) | 495 (7.2%) |
| 65 to 69 Years | 326 (4.5%) | 408 (5.9%) |
| 70 to 74 Years | 369 (5.1%) | 327 (4.8%) |
| 75 to 79 Years | 219 (3.0%) | 327 (4.8%) |
| 80 to 84 Years | 149 (2.1%) | 195 (2.8%) |
| 85 Years and over | 105 (1.4%) | 237 (3.5%) |
| Total | 7,269 (100.0%) | 6,875 (100.0%) |
Families and Households in Craig County
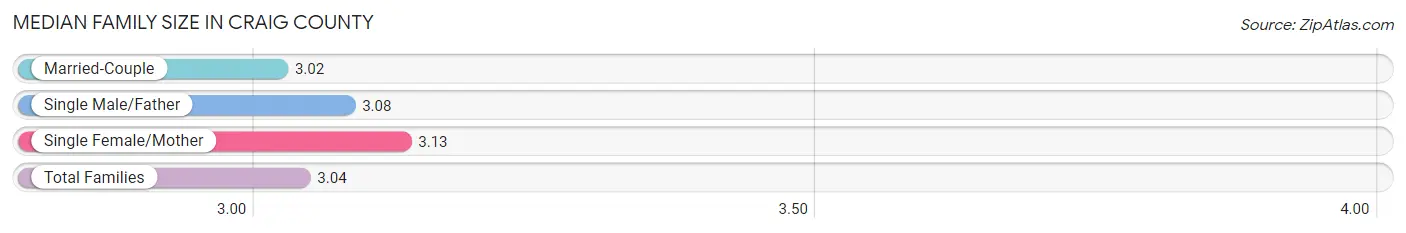
Median Family Size in Craig County
The median family size in Craig County is 3.04 persons per family, with single female/mother families (600 | 17.8%) accounting for the largest median family size of 3.13 persons per family. On the other hand, married-couple families (2,439 | 72.4%) represent the smallest median family size with 3.02 persons per family.
| Family Type | # Families | Family Size |
| Married-Couple | 2,439 (72.4%) | 3.02 |
| Single Male/Father | 330 (9.8%) | 3.08 |
| Single Female/Mother | 600 (17.8%) | 3.13 |
| Total Families | 3,369 (100.0%) | 3.04 |
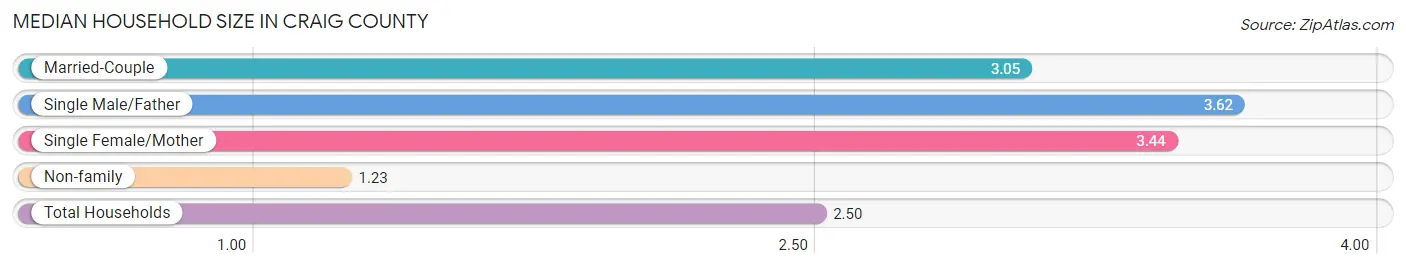
Median Household Size in Craig County
The median household size in Craig County is 2.50 persons per household, with single male/father households (330 | 6.4%) accounting for the largest median household size of 3.62 persons per household. non-family households (1,807 | 34.9%) represent the smallest median household size with 1.23 persons per household.
| Household Type | # Households | Household Size |
| Married-Couple | 2,439 (47.1%) | 3.05 |
| Single Male/Father | 330 (6.4%) | 3.62 |
| Single Female/Mother | 600 (11.6%) | 3.44 |
| Non-family | 1,807 (34.9%) | 1.23 |
| Total Households | 5,176 (100.0%) | 2.50 |
Household Size by Marriage Status in Craig County
Out of a total of 5,176 households in Craig County, 3,369 (65.1%) are family households, while 1,807 (34.9%) are nonfamily households. The most numerous type of family households are 2-person households, comprising 1,671, and the most common type of nonfamily households are 1-person households, comprising 1,490.
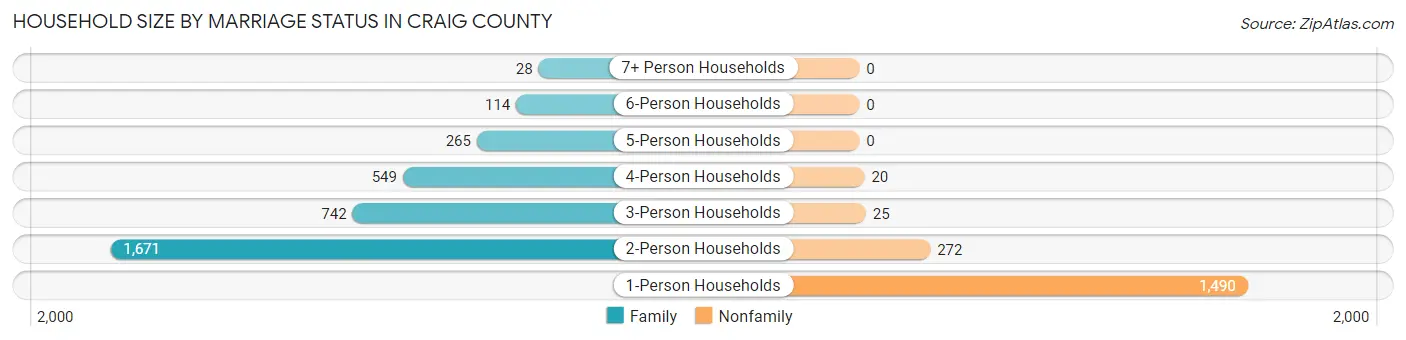
| Household Size | Family Households | Nonfamily Households |
| 1-Person Households | - | 1,490 (28.8%) |
| 2-Person Households | 1,671 (32.3%) | 272 (5.3%) |
| 3-Person Households | 742 (14.3%) | 25 (0.5%) |
| 4-Person Households | 549 (10.6%) | 20 (0.4%) |
| 5-Person Households | 265 (5.1%) | 0 (0.0%) |
| 6-Person Households | 114 (2.2%) | 0 (0.0%) |
| 7+ Person Households | 28 (0.5%) | 0 (0.0%) |
| Total | 3,369 (65.1%) | 1,807 (34.9%) |
Female Fertility in Craig County
Fertility by Age in Craig County
Average fertility rate in Craig County is 48.0 births per 1,000 women. Women in the age bracket of 20 to 34 years have the highest fertility rate with 99.0 births per 1,000 women. Women in the age bracket of 20 to 34 years acount for 86.1% of all women with births.
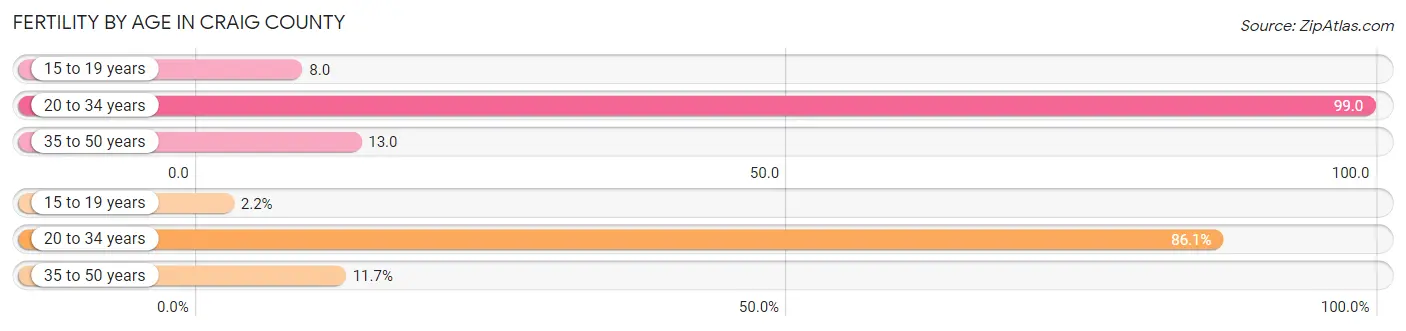
| Age Bracket | Women with Births | Births / 1,000 Women |
| 15 to 19 years | 3 (2.2%) | 8.0 |
| 20 to 34 years | 118 (86.1%) | 99.0 |
| 35 to 50 years | 16 (11.7%) | 13.0 |
| Total | 137 (100.0%) | 48.0 |
Fertility by Age by Marriage Status in Craig County
65.7% of women with births (137) in Craig County are married. The highest percentage of unmarried women with births falls into 15 to 19 years age bracket with 100.0% of them unmarried at the time of birth, while the lowest percentage of unmarried women with births belong to 35 to 50 years age bracket with 12.5% of them unmarried.
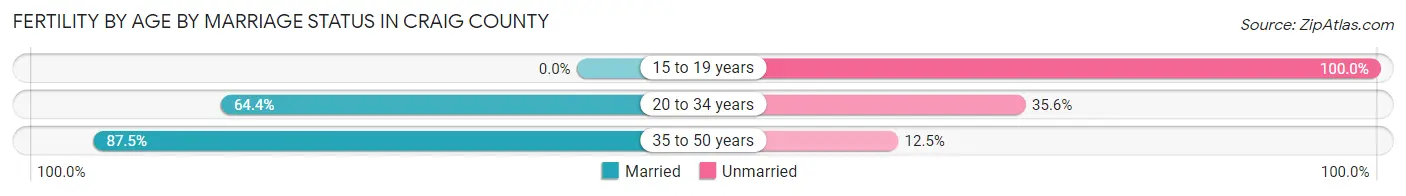
| Age Bracket | Married | Unmarried |
| 15 to 19 years | 0 (0.0%) | 3 (100.0%) |
| 20 to 34 years | 76 (64.4%) | 42 (35.6%) |
| 35 to 50 years | 14 (87.5%) | 2 (12.5%) |
| Total | 90 (65.7%) | 47 (34.3%) |
Fertility by Education in Craig County
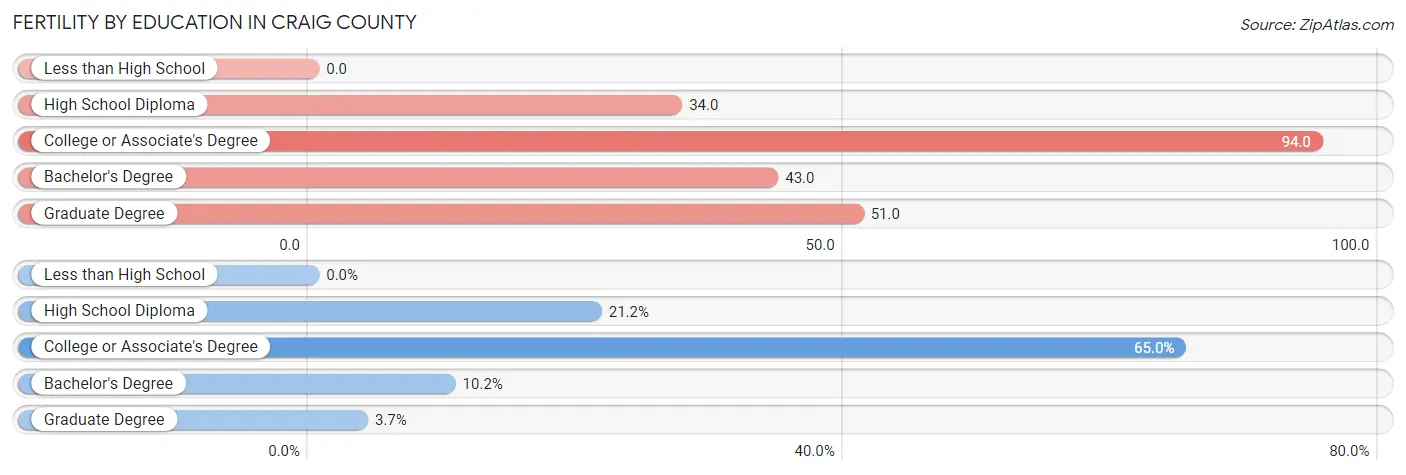
| Educational Attainment | Women with Births | Births / 1,000 Women |
| Less than High School | 0 (0.0%) | 0.0 |
| High School Diploma | 29 (21.2%) | 34.0 |
| College or Associate's Degree | 89 (65.0%) | 94.0 |
| Bachelor's Degree | 14 (10.2%) | 43.0 |
| Graduate Degree | 5 (3.6%) | 51.0 |
| Total | 137 (100.0%) | 48.0 |
Fertility by Education by Marriage Status in Craig County
34.3% of women with births in Craig County are unmarried. Women with the educational attainment of bachelor's degree are most likely to be married with 100.0% of them married at childbirth, while women with the educational attainment of high school diploma are least likely to be married with 62.1% of them unmarried at childbirth.
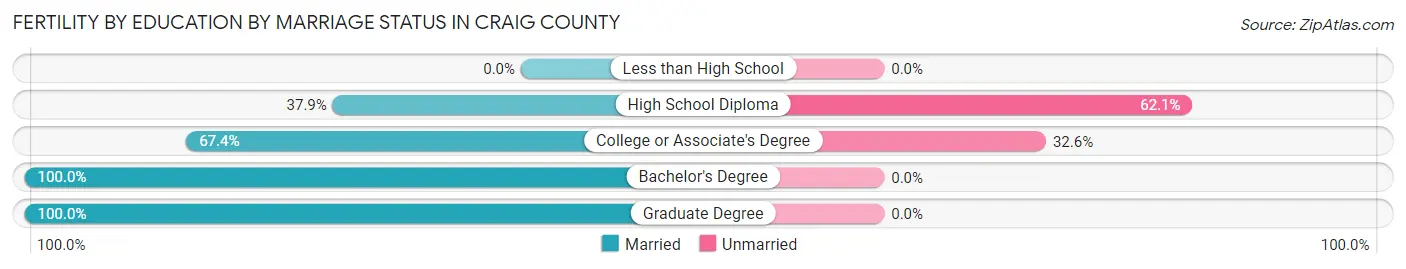
| Educational Attainment | Married | Unmarried |
| Less than High School | 0 (0.0%) | 0 (0.0%) |
| High School Diploma | 11 (37.9%) | 18 (62.1%) |
| College or Associate's Degree | 60 (67.4%) | 29 (32.6%) |
| Bachelor's Degree | 14 (100.0%) | 0 (0.0%) |
| Graduate Degree | 5 (100.0%) | 0 (0.0%) |
| Total | 90 (65.7%) | 47 (34.3%) |
Employment Characteristics in Craig County
Employment by Class of Employer in Craig County
Among the 5,246 employed individuals in Craig County, private company employees (3,001 | 57.2%), state government employees (511 | 9.7%), and self-employed (not incorporated) (508 | 9.7%) make up the most common classes of employment.
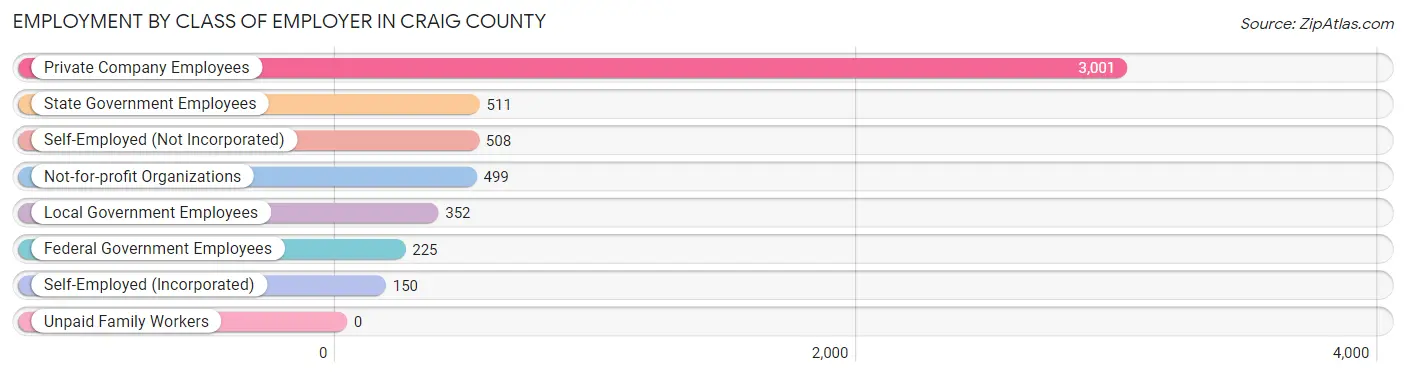
| Employer Class | # Employees | % Employees |
| Private Company Employees | 3,001 | 57.2% |
| Self-Employed (Incorporated) | 150 | 2.9% |
| Self-Employed (Not Incorporated) | 508 | 9.7% |
| Not-for-profit Organizations | 499 | 9.5% |
| Local Government Employees | 352 | 6.7% |
| State Government Employees | 511 | 9.7% |
| Federal Government Employees | 225 | 4.3% |
| Unpaid Family Workers | 0 | 0.0% |
| Total | 5,246 | 100.0% |
Employment Status by Age in Craig County
According to the labor force statistics for Craig County, out of the total population over 16 years of age (11,444), 49.4% or 5,653 individuals are in the labor force, with 4.6% or 260 of them unemployed. The age group with the highest labor force participation rate is 35 to 44 years, with 69.6% or 1,161 individuals in the labor force. Within the labor force, the 16 to 19 years age range has the highest percentage of unemployed individuals, with 26.7% or 54 of them being unemployed.
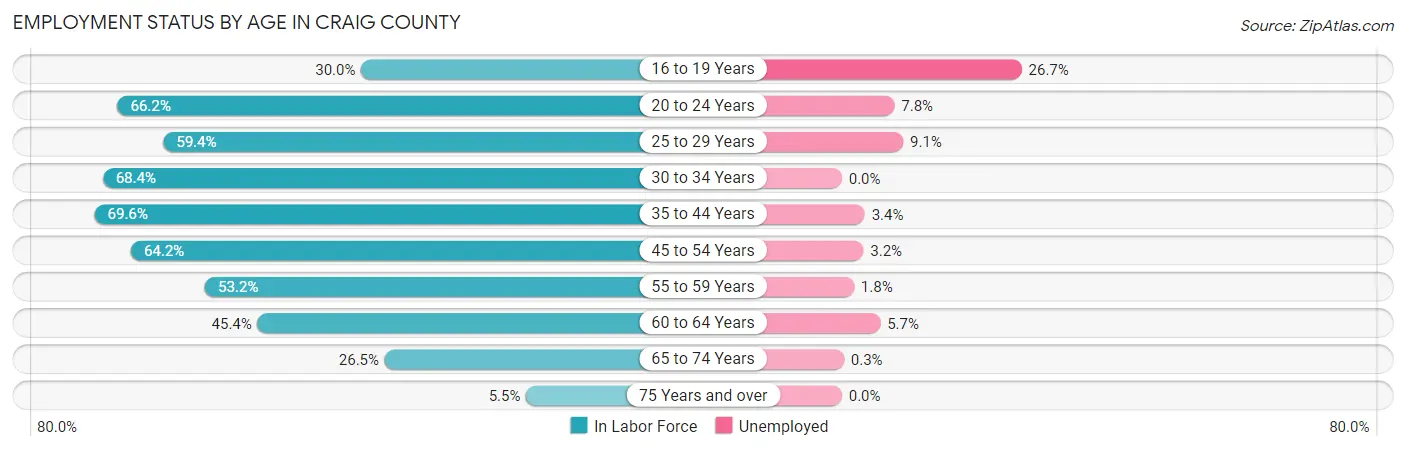
| Age Bracket | In Labor Force | Unemployed |
| 16 to 19 Years | 202 (30.0%) | 54 (26.7%) |
| 20 to 24 Years | 561 (66.2%) | 44 (7.8%) |
| 25 to 29 Years | 539 (59.4%) | 49 (9.1%) |
| 30 to 34 Years | 592 (68.4%) | 0 (0.0%) |
| 35 to 44 Years | 1,161 (69.6%) | 39 (3.4%) |
| 45 to 54 Years | 1,176 (64.2%) | 38 (3.2%) |
| 55 to 59 Years | 501 (53.2%) | 9 (1.8%) |
| 60 to 64 Years | 476 (45.4%) | 27 (5.7%) |
| 65 to 74 Years | 379 (26.5%) | 1 (0.3%) |
| 75 Years and over | 68 (5.5%) | 0 (0.0%) |
| Total | 5,653 (49.4%) | 260 (4.6%) |
Employment Status by Educational Attainment in Craig County
According to labor force statistics for Craig County, 61.2% of individuals (4,444) out of the total population between 25 and 64 years of age (7,261) are in the labor force, with 3.6% or 160 of them being unemployed. The group with the highest labor force participation rate are those with the educational attainment of bachelor's degree or higher, with 75.2% or 747 individuals in the labor force. Within the labor force, individuals with less than high school education have the highest percentage of unemployment, with 12.9% or 53 of them being unemployed.
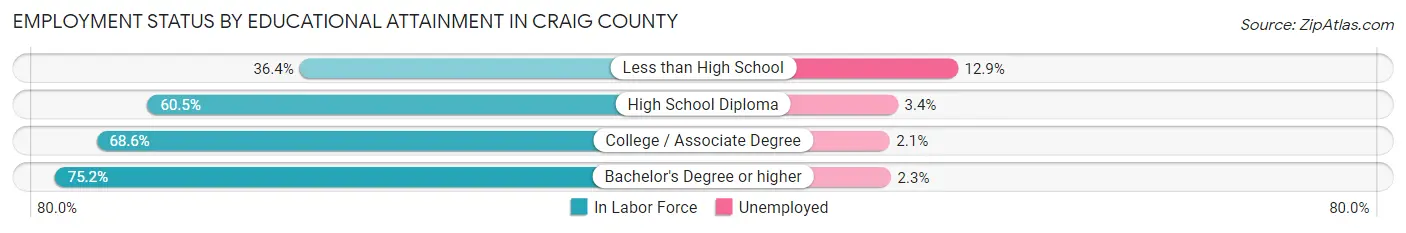
| Educational Attainment | In Labor Force | Unemployed |
| Less than High School | 410 (36.4%) | 145 (12.9%) |
| High School Diploma | 1,800 (60.5%) | 101 (3.4%) |
| College / Associate Degree | 1,487 (68.6%) | 46 (2.1%) |
| Bachelor's Degree or higher | 747 (75.2%) | 23 (2.3%) |
| Total | 4,444 (61.2%) | 261 (3.6%) |
Employment Occupations by Sex in Craig County
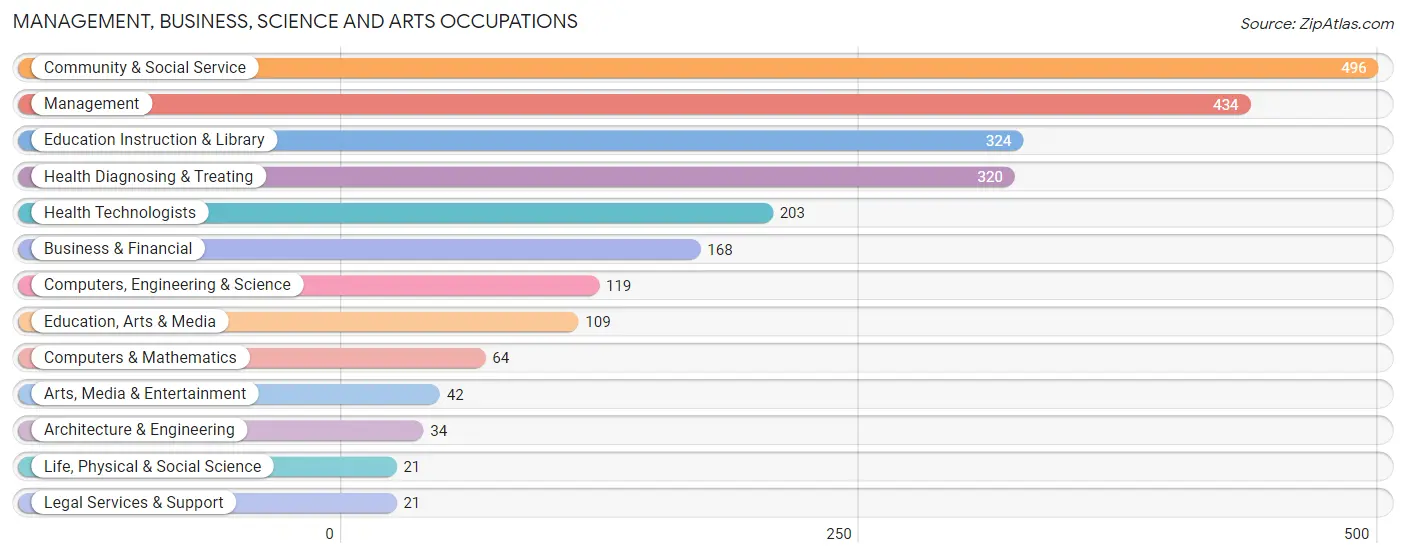
Management, Business, Science and Arts Occupations
The most common Management, Business, Science and Arts occupations in Craig County are Community & Social Service (496 | 9.2%), Management (434 | 8.1%), Education Instruction & Library (324 | 6.0%), Health Diagnosing & Treating (320 | 5.9%), and Health Technologists (203 | 3.8%).
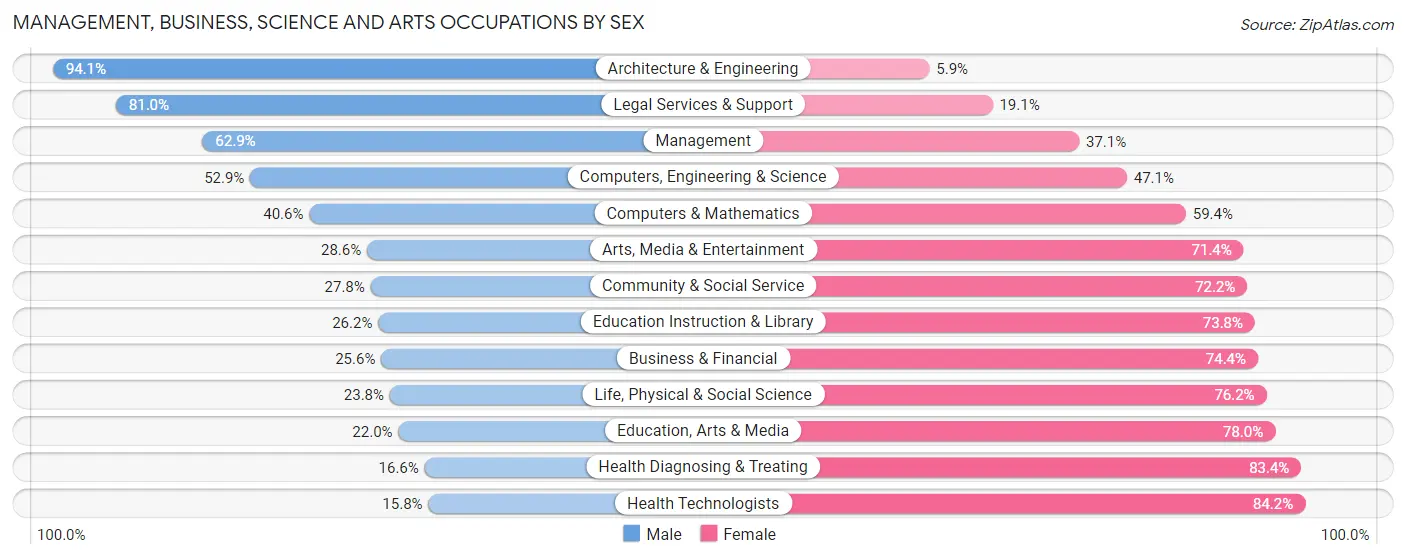
Management, Business, Science and Arts Occupations by Sex
Within the Management, Business, Science and Arts occupations in Craig County, the most male-oriented occupations are Architecture & Engineering (94.1%), Legal Services & Support (80.9%), and Management (62.9%), while the most female-oriented occupations are Health Technologists (84.2%), Health Diagnosing & Treating (83.4%), and Education, Arts & Media (78.0%).
| Occupation | Male | Female |
| Management | 273 (62.9%) | 161 (37.1%) |
| Business & Financial | 43 (25.6%) | 125 (74.4%) |
| Computers, Engineering & Science | 63 (52.9%) | 56 (47.1%) |
| Computers & Mathematics | 26 (40.6%) | 38 (59.4%) |
| Architecture & Engineering | 32 (94.1%) | 2 (5.9%) |
| Life, Physical & Social Science | 5 (23.8%) | 16 (76.2%) |
| Community & Social Service | 138 (27.8%) | 358 (72.2%) |
| Education, Arts & Media | 24 (22.0%) | 85 (78.0%) |
| Legal Services & Support | 17 (80.9%) | 4 (19.1%) |
| Education Instruction & Library | 85 (26.2%) | 239 (73.8%) |
| Arts, Media & Entertainment | 12 (28.6%) | 30 (71.4%) |
| Health Diagnosing & Treating | 53 (16.6%) | 267 (83.4%) |
| Health Technologists | 32 (15.8%) | 171 (84.2%) |
| Total (Category) | 570 (37.1%) | 967 (62.9%) |
| Total (Overall) | 2,679 (49.7%) | 2,714 (50.3%) |
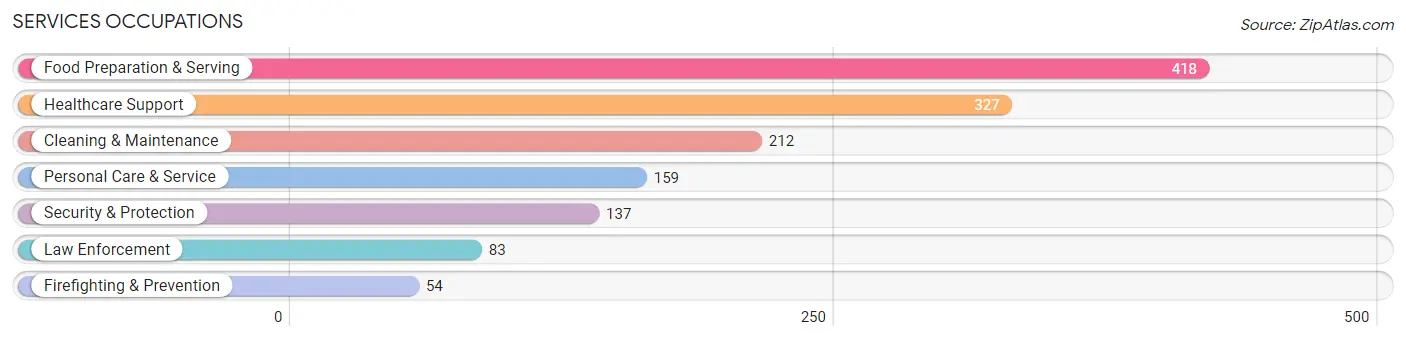
Services Occupations
The most common Services occupations in Craig County are Food Preparation & Serving (418 | 7.7%), Healthcare Support (327 | 6.1%), Cleaning & Maintenance (212 | 3.9%), Personal Care & Service (159 | 2.9%), and Security & Protection (137 | 2.5%).
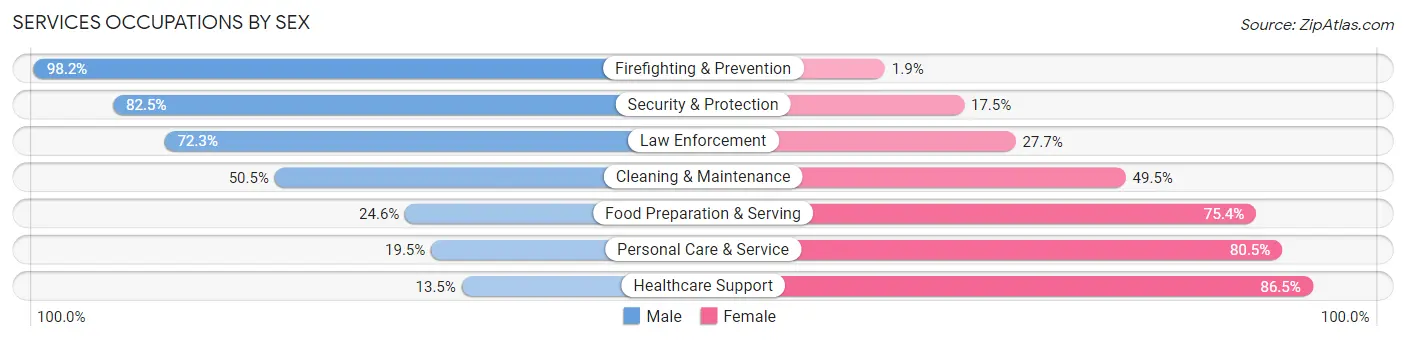
Services Occupations by Sex
Within the Services occupations in Craig County, the most male-oriented occupations are Firefighting & Prevention (98.2%), Security & Protection (82.5%), and Law Enforcement (72.3%), while the most female-oriented occupations are Healthcare Support (86.5%), Personal Care & Service (80.5%), and Food Preparation & Serving (75.4%).
| Occupation | Male | Female |
| Healthcare Support | 44 (13.5%) | 283 (86.5%) |
| Security & Protection | 113 (82.5%) | 24 (17.5%) |
| Firefighting & Prevention | 53 (98.2%) | 1 (1.8%) |
| Law Enforcement | 60 (72.3%) | 23 (27.7%) |
| Food Preparation & Serving | 103 (24.6%) | 315 (75.4%) |
| Cleaning & Maintenance | 107 (50.5%) | 105 (49.5%) |
| Personal Care & Service | 31 (19.5%) | 128 (80.5%) |
| Total (Category) | 398 (31.8%) | 855 (68.2%) |
| Total (Overall) | 2,679 (49.7%) | 2,714 (50.3%) |
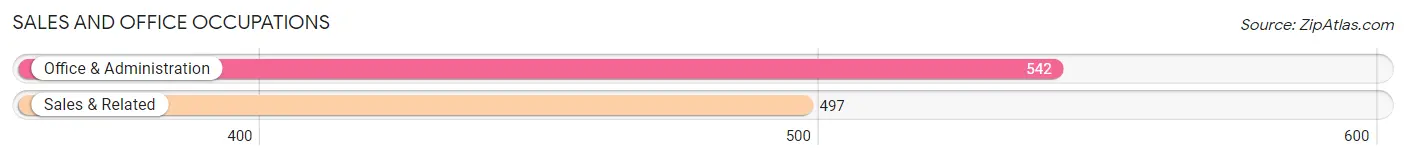
Sales and Office Occupations
The most common Sales and Office occupations in Craig County are Office & Administration (542 | 10.1%), and Sales & Related (497 | 9.2%).
Sales and Office Occupations by Sex
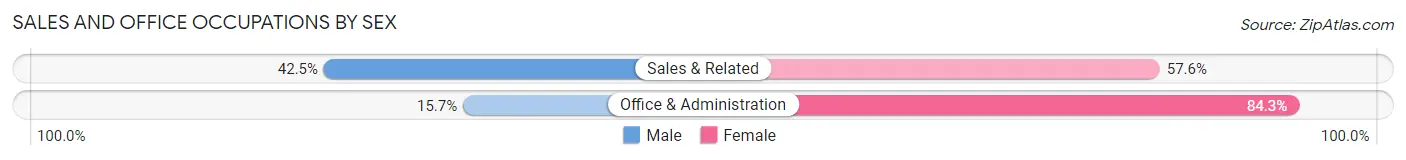
| Occupation | Male | Female |
| Sales & Related | 211 (42.4%) | 286 (57.6%) |
| Office & Administration | 85 (15.7%) | 457 (84.3%) |
| Total (Category) | 296 (28.5%) | 743 (71.5%) |
| Total (Overall) | 2,679 (49.7%) | 2,714 (50.3%) |
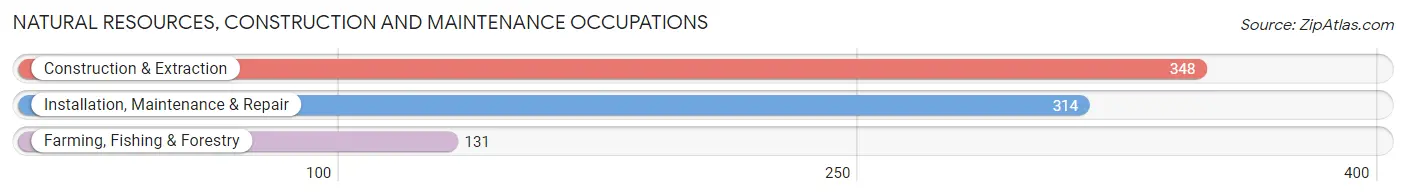
Natural Resources, Construction and Maintenance Occupations
The most common Natural Resources, Construction and Maintenance occupations in Craig County are Construction & Extraction (348 | 6.5%), Installation, Maintenance & Repair (314 | 5.8%), and Farming, Fishing & Forestry (131 | 2.4%).
Natural Resources, Construction and Maintenance Occupations by Sex
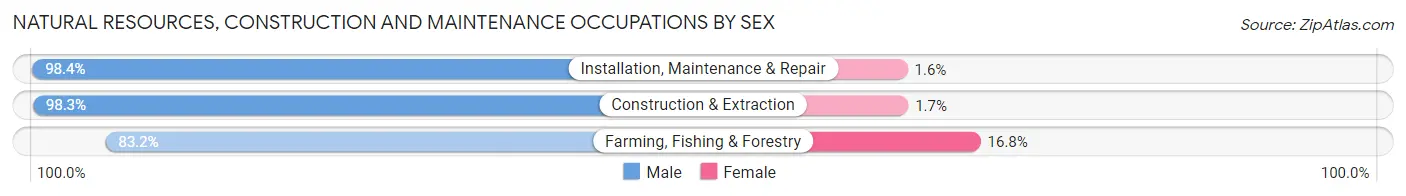
| Occupation | Male | Female |
| Farming, Fishing & Forestry | 109 (83.2%) | 22 (16.8%) |
| Construction & Extraction | 342 (98.3%) | 6 (1.7%) |
| Installation, Maintenance & Repair | 309 (98.4%) | 5 (1.6%) |
| Total (Category) | 760 (95.8%) | 33 (4.2%) |
| Total (Overall) | 2,679 (49.7%) | 2,714 (50.3%) |
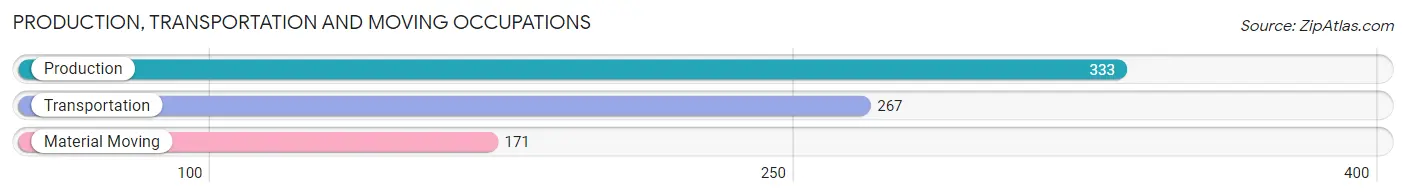
Production, Transportation and Moving Occupations
The most common Production, Transportation and Moving occupations in Craig County are Production (333 | 6.2%), Transportation (267 | 5.0%), and Material Moving (171 | 3.2%).
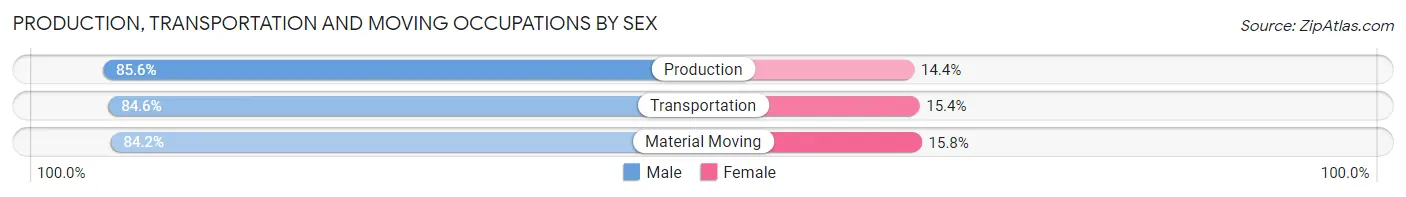
Production, Transportation and Moving Occupations by Sex
| Occupation | Male | Female |
| Production | 285 (85.6%) | 48 (14.4%) |
| Transportation | 226 (84.6%) | 41 (15.4%) |
| Material Moving | 144 (84.2%) | 27 (15.8%) |
| Total (Category) | 655 (85.0%) | 116 (15.0%) |
| Total (Overall) | 2,679 (49.7%) | 2,714 (50.3%) |
Employment Industries by Sex in Craig County
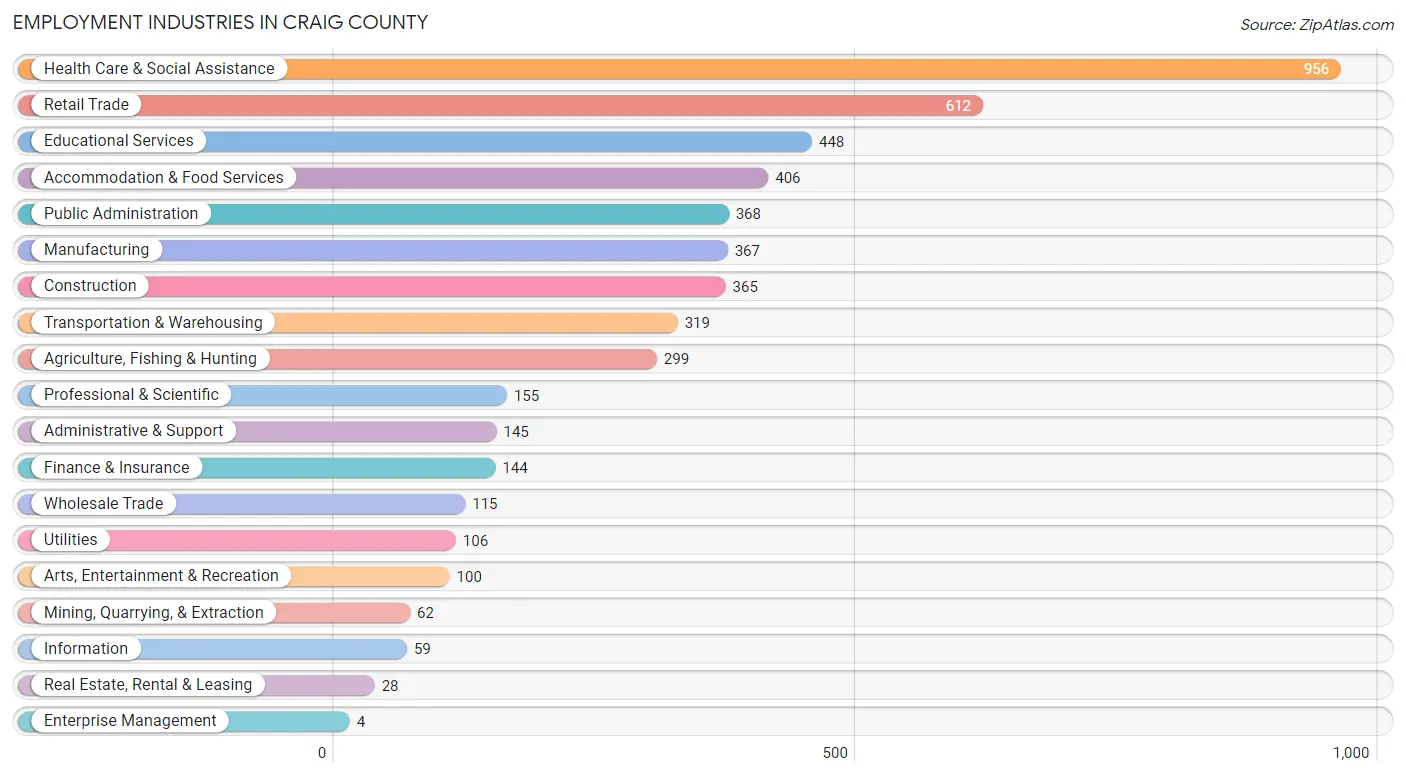
Employment Industries in Craig County
The major employment industries in Craig County include Health Care & Social Assistance (956 | 17.7%), Retail Trade (612 | 11.4%), Educational Services (448 | 8.3%), Accommodation & Food Services (406 | 7.5%), and Public Administration (368 | 6.8%).
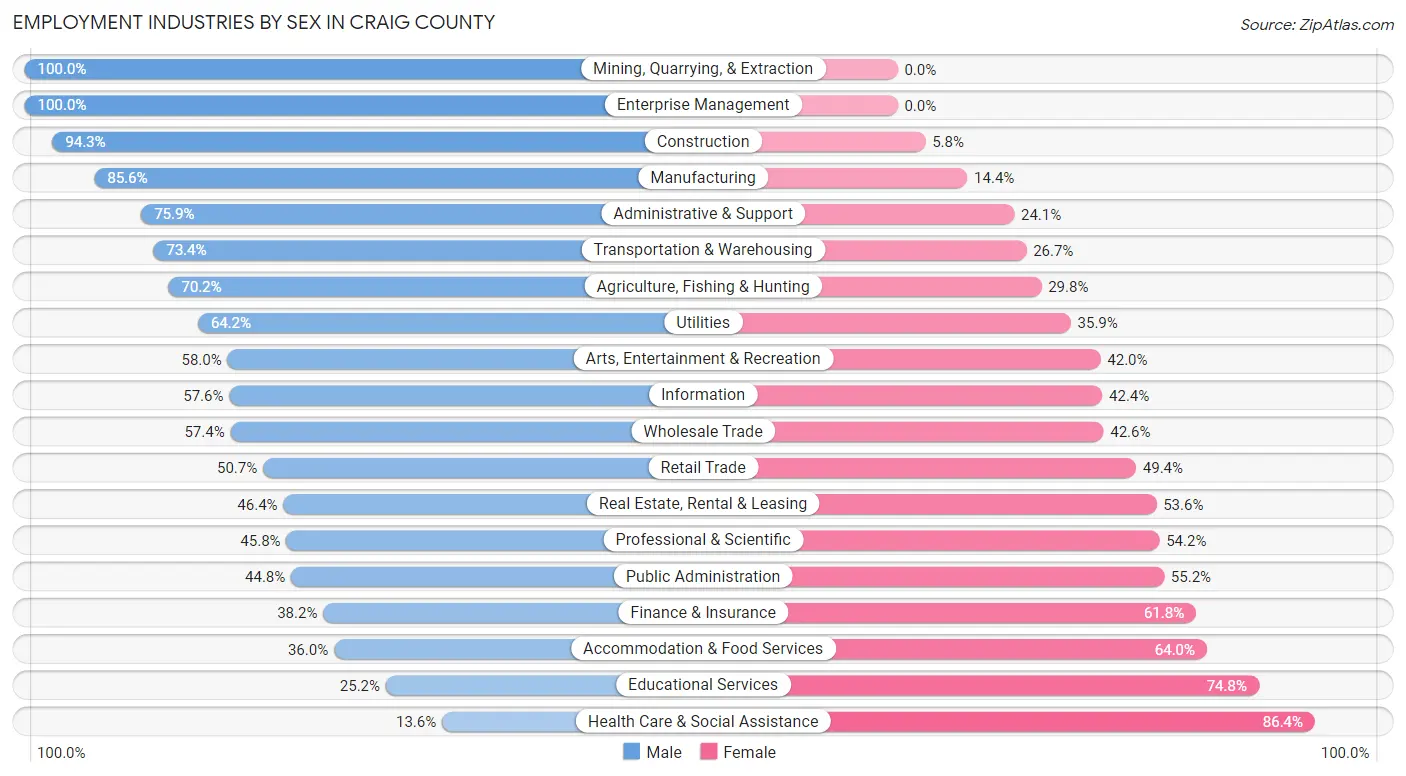
Employment Industries by Sex in Craig County
The Craig County industries that see more men than women are Mining, Quarrying, & Extraction (100.0%), Enterprise Management (100.0%), and Construction (94.3%), whereas the industries that tend to have a higher number of women are Health Care & Social Assistance (86.4%), Educational Services (74.8%), and Accommodation & Food Services (64.0%).
| Industry | Male | Female |
| Agriculture, Fishing & Hunting | 210 (70.2%) | 89 (29.8%) |
| Mining, Quarrying, & Extraction | 62 (100.0%) | 0 (0.0%) |
| Construction | 344 (94.3%) | 21 (5.8%) |
| Manufacturing | 314 (85.6%) | 53 (14.4%) |
| Wholesale Trade | 66 (57.4%) | 49 (42.6%) |
| Retail Trade | 310 (50.6%) | 302 (49.3%) |
| Transportation & Warehousing | 234 (73.4%) | 85 (26.7%) |
| Utilities | 68 (64.1%) | 38 (35.8%) |
| Information | 34 (57.6%) | 25 (42.4%) |
| Finance & Insurance | 55 (38.2%) | 89 (61.8%) |
| Real Estate, Rental & Leasing | 13 (46.4%) | 15 (53.6%) |
| Professional & Scientific | 71 (45.8%) | 84 (54.2%) |
| Enterprise Management | 4 (100.0%) | 0 (0.0%) |
| Administrative & Support | 110 (75.9%) | 35 (24.1%) |
| Educational Services | 113 (25.2%) | 335 (74.8%) |
| Health Care & Social Assistance | 130 (13.6%) | 826 (86.4%) |
| Arts, Entertainment & Recreation | 58 (58.0%) | 42 (42.0%) |
| Accommodation & Food Services | 146 (36.0%) | 260 (64.0%) |
| Public Administration | 165 (44.8%) | 203 (55.2%) |
| Total | 2,679 (49.7%) | 2,714 (50.3%) |
Education in Craig County
School Enrollment in Craig County
The most common levels of schooling among the 2,975 students in Craig County are high school (816 | 27.4%), elementary school (808 | 27.2%), and middle school (651 | 21.9%).
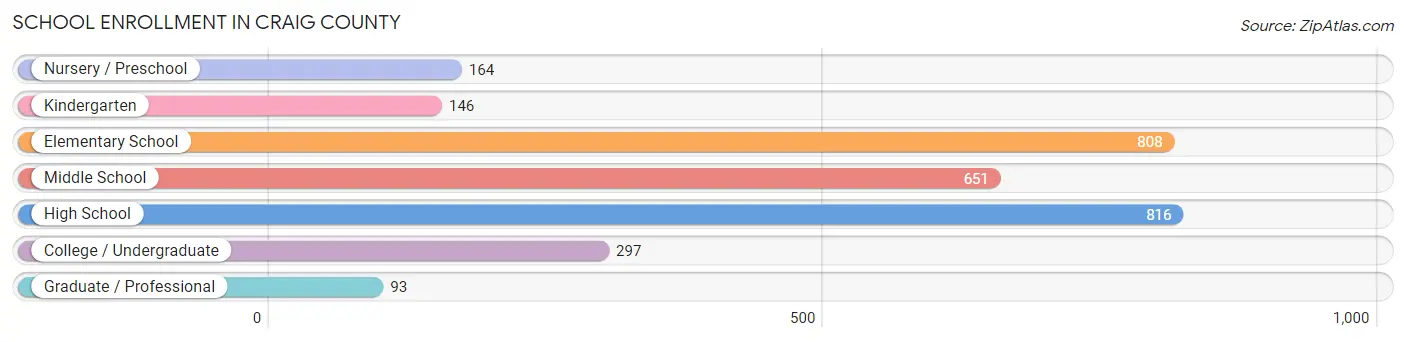
| School Level | # Students | % Students |
| Nursery / Preschool | 164 | 5.5% |
| Kindergarten | 146 | 4.9% |
| Elementary School | 808 | 27.2% |
| Middle School | 651 | 21.9% |
| High School | 816 | 27.4% |
| College / Undergraduate | 297 | 10.0% |
| Graduate / Professional | 93 | 3.1% |
| Total | 2,975 | 100.0% |
School Enrollment by Age by Funding Source in Craig County
Out of a total of 2,975 students who are enrolled in schools in Craig County, 286 (9.6%) attend a private institution, while the remaining 2,689 (90.4%) are enrolled in public schools. The age group of 3 to 4 year olds has the highest likelihood of being enrolled in private schools, with 32 (26.5% in the age bracket) enrolled. Conversely, the age group of 18 to 19 year olds has the lowest likelihood of being enrolled in a private school, with 188 (95.0% in the age bracket) attending a public institution.
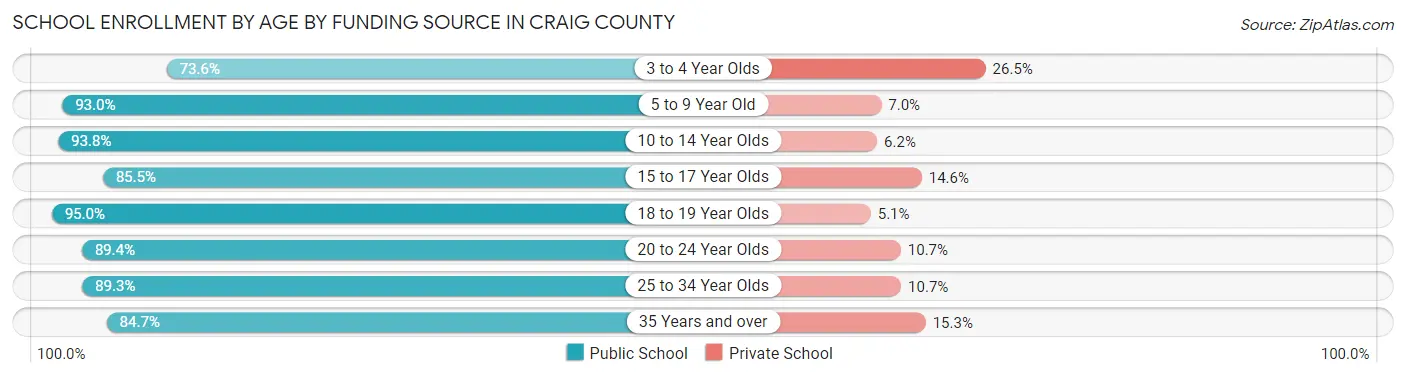
| Age Bracket | Public School | Private School |
| 3 to 4 Year Olds | 89 (73.6%) | 32 (26.5%) |
| 5 to 9 Year Old | 808 (93.0%) | 61 (7.0%) |
| 10 to 14 Year Olds | 796 (93.8%) | 53 (6.2%) |
| 15 to 17 Year Olds | 464 (85.5%) | 79 (14.5%) |
| 18 to 19 Year Olds | 188 (95.0%) | 10 (5.1%) |
| 20 to 24 Year Olds | 151 (89.3%) | 18 (10.6%) |
| 25 to 34 Year Olds | 50 (89.3%) | 6 (10.7%) |
| 35 Years and over | 144 (84.7%) | 26 (15.3%) |
| Total | 2,689 (90.4%) | 286 (9.6%) |
Educational Attainment by Field of Study in Craig County
Education (463 | 32.7%), business (246 | 17.4%), science & technology (179 | 12.7%), bio, nature & agricultural (105 | 7.4%), and arts & humanities (96 | 6.8%) are the most common fields of study among 1,415 individuals in Craig County who have obtained a bachelor's degree or higher.
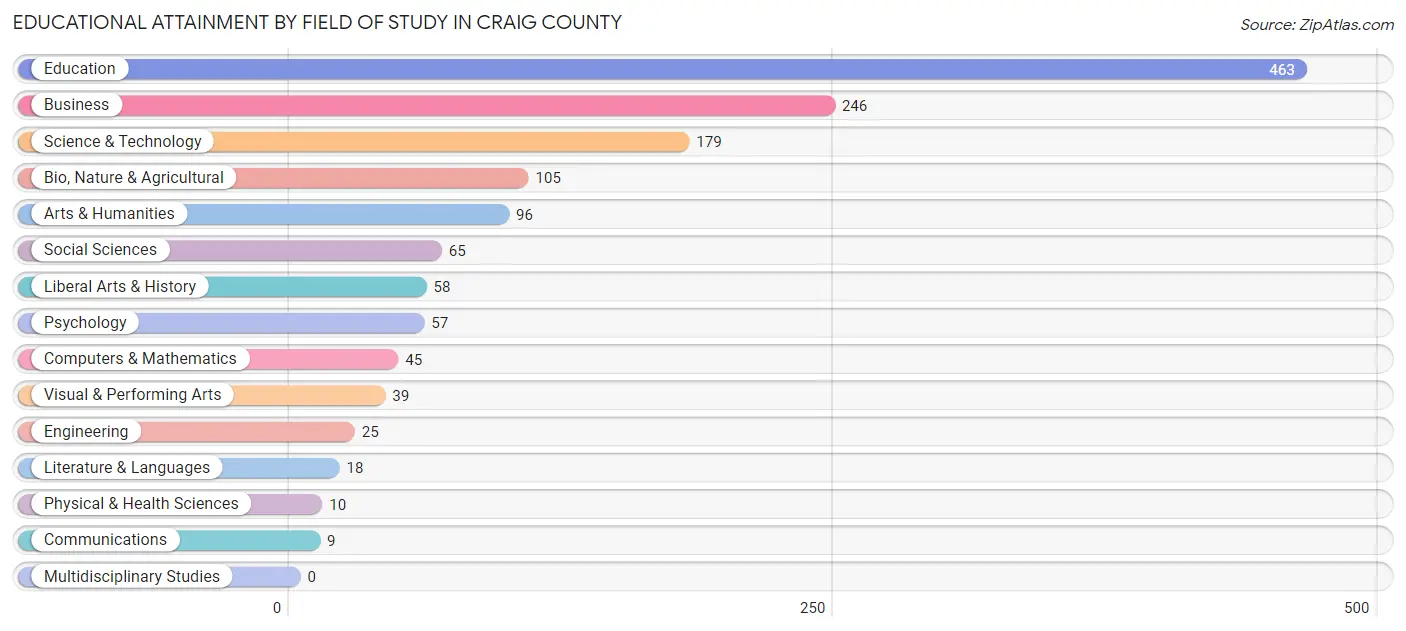
| Field of Study | # Graduates | % Graduates |
| Computers & Mathematics | 45 | 3.2% |
| Bio, Nature & Agricultural | 105 | 7.4% |
| Physical & Health Sciences | 10 | 0.7% |
| Psychology | 57 | 4.0% |
| Social Sciences | 65 | 4.6% |
| Engineering | 25 | 1.8% |
| Multidisciplinary Studies | 0 | 0.0% |
| Science & Technology | 179 | 12.7% |
| Business | 246 | 17.4% |
| Education | 463 | 32.7% |
| Literature & Languages | 18 | 1.3% |
| Liberal Arts & History | 58 | 4.1% |
| Visual & Performing Arts | 39 | 2.8% |
| Communications | 9 | 0.6% |
| Arts & Humanities | 96 | 6.8% |
| Total | 1,415 | 100.0% |
Transportation & Commute in Craig County
Vehicle Availability by Sex in Craig County
The most prevalent vehicle ownership categories in Craig County are males with 2 vehicles (930, accounting for 35.8%) and females with 2 vehicles (1,060, making up 36.4%).
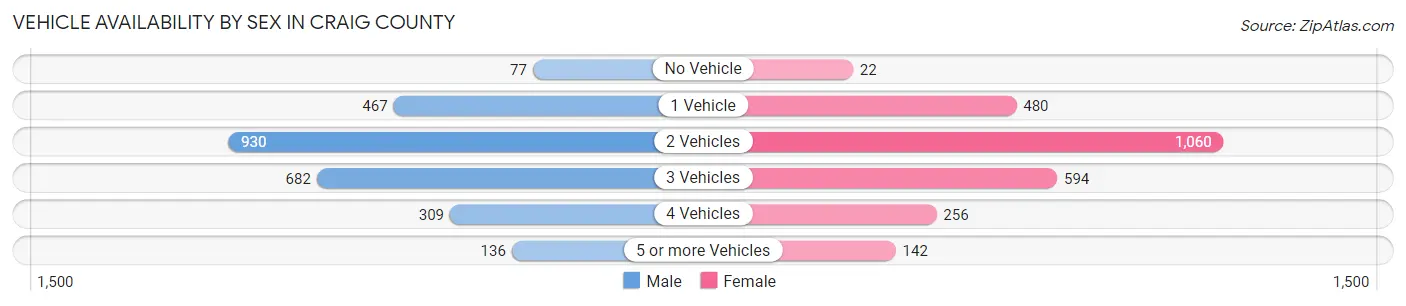
| Vehicles Available | Male | Female |
| No Vehicle | 77 (3.0%) | 22 (0.9%) |
| 1 Vehicle | 467 (17.9%) | 480 (18.8%) |
| 2 Vehicles | 930 (35.8%) | 1,060 (41.5%) |
| 3 Vehicles | 682 (26.2%) | 594 (23.3%) |
| 4 Vehicles | 309 (11.9%) | 256 (10.0%) |
| 5 or more Vehicles | 136 (5.2%) | 142 (5.6%) |
| Total | 2,601 (100.0%) | 2,554 (100.0%) |
Commute Time in Craig County
The most frequently occuring commute durations in Craig County are 5 to 9 minutes (1,034 commuters, 22.0%), 10 to 14 minutes (773 commuters, 16.4%), and 15 to 19 minutes (619 commuters, 13.2%).
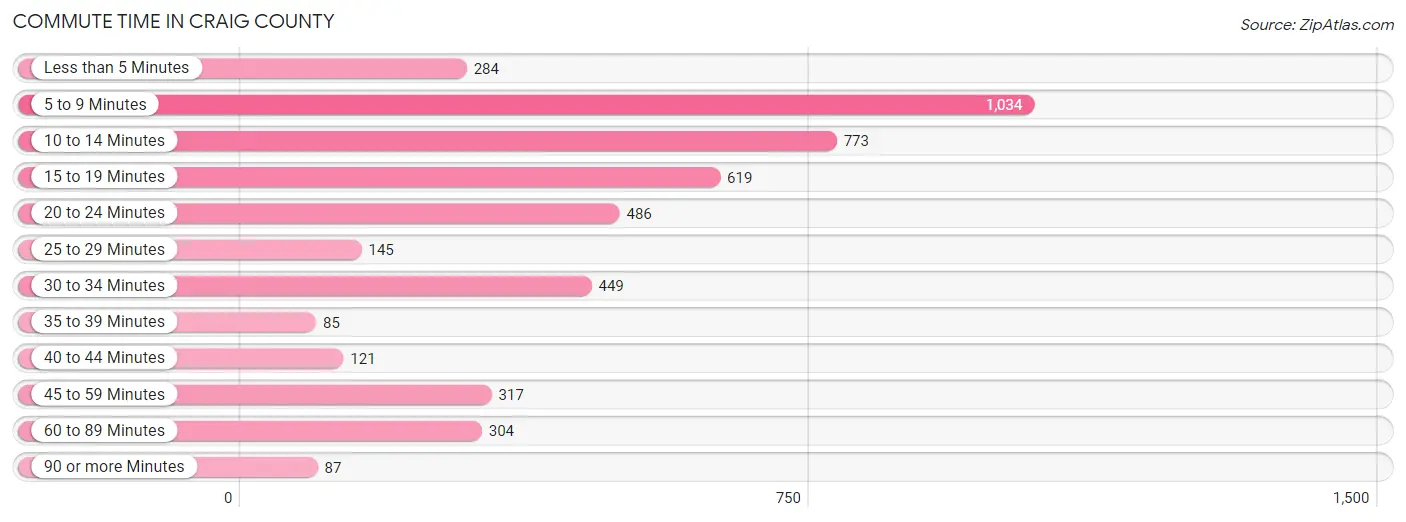
| Commute Time | # Commuters | % Commuters |
| Less than 5 Minutes | 284 | 6.0% |
| 5 to 9 Minutes | 1,034 | 22.0% |
| 10 to 14 Minutes | 773 | 16.4% |
| 15 to 19 Minutes | 619 | 13.2% |
| 20 to 24 Minutes | 486 | 10.3% |
| 25 to 29 Minutes | 145 | 3.1% |
| 30 to 34 Minutes | 449 | 9.6% |
| 35 to 39 Minutes | 85 | 1.8% |
| 40 to 44 Minutes | 121 | 2.6% |
| 45 to 59 Minutes | 317 | 6.7% |
| 60 to 89 Minutes | 304 | 6.5% |
| 90 or more Minutes | 87 | 1.8% |
Commute Time by Sex in Craig County
The most common commute times in Craig County are 5 to 9 minutes (433 commuters, 18.7%) for males and 5 to 9 minutes (601 commuters, 25.1%) for females.
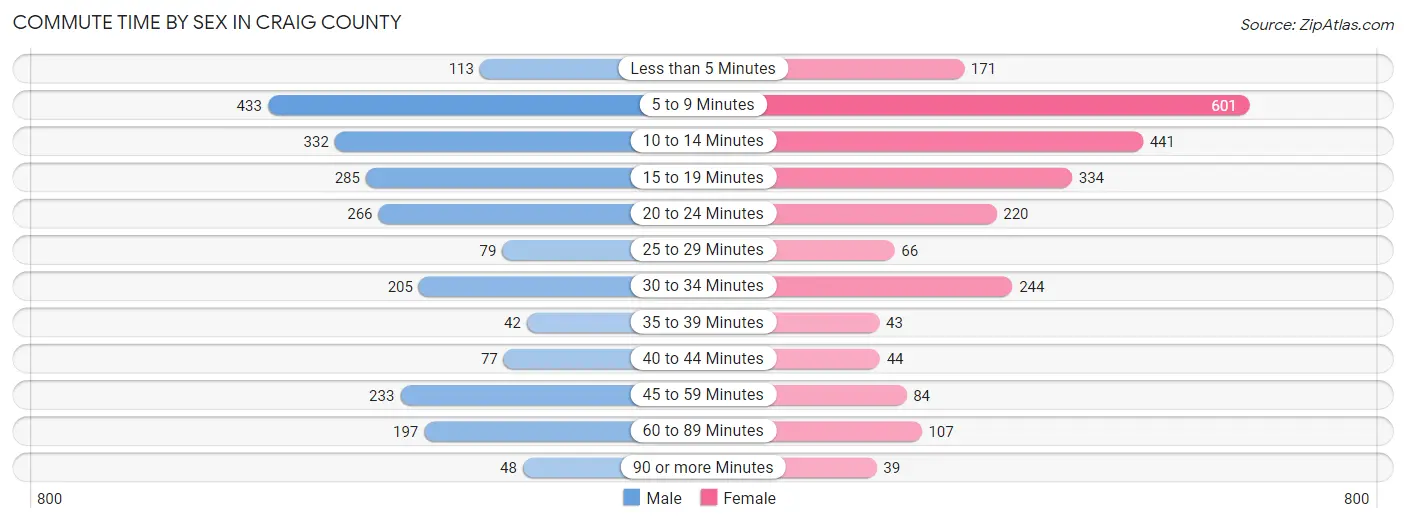
| Commute Time | Male | Female |
| Less than 5 Minutes | 113 (4.9%) | 171 (7.1%) |
| 5 to 9 Minutes | 433 (18.7%) | 601 (25.1%) |
| 10 to 14 Minutes | 332 (14.4%) | 441 (18.4%) |
| 15 to 19 Minutes | 285 (12.3%) | 334 (14.0%) |
| 20 to 24 Minutes | 266 (11.5%) | 220 (9.2%) |
| 25 to 29 Minutes | 79 (3.4%) | 66 (2.8%) |
| 30 to 34 Minutes | 205 (8.9%) | 244 (10.2%) |
| 35 to 39 Minutes | 42 (1.8%) | 43 (1.8%) |
| 40 to 44 Minutes | 77 (3.3%) | 44 (1.8%) |
| 45 to 59 Minutes | 233 (10.1%) | 84 (3.5%) |
| 60 to 89 Minutes | 197 (8.5%) | 107 (4.5%) |
| 90 or more Minutes | 48 (2.1%) | 39 (1.6%) |
Time of Departure to Work by Sex in Craig County
The most frequent times of departure to work in Craig County are 7:00 AM to 7:29 AM (289, 12.5%) for males and 7:30 AM to 7:59 AM (511, 21.3%) for females.
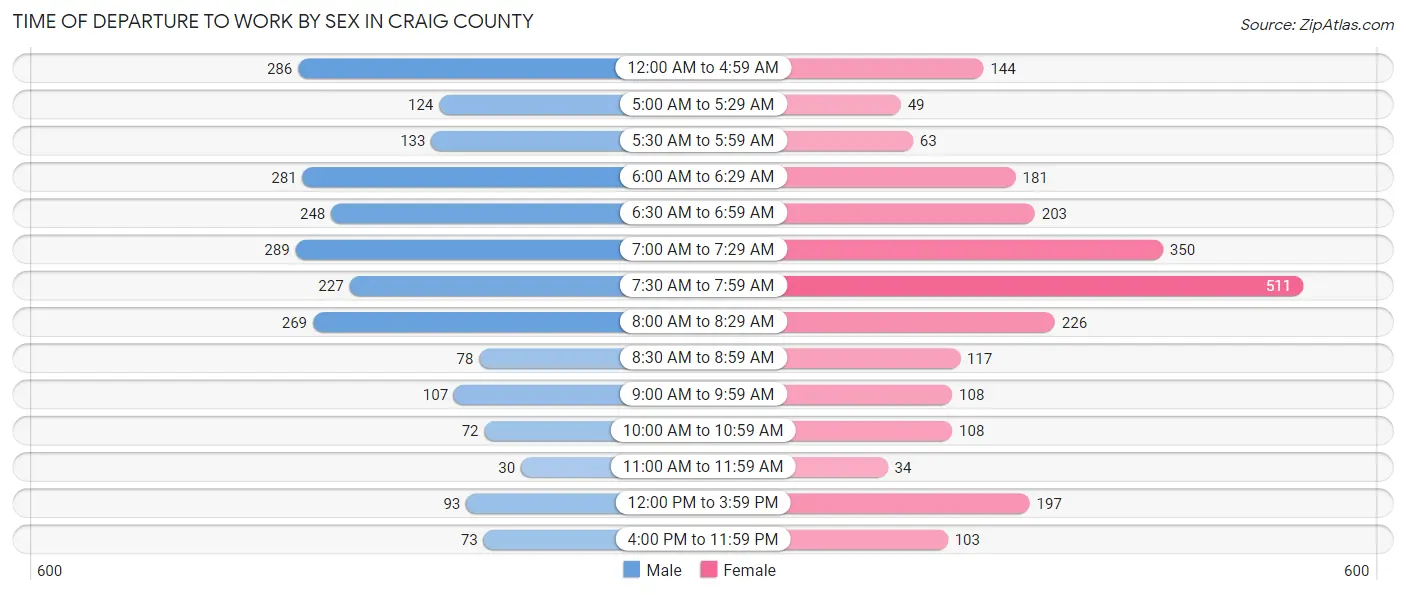
| Time of Departure | Male | Female |
| 12:00 AM to 4:59 AM | 286 (12.4%) | 144 (6.0%) |
| 5:00 AM to 5:29 AM | 124 (5.4%) | 49 (2.1%) |
| 5:30 AM to 5:59 AM | 133 (5.8%) | 63 (2.6%) |
| 6:00 AM to 6:29 AM | 281 (12.2%) | 181 (7.6%) |
| 6:30 AM to 6:59 AM | 248 (10.7%) | 203 (8.5%) |
| 7:00 AM to 7:29 AM | 289 (12.5%) | 350 (14.6%) |
| 7:30 AM to 7:59 AM | 227 (9.8%) | 511 (21.3%) |
| 8:00 AM to 8:29 AM | 269 (11.7%) | 226 (9.4%) |
| 8:30 AM to 8:59 AM | 78 (3.4%) | 117 (4.9%) |
| 9:00 AM to 9:59 AM | 107 (4.6%) | 108 (4.5%) |
| 10:00 AM to 10:59 AM | 72 (3.1%) | 108 (4.5%) |
| 11:00 AM to 11:59 AM | 30 (1.3%) | 34 (1.4%) |
| 12:00 PM to 3:59 PM | 93 (4.0%) | 197 (8.2%) |
| 4:00 PM to 11:59 PM | 73 (3.2%) | 103 (4.3%) |
| Total | 2,310 (100.0%) | 2,394 (100.0%) |
Housing Occupancy in Craig County
Occupancy by Ownership in Craig County
Of the total 5,176 dwellings in Craig County, owner-occupied units account for 3,593 (69.4%), while renter-occupied units make up 1,583 (30.6%).
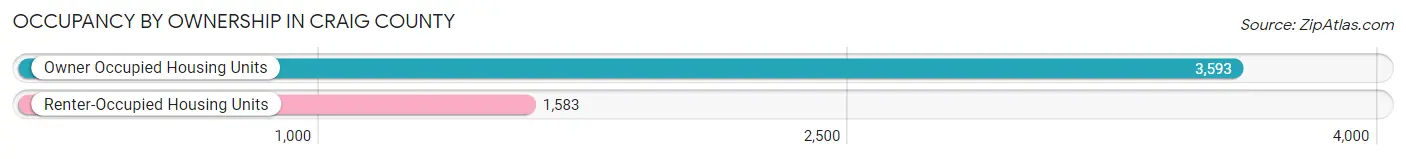
| Occupancy | # Housing Units | % Housing Units |
| Owner Occupied Housing Units | 3,593 | 69.4% |
| Renter-Occupied Housing Units | 1,583 | 30.6% |
| Total Occupied Housing Units | 5,176 | 100.0% |
Occupancy by Household Size in Craig County
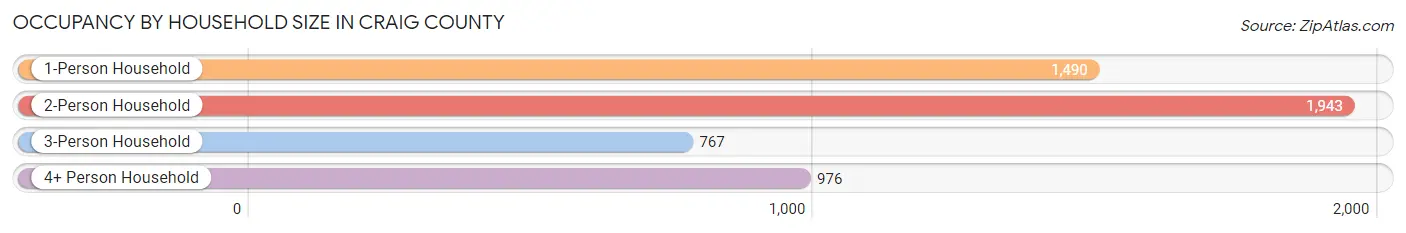
| Household Size | # Housing Units | % Housing Units |
| 1-Person Household | 1,490 | 28.8% |
| 2-Person Household | 1,943 | 37.5% |
| 3-Person Household | 767 | 14.8% |
| 4+ Person Household | 976 | 18.9% |
| Total Housing Units | 5,176 | 100.0% |
Occupancy by Ownership by Household Size in Craig County
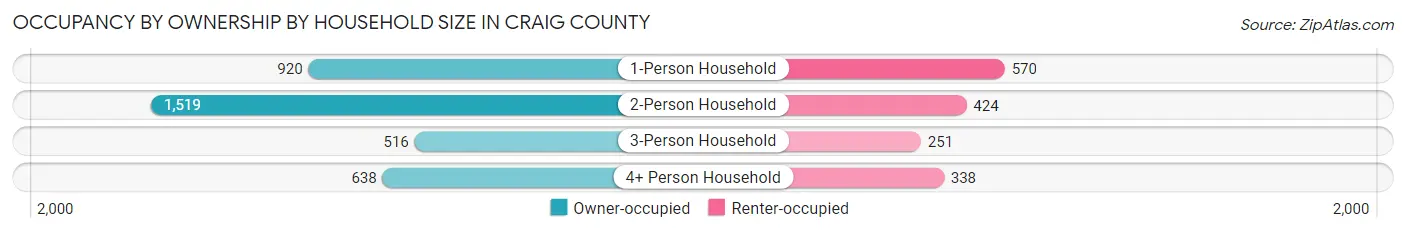
| Household Size | Owner-occupied | Renter-occupied |
| 1-Person Household | 920 (61.7%) | 570 (38.3%) |
| 2-Person Household | 1,519 (78.2%) | 424 (21.8%) |
| 3-Person Household | 516 (67.3%) | 251 (32.7%) |
| 4+ Person Household | 638 (65.4%) | 338 (34.6%) |
| Total Housing Units | 3,593 (69.4%) | 1,583 (30.6%) |
Occupancy by Educational Attainment in Craig County
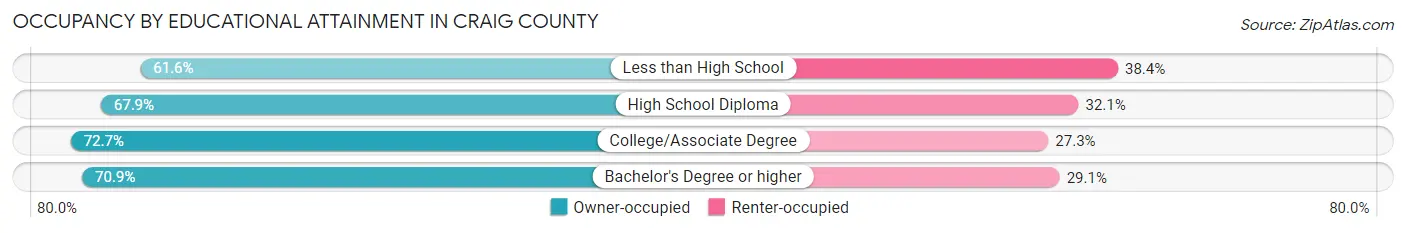
| Household Size | Owner-occupied | Renter-occupied |
| Less than High School | 384 (61.6%) | 239 (38.4%) |
| High School Diploma | 1,195 (67.9%) | 565 (32.1%) |
| College/Associate Degree | 1,381 (72.7%) | 519 (27.3%) |
| Bachelor's Degree or higher | 633 (70.9%) | 260 (29.1%) |
Occupancy by Age of Householder in Craig County
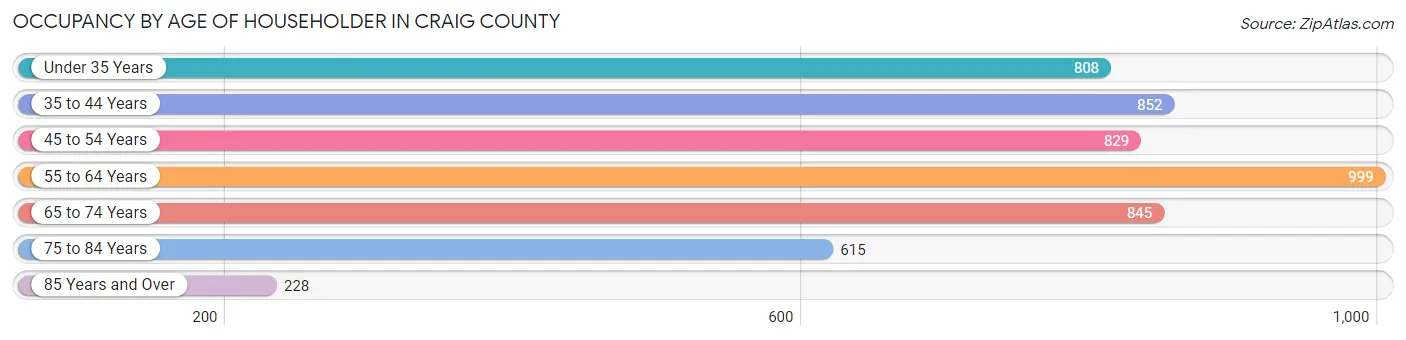
| Age Bracket | # Households | % Households |
| Under 35 Years | 808 | 15.6% |
| 35 to 44 Years | 852 | 16.5% |
| 45 to 54 Years | 829 | 16.0% |
| 55 to 64 Years | 999 | 19.3% |
| 65 to 74 Years | 845 | 16.3% |
| 75 to 84 Years | 615 | 11.9% |
| 85 Years and Over | 228 | 4.4% |
| Total | 5,176 | 100.0% |
Housing Finances in Craig County
Median Income by Occupancy in Craig County
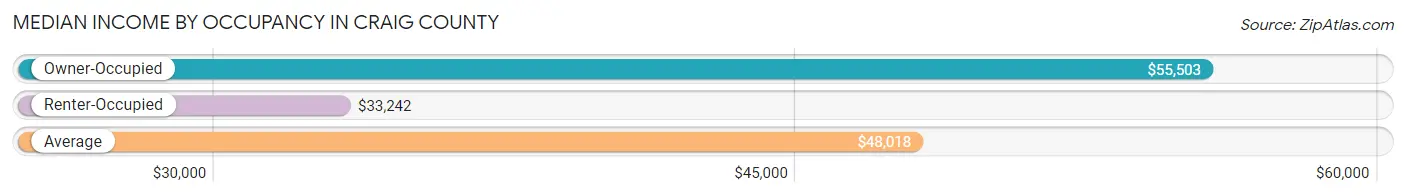
| Occupancy Type | # Households | Median Income |
| Owner-Occupied | 3,593 (69.4%) | $55,503 |
| Renter-Occupied | 1,583 (30.6%) | $33,242 |
| Average | 5,176 (100.0%) | $48,018 |
Occupancy by Householder Income Bracket in Craig County
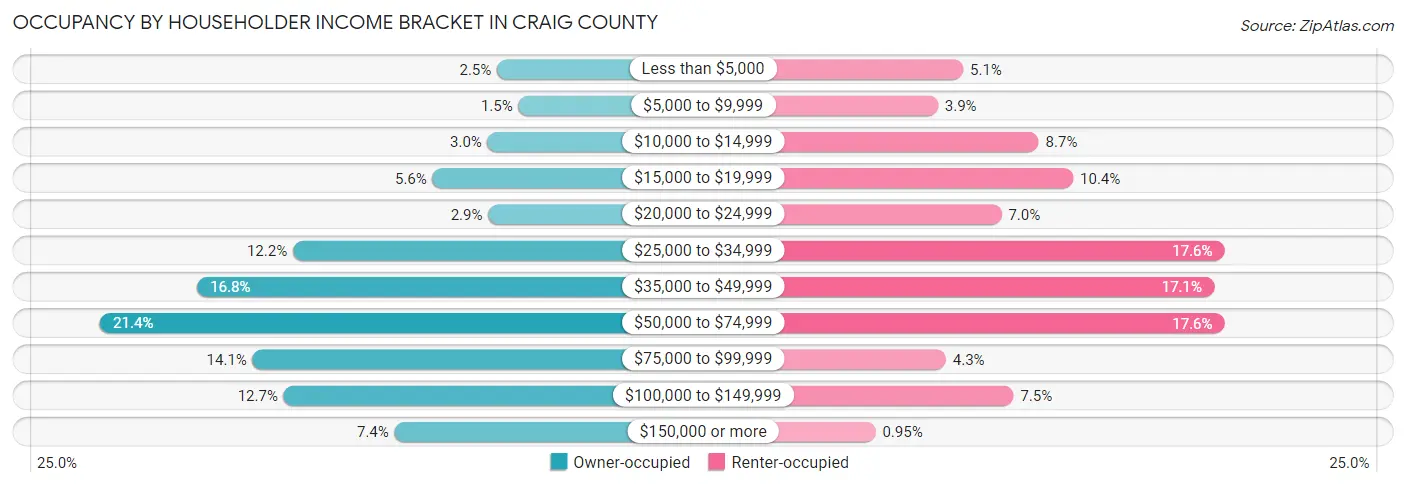
| Income Bracket | Owner-occupied | Renter-occupied |
| Less than $5,000 | 90 (2.5%) | 81 (5.1%) |
| $5,000 to $9,999 | 53 (1.5%) | 62 (3.9%) |
| $10,000 to $14,999 | 106 (2.9%) | 138 (8.7%) |
| $15,000 to $19,999 | 200 (5.6%) | 164 (10.4%) |
| $20,000 to $24,999 | 105 (2.9%) | 110 (7.0%) |
| $25,000 to $34,999 | 439 (12.2%) | 278 (17.6%) |
| $35,000 to $49,999 | 603 (16.8%) | 270 (17.1%) |
| $50,000 to $74,999 | 769 (21.4%) | 278 (17.6%) |
| $75,000 to $99,999 | 508 (14.1%) | 68 (4.3%) |
| $100,000 to $149,999 | 455 (12.7%) | 119 (7.5%) |
| $150,000 or more | 265 (7.4%) | 15 (0.9%) |
| Total | 3,593 (100.0%) | 1,583 (100.0%) |
Monthly Housing Cost Tiers in Craig County
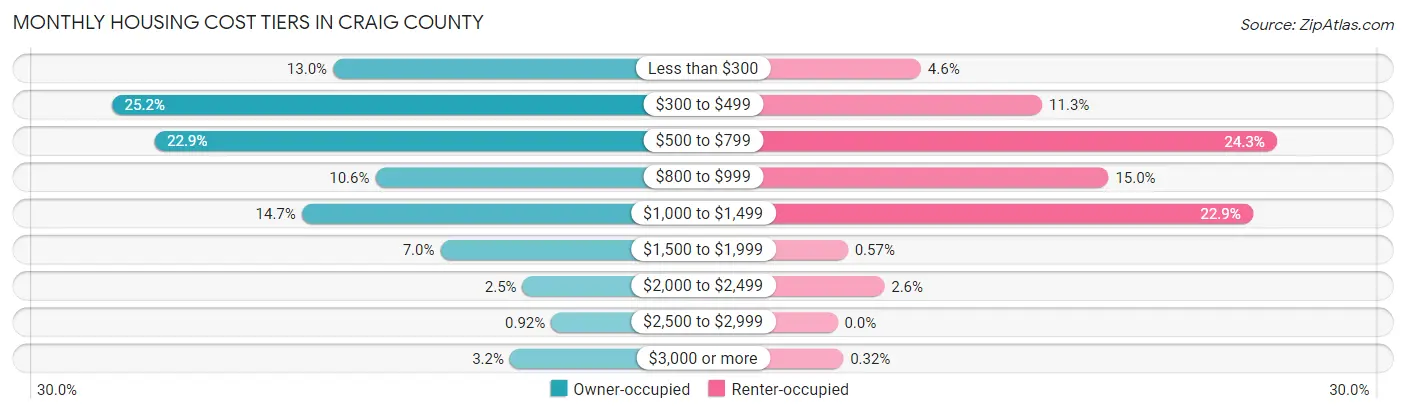
| Monthly Cost | Owner-occupied | Renter-occupied |
| Less than $300 | 466 (13.0%) | 73 (4.6%) |
| $300 to $499 | 905 (25.2%) | 179 (11.3%) |
| $500 to $799 | 821 (22.9%) | 384 (24.3%) |
| $800 to $999 | 382 (10.6%) | 237 (15.0%) |
| $1,000 to $1,499 | 528 (14.7%) | 363 (22.9%) |
| $1,500 to $1,999 | 253 (7.0%) | 9 (0.6%) |
| $2,000 to $2,499 | 90 (2.5%) | 41 (2.6%) |
| $2,500 to $2,999 | 33 (0.9%) | 0 (0.0%) |
| $3,000 or more | 115 (3.2%) | 5 (0.3%) |
| Total | 3,593 (100.0%) | 1,583 (100.0%) |
Physical Housing Characteristics in Craig County
Housing Structures in Craig County
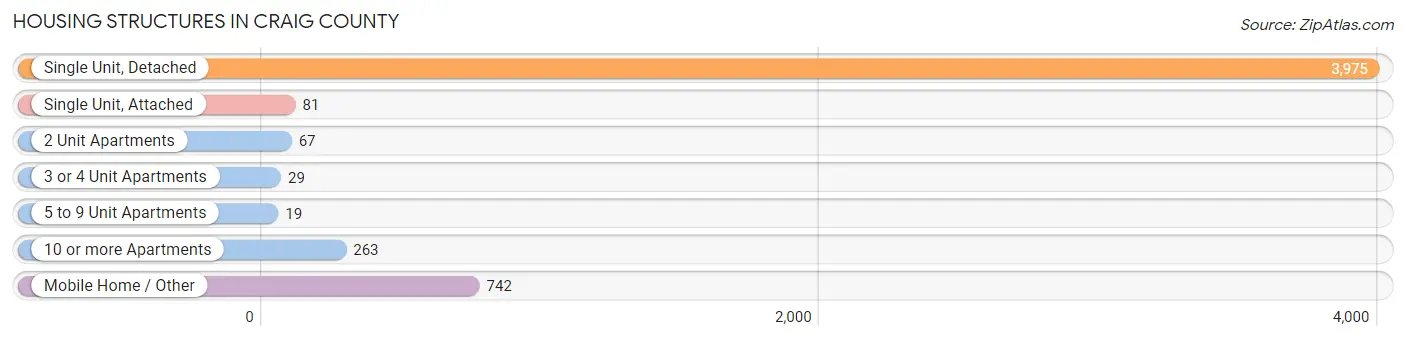
| Structure Type | # Housing Units | % Housing Units |
| Single Unit, Detached | 3,975 | 76.8% |
| Single Unit, Attached | 81 | 1.6% |
| 2 Unit Apartments | 67 | 1.3% |
| 3 or 4 Unit Apartments | 29 | 0.6% |
| 5 to 9 Unit Apartments | 19 | 0.4% |
| 10 or more Apartments | 263 | 5.1% |
| Mobile Home / Other | 742 | 14.3% |
| Total | 5,176 | 100.0% |
Housing Structures by Occupancy in Craig County
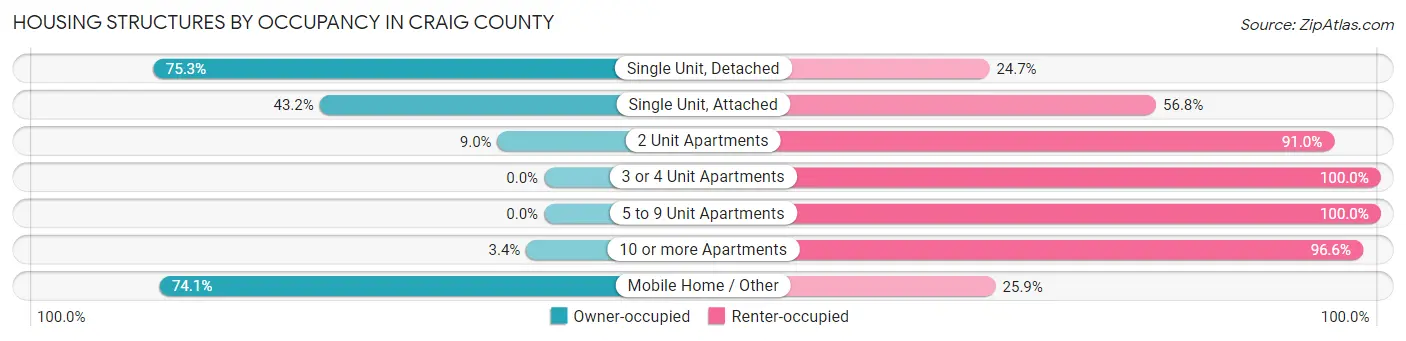
| Structure Type | Owner-occupied | Renter-occupied |
| Single Unit, Detached | 2,993 (75.3%) | 982 (24.7%) |
| Single Unit, Attached | 35 (43.2%) | 46 (56.8%) |
| 2 Unit Apartments | 6 (9.0%) | 61 (91.0%) |
| 3 or 4 Unit Apartments | 0 (0.0%) | 29 (100.0%) |
| 5 to 9 Unit Apartments | 0 (0.0%) | 19 (100.0%) |
| 10 or more Apartments | 9 (3.4%) | 254 (96.6%) |
| Mobile Home / Other | 550 (74.1%) | 192 (25.9%) |
| Total | 3,593 (69.4%) | 1,583 (30.6%) |
Housing Structures by Number of Rooms in Craig County
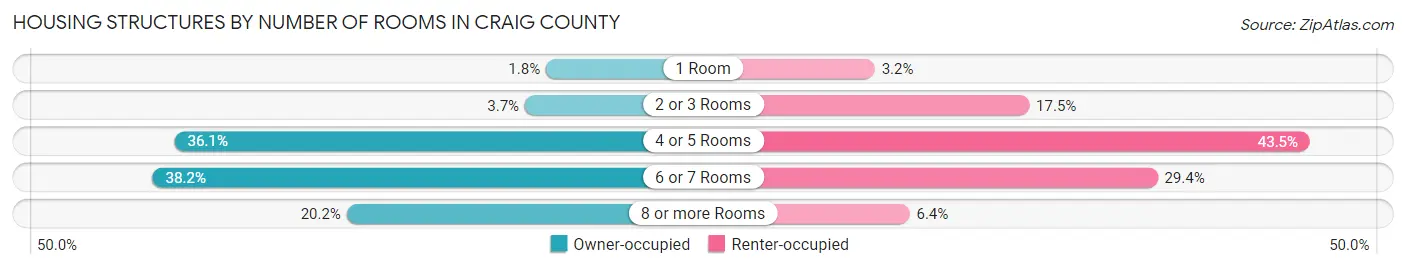
| Number of Rooms | Owner-occupied | Renter-occupied |
| 1 Room | 64 (1.8%) | 51 (3.2%) |
| 2 or 3 Rooms | 134 (3.7%) | 277 (17.5%) |
| 4 or 5 Rooms | 1,298 (36.1%) | 688 (43.5%) |
| 6 or 7 Rooms | 1,371 (38.2%) | 465 (29.4%) |
| 8 or more Rooms | 726 (20.2%) | 102 (6.4%) |
| Total | 3,593 (100.0%) | 1,583 (100.0%) |
Housing Structure by Heating Type in Craig County
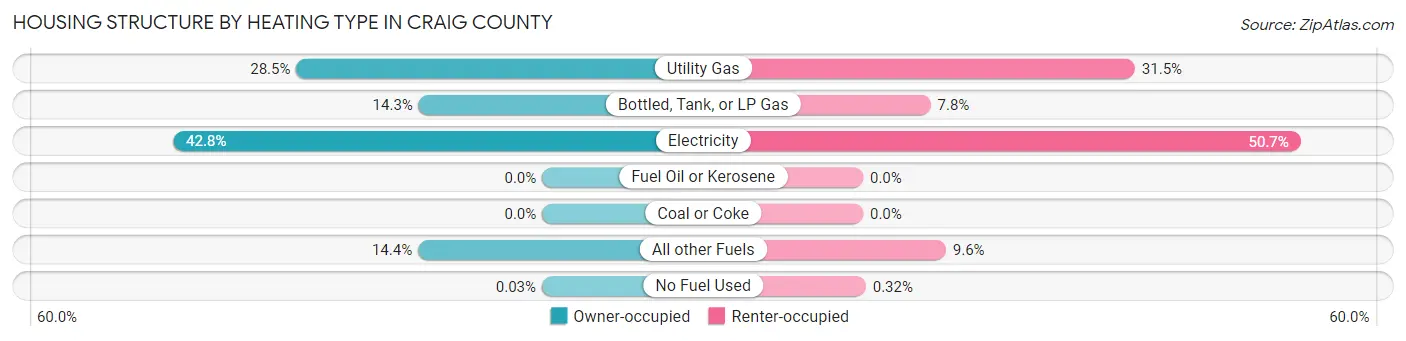
| Heating Type | Owner-occupied | Renter-occupied |
| Utility Gas | 1,024 (28.5%) | 499 (31.5%) |
| Bottled, Tank, or LP Gas | 514 (14.3%) | 124 (7.8%) |
| Electricity | 1,537 (42.8%) | 803 (50.7%) |
| Fuel Oil or Kerosene | 0 (0.0%) | 0 (0.0%) |
| Coal or Coke | 0 (0.0%) | 0 (0.0%) |
| All other Fuels | 517 (14.4%) | 152 (9.6%) |
| No Fuel Used | 1 (0.0%) | 5 (0.3%) |
| Total | 3,593 (100.0%) | 1,583 (100.0%) |
Household Vehicle Usage in Craig County
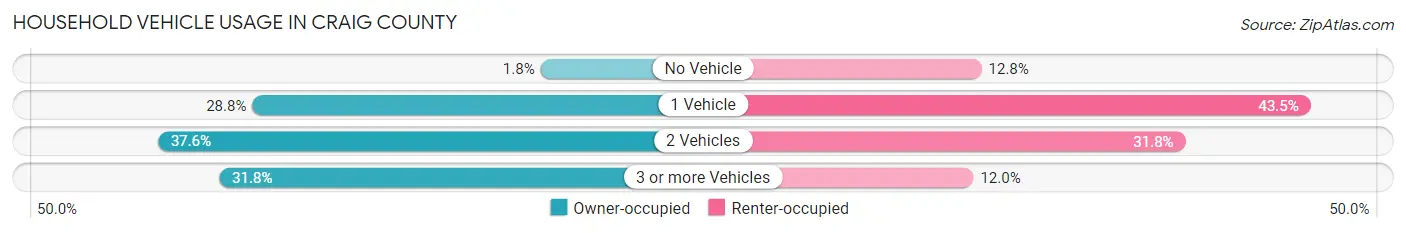
| Vehicles per Household | Owner-occupied | Renter-occupied |
| No Vehicle | 66 (1.8%) | 202 (12.8%) |
| 1 Vehicle | 1,033 (28.7%) | 688 (43.5%) |
| 2 Vehicles | 1,350 (37.6%) | 503 (31.8%) |
| 3 or more Vehicles | 1,144 (31.8%) | 190 (12.0%) |
| Total | 3,593 (100.0%) | 1,583 (100.0%) |
Real Estate & Mortgages in Craig County
Real Estate and Mortgage Overview in Craig County
| Characteristic | Without Mortgage | With Mortgage |
| Housing Units | 1,999 | 1,594 |
| Median Property Value | $110,800 | $134,500 |
| Median Household Income | $47,196 | $185 |
| Monthly Housing Costs | $411 | $107 |
| Real Estate Taxes | $612 | $82 |
Property Value by Mortgage Status in Craig County
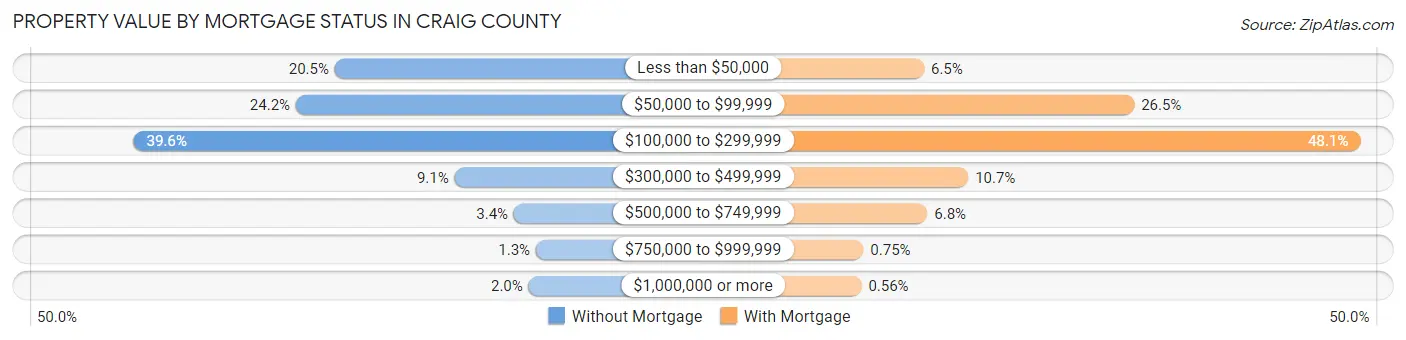
| Property Value | Without Mortgage | With Mortgage |
| Less than $50,000 | 409 (20.5%) | 104 (6.5%) |
| $50,000 to $99,999 | 483 (24.2%) | 423 (26.5%) |
| $100,000 to $299,999 | 792 (39.6%) | 766 (48.1%) |
| $300,000 to $499,999 | 181 (9.0%) | 171 (10.7%) |
| $500,000 to $749,999 | 68 (3.4%) | 109 (6.8%) |
| $750,000 to $999,999 | 26 (1.3%) | 12 (0.7%) |
| $1,000,000 or more | 40 (2.0%) | 9 (0.6%) |
| Total | 1,999 (100.0%) | 1,594 (100.0%) |
Household Income by Mortgage Status in Craig County
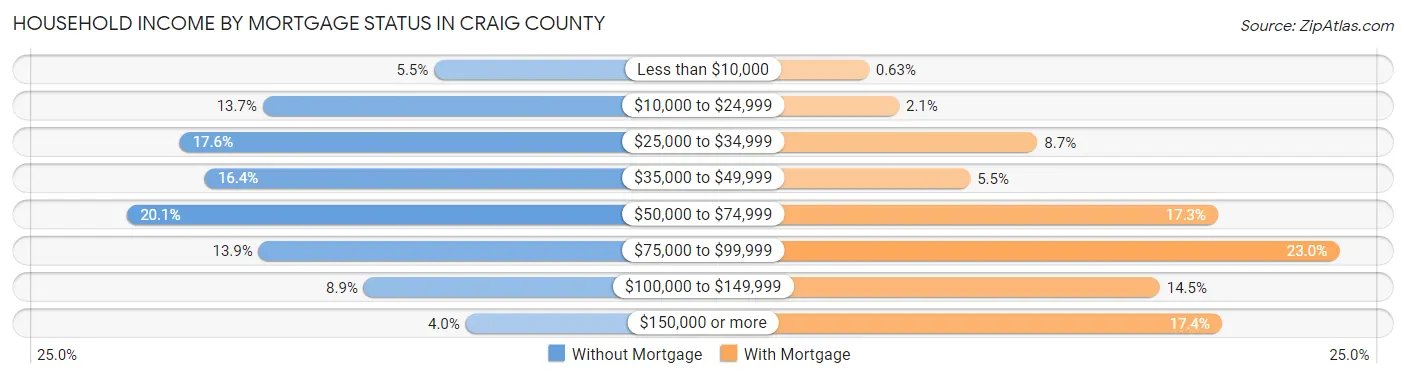
| Household Income | Without Mortgage | With Mortgage |
| Less than $10,000 | 110 (5.5%) | 10 (0.6%) |
| $10,000 to $24,999 | 273 (13.7%) | 33 (2.1%) |
| $25,000 to $34,999 | 352 (17.6%) | 138 (8.7%) |
| $35,000 to $49,999 | 328 (16.4%) | 87 (5.5%) |
| $50,000 to $74,999 | 402 (20.1%) | 275 (17.2%) |
| $75,000 to $99,999 | 277 (13.9%) | 367 (23.0%) |
| $100,000 to $149,999 | 177 (8.8%) | 231 (14.5%) |
| $150,000 or more | 80 (4.0%) | 278 (17.4%) |
| Total | 1,999 (100.0%) | 1,594 (100.0%) |
Property Value to Household Income Ratio in Craig County
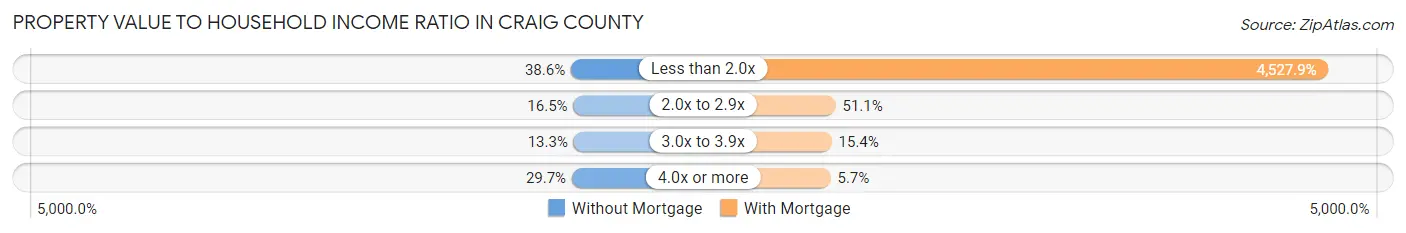
| Value-to-Income Ratio | Without Mortgage | With Mortgage |
| Less than 2.0x | 771 (38.6%) | 72,174 (4,527.9%) |
| 2.0x to 2.9x | 329 (16.5%) | 814 (51.1%) |
| 3.0x to 3.9x | 266 (13.3%) | 246 (15.4%) |
| 4.0x or more | 593 (29.7%) | 91 (5.7%) |
| Total | 1,999 (100.0%) | 1,594 (100.0%) |
Real Estate Taxes by Mortgage Status in Craig County
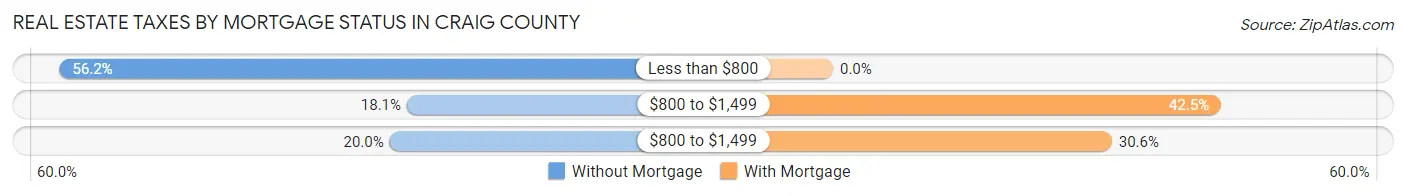
| Property Taxes | Without Mortgage | With Mortgage |
| Less than $800 | 1,123 (56.2%) | 0 (0.0%) |
| $800 to $1,499 | 362 (18.1%) | 678 (42.5%) |
| $800 to $1,499 | 400 (20.0%) | 487 (30.5%) |
| Total | 1,999 (100.0%) | 1,594 (100.0%) |
Health & Disability in Craig County
Health Insurance Coverage by Age in Craig County
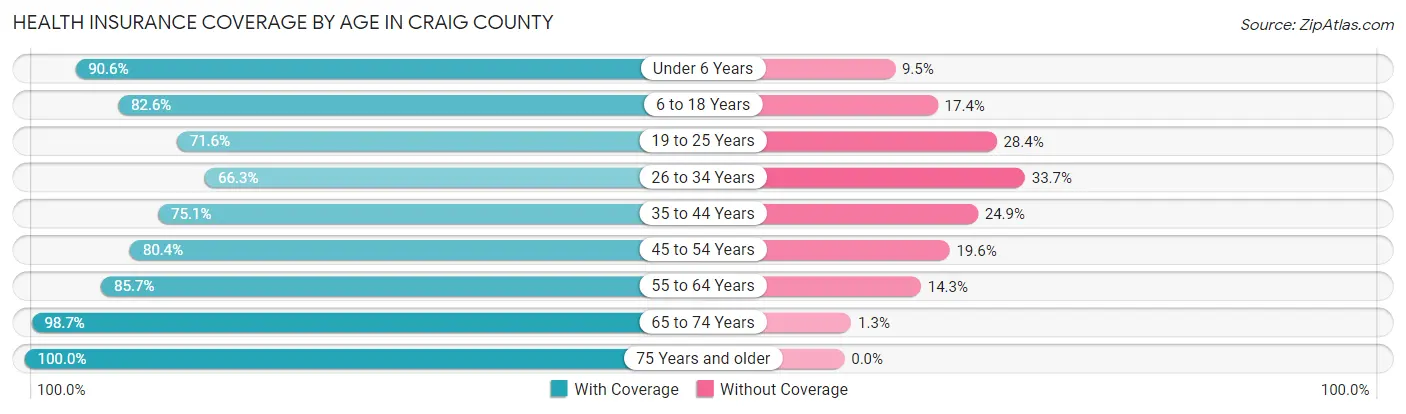
| Age Bracket | With Coverage | Without Coverage |
| Under 6 Years | 767 (90.5%) | 80 (9.5%) |
| 6 to 18 Years | 1,987 (82.6%) | 419 (17.4%) |
| 19 to 25 Years | 742 (71.6%) | 294 (28.4%) |
| 26 to 34 Years | 952 (66.3%) | 483 (33.7%) |
| 35 to 44 Years | 1,156 (75.1%) | 383 (24.9%) |
| 45 to 54 Years | 1,282 (80.4%) | 313 (19.6%) |
| 55 to 64 Years | 1,599 (85.7%) | 266 (14.3%) |
| 65 to 74 Years | 1,384 (98.7%) | 18 (1.3%) |
| 75 Years and older | 1,154 (100.0%) | 0 (0.0%) |
| Total | 11,023 (83.0%) | 2,256 (17.0%) |
Health Insurance Coverage by Citizenship Status in Craig County
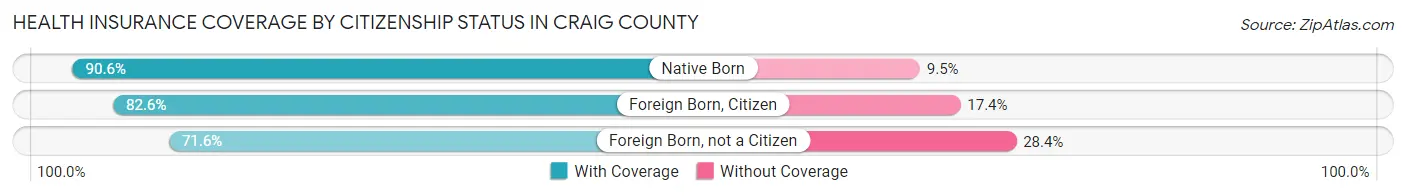
| Citizenship Status | With Coverage | Without Coverage |
| Native Born | 767 (90.5%) | 80 (9.5%) |
| Foreign Born, Citizen | 1,987 (82.6%) | 419 (17.4%) |
| Foreign Born, not a Citizen | 742 (71.6%) | 294 (28.4%) |
Health Insurance Coverage by Household Income in Craig County
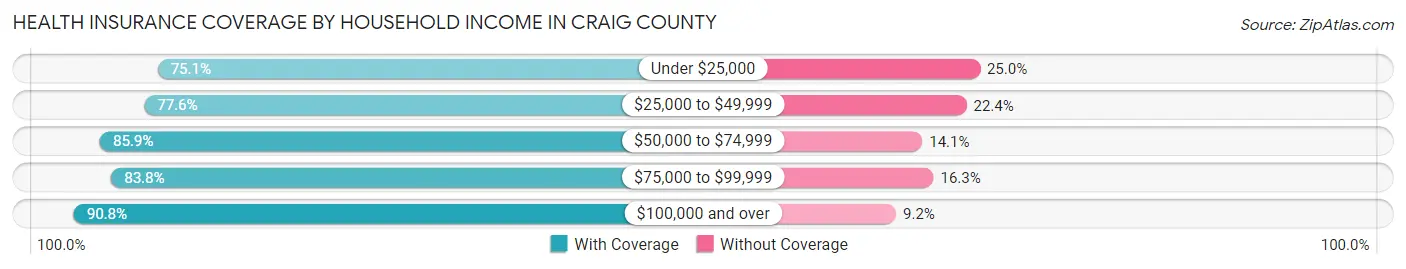
| Household Income | With Coverage | Without Coverage |
| Under $25,000 | 1,471 (75.0%) | 489 (24.9%) |
| $25,000 to $49,999 | 2,864 (77.6%) | 828 (22.4%) |
| $50,000 to $74,999 | 2,387 (85.9%) | 393 (14.1%) |
| $75,000 to $99,999 | 1,428 (83.8%) | 277 (16.3%) |
| $100,000 and over | 2,527 (90.8%) | 257 (9.2%) |
Public vs Private Health Insurance Coverage by Age in Craig County
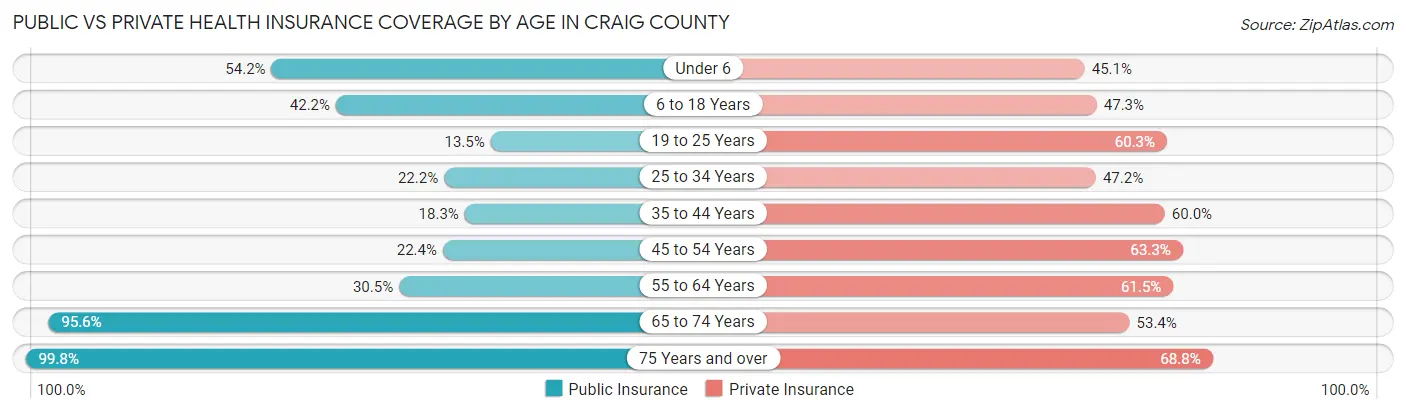
| Age Bracket | Public Insurance | Private Insurance |
| Under 6 | 459 (54.2%) | 382 (45.1%) |
| 6 to 18 Years | 1,016 (42.2%) | 1,139 (47.3%) |
| 19 to 25 Years | 140 (13.5%) | 625 (60.3%) |
| 25 to 34 Years | 318 (22.2%) | 677 (47.2%) |
| 35 to 44 Years | 282 (18.3%) | 923 (60.0%) |
| 45 to 54 Years | 357 (22.4%) | 1,009 (63.3%) |
| 55 to 64 Years | 569 (30.5%) | 1,147 (61.5%) |
| 65 to 74 Years | 1,340 (95.6%) | 749 (53.4%) |
| 75 Years and over | 1,152 (99.8%) | 794 (68.8%) |
| Total | 5,633 (42.4%) | 7,445 (56.1%) |
Disability Status by Sex by Age in Craig County
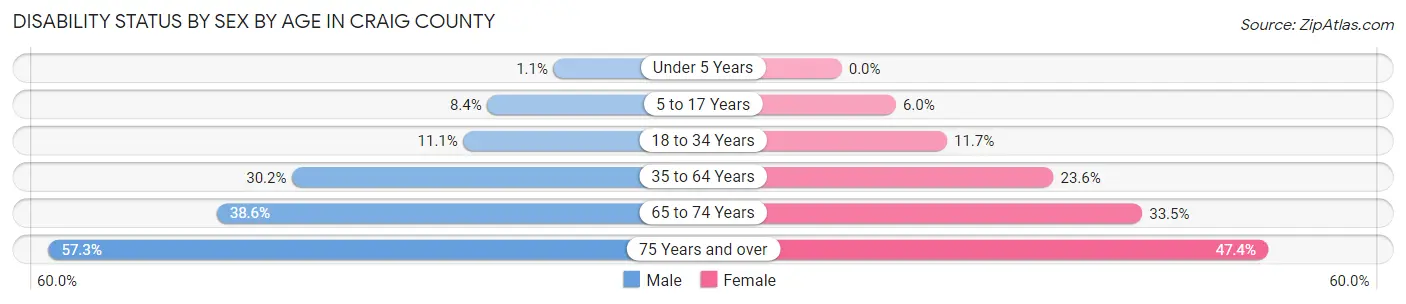
| Age Bracket | Male | Female |
| Under 5 Years | 4 (1.1%) | 0 (0.0%) |
| 5 to 17 Years | 103 (8.4%) | 69 (6.0%) |
| 18 to 34 Years | 148 (11.1%) | 153 (11.7%) |
| 35 to 64 Years | 732 (30.2%) | 607 (23.6%) |
| 65 to 74 Years | 262 (38.6%) | 242 (33.5%) |
| 75 Years and over | 258 (57.3%) | 334 (47.4%) |
Disability Class by Sex by Age in Craig County
Disability Class: Hearing Difficulty
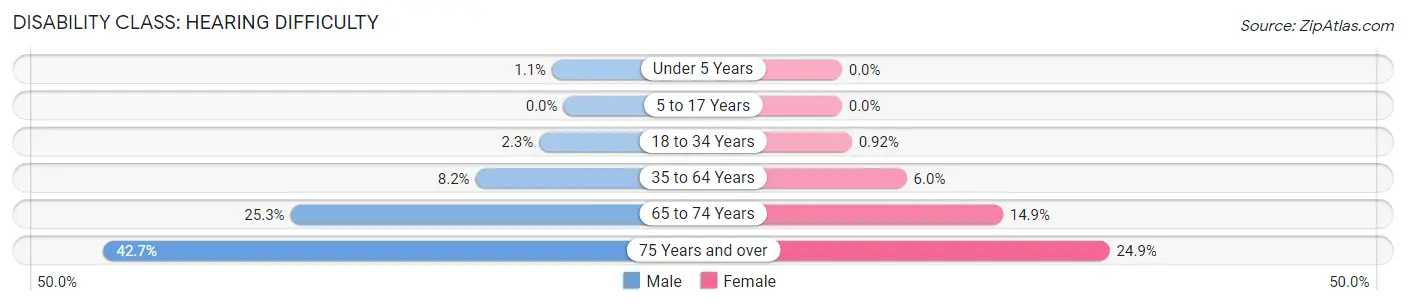
| Age Bracket | Male | Female |
| Under 5 Years | 4 (1.1%) | 0 (0.0%) |
| 5 to 17 Years | 0 (0.0%) | 0 (0.0%) |
| 18 to 34 Years | 30 (2.2%) | 12 (0.9%) |
| 35 to 64 Years | 198 (8.2%) | 155 (6.0%) |
| 65 to 74 Years | 172 (25.3%) | 108 (14.9%) |
| 75 Years and over | 192 (42.7%) | 175 (24.9%) |
Disability Class: Vision Difficulty
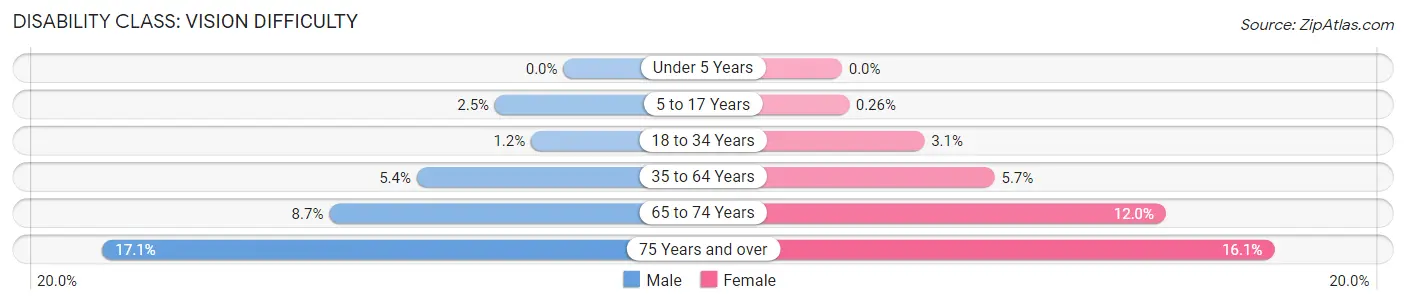
| Age Bracket | Male | Female |
| Under 5 Years | 0 (0.0%) | 0 (0.0%) |
| 5 to 17 Years | 31 (2.5%) | 3 (0.3%) |
| 18 to 34 Years | 16 (1.2%) | 40 (3.1%) |
| 35 to 64 Years | 132 (5.4%) | 146 (5.7%) |
| 65 to 74 Years | 59 (8.7%) | 87 (12.0%) |
| 75 Years and over | 77 (17.1%) | 113 (16.1%) |
Disability Class: Cognitive Difficulty
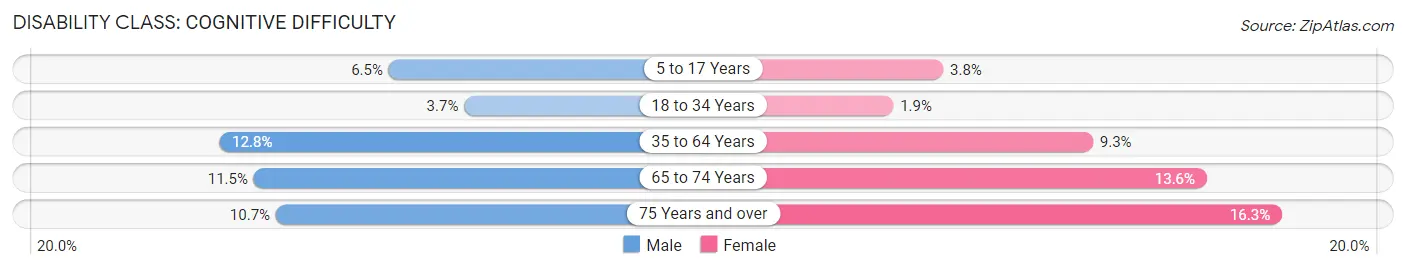
| Age Bracket | Male | Female |
| 5 to 17 Years | 79 (6.5%) | 43 (3.8%) |
| 18 to 34 Years | 49 (3.7%) | 25 (1.9%) |
| 35 to 64 Years | 310 (12.8%) | 240 (9.3%) |
| 65 to 74 Years | 78 (11.5%) | 98 (13.6%) |
| 75 Years and over | 48 (10.7%) | 115 (16.3%) |
Disability Class: Ambulatory Difficulty
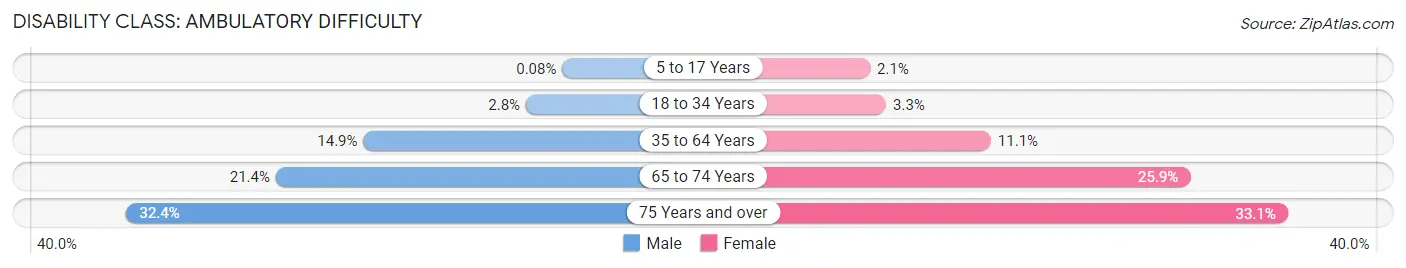
| Age Bracket | Male | Female |
| 5 to 17 Years | 1 (0.1%) | 24 (2.1%) |
| 18 to 34 Years | 37 (2.8%) | 43 (3.3%) |
| 35 to 64 Years | 360 (14.8%) | 285 (11.1%) |
| 65 to 74 Years | 145 (21.3%) | 187 (25.9%) |
| 75 Years and over | 146 (32.4%) | 233 (33.1%) |
Disability Class: Self-Care Difficulty
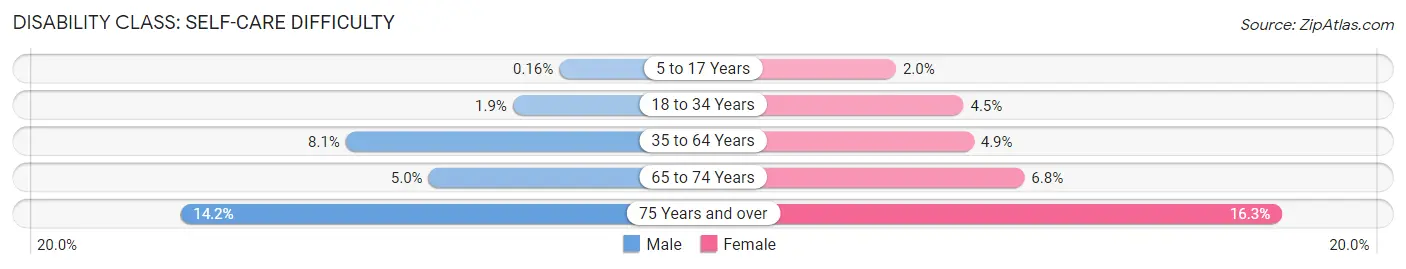
| Age Bracket | Male | Female |
| 5 to 17 Years | 2 (0.2%) | 23 (2.0%) |
| 18 to 34 Years | 25 (1.9%) | 59 (4.5%) |
| 35 to 64 Years | 196 (8.1%) | 126 (4.9%) |
| 65 to 74 Years | 34 (5.0%) | 49 (6.8%) |
| 75 Years and over | 64 (14.2%) | 115 (16.3%) |
Technology Access in Craig County
Computing Device Access in Craig County
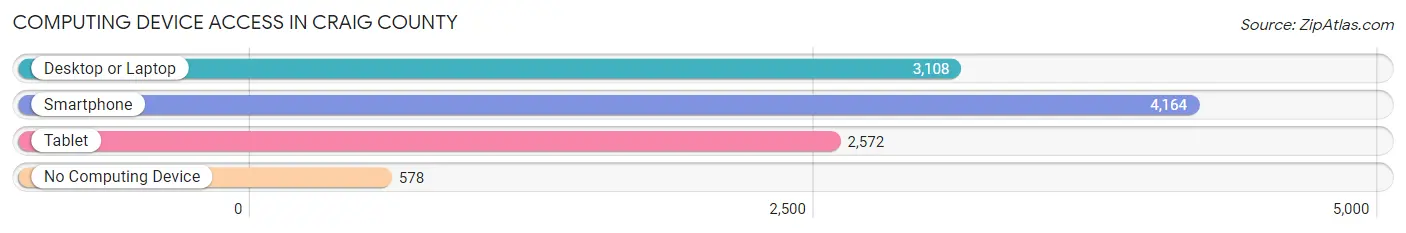
| Device Type | # Households | % Households |
| Desktop or Laptop | 3,108 | 60.1% |
| Smartphone | 4,164 | 80.4% |
| Tablet | 2,572 | 49.7% |
| No Computing Device | 578 | 11.2% |
| Total | 5,176 | 100.0% |
Internet Access in Craig County
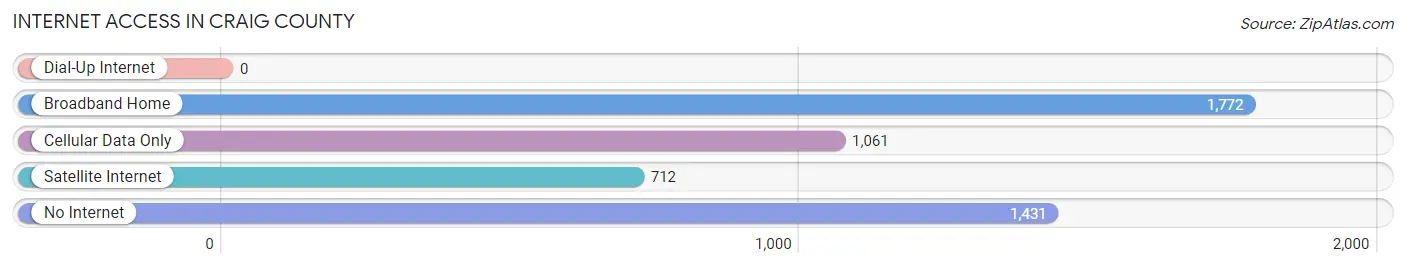
| Internet Type | # Households | % Households |
| Dial-Up Internet | 0 | 0.0% |
| Broadband Home | 1,772 | 34.2% |
| Cellular Data Only | 1,061 | 20.5% |
| Satellite Internet | 712 | 13.8% |
| No Internet | 1,431 | 27.7% |
| Total | 5,176 | 100.0% |
Craig County Summary
Introduction
Craig County is located in the northeastern corner of Oklahoma, and is bordered by Kansas to the north, Missouri to the east, and Arkansas to the south. The county was created in 1907 and named after Granville Craig, a prominent Cherokee leader. Craig County is home to approximately 15,000 people, and is known for its rural, agricultural lifestyle. The county seat is Vinita, which is the largest city in the county.
History
Craig County was created in 1907 from part of the Cherokee Nation. The county was named after Granville Craig, a prominent Cherokee leader. The county was originally home to the Osage and Cherokee tribes, who were forcibly removed from their ancestral lands in the 1830s. The area was then settled by white settlers in the late 1800s.
The county was initially an agricultural area, with cotton, corn, and wheat being the main crops. In the early 1900s, oil was discovered in the area, and the economy shifted to focus on oil production. The county also became a popular tourist destination, with many people visiting the area to take advantage of the natural beauty and recreational opportunities.
Geography
Craig County is located in the northeastern corner of Oklahoma, and is bordered by Kansas to the north, Missouri to the east, and Arkansas to the south. The county covers an area of 845 square miles, and is mostly rural and agricultural. The terrain is mostly flat, with some rolling hills in the western part of the county. The county is home to several lakes, including Grand Lake, Lake Hudson, and Lake Tenkiller.
The county is home to several state parks, including Grand Lake State Park, Tenkiller State Park, and Sequoyah State Park. The county is also home to the Cherokee National Forest, which covers over 600,000 acres of land.
Economy
Craig County’s economy is largely based on agriculture and tourism. The county is home to several large farms, which produce corn, wheat, soybeans, and other crops. The county is also home to several large cattle ranches.
The county is also home to several oil and gas companies, which produce oil and natural gas from the area. The county is also home to several manufacturing companies, which produce a variety of products, including furniture, clothing, and electronics.
The county is also a popular tourist destination, with many people visiting the area to take advantage of the natural beauty and recreational opportunities. The county is home to several state parks, as well as the Cherokee National Forest.
Demographics
As of the 2010 census, Craig County had a population of 14,914 people. The population is mostly white (90.2%), with small percentages of African American (3.2%), Native American (2.2%), Asian (0.7%), and other races (3.7%). The median household income is $41,945, and the median age is 40.7 years.
Conclusion
Craig County is located in the northeastern corner of Oklahoma, and is bordered by Kansas to the north, Missouri to the east, and Arkansas to the south. The county was created in 1907 and named after Granville Craig, a prominent Cherokee leader. Craig County is home to approximately 15,000 people, and is known for its rural, agricultural lifestyle. The county’s economy is largely based on agriculture and tourism, and the county is also home to several oil and gas companies, as well as several manufacturing companies. The county is also a popular tourist destination, with many people visiting the area to take advantage of the natural beauty and recreational opportunities.
Common Questions
What is Per Capita Income in Craig County?
Per Capita income in Craig County is $24,199.
What is the Median Family Income in Craig County?
Median Family Income in Craig County is $56,307.
What is the Median Household income in Craig County?
Median Household Income in Craig County is $48,018.
What is Income or Wage Gap in Craig County?
Income or Wage Gap in Craig County is 22.4%.
Women in Craig County earn 77.6 cents for every dollar earned by a man.
What is Family Income Deficit in Craig County?
Family Income Deficit in Craig County is $9,100.
Families that are below poverty line in Craig County earn $9,100 less on average than the poverty threshold level.
What is Inequality or Gini Index in Craig County?
Inequality or Gini Index in Craig County is 0.42.
What is the Total Population of Craig County?
Total Population of Craig County is 14,144.
What is the Total Male Population of Craig County?
Total Male Population of Craig County is 7,269.
What is the Total Female Population of Craig County?
Total Female Population of Craig County is 6,875.
What is the Ratio of Males per 100 Females in Craig County?
There are 105.73 Males per 100 Females in Craig County.
What is the Ratio of Females per 100 Males in Craig County?
There are 94.58 Females per 100 Males in Craig County.
What is the Median Population Age in Craig County?
Median Population Age in Craig County is 41.2 Years.
What is the Average Family Size in Craig County
Average Family Size in Craig County is 3.0 People.
What is the Average Household Size in Craig County
Average Household Size in Craig County is 2.5 People.
How Large is the Labor Force in Craig County?
There are 5,653 People in the Labor Forcein in Craig County.
What is the Percentage of People in the Labor Force in Craig County?
49.4% of People are in the Labor Force in Craig County.
What is the Unemployment Rate in Craig County?
Unemployment Rate in Craig County is 4.6%.