Coal County, OK Map & Demographics
Coal County Map
Coal County Overview
$26,899
PER CAPITA INCOME
$56,016
AVG FAMILY INCOME
$47,117
AVG HOUSEHOLD INCOME
21.5%
WAGE / INCOME GAP [ % ]
78.5¢/ $1
WAGE / INCOME GAP [ $ ]
$9,512
FAMILY INCOME DEFICIT
0.47
INEQUALITY / GINI INDEX
5,287
TOTAL POPULATION
2,696
MALE POPULATION
2,591
FEMALE POPULATION
104.05
MALES / 100 FEMALES
96.11
FEMALES / 100 MALES
40.7
MEDIAN AGE
3.1
AVG FAMILY SIZE
2.5
AVG HOUSEHOLD SIZE
2,146
LABOR FORCE [ PEOPLE ]
51.1%
PERCENT IN LABOR FORCE
5.6%
UNEMPLOYMENT RATE
Coal County Area Codes
Income in Coal County
Income Overview in Coal County
Per Capita Income in Coal County is $26,899, while median incomes of families and households are $56,016 and $47,117 respectively.
| Characteristic | Number | Measure |
| Per Capita Income | 5,287 | $26,899 |
| Median Family Income | 1,318 | $56,016 |
| Mean Family Income | 1,318 | $74,595 |
| Median Household Income | 2,083 | $47,117 |
| Mean Household Income | 2,083 | $66,062 |
| Income Deficit | 1,318 | $9,512 |
| Wage / Income Gap (%) | 5,287 | 21.53% |
| Wage / Income Gap ($) | 5,287 | 78.47¢ per $1 |
| Gini / Inequality Index | 5,287 | 0.47 |
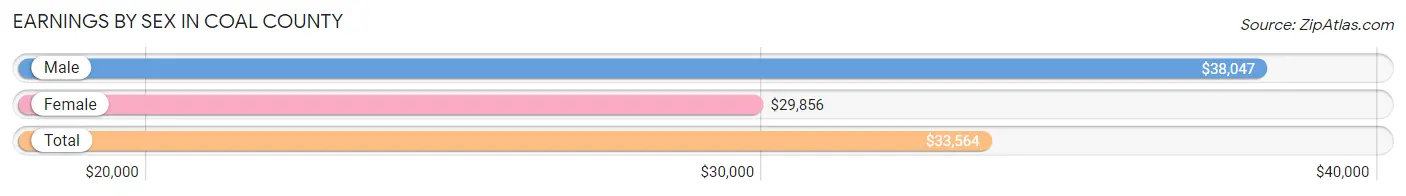
Earnings by Sex in Coal County
Average Earnings in Coal County are $33,564, $38,047 for men and $29,856 for women, a difference of 21.5%.
| Sex | Number | Average Earnings |
| Male | 1,199 (53.4%) | $38,047 |
| Female | 1,047 (46.6%) | $29,856 |
| Total | 2,246 (100.0%) | $33,564 |
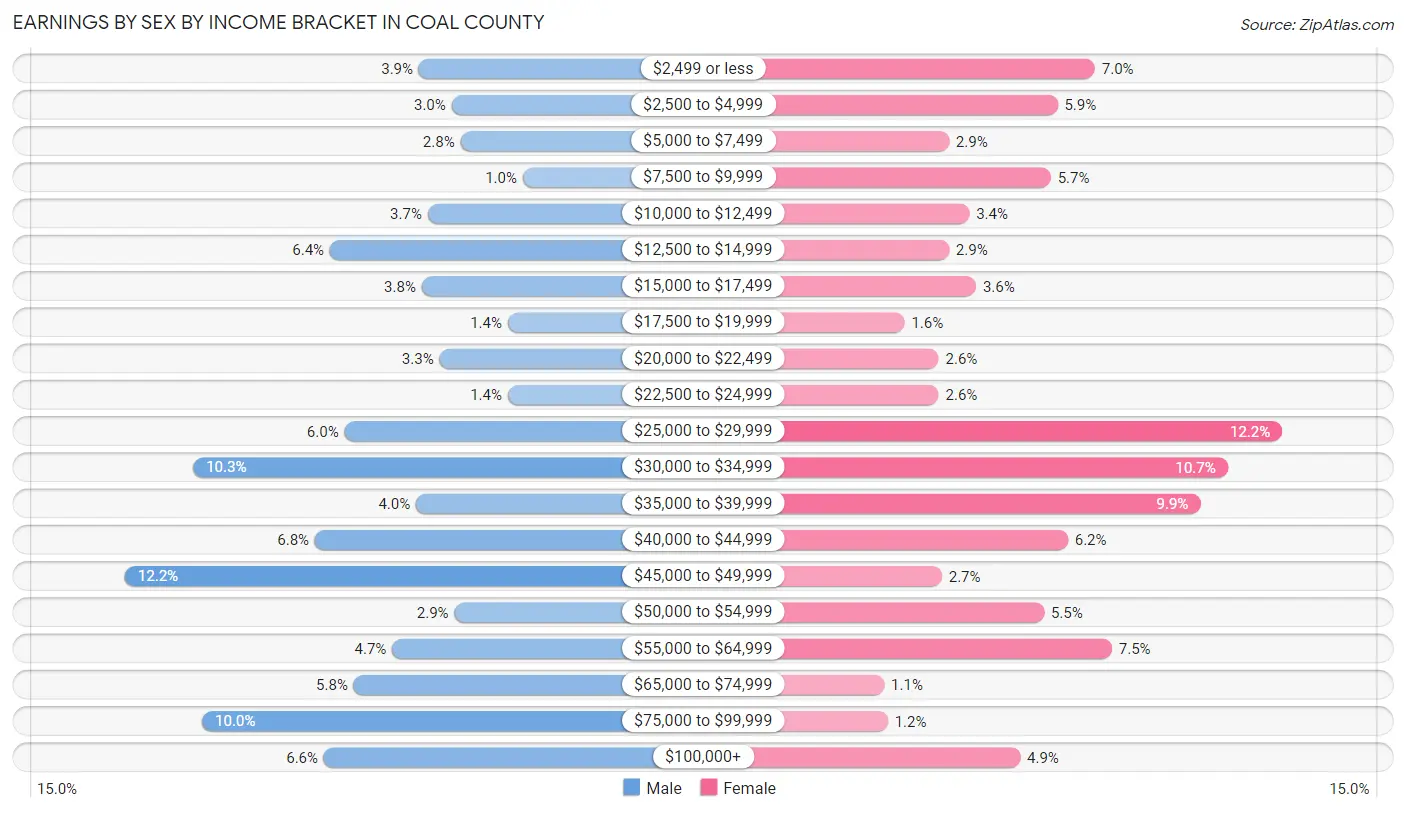
Earnings by Sex by Income Bracket in Coal County
The most common earnings brackets in Coal County are $45,000 to $49,999 for men (146 | 12.2%) and $25,000 to $29,999 for women (128 | 12.2%).
| Income | Male | Female |
| $2,499 or less | 47 (3.9%) | 73 (7.0%) |
| $2,500 to $4,999 | 36 (3.0%) | 62 (5.9%) |
| $5,000 to $7,499 | 33 (2.8%) | 30 (2.9%) |
| $7,500 to $9,999 | 12 (1.0%) | 60 (5.7%) |
| $10,000 to $12,499 | 44 (3.7%) | 36 (3.4%) |
| $12,500 to $14,999 | 77 (6.4%) | 30 (2.9%) |
| $15,000 to $17,499 | 46 (3.8%) | 38 (3.6%) |
| $17,500 to $19,999 | 17 (1.4%) | 17 (1.6%) |
| $20,000 to $22,499 | 40 (3.3%) | 27 (2.6%) |
| $22,500 to $24,999 | 17 (1.4%) | 27 (2.6%) |
| $25,000 to $29,999 | 72 (6.0%) | 128 (12.2%) |
| $30,000 to $34,999 | 123 (10.3%) | 112 (10.7%) |
| $35,000 to $39,999 | 48 (4.0%) | 104 (9.9%) |
| $40,000 to $44,999 | 82 (6.8%) | 65 (6.2%) |
| $45,000 to $49,999 | 146 (12.2%) | 28 (2.7%) |
| $50,000 to $54,999 | 35 (2.9%) | 58 (5.5%) |
| $55,000 to $64,999 | 56 (4.7%) | 78 (7.4%) |
| $65,000 to $74,999 | 69 (5.8%) | 11 (1.1%) |
| $75,000 to $99,999 | 120 (10.0%) | 12 (1.1%) |
| $100,000+ | 79 (6.6%) | 51 (4.9%) |
| Total | 1,199 (100.0%) | 1,047 (100.0%) |
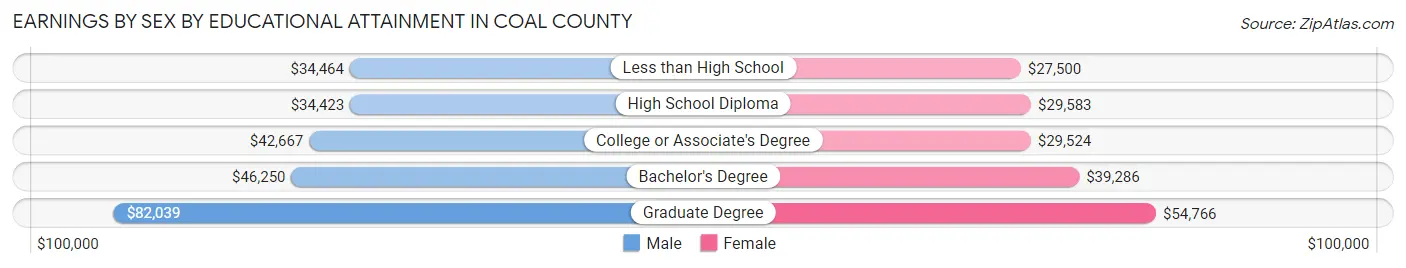
Earnings by Sex by Educational Attainment in Coal County
Average earnings in Coal County are $41,432 for men and $32,778 for women, a difference of 20.9%. Men with an educational attainment of graduate degree enjoy the highest average annual earnings of $82,039, while those with high school diploma education earn the least with $34,423. Women with an educational attainment of graduate degree earn the most with the average annual earnings of $54,766, while those with less than high school education have the smallest earnings of $27,500.
| Educational Attainment | Male Income | Female Income |
| Less than High School | $34,464 | $27,500 |
| High School Diploma | $34,423 | $29,583 |
| College or Associate's Degree | $42,667 | $29,524 |
| Bachelor's Degree | $46,250 | $39,286 |
| Graduate Degree | $82,039 | $54,766 |
| Total | $41,432 | $32,778 |
Family Income in Coal County
Family Income Brackets in Coal County
According to the Coal County family income data, there are 268 families falling into the $50,000 to $74,999 income range, which is the most common income bracket and makes up 20.3% of all families. Conversely, the $200,000+ income bracket is the least frequent group with only 43 families (3.3%) belonging to this category.
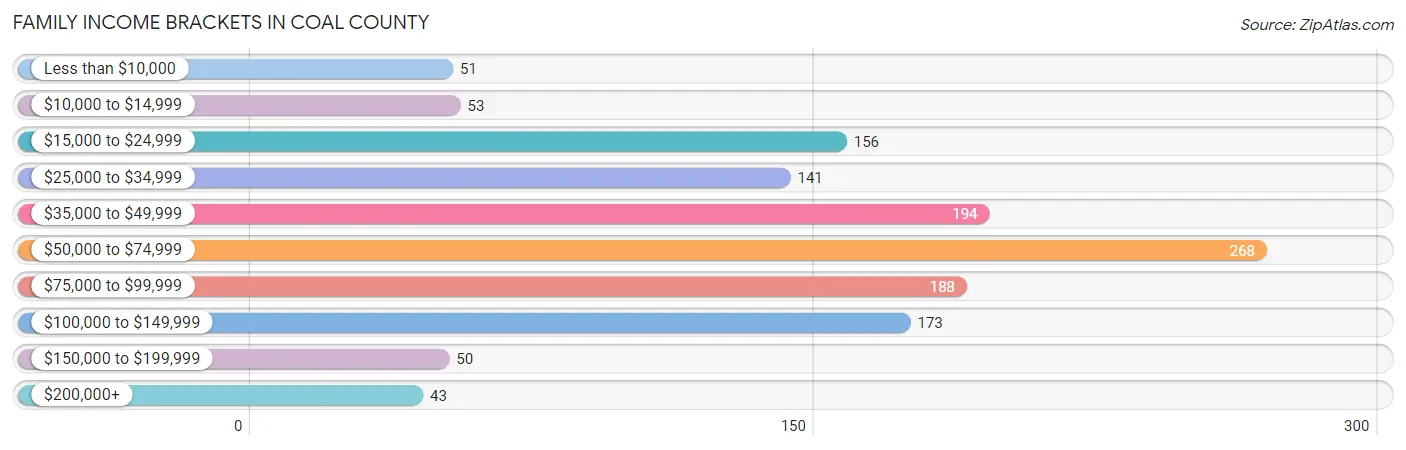
| Income Bracket | # Families | % Families |
| Less than $10,000 | 51 | 3.9% |
| $10,000 to $14,999 | 53 | 4.0% |
| $15,000 to $24,999 | 156 | 11.8% |
| $25,000 to $34,999 | 141 | 10.7% |
| $35,000 to $49,999 | 194 | 14.7% |
| $50,000 to $74,999 | 268 | 20.3% |
| $75,000 to $99,999 | 188 | 14.3% |
| $100,000 to $149,999 | 173 | 13.1% |
| $150,000 to $199,999 | 50 | 3.8% |
| $200,000+ | 43 | 3.3% |
Family Income by Famaliy Size in Coal County
6-person families (62 | 4.7%) account for the highest median family income in Coal County with $77,500 per family, while 2-person families (682 | 51.7%) have the highest median income of $24,486 per family member.
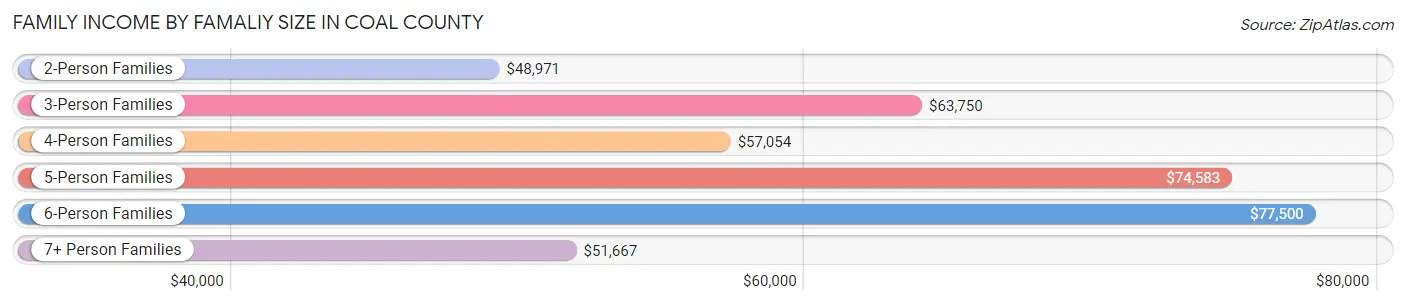
| Income Bracket | # Families | Median Income |
| 2-Person Families | 682 (51.7%) | $48,971 |
| 3-Person Families | 262 (19.9%) | $63,750 |
| 4-Person Families | 185 (14.0%) | $57,054 |
| 5-Person Families | 87 (6.6%) | $74,583 |
| 6-Person Families | 62 (4.7%) | $77,500 |
| 7+ Person Families | 40 (3.0%) | $51,667 |
| Total | 1,318 (100.0%) | $56,016 |
Family Income by Number of Earners in Coal County
The median family income in Coal County is $56,016, with families comprising 3+ earners (91) having the highest median family income of $88,875, while families with no earners (306) have the lowest median family income of $28,700, accounting for 6.9% and 23.2% of families, respectively.
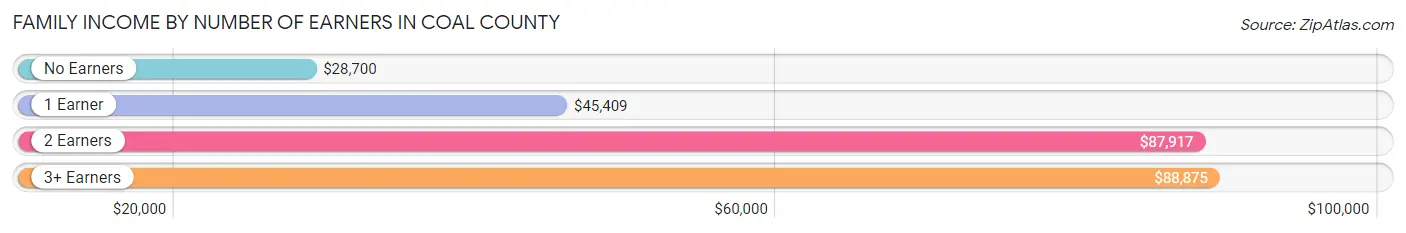
| Number of Earners | # Families | Median Income |
| No Earners | 306 (23.2%) | $28,700 |
| 1 Earner | 537 (40.7%) | $45,409 |
| 2 Earners | 384 (29.1%) | $87,917 |
| 3+ Earners | 91 (6.9%) | $88,875 |
| Total | 1,318 (100.0%) | $56,016 |
Household Income in Coal County
Household Income Brackets in Coal County
With 383 households falling in the category, the $50,000 to $74,999 income range is the most frequent in Coal County, accounting for 18.4% of all households. In contrast, only 60 households (2.9%) fall into the $150,000 to $199,999 income bracket, making it the least populous group.
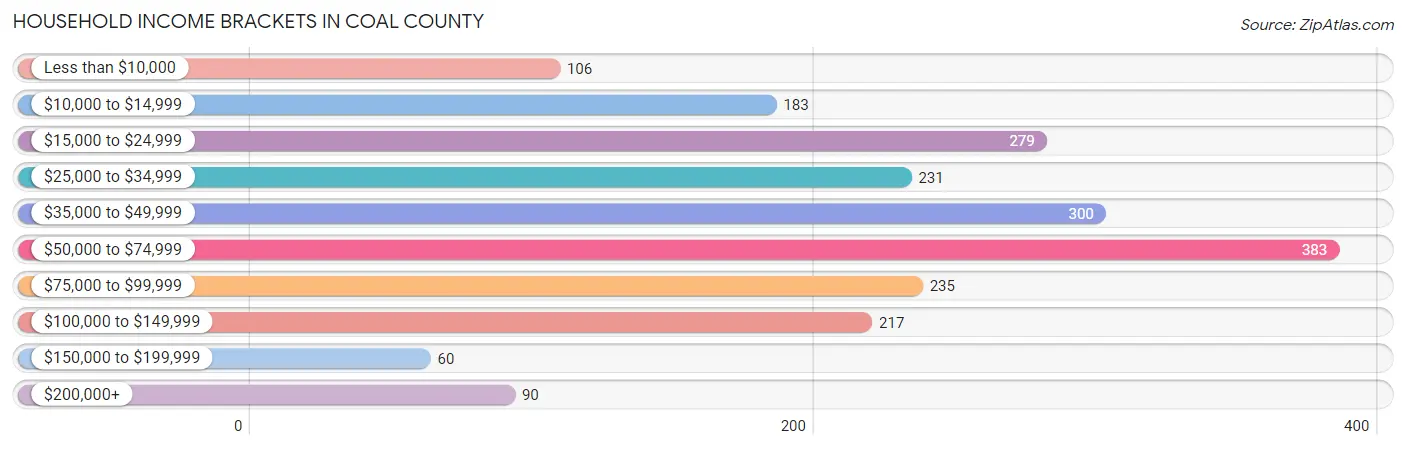
| Income Bracket | # Households | % Households |
| Less than $10,000 | 106 | 5.1% |
| $10,000 to $14,999 | 183 | 8.8% |
| $15,000 to $24,999 | 279 | 13.4% |
| $25,000 to $34,999 | 231 | 11.1% |
| $35,000 to $49,999 | 300 | 14.4% |
| $50,000 to $74,999 | 383 | 18.4% |
| $75,000 to $99,999 | 235 | 11.3% |
| $100,000 to $149,999 | 217 | 10.4% |
| $150,000 to $199,999 | 60 | 2.9% |
| $200,000+ | 90 | 4.3% |
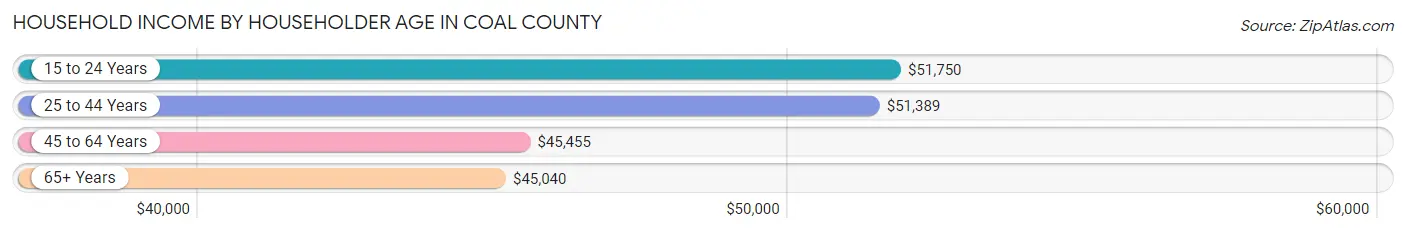
Household Income by Householder Age in Coal County
The median household income in Coal County is $47,117, with the highest median household income of $51,750 found in the 15 to 24 years age bracket for the primary householder. A total of 90 households (4.3%) fall into this category. Meanwhile, the 65+ years age bracket for the primary householder has the lowest median household income of $45,040, with 733 households (35.2%) in this group.
| Income Bracket | # Households | Median Income |
| 15 to 24 Years | 90 (4.3%) | $51,750 |
| 25 to 44 Years | 512 (24.6%) | $51,389 |
| 45 to 64 Years | 748 (35.9%) | $45,455 |
| 65+ Years | 733 (35.2%) | $45,040 |
| Total | 2,083 (100.0%) | $47,117 |
Poverty in Coal County
Income Below Poverty by Sex and Age in Coal County
With 24.0% poverty level for males and 21.8% for females among the residents of Coal County, 5 year old males and 5 year old females are the most vulnerable to poverty, with 19 males (51.3%) and 16 females (61.5%) in their respective age groups living below the poverty level.
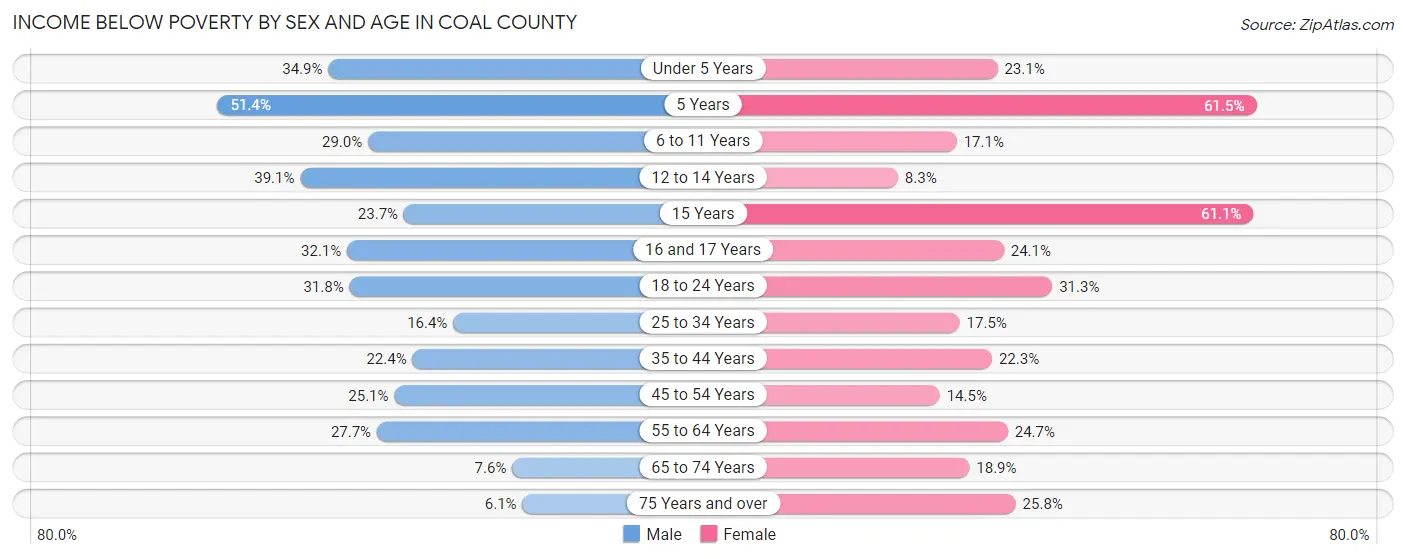
| Age Bracket | Male | Female |
| Under 5 Years | 67 (34.9%) | 40 (23.1%) |
| 5 Years | 19 (51.3%) | 16 (61.5%) |
| 6 to 11 Years | 58 (29.0%) | 35 (17.1%) |
| 12 to 14 Years | 50 (39.1%) | 5 (8.3%) |
| 15 Years | 9 (23.7%) | 11 (61.1%) |
| 16 and 17 Years | 35 (32.1%) | 19 (24.0%) |
| 18 to 24 Years | 81 (31.8%) | 55 (31.2%) |
| 25 to 34 Years | 45 (16.4%) | 49 (17.5%) |
| 35 to 44 Years | 69 (22.4%) | 68 (22.3%) |
| 45 to 54 Years | 72 (25.1%) | 41 (14.5%) |
| 55 to 64 Years | 106 (27.7%) | 89 (24.6%) |
| 65 to 74 Years | 22 (7.6%) | 61 (18.9%) |
| 75 Years and over | 11 (6.1%) | 63 (25.8%) |
| Total | 644 (24.0%) | 552 (21.8%) |
Income Above Poverty by Sex and Age in Coal County
According to the poverty statistics in Coal County, males aged 75 years and over and females aged 12 to 14 years are the age groups that are most secure financially, with 93.9% of males and 91.7% of females in these age groups living above the poverty line.
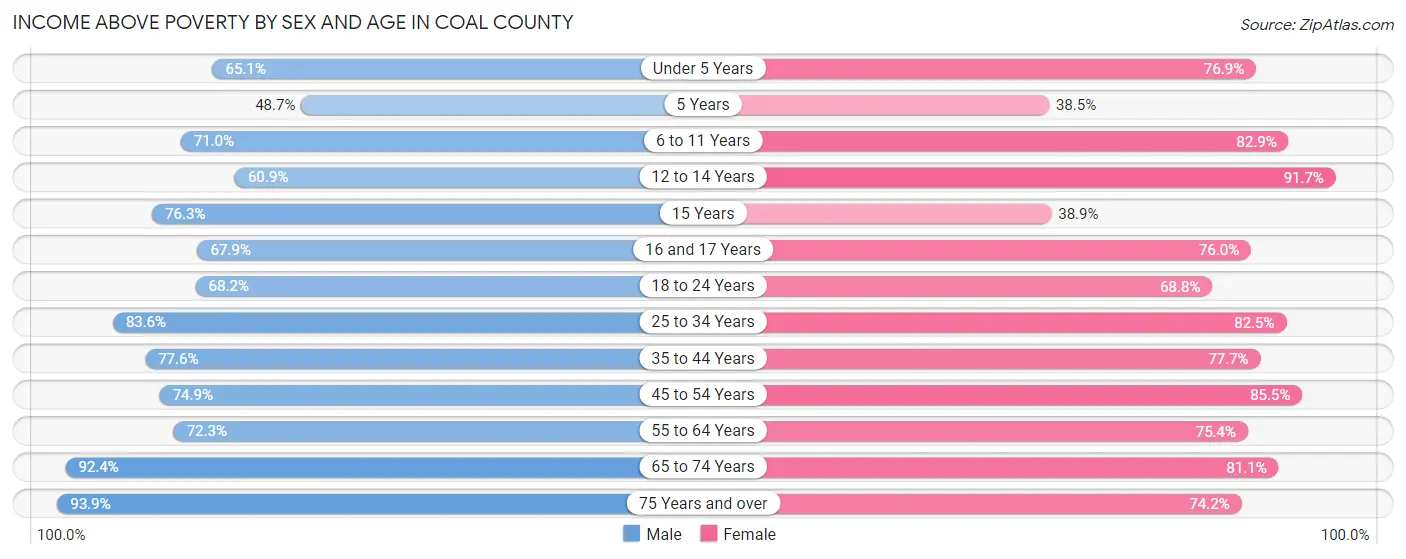
| Age Bracket | Male | Female |
| Under 5 Years | 125 (65.1%) | 133 (76.9%) |
| 5 Years | 18 (48.6%) | 10 (38.5%) |
| 6 to 11 Years | 142 (71.0%) | 170 (82.9%) |
| 12 to 14 Years | 78 (60.9%) | 55 (91.7%) |
| 15 Years | 29 (76.3%) | 7 (38.9%) |
| 16 and 17 Years | 74 (67.9%) | 60 (75.9%) |
| 18 to 24 Years | 174 (68.2%) | 121 (68.8%) |
| 25 to 34 Years | 230 (83.6%) | 231 (82.5%) |
| 35 to 44 Years | 239 (77.6%) | 237 (77.7%) |
| 45 to 54 Years | 215 (74.9%) | 241 (85.5%) |
| 55 to 64 Years | 277 (72.3%) | 272 (75.3%) |
| 65 to 74 Years | 268 (92.4%) | 261 (81.1%) |
| 75 Years and over | 170 (93.9%) | 181 (74.2%) |
| Total | 2,039 (76.0%) | 1,979 (78.2%) |
Income Below Poverty Among Married-Couple Families in Coal County
The poverty statistics for married-couple families in Coal County show that 9.7% or 96 of the total 987 families live below the poverty line. Families with 5 or more children have the highest poverty rate of 41.2%, comprising of 7 families. On the other hand, families with 3 or 4 children have the lowest poverty rate of 2.6%, which includes 3 families.
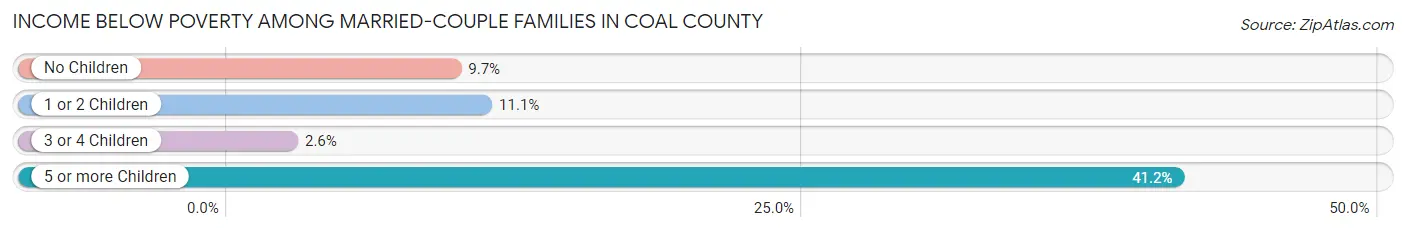
| Children | Above Poverty | Below Poverty |
| No Children | 576 (90.3%) | 62 (9.7%) |
| 1 or 2 Children | 193 (88.9%) | 24 (11.1%) |
| 3 or 4 Children | 112 (97.4%) | 3 (2.6%) |
| 5 or more Children | 10 (58.8%) | 7 (41.2%) |
| Total | 891 (90.3%) | 96 (9.7%) |
Income Below Poverty Among Single-Parent Households in Coal County
According to the poverty data in Coal County, 35.2% or 37 single-father households and 39.4% or 89 single-mother households are living below the poverty line. Among single-father households, those with 5 or more children have the highest poverty rate, with 10 households (100.0%) experiencing poverty. Likewise, among single-mother households, those with 3 or 4 children have the highest poverty rate, with 26 households (61.9%) falling below the poverty line.
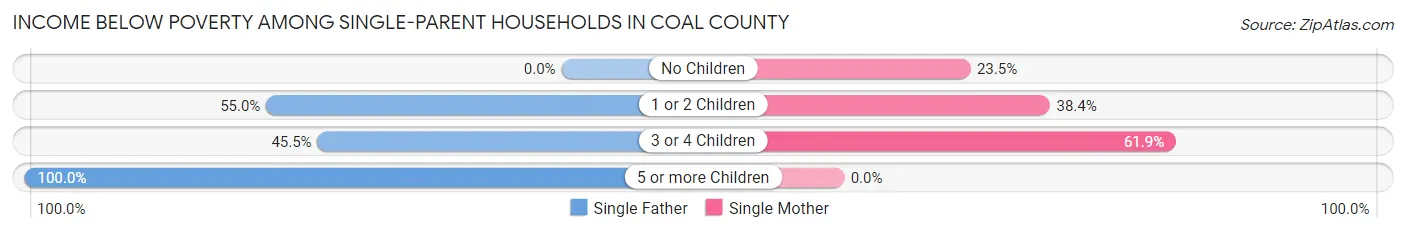
| Children | Single Father | Single Mother |
| No Children | 0 (0.0%) | 12 (23.5%) |
| 1 or 2 Children | 22 (55.0%) | 51 (38.4%) |
| 3 or 4 Children | 5 (45.5%) | 26 (61.9%) |
| 5 or more Children | 10 (100.0%) | 0 (0.0%) |
| Total | 37 (35.2%) | 89 (39.4%) |
Income Below Poverty Among Married-Couple vs Single-Parent Households in Coal County
The poverty data for Coal County shows that 96 of the married-couple family households (9.7%) and 126 of the single-parent households (38.1%) are living below the poverty level. Within the married-couple family households, those with 5 or more children have the highest poverty rate, with 7 households (41.2%) falling below the poverty line. Among the single-parent households, those with 5 or more children have the highest poverty rate, with 10 household (100.0%) living below poverty.
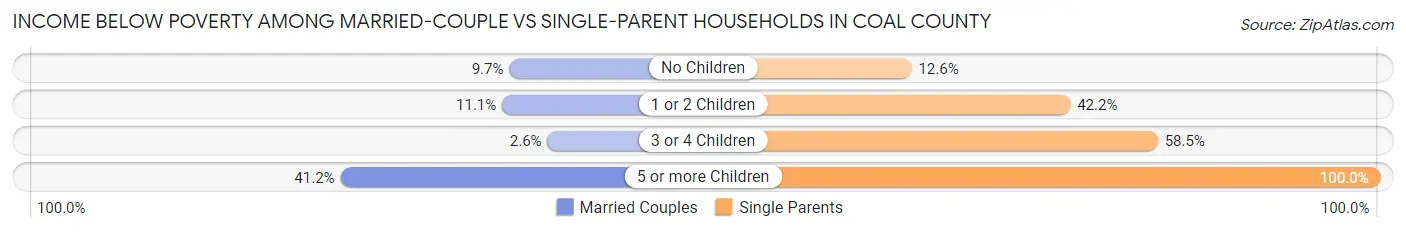
| Children | Married-Couple Families | Single-Parent Households |
| No Children | 62 (9.7%) | 12 (12.6%) |
| 1 or 2 Children | 24 (11.1%) | 73 (42.2%) |
| 3 or 4 Children | 3 (2.6%) | 31 (58.5%) |
| 5 or more Children | 7 (41.2%) | 10 (100.0%) |
| Total | 96 (9.7%) | 126 (38.1%) |
Race in Coal County
The most populous races in Coal County are White / Caucasian (3,543 | 67.0%), Two or more Races (1,187 | 22.5%), and Native / Alaskan (486 | 9.2%).
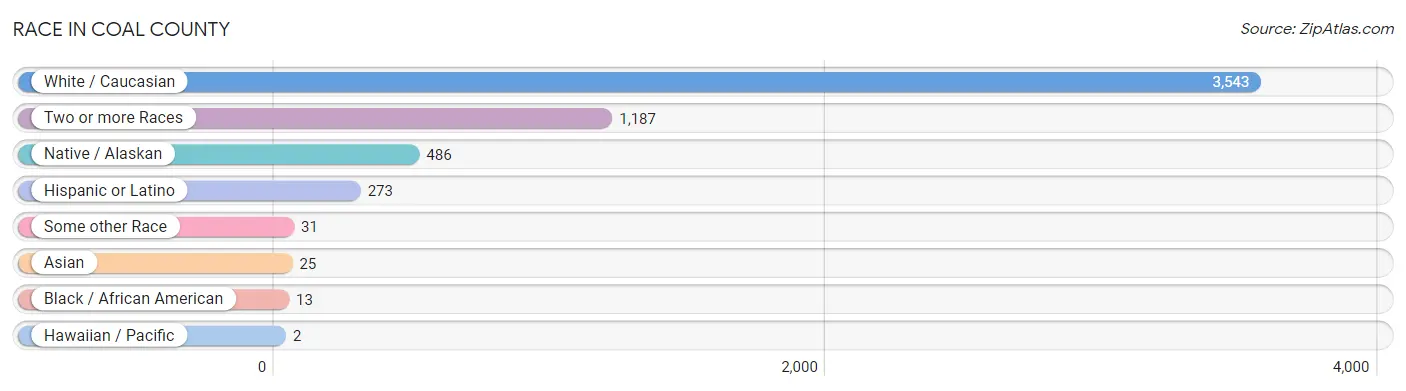
| Race | # Population | % Population |
| Asian | 25 | 0.5% |
| Black / African American | 13 | 0.3% |
| Hawaiian / Pacific | 2 | 0.0% |
| Hispanic or Latino | 273 | 5.2% |
| Native / Alaskan | 486 | 9.2% |
| White / Caucasian | 3,543 | 67.0% |
| Two or more Races | 1,187 | 22.5% |
| Some other Race | 31 | 0.6% |
| Total | 5,287 | 100.0% |
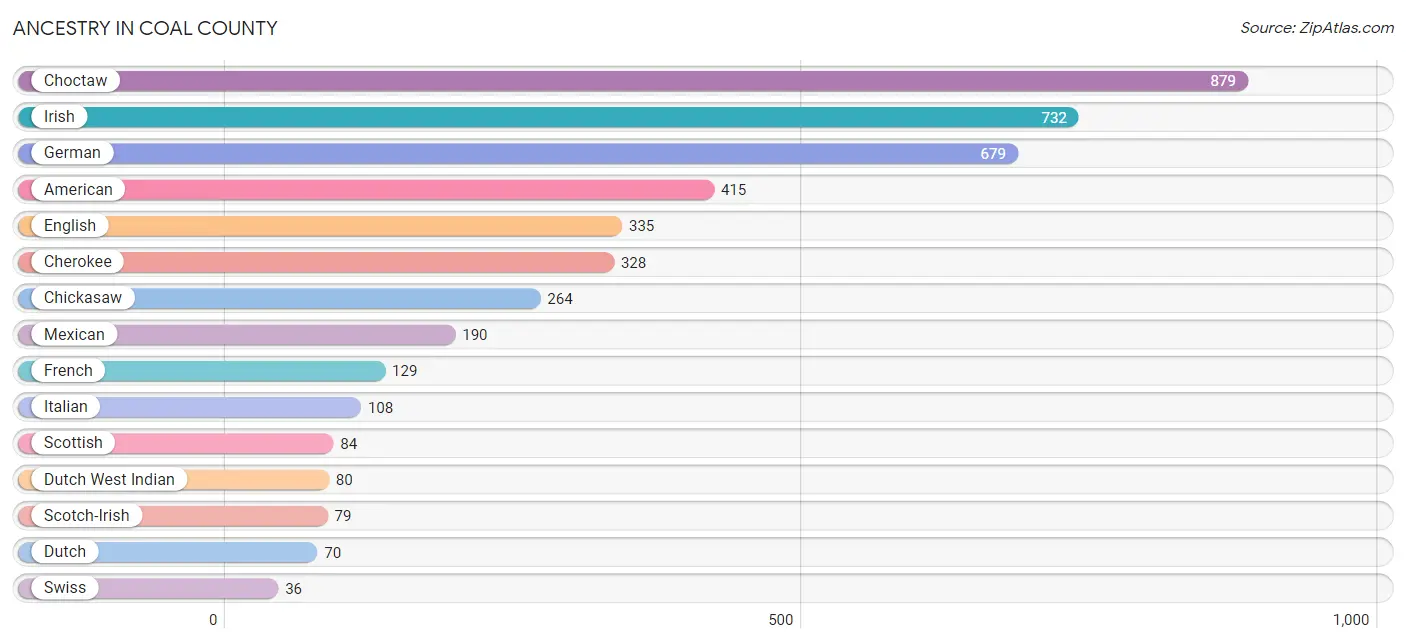
Ancestry in Coal County
The most populous ancestries reported in Coal County are Choctaw (879 | 16.6%), Irish (732 | 13.9%), German (679 | 12.8%), American (415 | 7.9%), and English (335 | 6.3%), together accounting for 57.5% of all Coal County residents.
| Ancestry | # Population | % Population |
| American | 415 | 7.9% |
| Apache | 16 | 0.3% |
| Bhutanese | 21 | 0.4% |
| Blackfeet | 22 | 0.4% |
| British | 11 | 0.2% |
| Burmese | 2 | 0.0% |
| Central American | 21 | 0.4% |
| Central American Indian | 3 | 0.1% |
| Cherokee | 328 | 6.2% |
| Chickasaw | 264 | 5.0% |
| Choctaw | 879 | 16.6% |
| Creek | 34 | 0.6% |
| Cuban | 13 | 0.3% |
| Czech | 12 | 0.2% |
| Czechoslovakian | 1 | 0.0% |
| Danish | 6 | 0.1% |
| Dutch | 70 | 1.3% |
| Dutch West Indian | 80 | 1.5% |
| Eastern European | 21 | 0.4% |
| English | 335 | 6.3% |
| Ethiopian | 2 | 0.0% |
| European | 3 | 0.1% |
| Fijian | 2 | 0.0% |
| French | 129 | 2.4% |
| French Canadian | 22 | 0.4% |
| German | 679 | 12.8% |
| Guatemalan | 3 | 0.1% |
| Irish | 732 | 13.9% |
| Italian | 108 | 2.0% |
| Japanese | 2 | 0.0% |
| Korean | 2 | 0.0% |
| Mexican | 190 | 3.6% |
| Navajo | 1 | 0.0% |
| Northern European | 4 | 0.1% |
| Norwegian | 26 | 0.5% |
| Pennsylvania German | 20 | 0.4% |
| Polish | 21 | 0.4% |
| Portuguese | 4 | 0.1% |
| Potawatomi | 22 | 0.4% |
| Puerto Rican | 35 | 0.7% |
| Russian | 19 | 0.4% |
| Salvadoran | 18 | 0.3% |
| Samoan | 2 | 0.0% |
| Scandinavian | 1 | 0.0% |
| Scotch-Irish | 79 | 1.5% |
| Scottish | 84 | 1.6% |
| Seminole | 28 | 0.5% |
| Sioux | 1 | 0.0% |
| Slovak | 15 | 0.3% |
| Somali | 2 | 0.0% |
| Spanish | 10 | 0.2% |
| Sri Lankan | 13 | 0.3% |
| Subsaharan African | 8 | 0.2% |
| Swedish | 33 | 0.6% |
| Swiss | 36 | 0.7% |
| Tongan | 26 | 0.5% |
| Ukrainian | 7 | 0.1% |
| Welsh | 23 | 0.4% | View All 58 Rows |
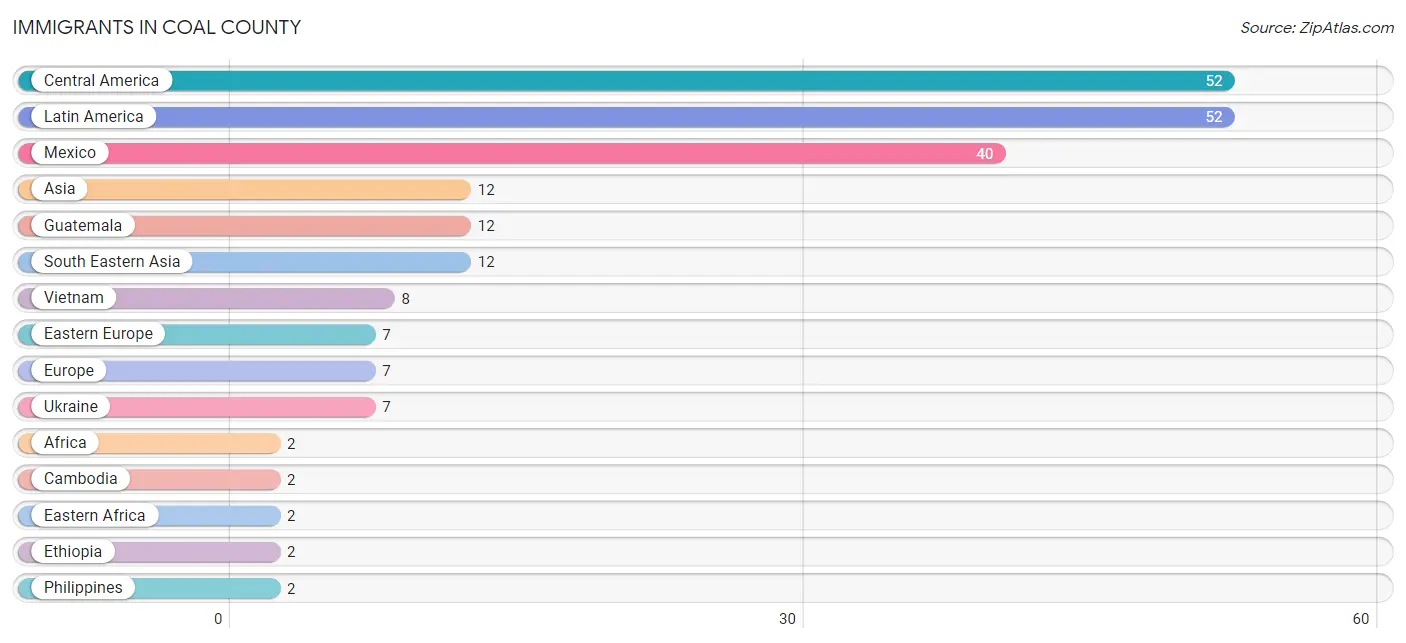
Immigrants in Coal County
The most numerous immigrant groups reported in Coal County came from Central America (52 | 1.0%), Latin America (52 | 1.0%), Mexico (40 | 0.8%), Asia (12 | 0.2%), and Guatemala (12 | 0.2%), together accounting for 3.2% of all Coal County residents.
| Immigration Origin | # Population | % Population |
| Africa | 2 | 0.0% |
| Asia | 12 | 0.2% |
| Cambodia | 2 | 0.0% |
| Central America | 52 | 1.0% |
| Eastern Africa | 2 | 0.0% |
| Eastern Europe | 7 | 0.1% |
| Ethiopia | 2 | 0.0% |
| Europe | 7 | 0.1% |
| Guatemala | 12 | 0.2% |
| Latin America | 52 | 1.0% |
| Mexico | 40 | 0.8% |
| Philippines | 2 | 0.0% |
| South Eastern Asia | 12 | 0.2% |
| Ukraine | 7 | 0.1% |
| Vietnam | 8 | 0.2% | View All 15 Rows |
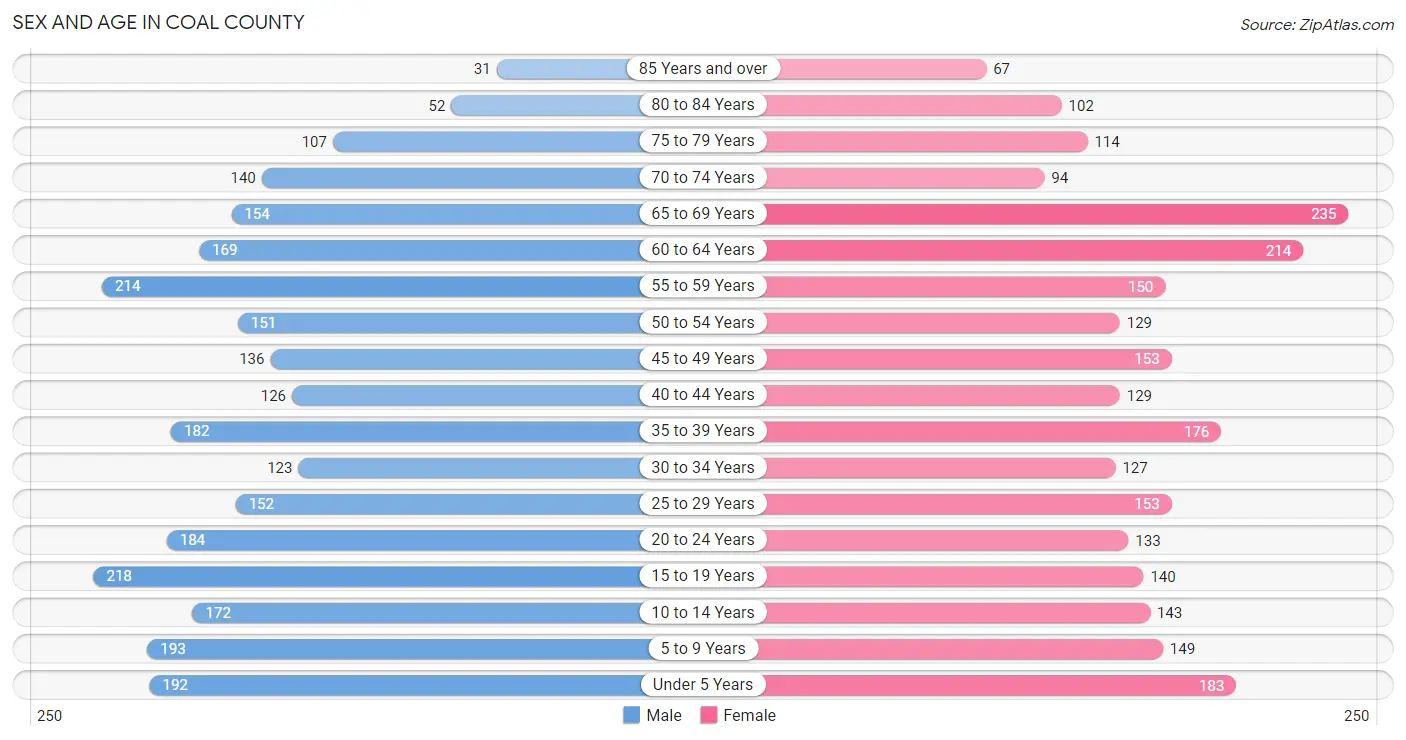
Sex and Age in Coal County
Sex and Age in Coal County
The most populous age groups in Coal County are 15 to 19 Years (218 | 8.1%) for men and 65 to 69 Years (235 | 9.1%) for women.
| Age Bracket | Male | Female |
| Under 5 Years | 192 (7.1%) | 183 (7.1%) |
| 5 to 9 Years | 193 (7.2%) | 149 (5.8%) |
| 10 to 14 Years | 172 (6.4%) | 143 (5.5%) |
| 15 to 19 Years | 218 (8.1%) | 140 (5.4%) |
| 20 to 24 Years | 184 (6.8%) | 133 (5.1%) |
| 25 to 29 Years | 152 (5.6%) | 153 (5.9%) |
| 30 to 34 Years | 123 (4.6%) | 127 (4.9%) |
| 35 to 39 Years | 182 (6.8%) | 176 (6.8%) |
| 40 to 44 Years | 126 (4.7%) | 129 (5.0%) |
| 45 to 49 Years | 136 (5.0%) | 153 (5.9%) |
| 50 to 54 Years | 151 (5.6%) | 129 (5.0%) |
| 55 to 59 Years | 214 (7.9%) | 150 (5.8%) |
| 60 to 64 Years | 169 (6.3%) | 214 (8.3%) |
| 65 to 69 Years | 154 (5.7%) | 235 (9.1%) |
| 70 to 74 Years | 140 (5.2%) | 94 (3.6%) |
| 75 to 79 Years | 107 (4.0%) | 114 (4.4%) |
| 80 to 84 Years | 52 (1.9%) | 102 (3.9%) |
| 85 Years and over | 31 (1.1%) | 67 (2.6%) |
| Total | 2,696 (100.0%) | 2,591 (100.0%) |
Families and Households in Coal County
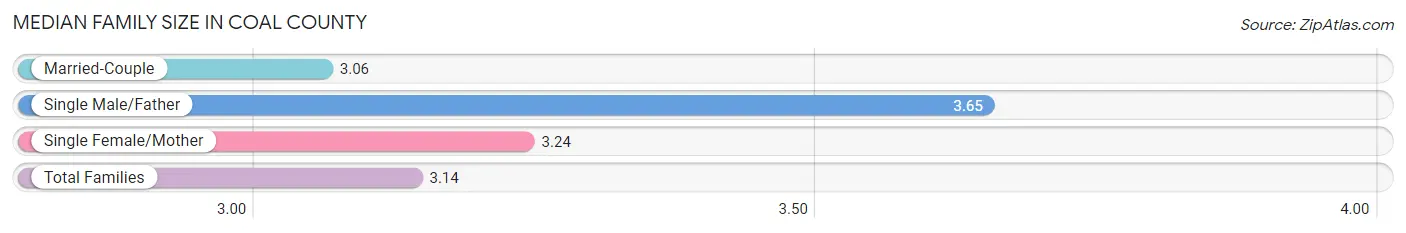
Median Family Size in Coal County
The median family size in Coal County is 3.14 persons per family, with single male/father families (105 | 8.0%) accounting for the largest median family size of 3.65 persons per family. On the other hand, married-couple families (987 | 74.9%) represent the smallest median family size with 3.06 persons per family.
| Family Type | # Families | Family Size |
| Married-Couple | 987 (74.9%) | 3.06 |
| Single Male/Father | 105 (8.0%) | 3.65 |
| Single Female/Mother | 226 (17.2%) | 3.24 |
| Total Families | 1,318 (100.0%) | 3.14 |
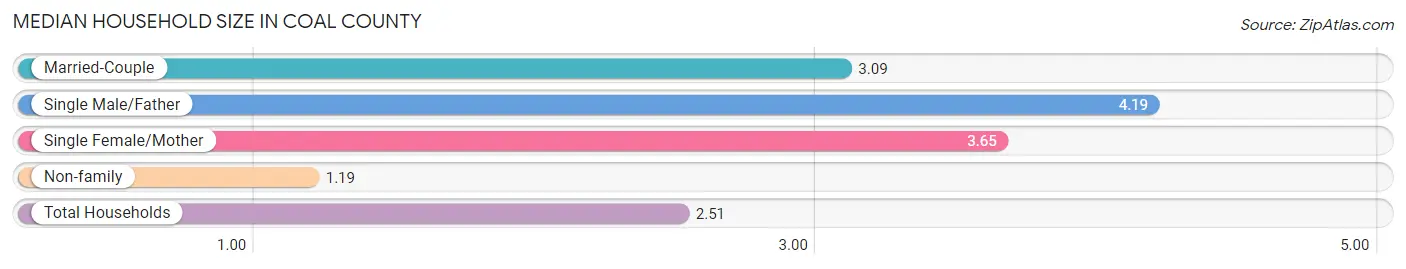
Median Household Size in Coal County
The median household size in Coal County is 2.51 persons per household, with single male/father households (105 | 5.0%) accounting for the largest median household size of 4.19 persons per household. non-family households (765 | 36.7%) represent the smallest median household size with 1.19 persons per household.
| Household Type | # Households | Household Size |
| Married-Couple | 987 (47.4%) | 3.09 |
| Single Male/Father | 105 (5.0%) | 4.19 |
| Single Female/Mother | 226 (10.8%) | 3.65 |
| Non-family | 765 (36.7%) | 1.19 |
| Total Households | 2,083 (100.0%) | 2.51 |
Household Size by Marriage Status in Coal County
Out of a total of 2,083 households in Coal County, 1,318 (63.3%) are family households, while 765 (36.7%) are nonfamily households. The most numerous type of family households are 2-person households, comprising 649, and the most common type of nonfamily households are 1-person households, comprising 690.
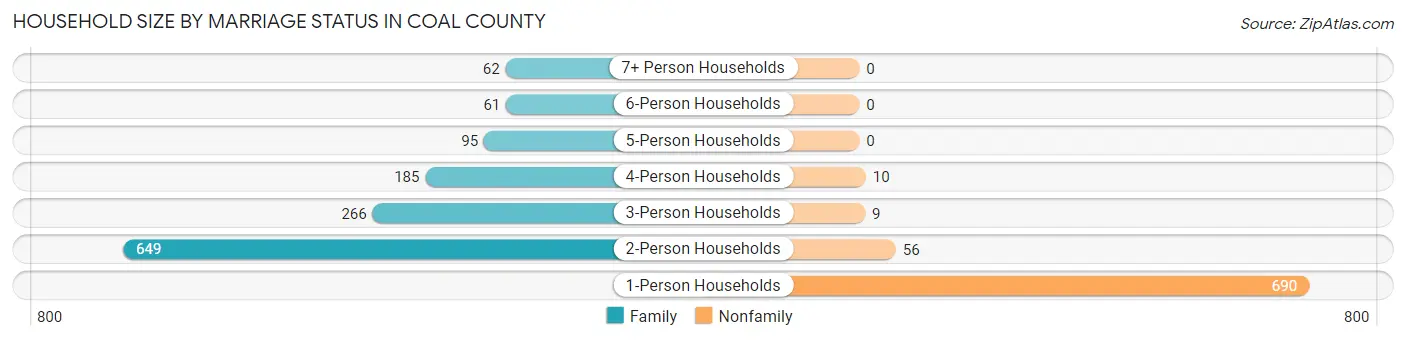
| Household Size | Family Households | Nonfamily Households |
| 1-Person Households | - | 690 (33.1%) |
| 2-Person Households | 649 (31.2%) | 56 (2.7%) |
| 3-Person Households | 266 (12.8%) | 9 (0.4%) |
| 4-Person Households | 185 (8.9%) | 10 (0.5%) |
| 5-Person Households | 95 (4.6%) | 0 (0.0%) |
| 6-Person Households | 61 (2.9%) | 0 (0.0%) |
| 7+ Person Households | 62 (3.0%) | 0 (0.0%) |
| Total | 1,318 (63.3%) | 765 (36.7%) |
Female Fertility in Coal County
Fertility by Age in Coal County
Average fertility rate in Coal County is 91.0 births per 1,000 women. Women in the age bracket of 20 to 34 years have the highest fertility rate with 206.0 births per 1,000 women. Women in the age bracket of 20 to 34 years acount for 90.4% of all women with births.
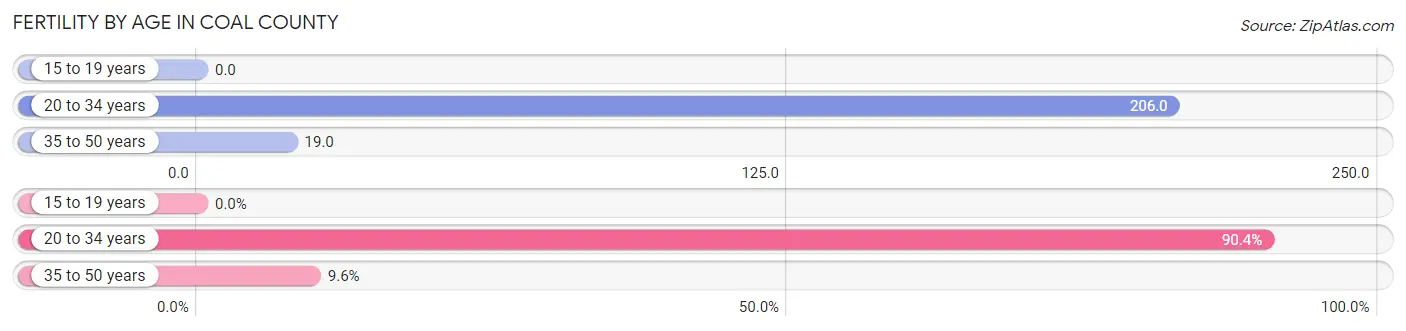
| Age Bracket | Women with Births | Births / 1,000 Women |
| 15 to 19 years | 0 (0.0%) | 0.0 |
| 20 to 34 years | 85 (90.4%) | 206.0 |
| 35 to 50 years | 9 (9.6%) | 19.0 |
| Total | 94 (100.0%) | 91.0 |
Fertility by Age by Marriage Status in Coal County
60.6% of women with births (94) in Coal County are married. The highest percentage of unmarried women with births falls into 20 to 34 years age bracket with 40.0% of them unmarried at the time of birth, while the lowest percentage of unmarried women with births belong to 35 to 50 years age bracket with 33.3% of them unmarried.
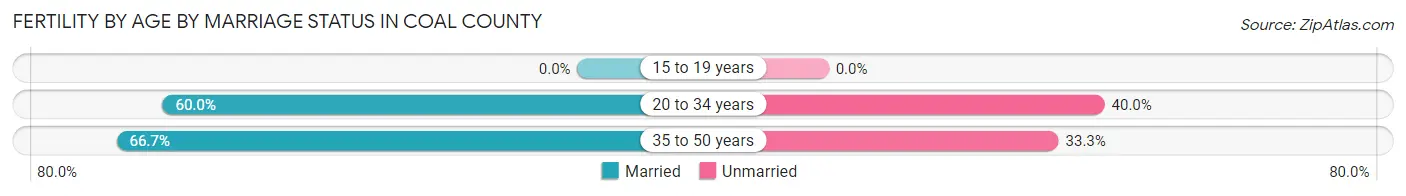
| Age Bracket | Married | Unmarried |
| 15 to 19 years | 0 (0.0%) | 0 (0.0%) |
| 20 to 34 years | 51 (60.0%) | 34 (40.0%) |
| 35 to 50 years | 6 (66.7%) | 3 (33.3%) |
| Total | 57 (60.6%) | 37 (39.4%) |
Fertility by Education in Coal County
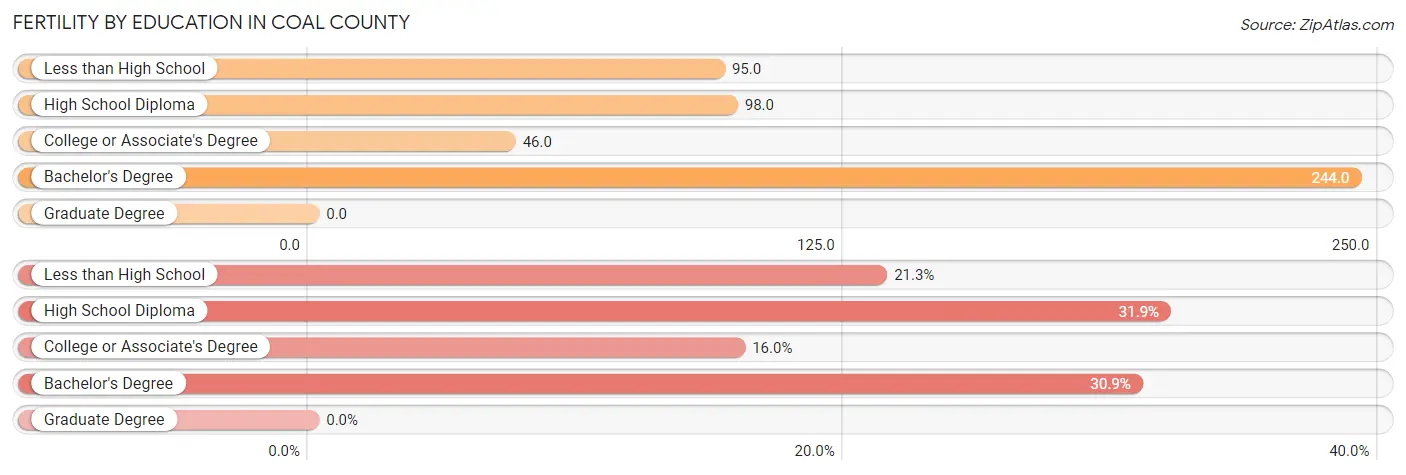
| Educational Attainment | Women with Births | Births / 1,000 Women |
| Less than High School | 20 (21.3%) | 95.0 |
| High School Diploma | 30 (31.9%) | 98.0 |
| College or Associate's Degree | 15 (16.0%) | 46.0 |
| Bachelor's Degree | 29 (30.8%) | 244.0 |
| Graduate Degree | 0 (0.0%) | 0.0 |
| Total | 94 (100.0%) | 91.0 |
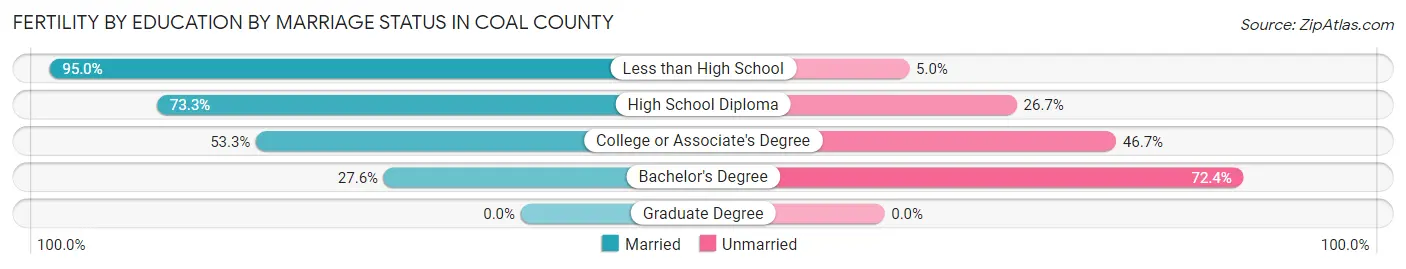
Fertility by Education by Marriage Status in Coal County
39.4% of women with births in Coal County are unmarried. Women with the educational attainment of less than high school are most likely to be married with 95.0% of them married at childbirth, while women with the educational attainment of bachelor's degree are least likely to be married with 72.4% of them unmarried at childbirth.
| Educational Attainment | Married | Unmarried |
| Less than High School | 19 (95.0%) | 1 (5.0%) |
| High School Diploma | 22 (73.3%) | 8 (26.7%) |
| College or Associate's Degree | 8 (53.3%) | 7 (46.7%) |
| Bachelor's Degree | 8 (27.6%) | 21 (72.4%) |
| Graduate Degree | 0 (0.0%) | 0 (0.0%) |
| Total | 57 (60.6%) | 37 (39.4%) |
Employment Characteristics in Coal County
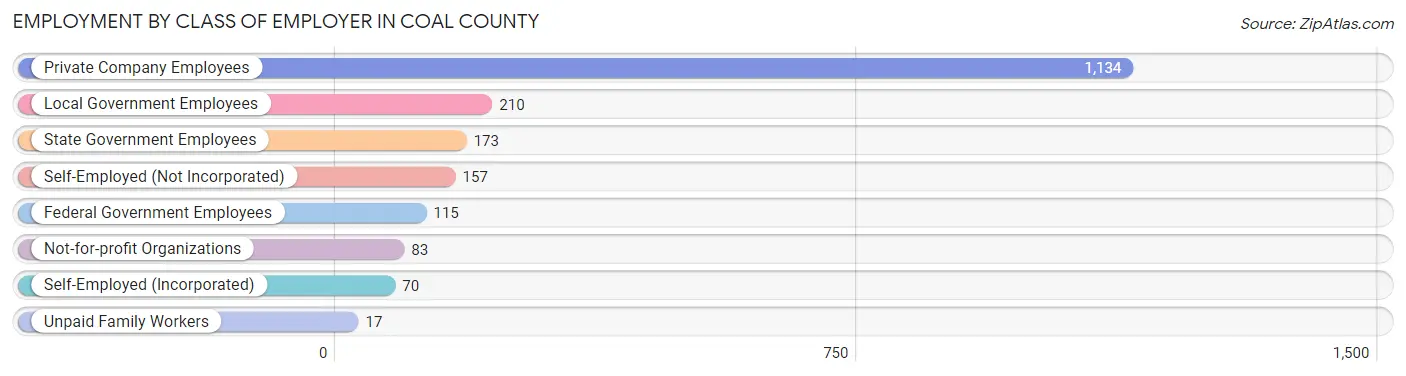
Employment by Class of Employer in Coal County
Among the 1,959 employed individuals in Coal County, private company employees (1,134 | 57.9%), local government employees (210 | 10.7%), and state government employees (173 | 8.8%) make up the most common classes of employment.
| Employer Class | # Employees | % Employees |
| Private Company Employees | 1,134 | 57.9% |
| Self-Employed (Incorporated) | 70 | 3.6% |
| Self-Employed (Not Incorporated) | 157 | 8.0% |
| Not-for-profit Organizations | 83 | 4.2% |
| Local Government Employees | 210 | 10.7% |
| State Government Employees | 173 | 8.8% |
| Federal Government Employees | 115 | 5.9% |
| Unpaid Family Workers | 17 | 0.9% |
| Total | 1,959 | 100.0% |
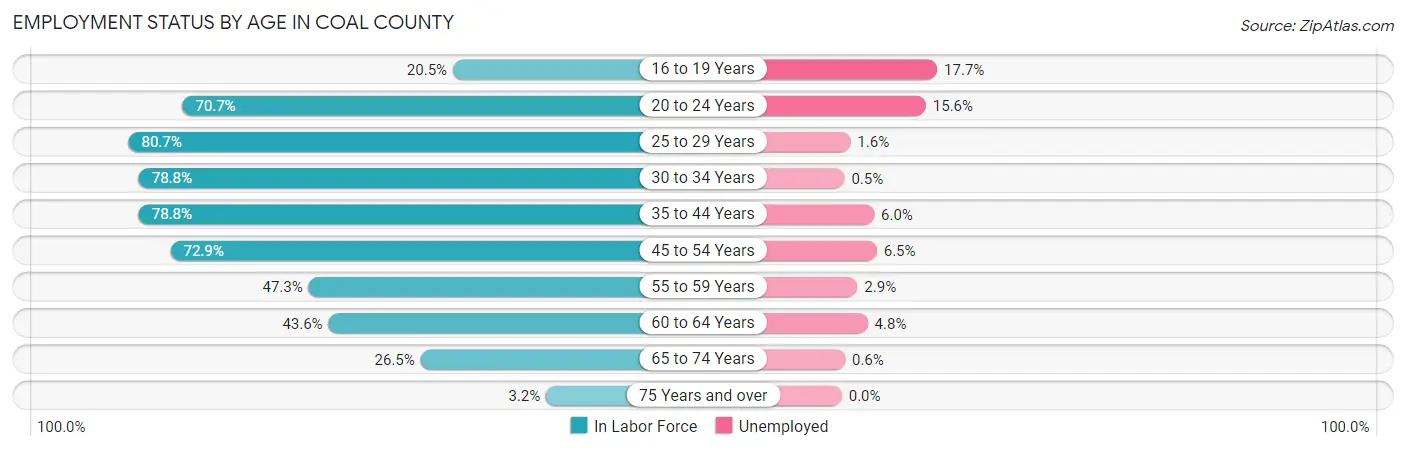
Employment Status by Age in Coal County
According to the labor force statistics for Coal County, out of the total population over 16 years of age (4,199), 51.1% or 2,146 individuals are in the labor force, with 5.6% or 120 of them unemployed. The age group with the highest labor force participation rate is 25 to 29 years, with 80.7% or 246 individuals in the labor force. Within the labor force, the 16 to 19 years age range has the highest percentage of unemployed individuals, with 17.7% or 11 of them being unemployed.
| Age Bracket | In Labor Force | Unemployed |
| 16 to 19 Years | 62 (20.5%) | 11 (17.7%) |
| 20 to 24 Years | 224 (70.7%) | 35 (15.6%) |
| 25 to 29 Years | 246 (80.7%) | 4 (1.6%) |
| 30 to 34 Years | 197 (78.8%) | 1 (0.5%) |
| 35 to 44 Years | 483 (78.8%) | 29 (6.0%) |
| 45 to 54 Years | 415 (72.9%) | 27 (6.5%) |
| 55 to 59 Years | 172 (47.3%) | 5 (2.9%) |
| 60 to 64 Years | 167 (43.6%) | 8 (4.8%) |
| 65 to 74 Years | 165 (26.5%) | 1 (0.6%) |
| 75 Years and over | 15 (3.2%) | 0 (0.0%) |
| Total | 2,146 (51.1%) | 120 (5.6%) |
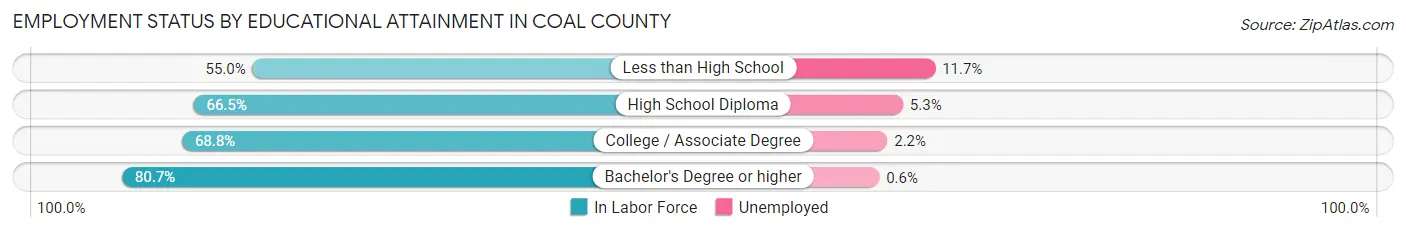
Employment Status by Educational Attainment in Coal County
According to labor force statistics for Coal County, 67.6% of individuals (1,679) out of the total population between 25 and 64 years of age (2,484) are in the labor force, with 4.4% or 74 of them being unemployed. The group with the highest labor force participation rate are those with the educational attainment of bachelor's degree or higher, with 80.7% or 343 individuals in the labor force. Within the labor force, individuals with less than high school education have the highest percentage of unemployment, with 11.7% or 26 of them being unemployed.
| Educational Attainment | In Labor Force | Unemployed |
| Less than High School | 222 (55.0%) | 47 (11.7%) |
| High School Diploma | 704 (66.5%) | 56 (5.3%) |
| College / Associate Degree | 411 (68.8%) | 13 (2.2%) |
| Bachelor's Degree or higher | 343 (80.7%) | 3 (0.6%) |
| Total | 1,679 (67.6%) | 109 (4.4%) |
Employment Occupations by Sex in Coal County
Management, Business, Science and Arts Occupations
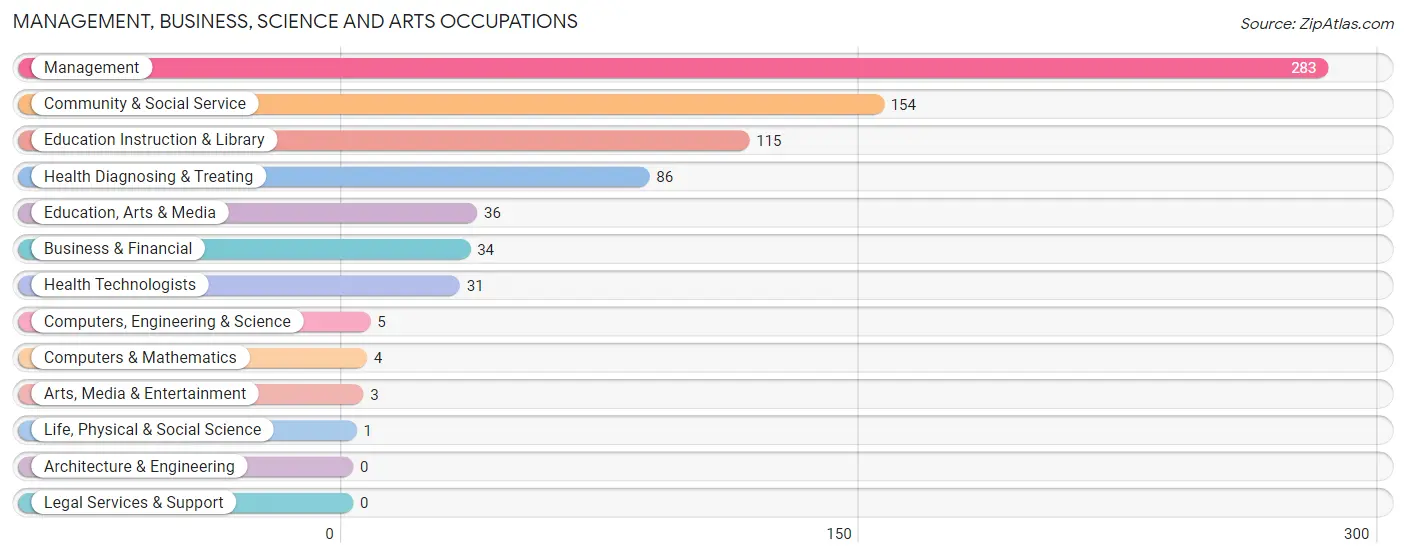
The most common Management, Business, Science and Arts occupations in Coal County are Management (283 | 14.0%), Community & Social Service (154 | 7.6%), Education Instruction & Library (115 | 5.7%), Health Diagnosing & Treating (86 | 4.3%), and Education, Arts & Media (36 | 1.8%).
Management, Business, Science and Arts Occupations by Sex
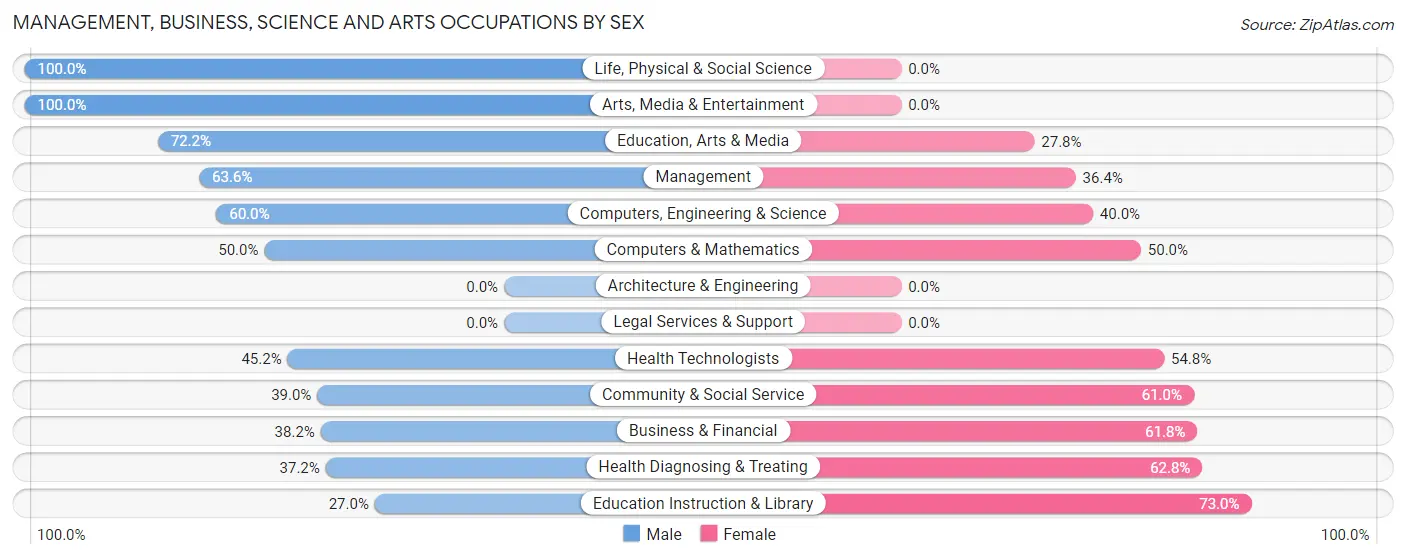
Within the Management, Business, Science and Arts occupations in Coal County, the most male-oriented occupations are Life, Physical & Social Science (100.0%), Arts, Media & Entertainment (100.0%), and Education, Arts & Media (72.2%), while the most female-oriented occupations are Education Instruction & Library (73.0%), Health Diagnosing & Treating (62.8%), and Business & Financial (61.8%).
| Occupation | Male | Female |
| Management | 180 (63.6%) | 103 (36.4%) |
| Business & Financial | 13 (38.2%) | 21 (61.8%) |
| Computers, Engineering & Science | 3 (60.0%) | 2 (40.0%) |
| Computers & Mathematics | 2 (50.0%) | 2 (50.0%) |
| Architecture & Engineering | 0 (0.0%) | 0 (0.0%) |
| Life, Physical & Social Science | 1 (100.0%) | 0 (0.0%) |
| Community & Social Service | 60 (39.0%) | 94 (61.0%) |
| Education, Arts & Media | 26 (72.2%) | 10 (27.8%) |
| Legal Services & Support | 0 (0.0%) | 0 (0.0%) |
| Education Instruction & Library | 31 (27.0%) | 84 (73.0%) |
| Arts, Media & Entertainment | 3 (100.0%) | 0 (0.0%) |
| Health Diagnosing & Treating | 32 (37.2%) | 54 (62.8%) |
| Health Technologists | 14 (45.2%) | 17 (54.8%) |
| Total (Category) | 288 (51.2%) | 274 (48.7%) |
| Total (Overall) | 1,117 (55.2%) | 908 (44.8%) |
Services Occupations
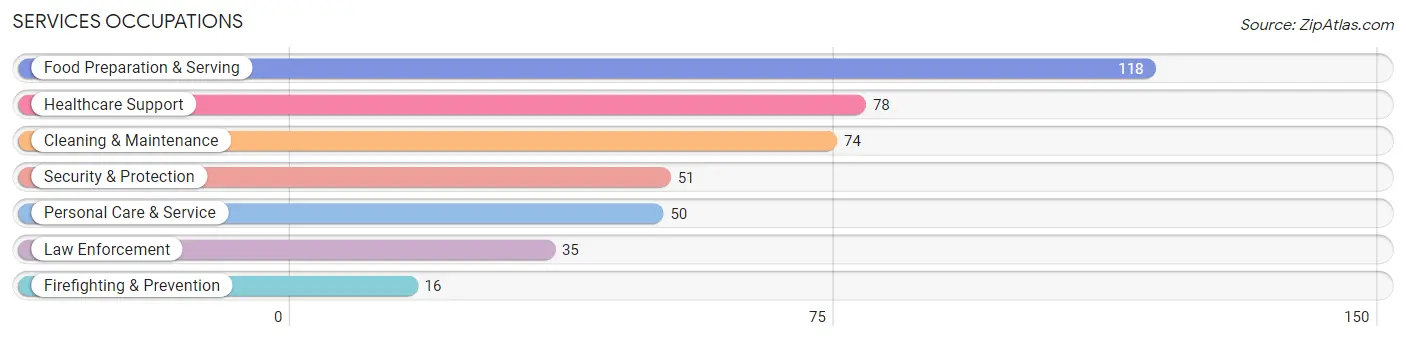
The most common Services occupations in Coal County are Food Preparation & Serving (118 | 5.8%), Healthcare Support (78 | 3.8%), Cleaning & Maintenance (74 | 3.6%), Security & Protection (51 | 2.5%), and Personal Care & Service (50 | 2.5%).
Services Occupations by Sex
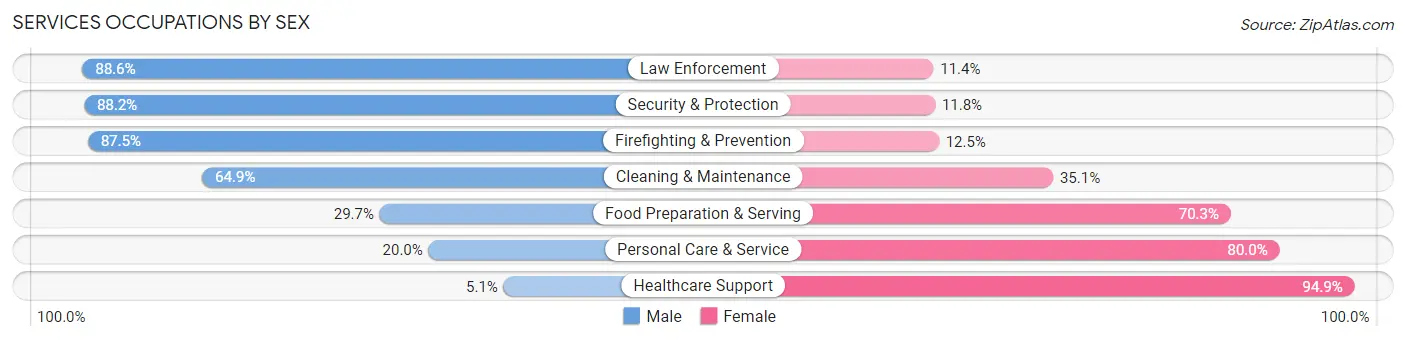
Within the Services occupations in Coal County, the most male-oriented occupations are Law Enforcement (88.6%), Security & Protection (88.2%), and Firefighting & Prevention (87.5%), while the most female-oriented occupations are Healthcare Support (94.9%), Personal Care & Service (80.0%), and Food Preparation & Serving (70.3%).
| Occupation | Male | Female |
| Healthcare Support | 4 (5.1%) | 74 (94.9%) |
| Security & Protection | 45 (88.2%) | 6 (11.8%) |
| Firefighting & Prevention | 14 (87.5%) | 2 (12.5%) |
| Law Enforcement | 31 (88.6%) | 4 (11.4%) |
| Food Preparation & Serving | 35 (29.7%) | 83 (70.3%) |
| Cleaning & Maintenance | 48 (64.9%) | 26 (35.1%) |
| Personal Care & Service | 10 (20.0%) | 40 (80.0%) |
| Total (Category) | 142 (38.3%) | 229 (61.7%) |
| Total (Overall) | 1,117 (55.2%) | 908 (44.8%) |
Sales and Office Occupations
The most common Sales and Office occupations in Coal County are Office & Administration (260 | 12.8%), and Sales & Related (137 | 6.8%).

Sales and Office Occupations by Sex
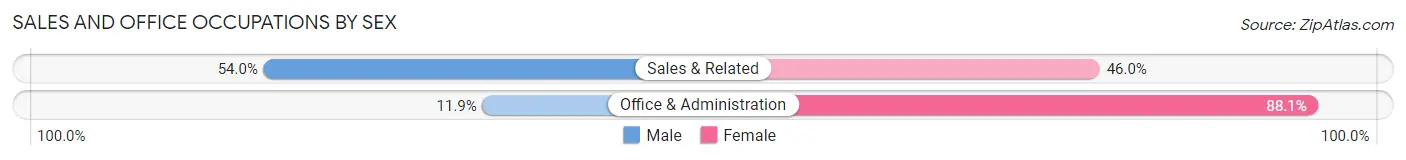
| Occupation | Male | Female |
| Sales & Related | 74 (54.0%) | 63 (46.0%) |
| Office & Administration | 31 (11.9%) | 229 (88.1%) |
| Total (Category) | 105 (26.5%) | 292 (73.6%) |
| Total (Overall) | 1,117 (55.2%) | 908 (44.8%) |
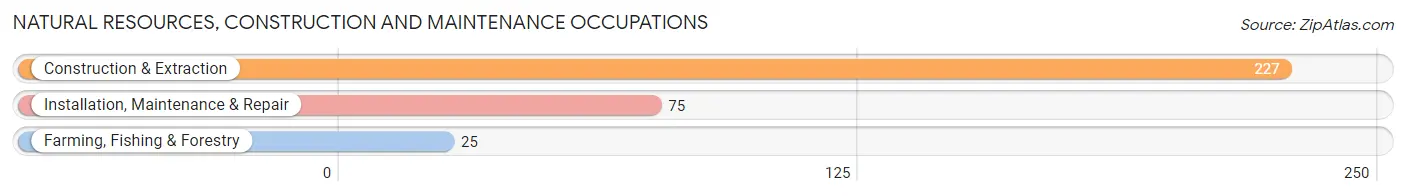
Natural Resources, Construction and Maintenance Occupations
The most common Natural Resources, Construction and Maintenance occupations in Coal County are Construction & Extraction (227 | 11.2%), Installation, Maintenance & Repair (75 | 3.7%), and Farming, Fishing & Forestry (25 | 1.2%).
Natural Resources, Construction and Maintenance Occupations by Sex
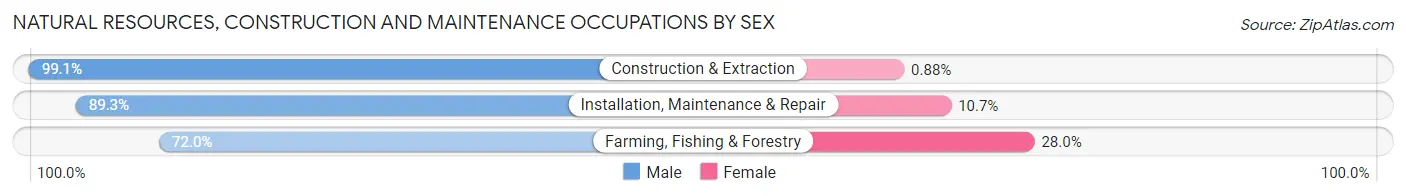
| Occupation | Male | Female |
| Farming, Fishing & Forestry | 18 (72.0%) | 7 (28.0%) |
| Construction & Extraction | 225 (99.1%) | 2 (0.9%) |
| Installation, Maintenance & Repair | 67 (89.3%) | 8 (10.7%) |
| Total (Category) | 310 (94.8%) | 17 (5.2%) |
| Total (Overall) | 1,117 (55.2%) | 908 (44.8%) |
Production, Transportation and Moving Occupations
The most common Production, Transportation and Moving occupations in Coal County are Production (200 | 9.9%), Transportation (87 | 4.3%), and Material Moving (81 | 4.0%).
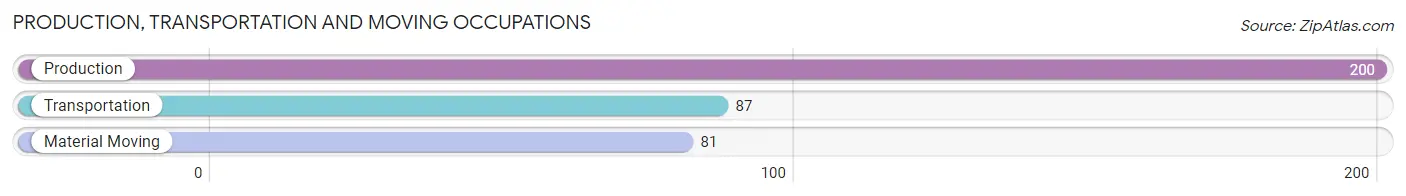
Production, Transportation and Moving Occupations by Sex
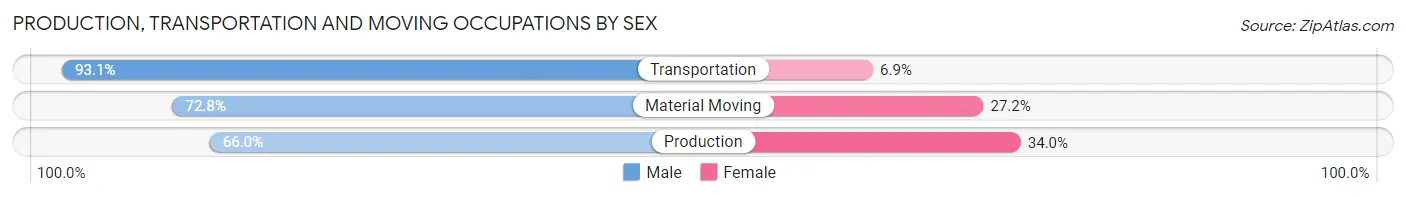
| Occupation | Male | Female |
| Production | 132 (66.0%) | 68 (34.0%) |
| Transportation | 81 (93.1%) | 6 (6.9%) |
| Material Moving | 59 (72.8%) | 22 (27.2%) |
| Total (Category) | 272 (73.9%) | 96 (26.1%) |
| Total (Overall) | 1,117 (55.2%) | 908 (44.8%) |
Employment Industries by Sex in Coal County
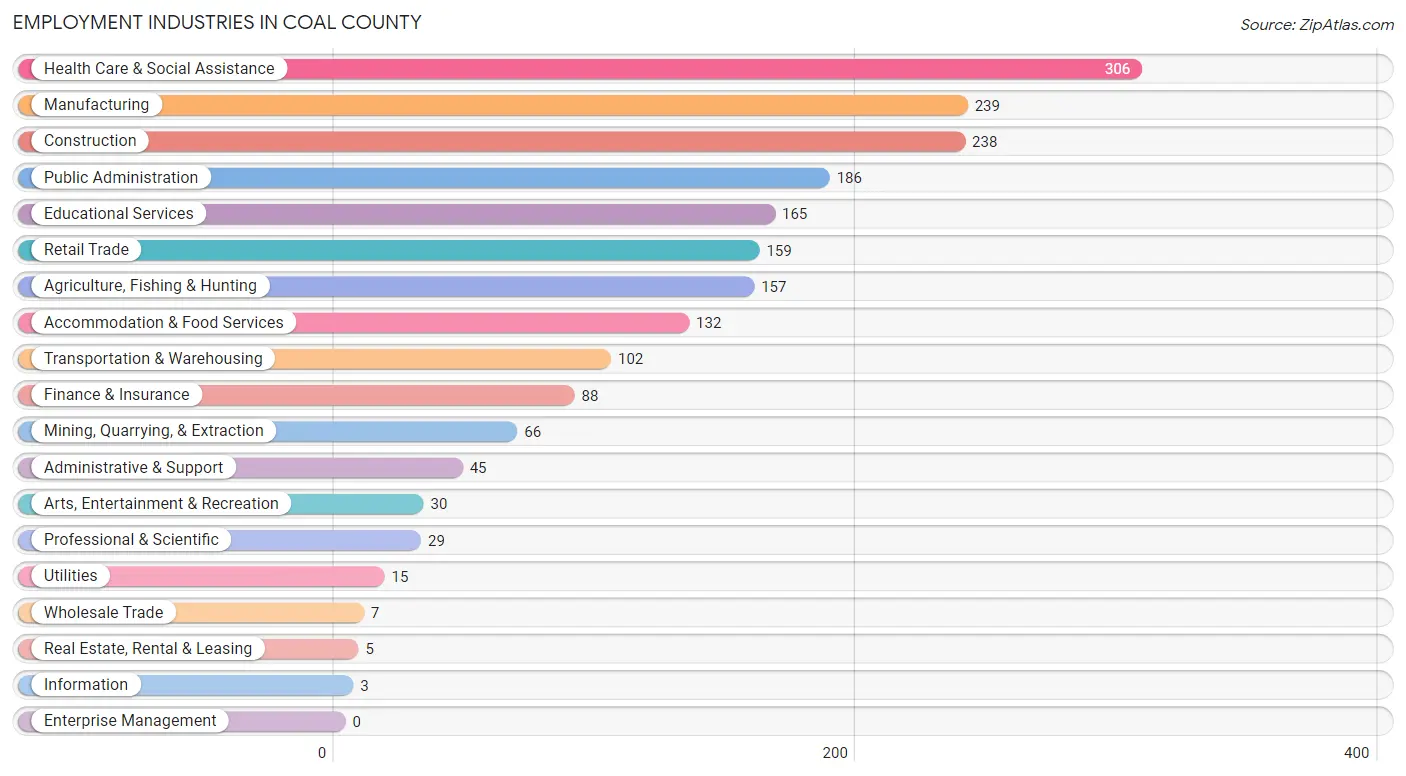
Employment Industries in Coal County
The major employment industries in Coal County include Health Care & Social Assistance (306 | 15.1%), Manufacturing (239 | 11.8%), Construction (238 | 11.7%), Public Administration (186 | 9.2%), and Educational Services (165 | 8.2%).
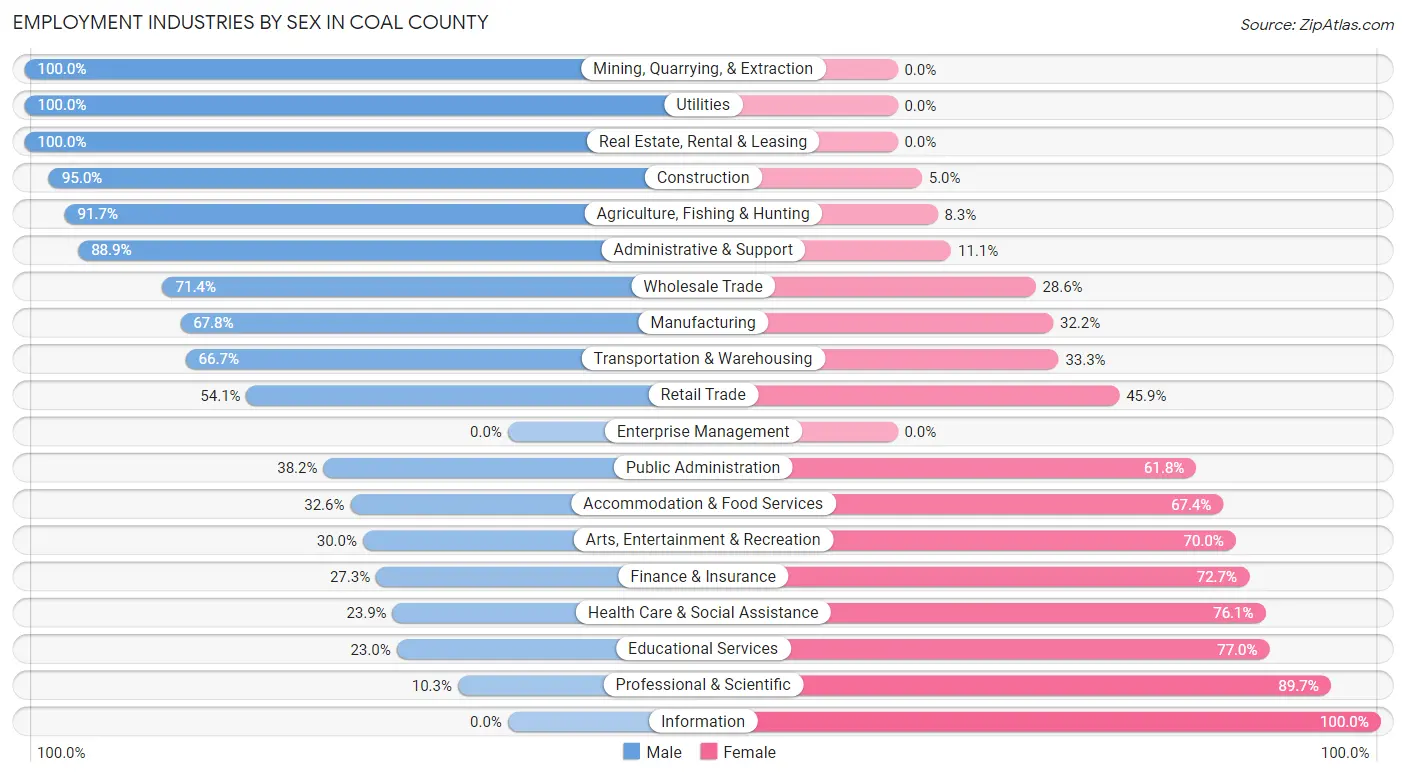
Employment Industries by Sex in Coal County
The Coal County industries that see more men than women are Mining, Quarrying, & Extraction (100.0%), Utilities (100.0%), and Real Estate, Rental & Leasing (100.0%), whereas the industries that tend to have a higher number of women are Information (100.0%), Professional & Scientific (89.7%), and Educational Services (77.0%).
| Industry | Male | Female |
| Agriculture, Fishing & Hunting | 144 (91.7%) | 13 (8.3%) |
| Mining, Quarrying, & Extraction | 66 (100.0%) | 0 (0.0%) |
| Construction | 226 (95.0%) | 12 (5.0%) |
| Manufacturing | 162 (67.8%) | 77 (32.2%) |
| Wholesale Trade | 5 (71.4%) | 2 (28.6%) |
| Retail Trade | 86 (54.1%) | 73 (45.9%) |
| Transportation & Warehousing | 68 (66.7%) | 34 (33.3%) |
| Utilities | 15 (100.0%) | 0 (0.0%) |
| Information | 0 (0.0%) | 3 (100.0%) |
| Finance & Insurance | 24 (27.3%) | 64 (72.7%) |
| Real Estate, Rental & Leasing | 5 (100.0%) | 0 (0.0%) |
| Professional & Scientific | 3 (10.3%) | 26 (89.7%) |
| Enterprise Management | 0 (0.0%) | 0 (0.0%) |
| Administrative & Support | 40 (88.9%) | 5 (11.1%) |
| Educational Services | 38 (23.0%) | 127 (77.0%) |
| Health Care & Social Assistance | 73 (23.9%) | 233 (76.1%) |
| Arts, Entertainment & Recreation | 9 (30.0%) | 21 (70.0%) |
| Accommodation & Food Services | 43 (32.6%) | 89 (67.4%) |
| Public Administration | 71 (38.2%) | 115 (61.8%) |
| Total | 1,117 (55.2%) | 908 (44.8%) |
Education in Coal County
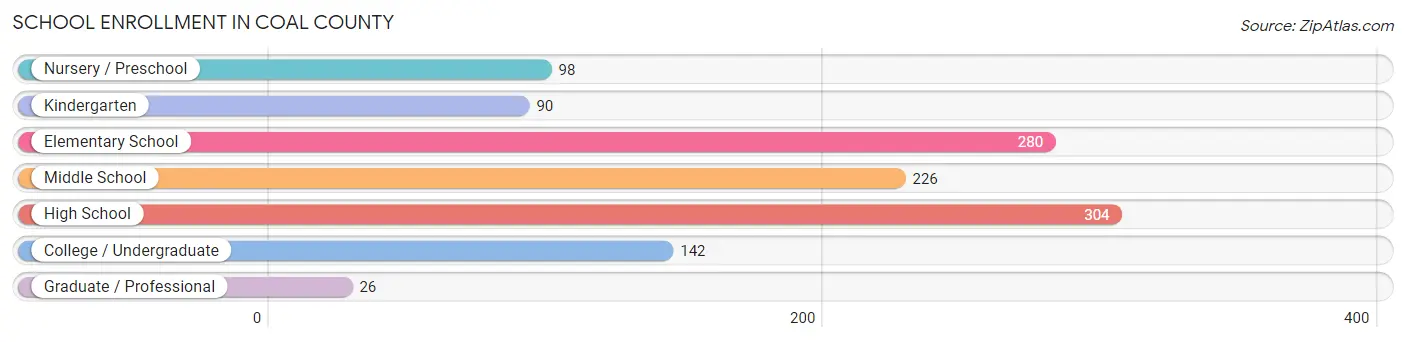
School Enrollment in Coal County
The most common levels of schooling among the 1,166 students in Coal County are high school (304 | 26.1%), elementary school (280 | 24.0%), and middle school (226 | 19.4%).
| School Level | # Students | % Students |
| Nursery / Preschool | 98 | 8.4% |
| Kindergarten | 90 | 7.7% |
| Elementary School | 280 | 24.0% |
| Middle School | 226 | 19.4% |
| High School | 304 | 26.1% |
| College / Undergraduate | 142 | 12.2% |
| Graduate / Professional | 26 | 2.2% |
| Total | 1,166 | 100.0% |
School Enrollment by Age by Funding Source in Coal County
Out of a total of 1,166 students who are enrolled in schools in Coal County, 100 (8.6%) attend a private institution, while the remaining 1,066 (91.4%) are enrolled in public schools. The age group of 5 to 9 year old has the highest likelihood of being enrolled in private schools, with 52 (15.6% in the age bracket) enrolled. Conversely, the age group of 18 to 19 year olds has the lowest likelihood of being enrolled in a private school, with 65 (100.0% in the age bracket) attending a public institution.
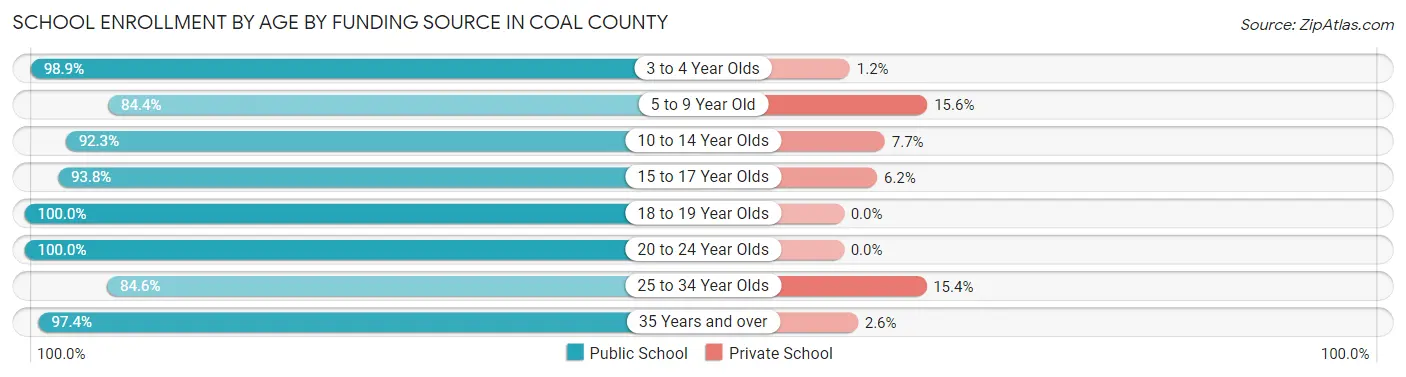
| Age Bracket | Public School | Private School |
| 3 to 4 Year Olds | 86 (98.9%) | 1 (1.1%) |
| 5 to 9 Year Old | 282 (84.4%) | 52 (15.6%) |
| 10 to 14 Year Olds | 277 (92.3%) | 23 (7.7%) |
| 15 to 17 Year Olds | 226 (93.8%) | 15 (6.2%) |
| 18 to 19 Year Olds | 65 (100.0%) | 0 (0.0%) |
| 20 to 24 Year Olds | 49 (100.0%) | 0 (0.0%) |
| 25 to 34 Year Olds | 44 (84.6%) | 8 (15.4%) |
| 35 Years and over | 37 (97.4%) | 1 (2.6%) |
| Total | 1,066 (91.4%) | 100 (8.6%) |
Educational Attainment by Field of Study in Coal County
Education (167 | 26.3%), business (165 | 26.0%), bio, nature & agricultural (81 | 12.8%), science & technology (61 | 9.6%), and arts & humanities (52 | 8.2%) are the most common fields of study among 635 individuals in Coal County who have obtained a bachelor's degree or higher.
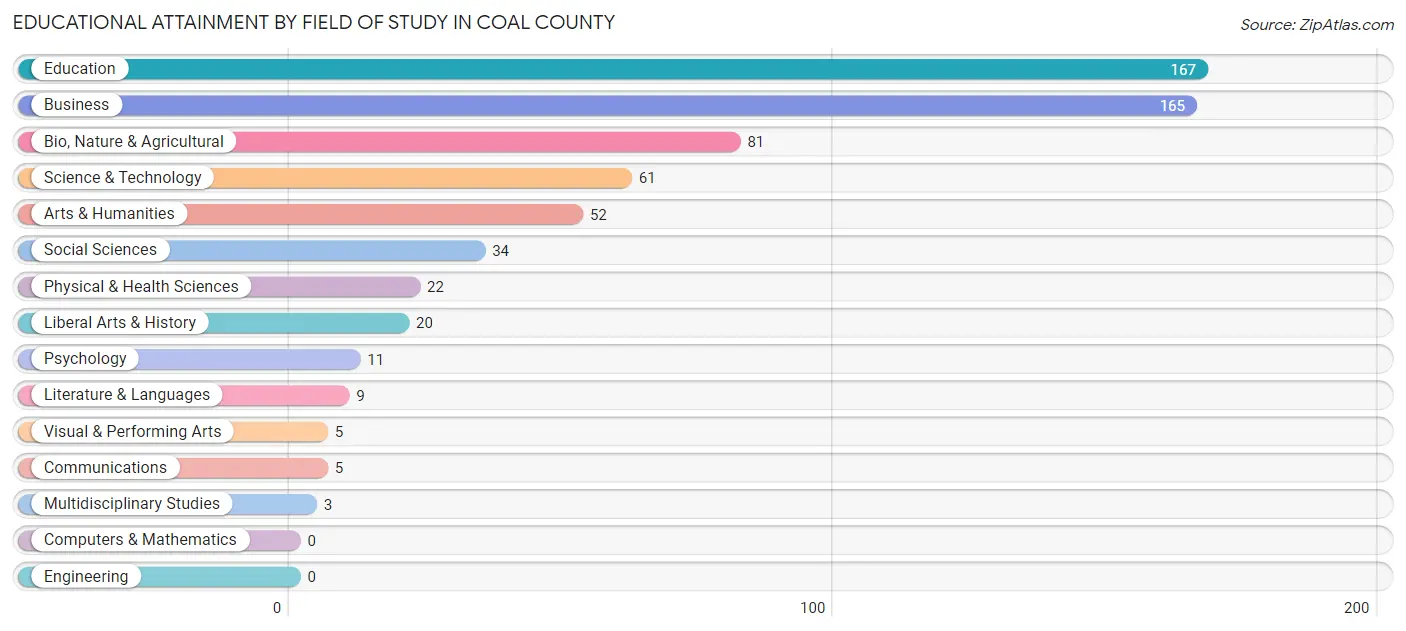
| Field of Study | # Graduates | % Graduates |
| Computers & Mathematics | 0 | 0.0% |
| Bio, Nature & Agricultural | 81 | 12.8% |
| Physical & Health Sciences | 22 | 3.5% |
| Psychology | 11 | 1.7% |
| Social Sciences | 34 | 5.3% |
| Engineering | 0 | 0.0% |
| Multidisciplinary Studies | 3 | 0.5% |
| Science & Technology | 61 | 9.6% |
| Business | 165 | 26.0% |
| Education | 167 | 26.3% |
| Literature & Languages | 9 | 1.4% |
| Liberal Arts & History | 20 | 3.2% |
| Visual & Performing Arts | 5 | 0.8% |
| Communications | 5 | 0.8% |
| Arts & Humanities | 52 | 8.2% |
| Total | 635 | 100.0% |
Transportation & Commute in Coal County
Vehicle Availability by Sex in Coal County
The most prevalent vehicle ownership categories in Coal County are males with 2 vehicles (376, accounting for 34.7%) and females with 2 vehicles (309, making up 43.0%).
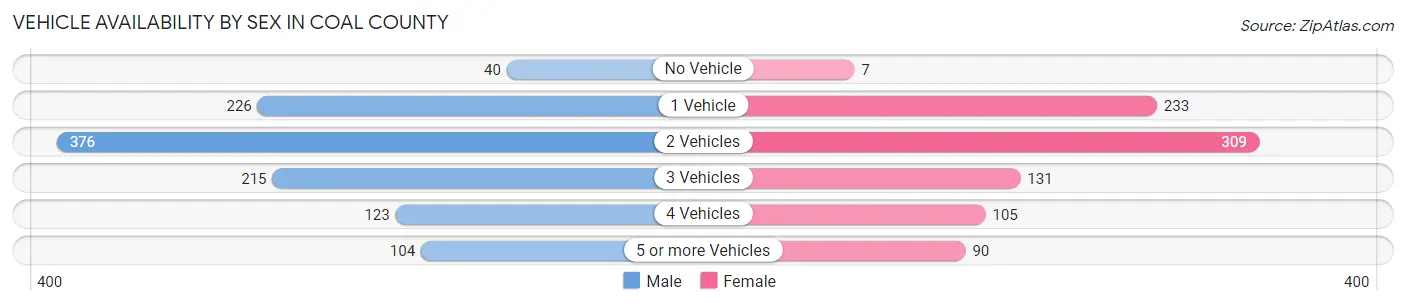
| Vehicles Available | Male | Female |
| No Vehicle | 40 (3.7%) | 7 (0.8%) |
| 1 Vehicle | 226 (20.8%) | 233 (26.6%) |
| 2 Vehicles | 376 (34.7%) | 309 (35.3%) |
| 3 Vehicles | 215 (19.8%) | 131 (15.0%) |
| 4 Vehicles | 123 (11.4%) | 105 (12.0%) |
| 5 or more Vehicles | 104 (9.6%) | 90 (10.3%) |
| Total | 1,084 (100.0%) | 875 (100.0%) |
Commute Time in Coal County
The most frequently occuring commute durations in Coal County are 5 to 9 minutes (308 commuters, 17.0%), less than 5 minutes (240 commuters, 13.2%), and 30 to 34 minutes (235 commuters, 12.9%).
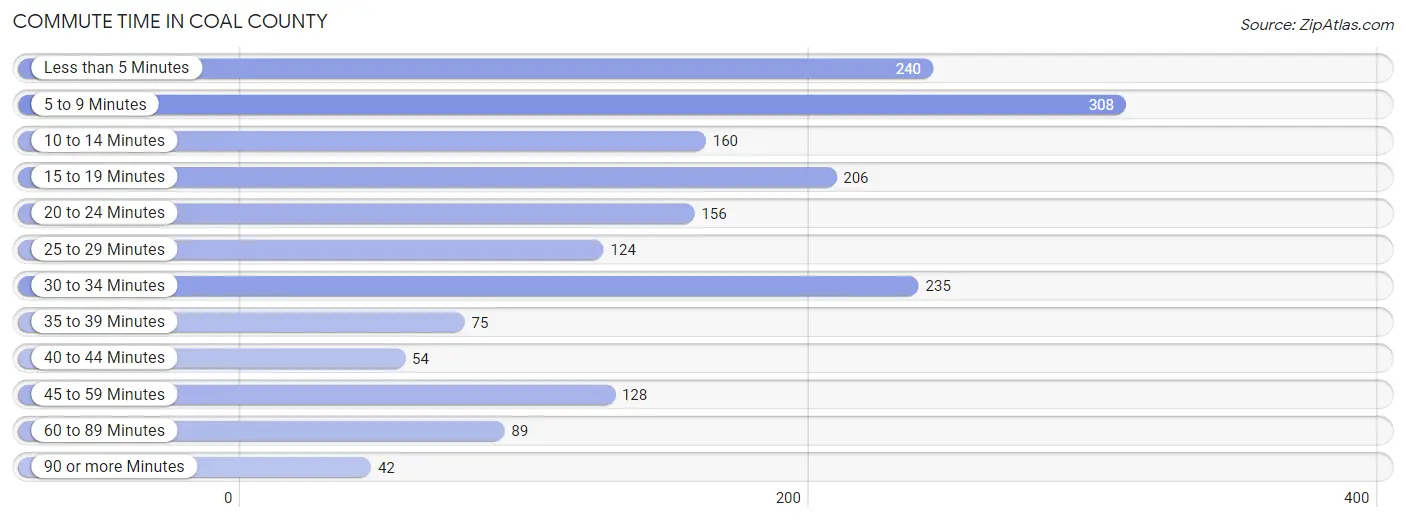
| Commute Time | # Commuters | % Commuters |
| Less than 5 Minutes | 240 | 13.2% |
| 5 to 9 Minutes | 308 | 17.0% |
| 10 to 14 Minutes | 160 | 8.8% |
| 15 to 19 Minutes | 206 | 11.3% |
| 20 to 24 Minutes | 156 | 8.6% |
| 25 to 29 Minutes | 124 | 6.8% |
| 30 to 34 Minutes | 235 | 12.9% |
| 35 to 39 Minutes | 75 | 4.1% |
| 40 to 44 Minutes | 54 | 3.0% |
| 45 to 59 Minutes | 128 | 7.0% |
| 60 to 89 Minutes | 89 | 4.9% |
| 90 or more Minutes | 42 | 2.3% |
Commute Time by Sex in Coal County
The most common commute times in Coal County are 5 to 9 minutes (184 commuters, 18.6%) for males and less than 5 minutes (139 commuters, 16.8%) for females.
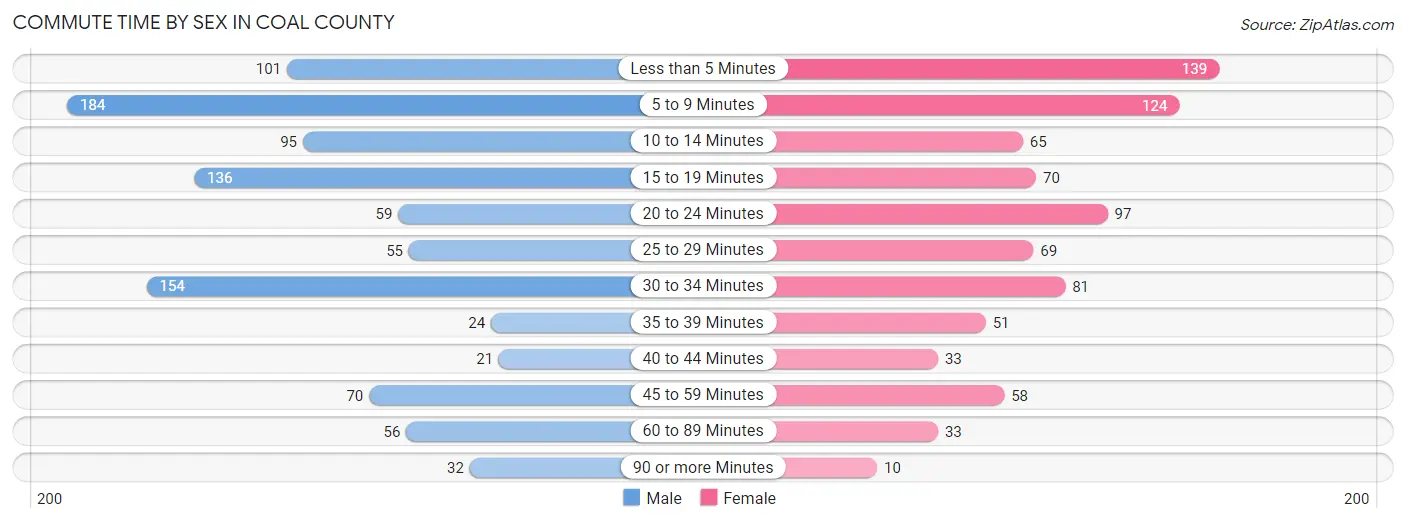
| Commute Time | Male | Female |
| Less than 5 Minutes | 101 (10.2%) | 139 (16.8%) |
| 5 to 9 Minutes | 184 (18.6%) | 124 (14.9%) |
| 10 to 14 Minutes | 95 (9.6%) | 65 (7.8%) |
| 15 to 19 Minutes | 136 (13.8%) | 70 (8.4%) |
| 20 to 24 Minutes | 59 (6.0%) | 97 (11.7%) |
| 25 to 29 Minutes | 55 (5.6%) | 69 (8.3%) |
| 30 to 34 Minutes | 154 (15.6%) | 81 (9.8%) |
| 35 to 39 Minutes | 24 (2.4%) | 51 (6.1%) |
| 40 to 44 Minutes | 21 (2.1%) | 33 (4.0%) |
| 45 to 59 Minutes | 70 (7.1%) | 58 (7.0%) |
| 60 to 89 Minutes | 56 (5.7%) | 33 (4.0%) |
| 90 or more Minutes | 32 (3.2%) | 10 (1.2%) |
Time of Departure to Work by Sex in Coal County
The most frequent times of departure to work in Coal County are 6:00 AM to 6:29 AM (146, 14.8%) for males and 7:30 AM to 7:59 AM (244, 29.4%) for females.
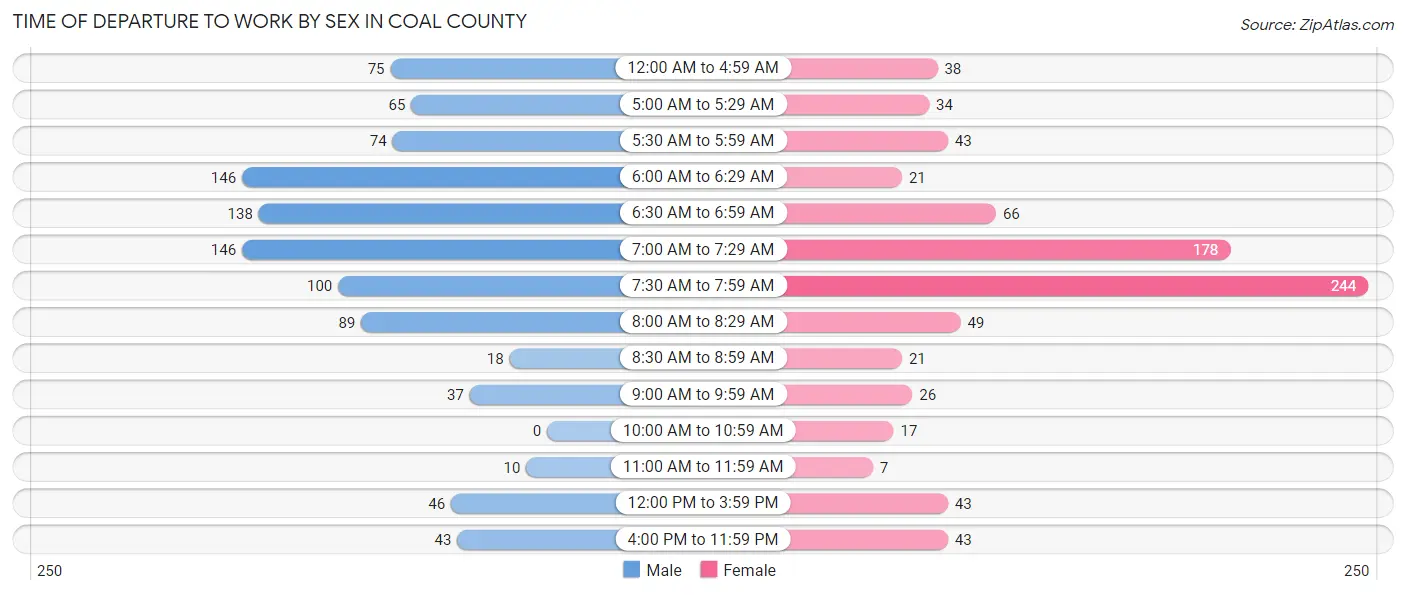
| Time of Departure | Male | Female |
| 12:00 AM to 4:59 AM | 75 (7.6%) | 38 (4.6%) |
| 5:00 AM to 5:29 AM | 65 (6.6%) | 34 (4.1%) |
| 5:30 AM to 5:59 AM | 74 (7.5%) | 43 (5.2%) |
| 6:00 AM to 6:29 AM | 146 (14.8%) | 21 (2.5%) |
| 6:30 AM to 6:59 AM | 138 (14.0%) | 66 (8.0%) |
| 7:00 AM to 7:29 AM | 146 (14.8%) | 178 (21.4%) |
| 7:30 AM to 7:59 AM | 100 (10.1%) | 244 (29.4%) |
| 8:00 AM to 8:29 AM | 89 (9.0%) | 49 (5.9%) |
| 8:30 AM to 8:59 AM | 18 (1.8%) | 21 (2.5%) |
| 9:00 AM to 9:59 AM | 37 (3.7%) | 26 (3.1%) |
| 10:00 AM to 10:59 AM | 0 (0.0%) | 17 (2.1%) |
| 11:00 AM to 11:59 AM | 10 (1.0%) | 7 (0.8%) |
| 12:00 PM to 3:59 PM | 46 (4.7%) | 43 (5.2%) |
| 4:00 PM to 11:59 PM | 43 (4.4%) | 43 (5.2%) |
| Total | 987 (100.0%) | 830 (100.0%) |
Housing Occupancy in Coal County
Occupancy by Ownership in Coal County
Of the total 2,083 dwellings in Coal County, owner-occupied units account for 1,505 (72.3%), while renter-occupied units make up 578 (27.8%).
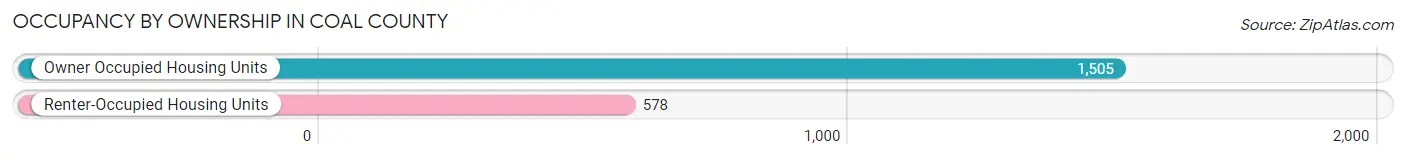
| Occupancy | # Housing Units | % Housing Units |
| Owner Occupied Housing Units | 1,505 | 72.3% |
| Renter-Occupied Housing Units | 578 | 27.8% |
| Total Occupied Housing Units | 2,083 | 100.0% |
Occupancy by Household Size in Coal County
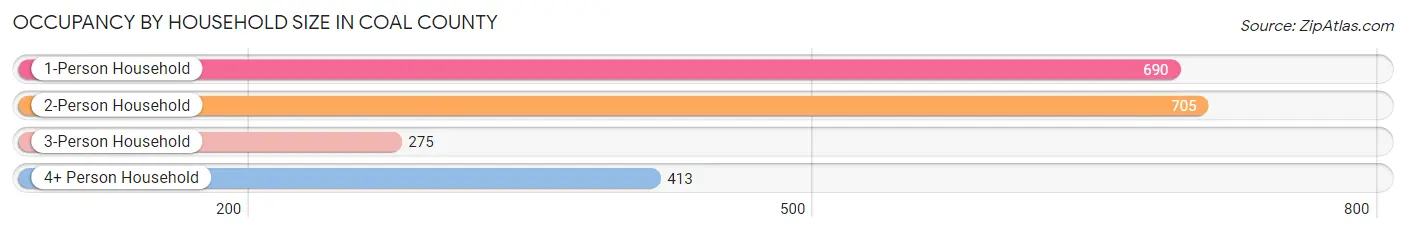
| Household Size | # Housing Units | % Housing Units |
| 1-Person Household | 690 | 33.1% |
| 2-Person Household | 705 | 33.9% |
| 3-Person Household | 275 | 13.2% |
| 4+ Person Household | 413 | 19.8% |
| Total Housing Units | 2,083 | 100.0% |
Occupancy by Ownership by Household Size in Coal County
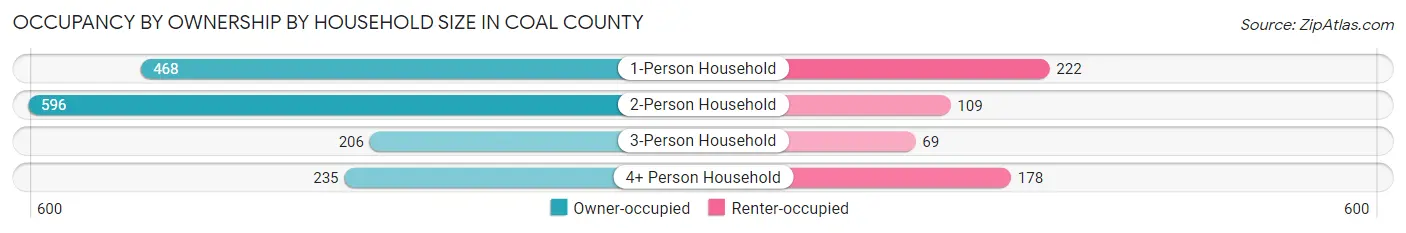
| Household Size | Owner-occupied | Renter-occupied |
| 1-Person Household | 468 (67.8%) | 222 (32.2%) |
| 2-Person Household | 596 (84.5%) | 109 (15.5%) |
| 3-Person Household | 206 (74.9%) | 69 (25.1%) |
| 4+ Person Household | 235 (56.9%) | 178 (43.1%) |
| Total Housing Units | 1,505 (72.3%) | 578 (27.8%) |
Occupancy by Educational Attainment in Coal County
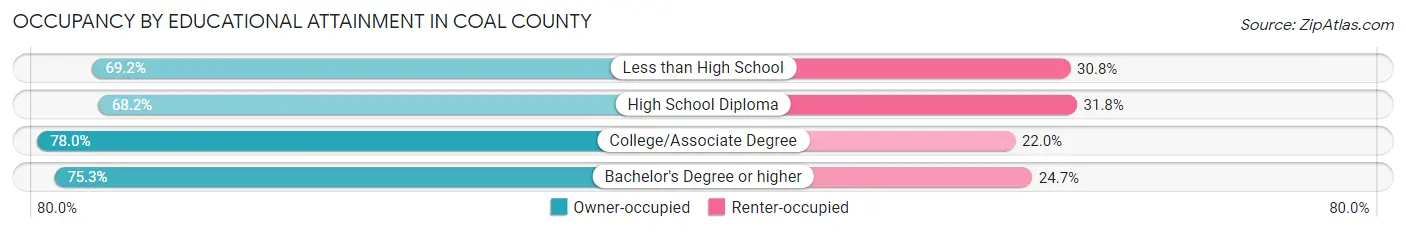
| Household Size | Owner-occupied | Renter-occupied |
| Less than High School | 207 (69.2%) | 92 (30.8%) |
| High School Diploma | 573 (68.2%) | 267 (31.8%) |
| College/Associate Degree | 411 (78.0%) | 116 (22.0%) |
| Bachelor's Degree or higher | 314 (75.3%) | 103 (24.7%) |
Occupancy by Age of Householder in Coal County
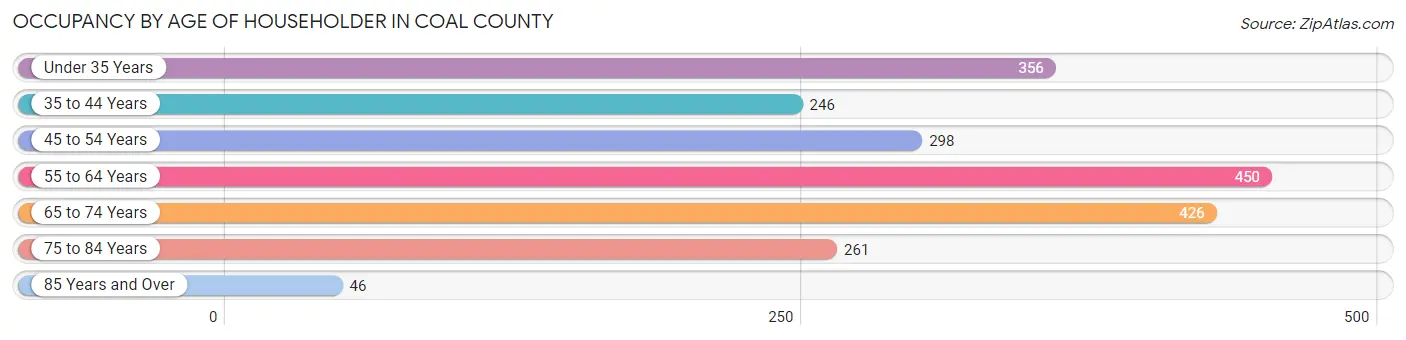
| Age Bracket | # Households | % Households |
| Under 35 Years | 356 | 17.1% |
| 35 to 44 Years | 246 | 11.8% |
| 45 to 54 Years | 298 | 14.3% |
| 55 to 64 Years | 450 | 21.6% |
| 65 to 74 Years | 426 | 20.4% |
| 75 to 84 Years | 261 | 12.5% |
| 85 Years and Over | 46 | 2.2% |
| Total | 2,083 | 100.0% |
Housing Finances in Coal County
Median Income by Occupancy in Coal County
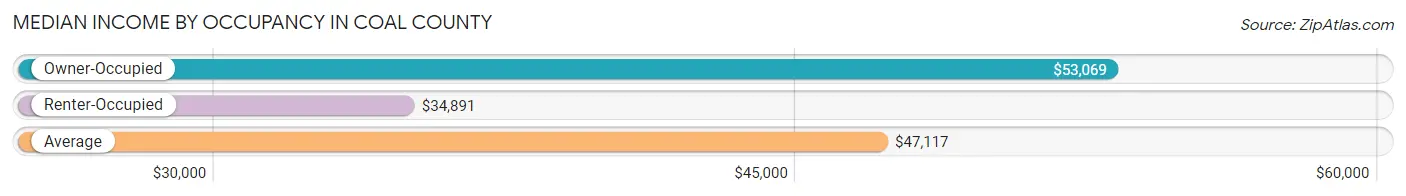
| Occupancy Type | # Households | Median Income |
| Owner-Occupied | 1,505 (72.3%) | $53,069 |
| Renter-Occupied | 578 (27.8%) | $34,891 |
| Average | 2,083 (100.0%) | $47,117 |
Occupancy by Householder Income Bracket in Coal County
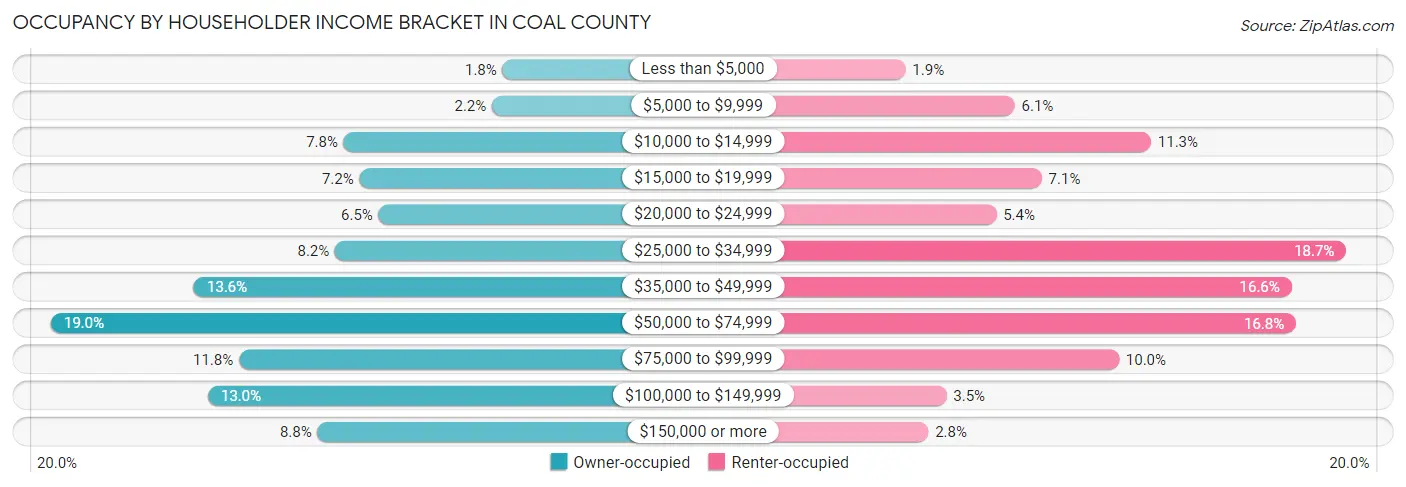
| Income Bracket | Owner-occupied | Renter-occupied |
| Less than $5,000 | 27 (1.8%) | 11 (1.9%) |
| $5,000 to $9,999 | 33 (2.2%) | 35 (6.1%) |
| $10,000 to $14,999 | 118 (7.8%) | 65 (11.3%) |
| $15,000 to $19,999 | 109 (7.2%) | 41 (7.1%) |
| $20,000 to $24,999 | 98 (6.5%) | 31 (5.4%) |
| $25,000 to $34,999 | 123 (8.2%) | 108 (18.7%) |
| $35,000 to $49,999 | 204 (13.6%) | 96 (16.6%) |
| $50,000 to $74,999 | 286 (19.0%) | 97 (16.8%) |
| $75,000 to $99,999 | 178 (11.8%) | 58 (10.0%) |
| $100,000 to $149,999 | 196 (13.0%) | 20 (3.5%) |
| $150,000 or more | 133 (8.8%) | 16 (2.8%) |
| Total | 1,505 (100.0%) | 578 (100.0%) |
Monthly Housing Cost Tiers in Coal County
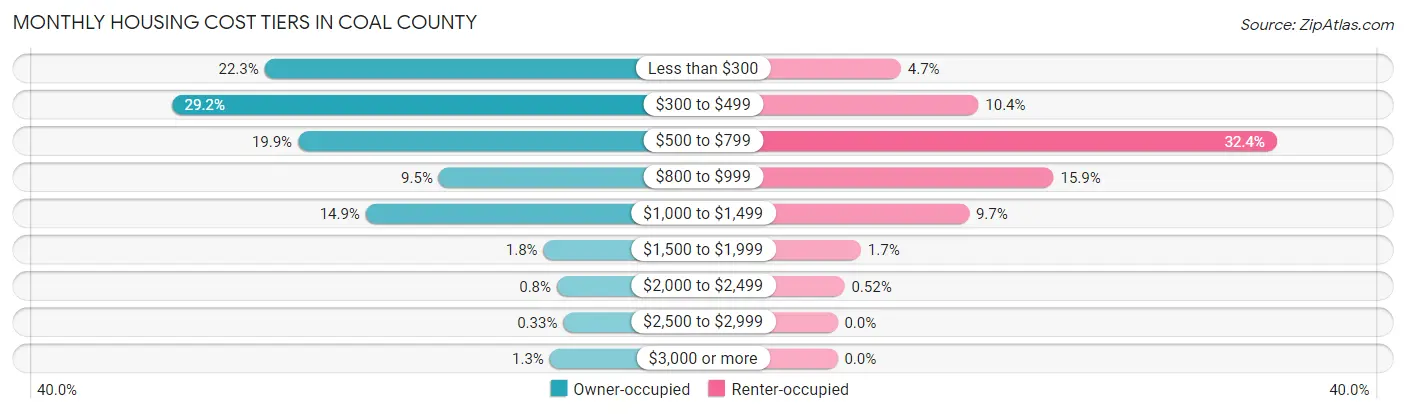
| Monthly Cost | Owner-occupied | Renter-occupied |
| Less than $300 | 336 (22.3%) | 27 (4.7%) |
| $300 to $499 | 439 (29.2%) | 60 (10.4%) |
| $500 to $799 | 299 (19.9%) | 187 (32.4%) |
| $800 to $999 | 143 (9.5%) | 92 (15.9%) |
| $1,000 to $1,499 | 224 (14.9%) | 56 (9.7%) |
| $1,500 to $1,999 | 27 (1.8%) | 10 (1.7%) |
| $2,000 to $2,499 | 12 (0.8%) | 3 (0.5%) |
| $2,500 to $2,999 | 5 (0.3%) | 0 (0.0%) |
| $3,000 or more | 20 (1.3%) | 0 (0.0%) |
| Total | 1,505 (100.0%) | 578 (100.0%) |
Physical Housing Characteristics in Coal County
Housing Structures in Coal County
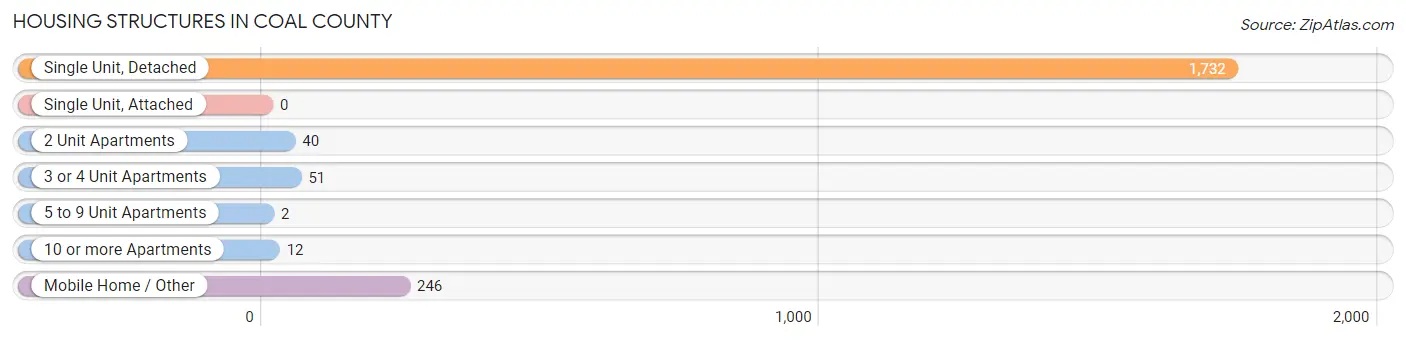
| Structure Type | # Housing Units | % Housing Units |
| Single Unit, Detached | 1,732 | 83.2% |
| Single Unit, Attached | 0 | 0.0% |
| 2 Unit Apartments | 40 | 1.9% |
| 3 or 4 Unit Apartments | 51 | 2.5% |
| 5 to 9 Unit Apartments | 2 | 0.1% |
| 10 or more Apartments | 12 | 0.6% |
| Mobile Home / Other | 246 | 11.8% |
| Total | 2,083 | 100.0% |
Housing Structures by Occupancy in Coal County
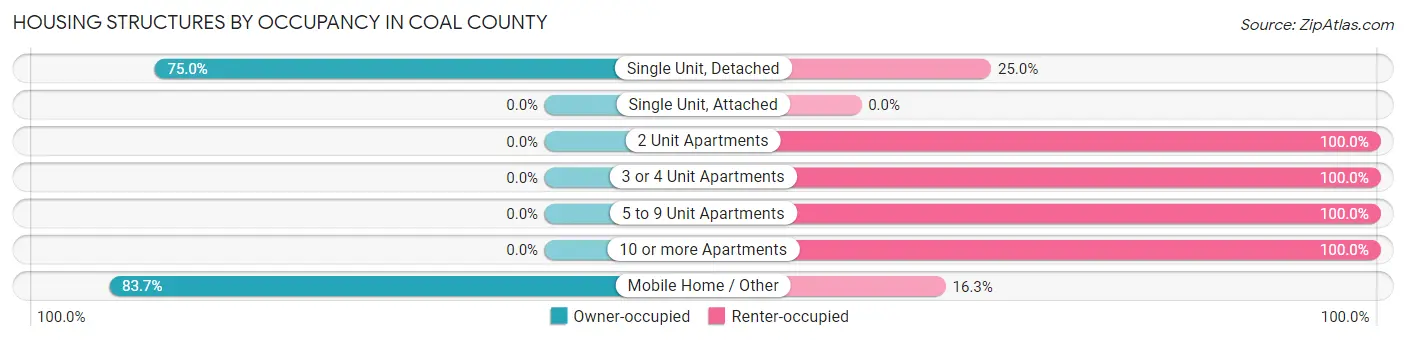
| Structure Type | Owner-occupied | Renter-occupied |
| Single Unit, Detached | 1,299 (75.0%) | 433 (25.0%) |
| Single Unit, Attached | 0 (0.0%) | 0 (0.0%) |
| 2 Unit Apartments | 0 (0.0%) | 40 (100.0%) |
| 3 or 4 Unit Apartments | 0 (0.0%) | 51 (100.0%) |
| 5 to 9 Unit Apartments | 0 (0.0%) | 2 (100.0%) |
| 10 or more Apartments | 0 (0.0%) | 12 (100.0%) |
| Mobile Home / Other | 206 (83.7%) | 40 (16.3%) |
| Total | 1,505 (72.3%) | 578 (27.8%) |
Housing Structures by Number of Rooms in Coal County
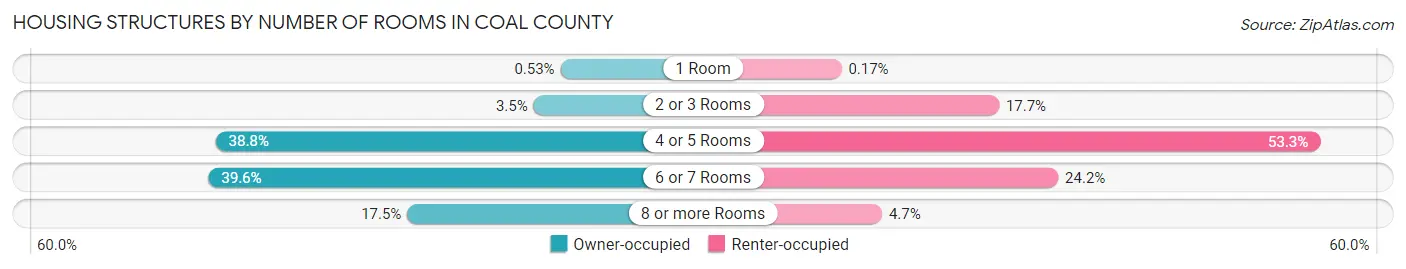
| Number of Rooms | Owner-occupied | Renter-occupied |
| 1 Room | 8 (0.5%) | 1 (0.2%) |
| 2 or 3 Rooms | 53 (3.5%) | 102 (17.6%) |
| 4 or 5 Rooms | 584 (38.8%) | 308 (53.3%) |
| 6 or 7 Rooms | 596 (39.6%) | 140 (24.2%) |
| 8 or more Rooms | 264 (17.5%) | 27 (4.7%) |
| Total | 1,505 (100.0%) | 578 (100.0%) |
Housing Structure by Heating Type in Coal County
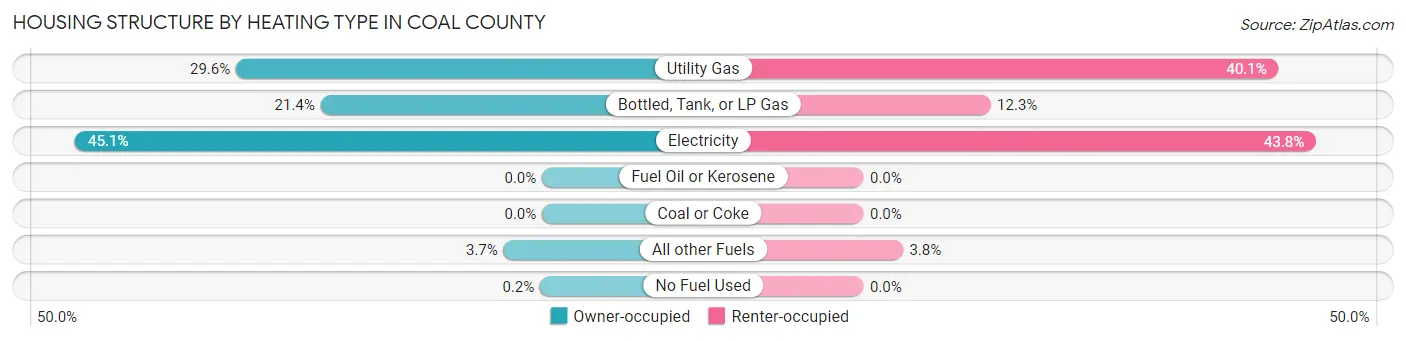
| Heating Type | Owner-occupied | Renter-occupied |
| Utility Gas | 445 (29.6%) | 232 (40.1%) |
| Bottled, Tank, or LP Gas | 322 (21.4%) | 71 (12.3%) |
| Electricity | 679 (45.1%) | 253 (43.8%) |
| Fuel Oil or Kerosene | 0 (0.0%) | 0 (0.0%) |
| Coal or Coke | 0 (0.0%) | 0 (0.0%) |
| All other Fuels | 56 (3.7%) | 22 (3.8%) |
| No Fuel Used | 3 (0.2%) | 0 (0.0%) |
| Total | 1,505 (100.0%) | 578 (100.0%) |
Household Vehicle Usage in Coal County
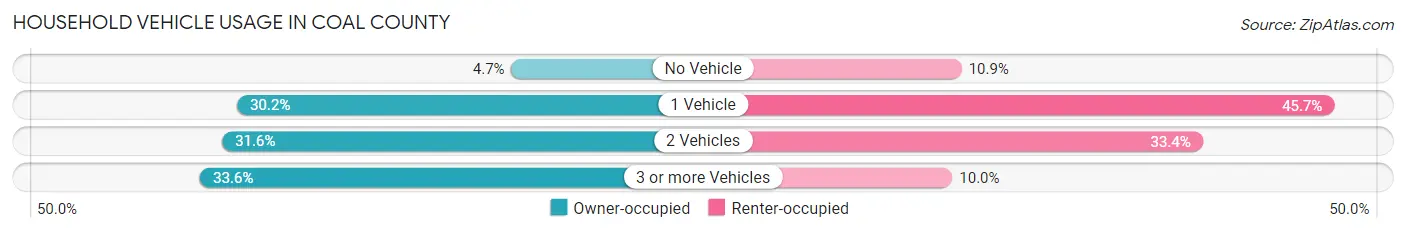
| Vehicles per Household | Owner-occupied | Renter-occupied |
| No Vehicle | 70 (4.6%) | 63 (10.9%) |
| 1 Vehicle | 454 (30.2%) | 264 (45.7%) |
| 2 Vehicles | 475 (31.6%) | 193 (33.4%) |
| 3 or more Vehicles | 506 (33.6%) | 58 (10.0%) |
| Total | 1,505 (100.0%) | 578 (100.0%) |
Real Estate & Mortgages in Coal County
Real Estate and Mortgage Overview in Coal County
| Characteristic | Without Mortgage | With Mortgage |
| Housing Units | 965 | 540 |
| Median Property Value | $88,800 | $95,900 |
| Median Household Income | $43,194 | $94 |
| Monthly Housing Costs | $374 | $20 |
| Real Estate Taxes | $423 | $72 |
Property Value by Mortgage Status in Coal County
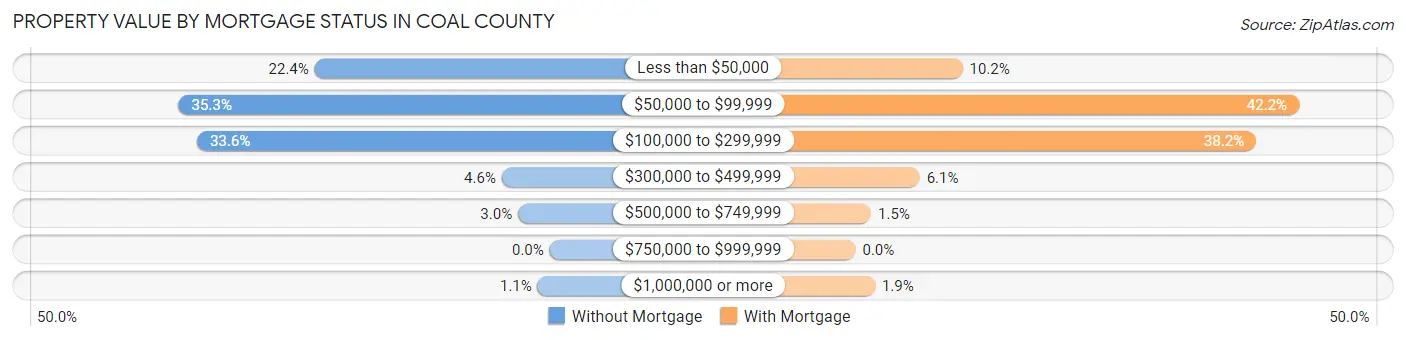
| Property Value | Without Mortgage | With Mortgage |
| Less than $50,000 | 216 (22.4%) | 55 (10.2%) |
| $50,000 to $99,999 | 341 (35.3%) | 228 (42.2%) |
| $100,000 to $299,999 | 324 (33.6%) | 206 (38.2%) |
| $300,000 to $499,999 | 44 (4.6%) | 33 (6.1%) |
| $500,000 to $749,999 | 29 (3.0%) | 8 (1.5%) |
| $750,000 to $999,999 | 0 (0.0%) | 0 (0.0%) |
| $1,000,000 or more | 11 (1.1%) | 10 (1.8%) |
| Total | 965 (100.0%) | 540 (100.0%) |
Household Income by Mortgage Status in Coal County
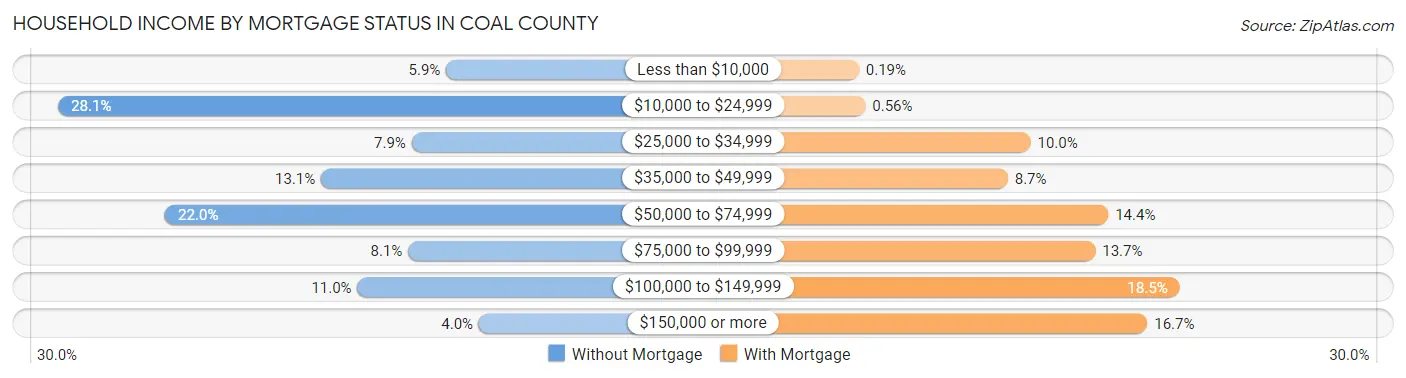
| Household Income | Without Mortgage | With Mortgage |
| Less than $10,000 | 57 (5.9%) | 1 (0.2%) |
| $10,000 to $24,999 | 271 (28.1%) | 3 (0.6%) |
| $25,000 to $34,999 | 76 (7.9%) | 54 (10.0%) |
| $35,000 to $49,999 | 126 (13.1%) | 47 (8.7%) |
| $50,000 to $74,999 | 212 (22.0%) | 78 (14.4%) |
| $75,000 to $99,999 | 78 (8.1%) | 74 (13.7%) |
| $100,000 to $149,999 | 106 (11.0%) | 100 (18.5%) |
| $150,000 or more | 39 (4.0%) | 90 (16.7%) |
| Total | 965 (100.0%) | 540 (100.0%) |
Property Value to Household Income Ratio in Coal County
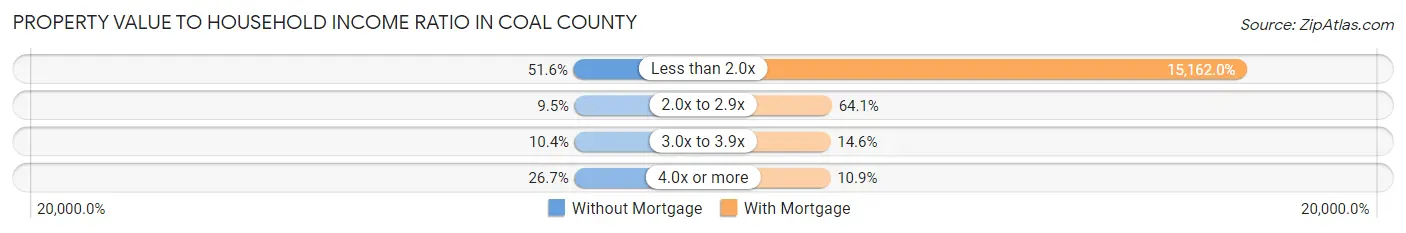
| Value-to-Income Ratio | Without Mortgage | With Mortgage |
| Less than 2.0x | 498 (51.6%) | 81,875 (15,162.0%) |
| 2.0x to 2.9x | 92 (9.5%) | 346 (64.1%) |
| 3.0x to 3.9x | 100 (10.4%) | 79 (14.6%) |
| 4.0x or more | 258 (26.7%) | 59 (10.9%) |
| Total | 965 (100.0%) | 540 (100.0%) |
Real Estate Taxes by Mortgage Status in Coal County
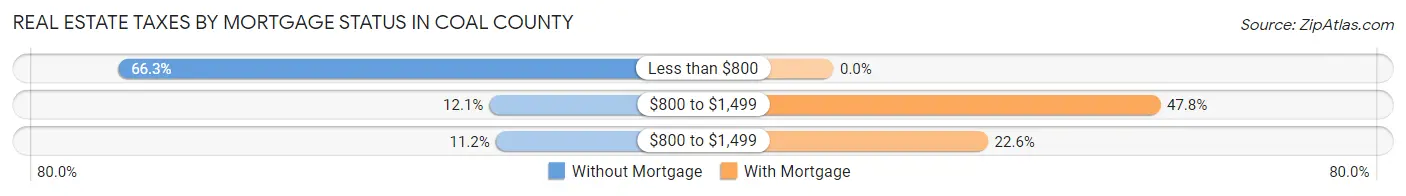
| Property Taxes | Without Mortgage | With Mortgage |
| Less than $800 | 640 (66.3%) | 0 (0.0%) |
| $800 to $1,499 | 117 (12.1%) | 258 (47.8%) |
| $800 to $1,499 | 108 (11.2%) | 122 (22.6%) |
| Total | 965 (100.0%) | 540 (100.0%) |
Health & Disability in Coal County
Health Insurance Coverage by Age in Coal County
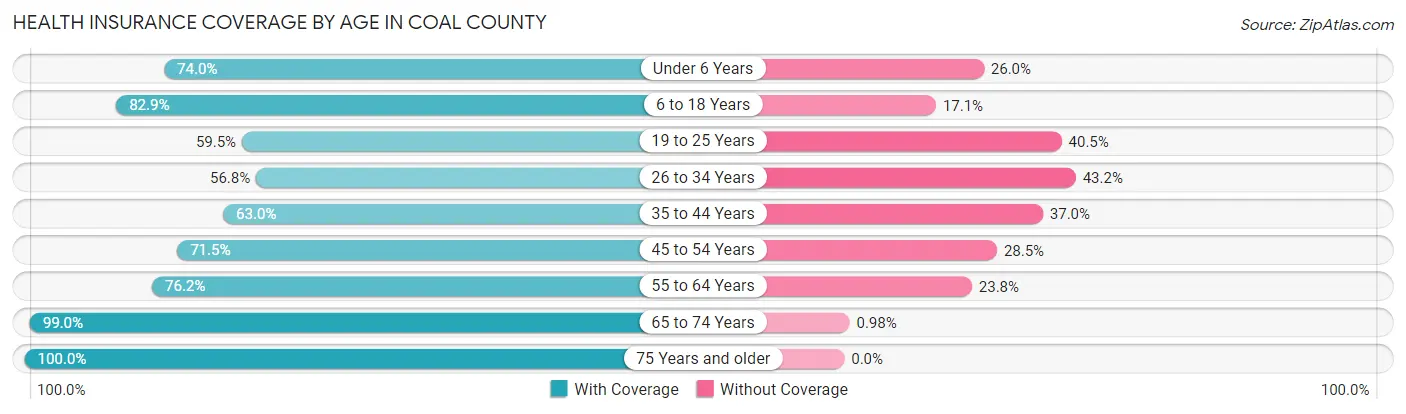
| Age Bracket | With Coverage | Without Coverage |
| Under 6 Years | 324 (74.0%) | 114 (26.0%) |
| 6 to 18 Years | 752 (82.9%) | 155 (17.1%) |
| 19 to 25 Years | 267 (59.5%) | 182 (40.5%) |
| 26 to 34 Years | 266 (56.8%) | 202 (43.2%) |
| 35 to 44 Years | 386 (63.0%) | 227 (37.0%) |
| 45 to 54 Years | 407 (71.5%) | 162 (28.5%) |
| 55 to 64 Years | 567 (76.2%) | 177 (23.8%) |
| 65 to 74 Years | 606 (99.0%) | 6 (1.0%) |
| 75 Years and older | 425 (100.0%) | 0 (0.0%) |
| Total | 4,000 (76.6%) | 1,225 (23.4%) |
Health Insurance Coverage by Citizenship Status in Coal County
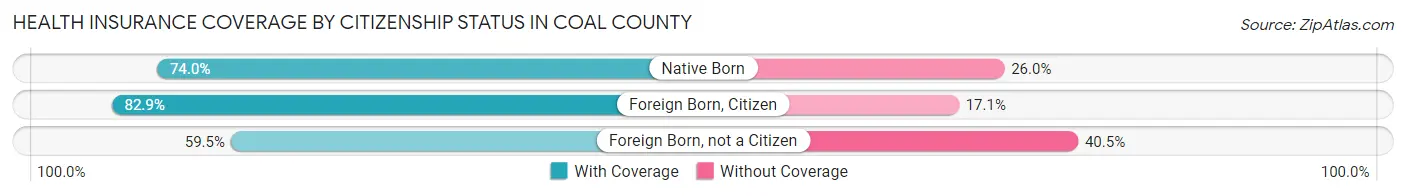
| Citizenship Status | With Coverage | Without Coverage |
| Native Born | 324 (74.0%) | 114 (26.0%) |
| Foreign Born, Citizen | 752 (82.9%) | 155 (17.1%) |
| Foreign Born, not a Citizen | 267 (59.5%) | 182 (40.5%) |
Health Insurance Coverage by Household Income in Coal County
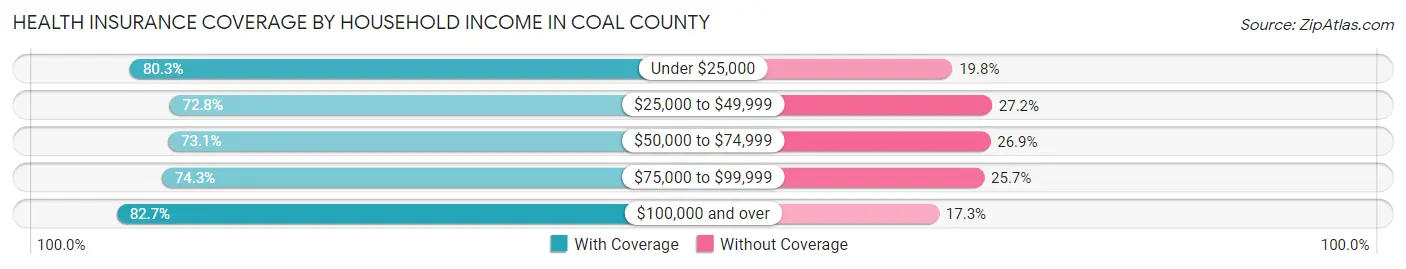
| Household Income | With Coverage | Without Coverage |
| Under $25,000 | 829 (80.2%) | 204 (19.8%) |
| $25,000 to $49,999 | 1,029 (72.8%) | 384 (27.2%) |
| $50,000 to $74,999 | 734 (73.1%) | 270 (26.9%) |
| $75,000 to $99,999 | 531 (74.3%) | 184 (25.7%) |
| $100,000 and over | 877 (82.7%) | 183 (17.3%) |
Public vs Private Health Insurance Coverage by Age in Coal County
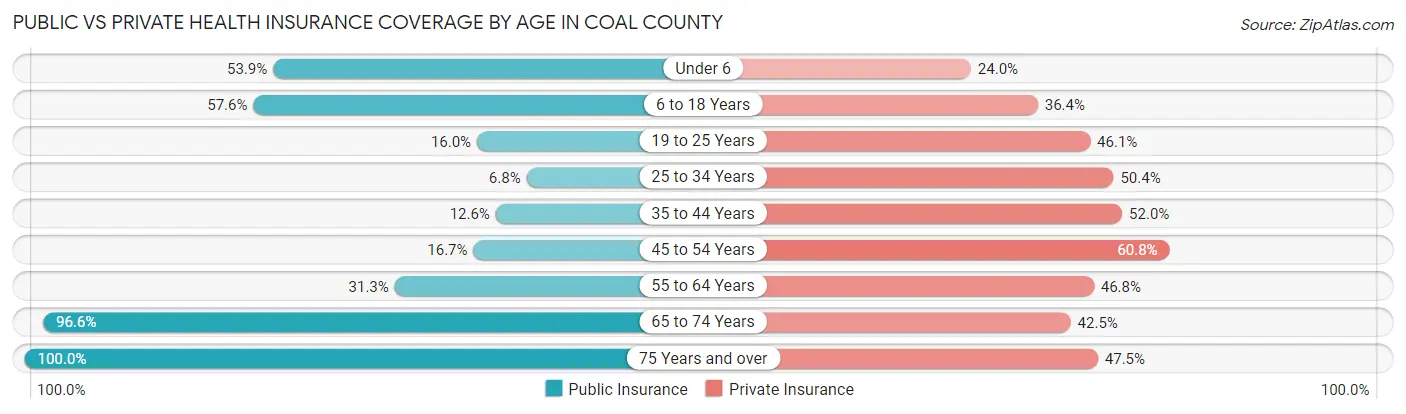
| Age Bracket | Public Insurance | Private Insurance |
| Under 6 | 236 (53.9%) | 105 (24.0%) |
| 6 to 18 Years | 522 (57.6%) | 330 (36.4%) |
| 19 to 25 Years | 72 (16.0%) | 207 (46.1%) |
| 25 to 34 Years | 32 (6.8%) | 236 (50.4%) |
| 35 to 44 Years | 77 (12.6%) | 319 (52.0%) |
| 45 to 54 Years | 95 (16.7%) | 346 (60.8%) |
| 55 to 64 Years | 233 (31.3%) | 348 (46.8%) |
| 65 to 74 Years | 591 (96.6%) | 260 (42.5%) |
| 75 Years and over | 425 (100.0%) | 202 (47.5%) |
| Total | 2,283 (43.7%) | 2,353 (45.0%) |
Disability Status by Sex by Age in Coal County
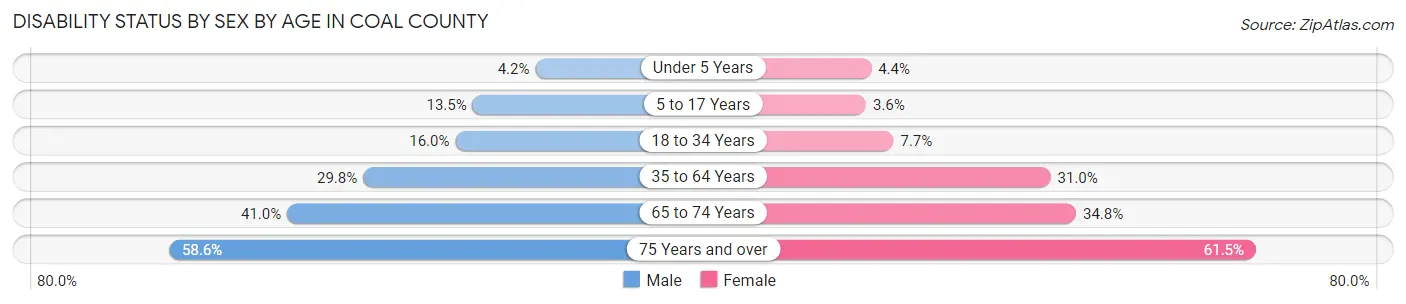
| Age Bracket | Male | Female |
| Under 5 Years | 8 (4.2%) | 8 (4.4%) |
| 5 to 17 Years | 69 (13.5%) | 14 (3.6%) |
| 18 to 34 Years | 85 (16.0%) | 35 (7.7%) |
| 35 to 64 Years | 291 (29.7%) | 294 (31.0%) |
| 65 to 74 Years | 119 (41.0%) | 112 (34.8%) |
| 75 Years and over | 106 (58.6%) | 150 (61.5%) |
Disability Class by Sex by Age in Coal County
Disability Class: Hearing Difficulty
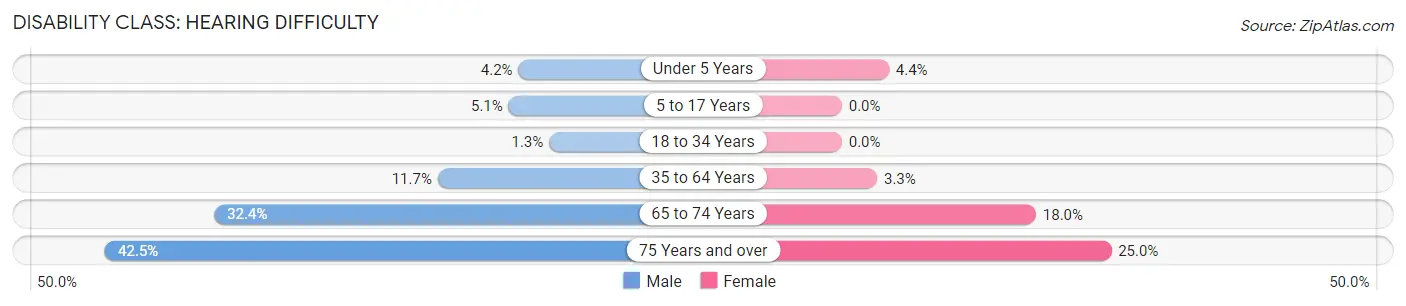
| Age Bracket | Male | Female |
| Under 5 Years | 8 (4.2%) | 8 (4.4%) |
| 5 to 17 Years | 26 (5.1%) | 0 (0.0%) |
| 18 to 34 Years | 7 (1.3%) | 0 (0.0%) |
| 35 to 64 Years | 114 (11.7%) | 31 (3.3%) |
| 65 to 74 Years | 94 (32.4%) | 58 (18.0%) |
| 75 Years and over | 77 (42.5%) | 61 (25.0%) |
Disability Class: Vision Difficulty
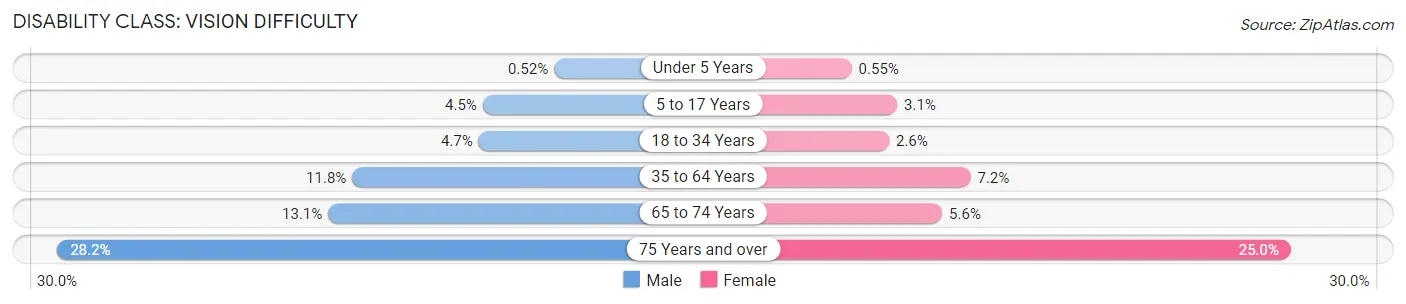
| Age Bracket | Male | Female |
| Under 5 Years | 1 (0.5%) | 1 (0.5%) |
| 5 to 17 Years | 23 (4.5%) | 12 (3.1%) |
| 18 to 34 Years | 25 (4.7%) | 12 (2.6%) |
| 35 to 64 Years | 115 (11.8%) | 68 (7.2%) |
| 65 to 74 Years | 38 (13.1%) | 18 (5.6%) |
| 75 Years and over | 51 (28.2%) | 61 (25.0%) |
Disability Class: Cognitive Difficulty
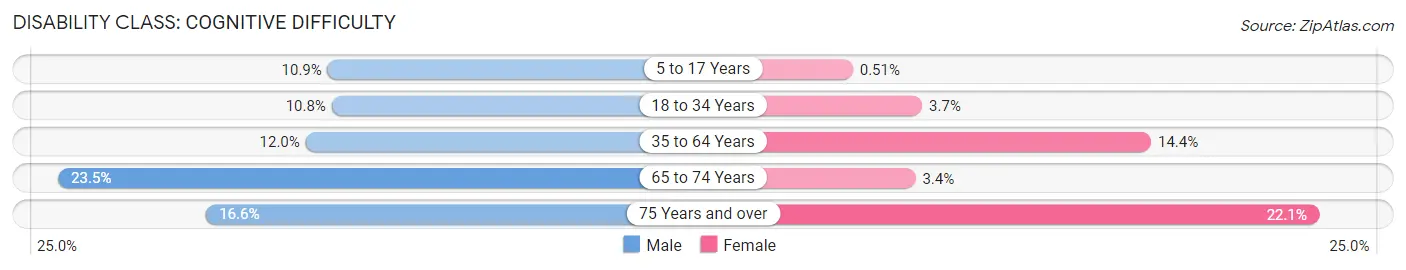
| Age Bracket | Male | Female |
| 5 to 17 Years | 56 (10.9%) | 2 (0.5%) |
| 18 to 34 Years | 57 (10.7%) | 17 (3.7%) |
| 35 to 64 Years | 117 (12.0%) | 136 (14.3%) |
| 65 to 74 Years | 68 (23.4%) | 11 (3.4%) |
| 75 Years and over | 30 (16.6%) | 54 (22.1%) |
Disability Class: Ambulatory Difficulty
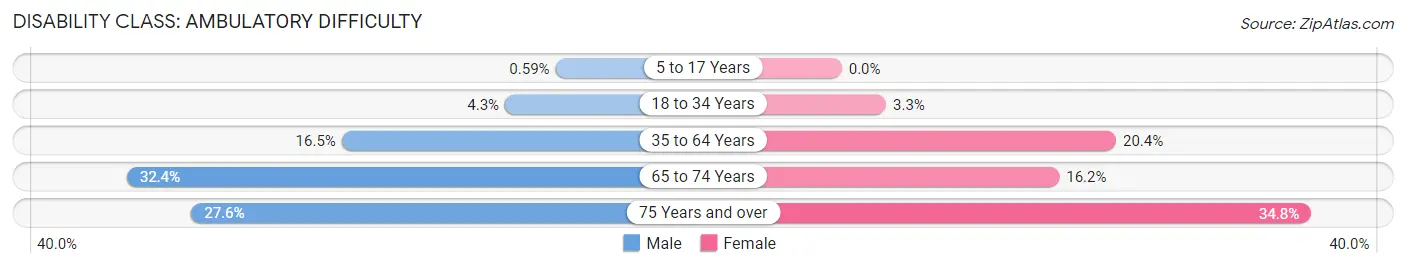
| Age Bracket | Male | Female |
| 5 to 17 Years | 3 (0.6%) | 0 (0.0%) |
| 18 to 34 Years | 23 (4.3%) | 15 (3.3%) |
| 35 to 64 Years | 161 (16.5%) | 193 (20.4%) |
| 65 to 74 Years | 94 (32.4%) | 52 (16.2%) |
| 75 Years and over | 50 (27.6%) | 85 (34.8%) |
Disability Class: Self-Care Difficulty
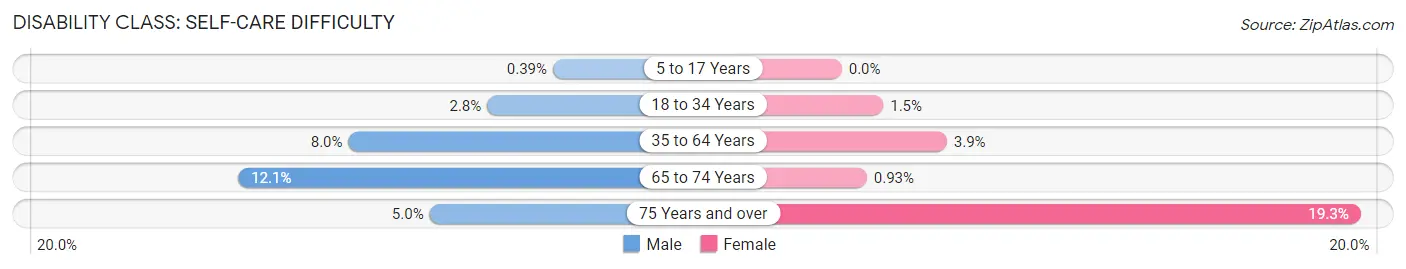
| Age Bracket | Male | Female |
| 5 to 17 Years | 2 (0.4%) | 0 (0.0%) |
| 18 to 34 Years | 15 (2.8%) | 7 (1.5%) |
| 35 to 64 Years | 78 (8.0%) | 37 (3.9%) |
| 65 to 74 Years | 35 (12.1%) | 3 (0.9%) |
| 75 Years and over | 9 (5.0%) | 47 (19.3%) |
Technology Access in Coal County
Computing Device Access in Coal County
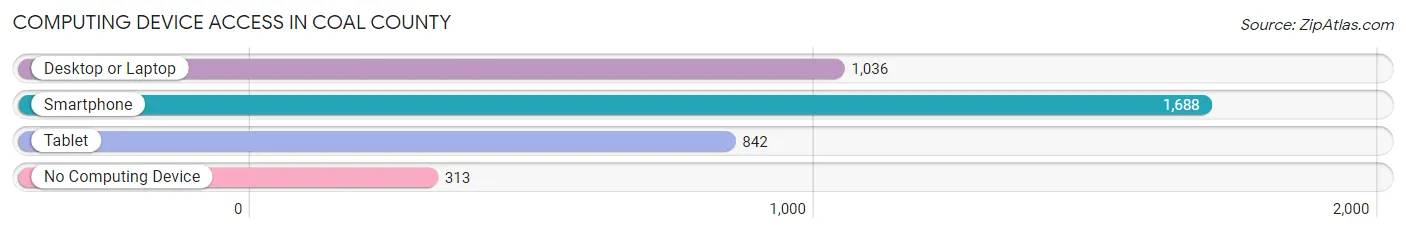
| Device Type | # Households | % Households |
| Desktop or Laptop | 1,036 | 49.7% |
| Smartphone | 1,688 | 81.0% |
| Tablet | 842 | 40.4% |
| No Computing Device | 313 | 15.0% |
| Total | 2,083 | 100.0% |
Internet Access in Coal County
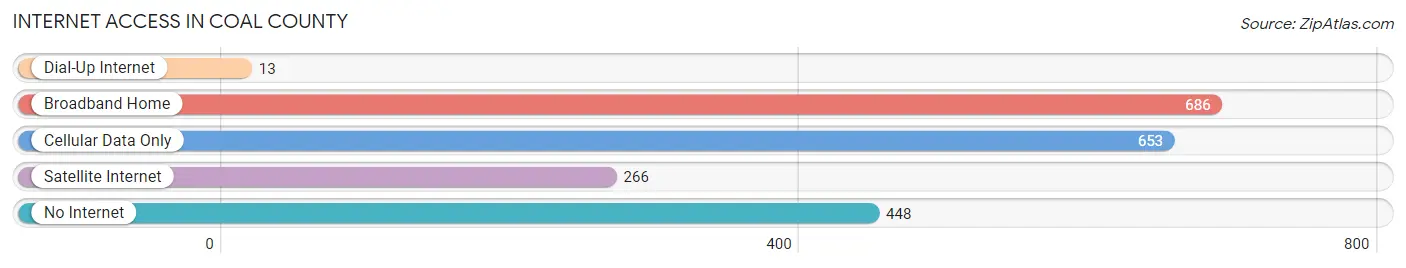
| Internet Type | # Households | % Households |
| Dial-Up Internet | 13 | 0.6% |
| Broadband Home | 686 | 32.9% |
| Cellular Data Only | 653 | 31.4% |
| Satellite Internet | 266 | 12.8% |
| No Internet | 448 | 21.5% |
| Total | 2,083 | 100.0% |
Coal County Summary
Coal County is located in the south-central region of Oklahoma, and is bordered by Atoka County to the north, Johnston County to the east, Pontotoc County to the south, and Pittsburg County to the west. The county seat is Coalgate, and the county was named for the abundant coal deposits found in the area. As of the 2010 census, the population of Coal County was 9,749, and the county has a total area of 545 square miles.
Geography
Coal County is located in the south-central region of Oklahoma, and is bordered by Atoka County to the north, Johnston County to the east, Pontotoc County to the south, and Pittsburg County to the west. The county is mostly rural, with the majority of the land being used for agricultural purposes. The terrain is mostly flat, with some rolling hills in the northern part of the county. The county is drained by the Clear Boggy Creek, which flows through the center of the county. The county is also home to several small lakes, including Lake Coalgate, Lake Atoka, and Lake Johnston.
History
Coal County was established in 1907, and was named for the abundant coal deposits found in the area. The county was originally part of the Choctaw Nation, and was opened to settlement in the late 19th century. The first settlers arrived in the area in the 1880s, and the county was officially organized in 1907. Coalgate was established as the county seat, and the town quickly grew to become the largest town in the county.
Economy
The economy of Coal County is largely based on agriculture, with the majority of the land being used for farming and ranching. The county is also home to several coal mines, which provide employment for many of the county’s residents. Other industries in the county include manufacturing, retail, and tourism.
Demographics
As of the 2010 census, the population of Coal County was 9,749, and the county has a total area of 545 square miles. The population is mostly white (90.2%), with small percentages of African American (4.2%), Native American (2.2%), and Hispanic (2.2%) residents. The median household income in the county is $35,945, and the median home value is $76,400. The county has a poverty rate of 17.2%, and the unemployment rate is 4.7%.
Coal County is a rural county in south-central Oklahoma, with a population of just under 10,000 people. The county is largely agricultural, with the majority of the land being used for farming and ranching. The county is also home to several coal mines, which provide employment for many of the county’s residents. The population is mostly white, with small percentages of African American, Native American, and Hispanic residents. The median household income in the county is $35,945, and the median home value is $76,400. The county has a poverty rate of 17.2%, and the unemployment rate is 4.7%.
Common Questions
What is Per Capita Income in Coal County?
Per Capita income in Coal County is $26,899.
What is the Median Family Income in Coal County?
Median Family Income in Coal County is $56,016.
What is the Median Household income in Coal County?
Median Household Income in Coal County is $47,117.
What is Income or Wage Gap in Coal County?
Income or Wage Gap in Coal County is 21.5%.
Women in Coal County earn 78.5 cents for every dollar earned by a man.
What is Family Income Deficit in Coal County?
Family Income Deficit in Coal County is $9,512.
Families that are below poverty line in Coal County earn $9,512 less on average than the poverty threshold level.
What is Inequality or Gini Index in Coal County?
Inequality or Gini Index in Coal County is 0.47.
What is the Total Population of Coal County?
Total Population of Coal County is 5,287.
What is the Total Male Population of Coal County?
Total Male Population of Coal County is 2,696.
What is the Total Female Population of Coal County?
Total Female Population of Coal County is 2,591.
What is the Ratio of Males per 100 Females in Coal County?
There are 104.05 Males per 100 Females in Coal County.
What is the Ratio of Females per 100 Males in Coal County?
There are 96.11 Females per 100 Males in Coal County.
What is the Median Population Age in Coal County?
Median Population Age in Coal County is 40.7 Years.
What is the Average Family Size in Coal County
Average Family Size in Coal County is 3.1 People.
What is the Average Household Size in Coal County
Average Household Size in Coal County is 2.5 People.
How Large is the Labor Force in Coal County?
There are 2,146 People in the Labor Forcein in Coal County.
What is the Percentage of People in the Labor Force in Coal County?
51.1% of People are in the Labor Force in Coal County.
What is the Unemployment Rate in Coal County?
Unemployment Rate in Coal County is 5.6%.