Cimarron County, OK Map & Demographics
Cimarron County Overview
$33,925
PER CAPITA INCOME
$76,786
AVG FAMILY INCOME
$57,100
AVG HOUSEHOLD INCOME
58.0%
WAGE / INCOME GAP [ % ]
42.0¢/ $1
WAGE / INCOME GAP [ $ ]
$3,717
FAMILY INCOME DEFICIT
0.46
INEQUALITY / GINI INDEX
2,272
TOTAL POPULATION
1,151
MALE POPULATION
1,121
FEMALE POPULATION
102.68
MALES / 100 FEMALES
97.39
FEMALES / 100 MALES
45.9
MEDIAN AGE
3.8
AVG FAMILY SIZE
3.0
AVG HOUSEHOLD SIZE
1,086
LABOR FORCE [ PEOPLE ]
61.2%
PERCENT IN LABOR FORCE
0.2%
UNEMPLOYMENT RATE
Cimarron County Area Codes
Income in Cimarron County
Income Overview in Cimarron County
Per Capita Income in Cimarron County is $33,925, while median incomes of families and households are $76,786 and $57,100 respectively.
| Characteristic | Number | Measure |
| Per Capita Income | 2,272 | $33,925 |
| Median Family Income | 506 | $76,786 |
| Mean Family Income | 506 | $95,661 |
| Median Household Income | 752 | $57,100 |
| Mean Household Income | 752 | $82,944 |
| Income Deficit | 506 | $3,717 |
| Wage / Income Gap (%) | 2,272 | 57.97% |
| Wage / Income Gap ($) | 2,272 | 42.03¢ per $1 |
| Gini / Inequality Index | 2,272 | 0.46 |
Earnings by Sex in Cimarron County
Average Earnings in Cimarron County are $37,125, $50,159 for men and $21,080 for women, a difference of 58.0%.
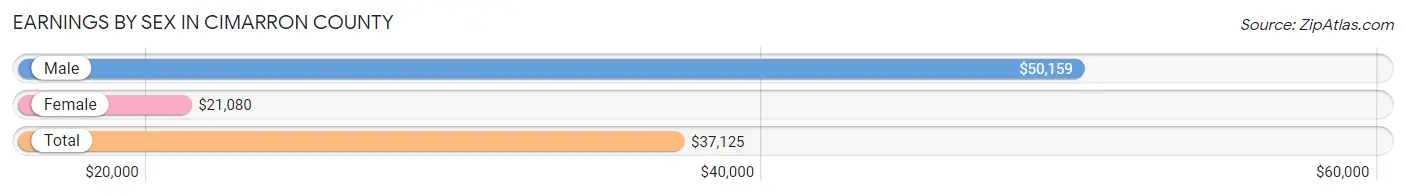
| Sex | Number | Average Earnings |
| Male | 710 (64.1%) | $50,159 |
| Female | 398 (35.9%) | $21,080 |
| Total | 1,108 (100.0%) | $37,125 |
Earnings by Sex by Income Bracket in Cimarron County
The most common earnings brackets in Cimarron County are $100,000+ for men (169 | 23.8%) and $22,500 to $24,999 for women (59 | 14.8%).
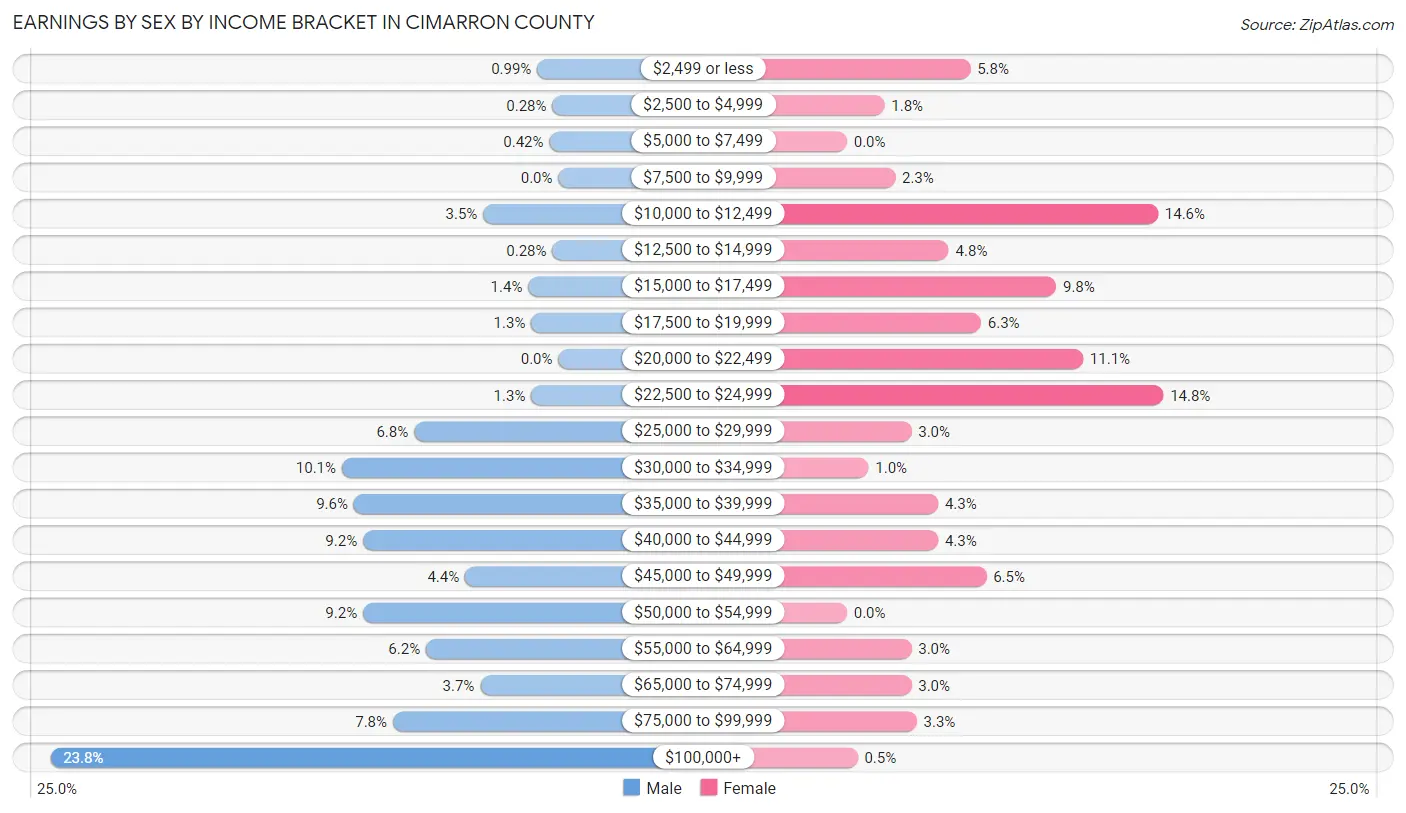
| Income | Male | Female |
| $2,499 or less | 7 (1.0%) | 23 (5.8%) |
| $2,500 to $4,999 | 2 (0.3%) | 7 (1.8%) |
| $5,000 to $7,499 | 3 (0.4%) | 0 (0.0%) |
| $7,500 to $9,999 | 0 (0.0%) | 9 (2.3%) |
| $10,000 to $12,499 | 25 (3.5%) | 58 (14.6%) |
| $12,500 to $14,999 | 2 (0.3%) | 19 (4.8%) |
| $15,000 to $17,499 | 10 (1.4%) | 39 (9.8%) |
| $17,500 to $19,999 | 9 (1.3%) | 25 (6.3%) |
| $20,000 to $22,499 | 0 (0.0%) | 44 (11.1%) |
| $22,500 to $24,999 | 9 (1.3%) | 59 (14.8%) |
| $25,000 to $29,999 | 48 (6.8%) | 12 (3.0%) |
| $30,000 to $34,999 | 72 (10.1%) | 4 (1.0%) |
| $35,000 to $39,999 | 68 (9.6%) | 17 (4.3%) |
| $40,000 to $44,999 | 65 (9.1%) | 17 (4.3%) |
| $45,000 to $49,999 | 31 (4.4%) | 26 (6.5%) |
| $50,000 to $54,999 | 65 (9.1%) | 0 (0.0%) |
| $55,000 to $64,999 | 44 (6.2%) | 12 (3.0%) |
| $65,000 to $74,999 | 26 (3.7%) | 12 (3.0%) |
| $75,000 to $99,999 | 55 (7.7%) | 13 (3.3%) |
| $100,000+ | 169 (23.8%) | 2 (0.5%) |
| Total | 710 (100.0%) | 398 (100.0%) |
Earnings by Sex by Educational Attainment in Cimarron County
Average earnings in Cimarron County are $51,190 for men and $20,170 for women, a difference of 60.6%. Men with an educational attainment of bachelor's degree enjoy the highest average annual earnings of $112,688, while those with less than high school education earn the least with $36,429. Women with an educational attainment of college or associate's degree earn the most with the average annual earnings of $44,167, while those with graduate degree education have the smallest earnings of $16,625.
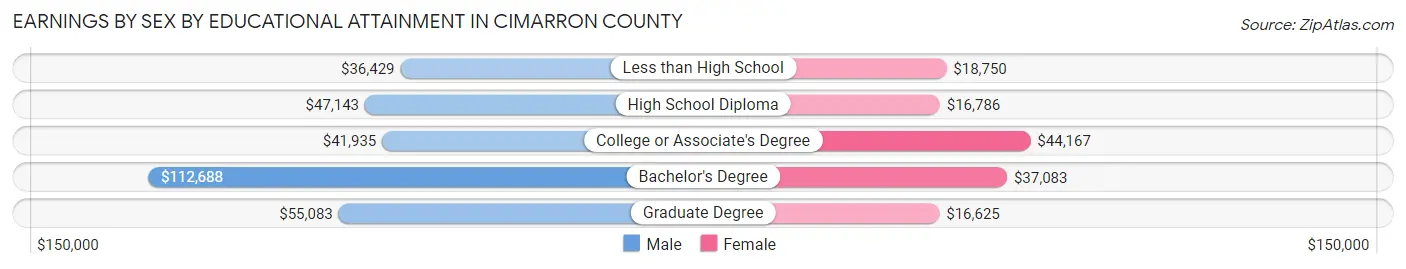
| Educational Attainment | Male Income | Female Income |
| Less than High School | $36,429 | $18,750 |
| High School Diploma | $47,143 | $16,786 |
| College or Associate's Degree | $41,935 | $44,167 |
| Bachelor's Degree | $112,688 | $37,083 |
| Graduate Degree | $55,083 | $16,625 |
| Total | $51,190 | $20,170 |
Family Income in Cimarron County
Family Income Brackets in Cimarron County
According to the Cimarron County family income data, there are 149 families falling into the $50,000 to $74,999 income range, which is the most common income bracket and makes up 29.4% of all families. Conversely, the less than $10,000 income bracket is the least frequent group with only 1 families (0.2%) belonging to this category.
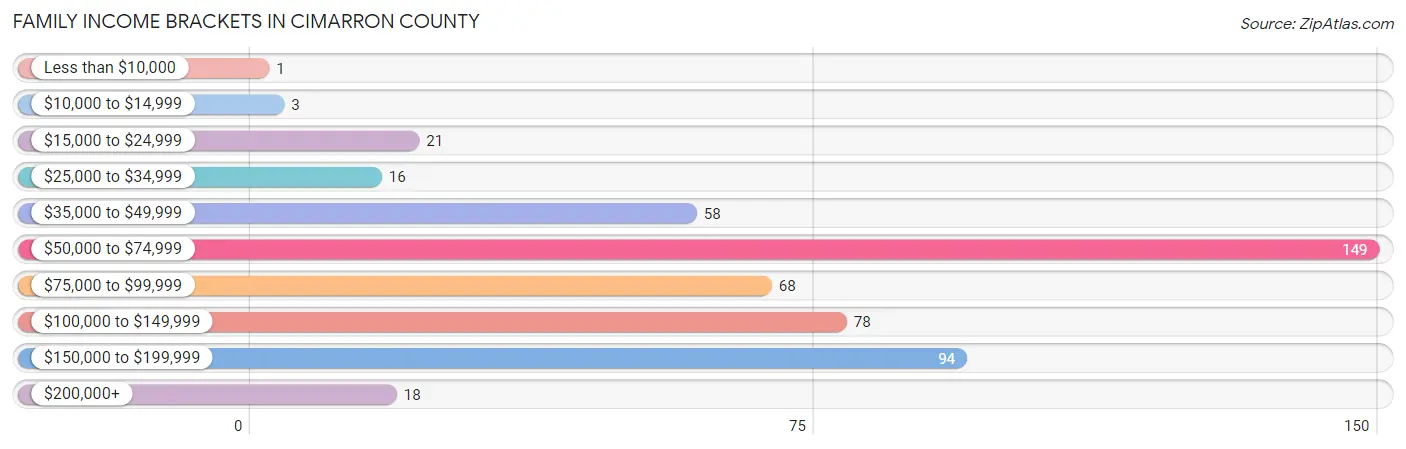
| Income Bracket | # Families | % Families |
| Less than $10,000 | 1 | 0.2% |
| $10,000 to $14,999 | 3 | 0.6% |
| $15,000 to $24,999 | 21 | 4.2% |
| $25,000 to $34,999 | 16 | 3.2% |
| $35,000 to $49,999 | 58 | 11.5% |
| $50,000 to $74,999 | 149 | 29.4% |
| $75,000 to $99,999 | 68 | 13.4% |
| $100,000 to $149,999 | 78 | 15.4% |
| $150,000 to $199,999 | 94 | 18.6% |
| $200,000+ | 18 | 3.6% |
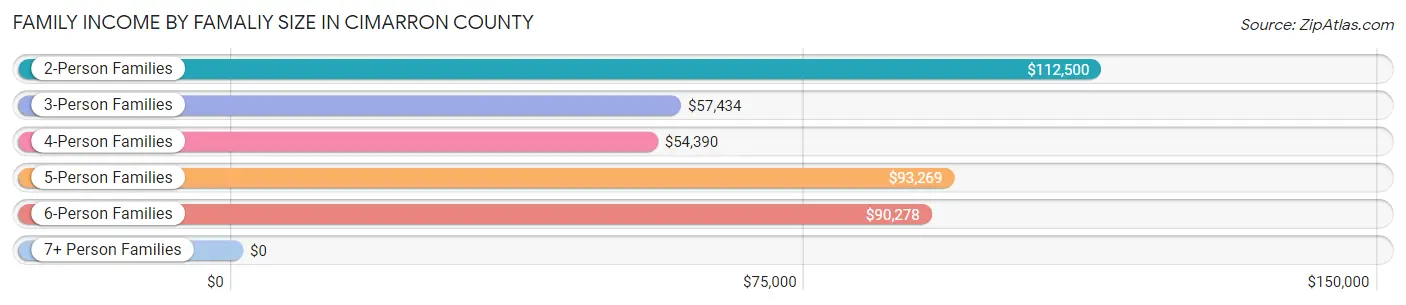
Family Income by Famaliy Size in Cimarron County
2-person families (300 | 59.3%) account for the highest median family income in Cimarron County with $112,500 per family, while 2-person families (300 | 59.3%) have the highest median income of $56,250 per family member.
| Income Bracket | # Families | Median Income |
| 2-Person Families | 300 (59.3%) | $112,500 |
| 3-Person Families | 61 (12.1%) | $57,434 |
| 4-Person Families | 78 (15.4%) | $54,390 |
| 5-Person Families | 28 (5.5%) | $93,269 |
| 6-Person Families | 28 (5.5%) | $90,278 |
| 7+ Person Families | 11 (2.2%) | $0 |
| Total | 506 (100.0%) | $76,786 |
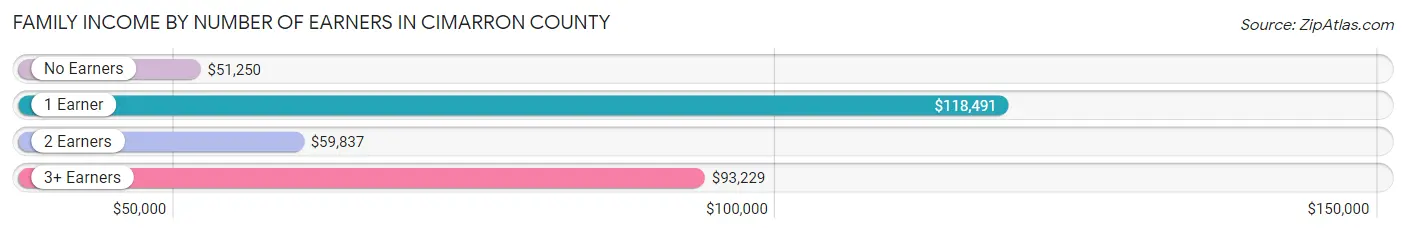
Family Income by Number of Earners in Cimarron County
The median family income in Cimarron County is $76,786, with families comprising 1 earner (203) having the highest median family income of $118,491, while families with no earners (72) have the lowest median family income of $51,250, accounting for 40.1% and 14.2% of families, respectively.
| Number of Earners | # Families | Median Income |
| No Earners | 72 (14.2%) | $51,250 |
| 1 Earner | 203 (40.1%) | $118,491 |
| 2 Earners | 169 (33.4%) | $59,837 |
| 3+ Earners | 62 (12.2%) | $93,229 |
| Total | 506 (100.0%) | $76,786 |
Household Income in Cimarron County
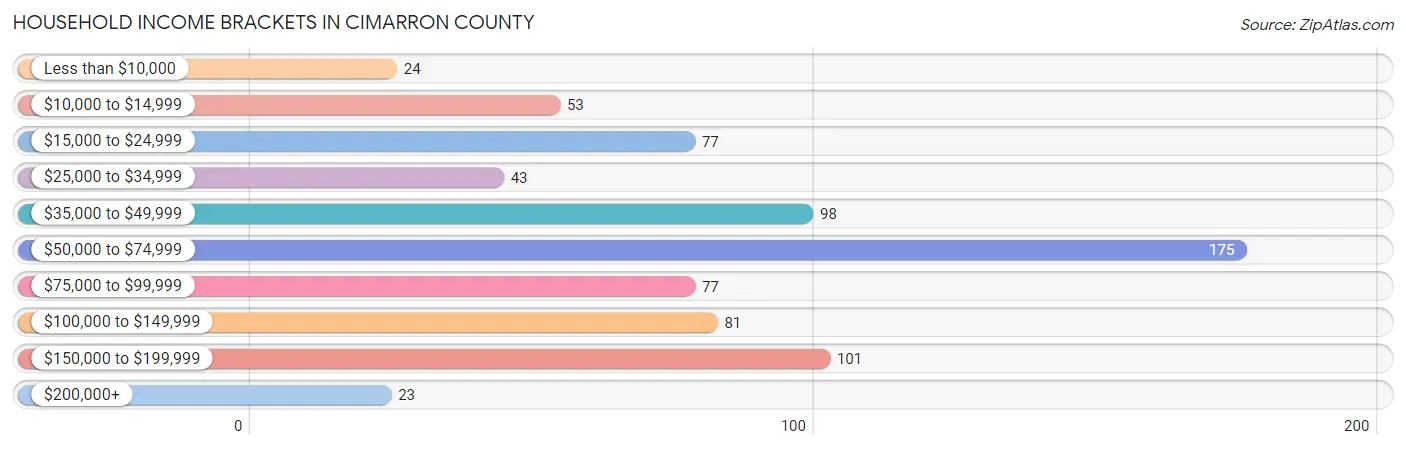
Household Income Brackets in Cimarron County
With 175 households falling in the category, the $50,000 to $74,999 income range is the most frequent in Cimarron County, accounting for 23.3% of all households. In contrast, only 23 households (3.1%) fall into the $200,000+ income bracket, making it the least populous group.
| Income Bracket | # Households | % Households |
| Less than $10,000 | 24 | 3.2% |
| $10,000 to $14,999 | 53 | 7.0% |
| $15,000 to $24,999 | 77 | 10.2% |
| $25,000 to $34,999 | 43 | 5.7% |
| $35,000 to $49,999 | 98 | 13.0% |
| $50,000 to $74,999 | 175 | 23.3% |
| $75,000 to $99,999 | 77 | 10.2% |
| $100,000 to $149,999 | 81 | 10.8% |
| $150,000 to $199,999 | 101 | 13.4% |
| $200,000+ | 23 | 3.1% |
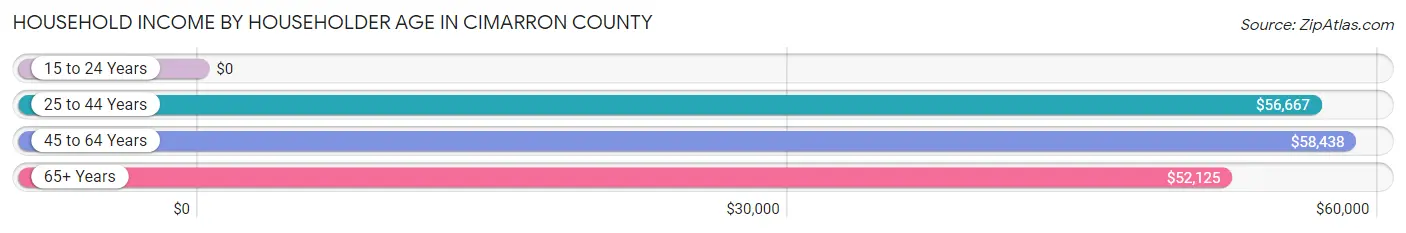
Household Income by Householder Age in Cimarron County
The median household income in Cimarron County is $57,100, with the highest median household income of $58,438 found in the 45 to 64 years age bracket for the primary householder. A total of 208 households (27.7%) fall into this category. Meanwhile, the 15 to 24 years age bracket for the primary householder has the lowest median household income of $0, with 7 households (0.9%) in this group.
| Income Bracket | # Households | Median Income |
| 15 to 24 Years | 7 (0.9%) | $0 |
| 25 to 44 Years | 136 (18.1%) | $56,667 |
| 45 to 64 Years | 208 (27.7%) | $58,438 |
| 65+ Years | 401 (53.3%) | $52,125 |
| Total | 752 (100.0%) | $57,100 |
Poverty in Cimarron County
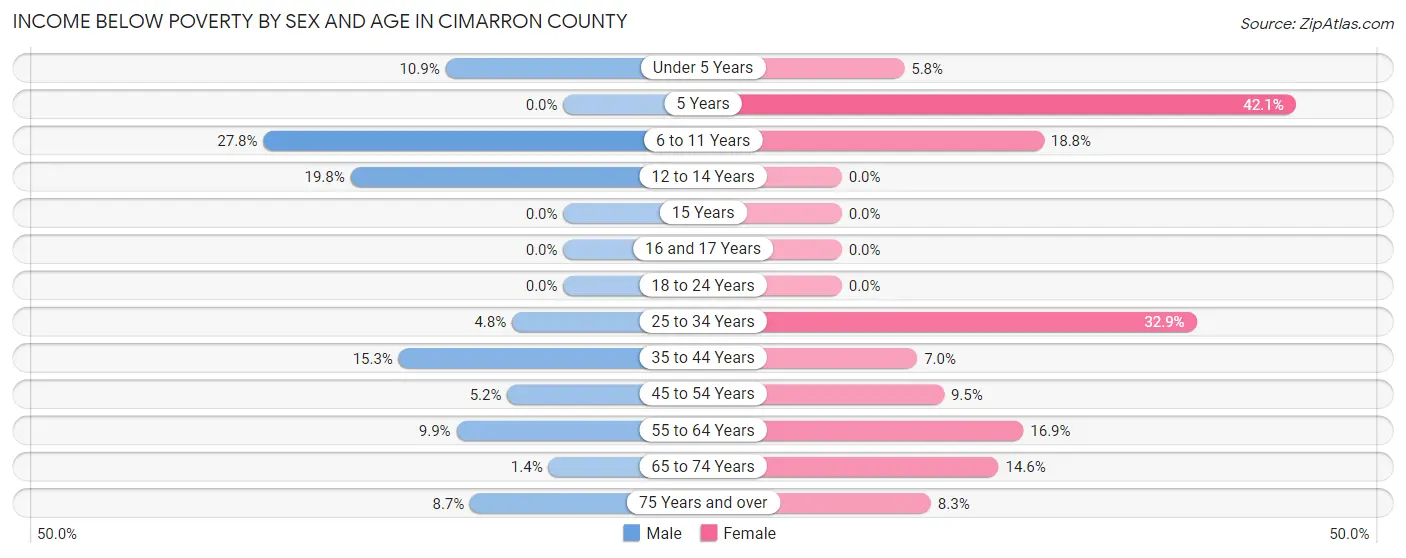
Income Below Poverty by Sex and Age in Cimarron County
With 8.9% poverty level for males and 13.0% for females among the residents of Cimarron County, 6 to 11 year old males and 5 year old females are the most vulnerable to poverty, with 27 males (27.8%) and 8 females (42.1%) in their respective age groups living below the poverty level.
| Age Bracket | Male | Female |
| Under 5 Years | 7 (10.9%) | 4 (5.8%) |
| 5 Years | 0 (0.0%) | 8 (42.1%) |
| 6 to 11 Years | 27 (27.8%) | 24 (18.8%) |
| 12 to 14 Years | 16 (19.8%) | 0 (0.0%) |
| 15 Years | 0 (0.0%) | 0 (0.0%) |
| 16 and 17 Years | 0 (0.0%) | 0 (0.0%) |
| 18 to 24 Years | 0 (0.0%) | 0 (0.0%) |
| 25 to 34 Years | 7 (4.8%) | 26 (32.9%) |
| 35 to 44 Years | 11 (15.3%) | 7 (7.0%) |
| 45 to 54 Years | 9 (5.2%) | 11 (9.5%) |
| 55 to 64 Years | 13 (9.9%) | 30 (16.9%) |
| 65 to 74 Years | 2 (1.4%) | 24 (14.5%) |
| 75 Years and over | 9 (8.6%) | 11 (8.3%) |
| Total | 101 (8.9%) | 145 (13.0%) |
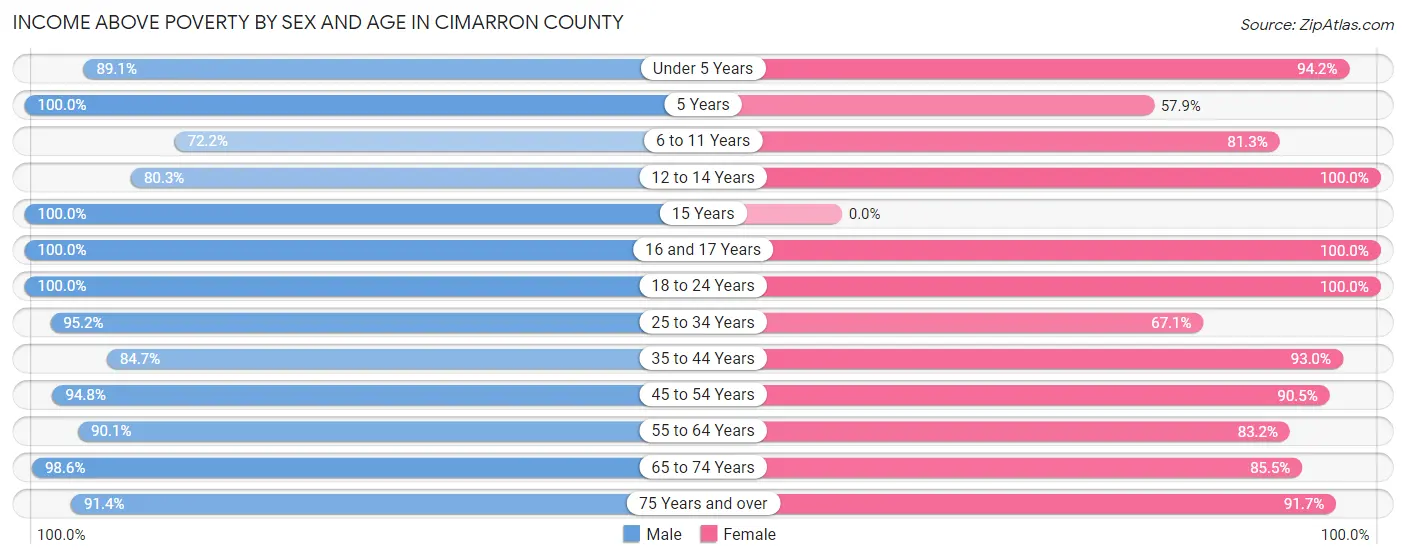
Income Above Poverty by Sex and Age in Cimarron County
According to the poverty statistics in Cimarron County, males aged 5 years and females aged 12 to 14 years are the age groups that are most secure financially, with 100.0% of males and 100.0% of females in these age groups living above the poverty line.
| Age Bracket | Male | Female |
| Under 5 Years | 57 (89.1%) | 65 (94.2%) |
| 5 Years | 6 (100.0%) | 11 (57.9%) |
| 6 to 11 Years | 70 (72.2%) | 104 (81.2%) |
| 12 to 14 Years | 65 (80.2%) | 30 (100.0%) |
| 15 Years | 3 (100.0%) | 0 (0.0%) |
| 16 and 17 Years | 20 (100.0%) | 34 (100.0%) |
| 18 to 24 Years | 91 (100.0%) | 68 (100.0%) |
| 25 to 34 Years | 140 (95.2%) | 53 (67.1%) |
| 35 to 44 Years | 61 (84.7%) | 93 (93.0%) |
| 45 to 54 Years | 164 (94.8%) | 105 (90.5%) |
| 55 to 64 Years | 118 (90.1%) | 148 (83.2%) |
| 65 to 74 Years | 143 (98.6%) | 141 (85.5%) |
| 75 Years and over | 95 (91.3%) | 122 (91.7%) |
| Total | 1,033 (91.1%) | 974 (87.0%) |
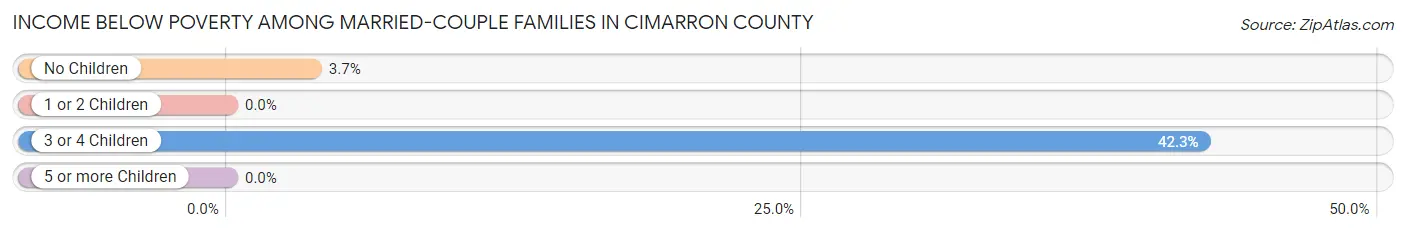
Income Below Poverty Among Married-Couple Families in Cimarron County
The poverty statistics for married-couple families in Cimarron County show that 4.8% or 22 of the total 459 families live below the poverty line. Families with 3 or 4 children have the highest poverty rate of 42.3%, comprising of 11 families. On the other hand, families with 1 or 2 children have the lowest poverty rate of 0.0%, which includes 0 families.
| Children | Above Poverty | Below Poverty |
| No Children | 290 (96.4%) | 11 (3.6%) |
| 1 or 2 Children | 132 (100.0%) | 0 (0.0%) |
| 3 or 4 Children | 15 (57.7%) | 11 (42.3%) |
| 5 or more Children | 0 (0.0%) | 0 (0.0%) |
| Total | 437 (95.2%) | 22 (4.8%) |
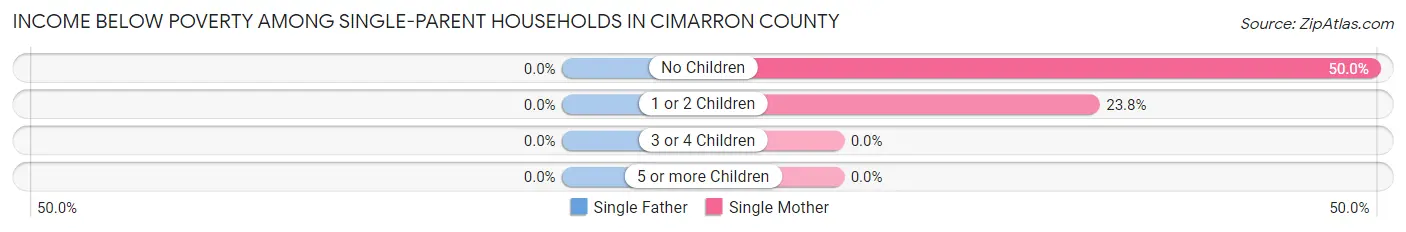
Income Below Poverty Among Single-Parent Households in Cimarron County
| Children | Single Father | Single Mother |
| No Children | 0 (0.0%) | 3 (50.0%) |
| 1 or 2 Children | 0 (0.0%) | 5 (23.8%) |
| 3 or 4 Children | 0 (0.0%) | 0 (0.0%) |
| 5 or more Children | 0 (0.0%) | 0 (0.0%) |
| Total | 0 (0.0%) | 8 (21.0%) |
Income Below Poverty Among Married-Couple vs Single-Parent Households in Cimarron County
The poverty data for Cimarron County shows that 22 of the married-couple family households (4.8%) and 8 of the single-parent households (17.0%) are living below the poverty level. Within the married-couple family households, those with 3 or 4 children have the highest poverty rate, with 11 households (42.3%) falling below the poverty line. Among the single-parent households, those with 1 or 2 children have the highest poverty rate, with 5 household (22.7%) living below poverty.
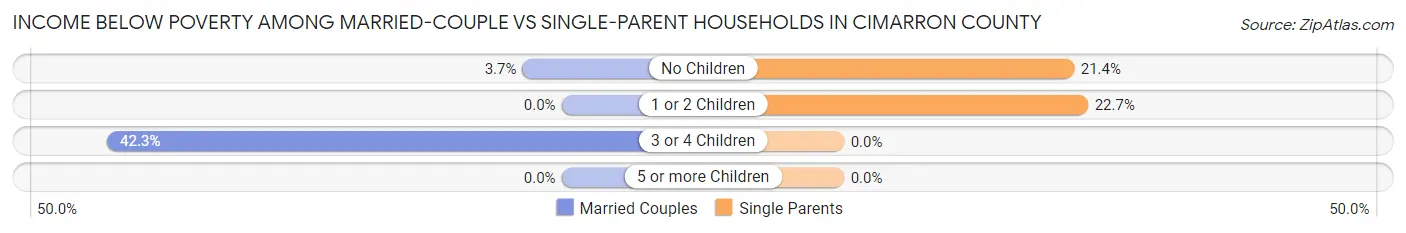
| Children | Married-Couple Families | Single-Parent Households |
| No Children | 11 (3.6%) | 3 (21.4%) |
| 1 or 2 Children | 0 (0.0%) | 5 (22.7%) |
| 3 or 4 Children | 11 (42.3%) | 0 (0.0%) |
| 5 or more Children | 0 (0.0%) | 0 (0.0%) |
| Total | 22 (4.8%) | 8 (17.0%) |
Race in Cimarron County
The most populous races in Cimarron County are White / Caucasian (2,025 | 89.1%), Hispanic or Latino (544 | 23.9%), and Two or more Races (231 | 10.2%).
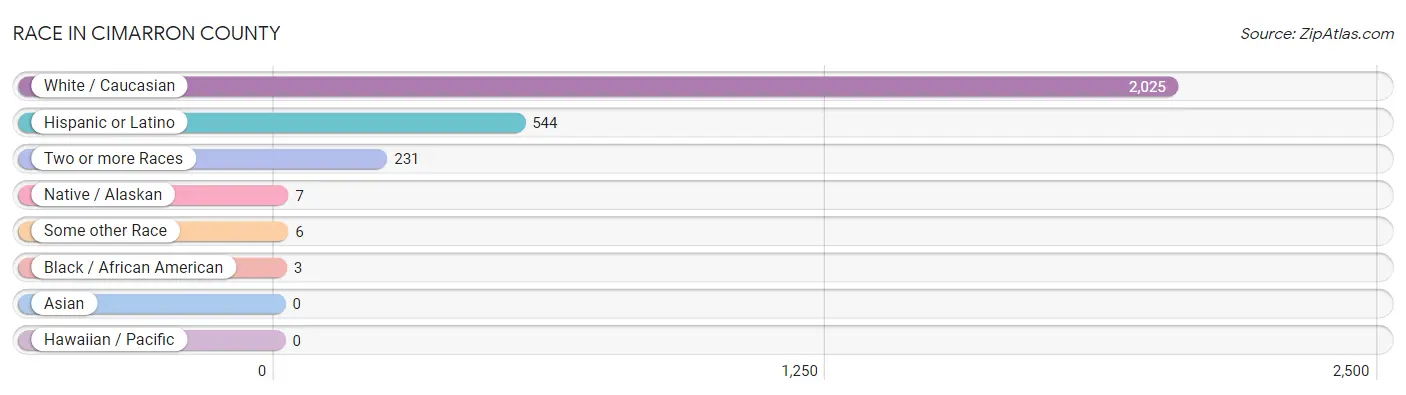
| Race | # Population | % Population |
| Asian | 0 | 0.0% |
| Black / African American | 3 | 0.1% |
| Hawaiian / Pacific | 0 | 0.0% |
| Hispanic or Latino | 544 | 23.9% |
| Native / Alaskan | 7 | 0.3% |
| White / Caucasian | 2,025 | 89.1% |
| Two or more Races | 231 | 10.2% |
| Some other Race | 6 | 0.3% |
| Total | 2,272 | 100.0% |
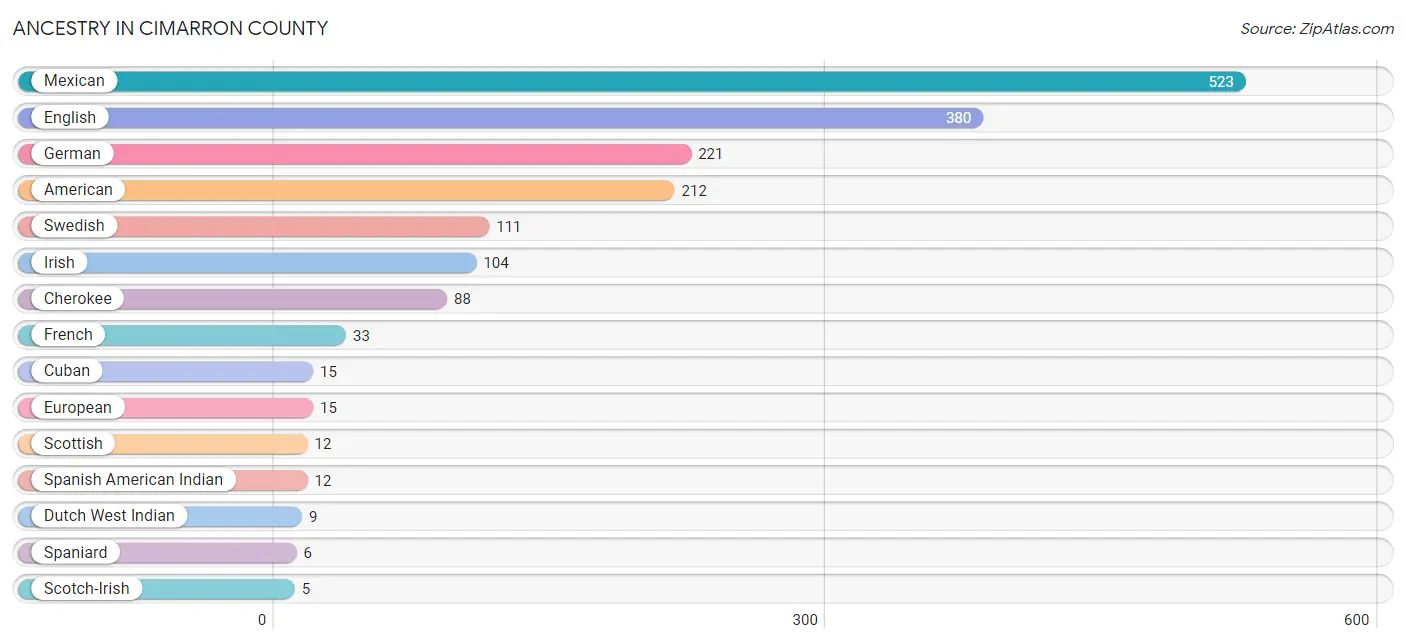
Ancestry in Cimarron County
The most populous ancestries reported in Cimarron County are Mexican (523 | 23.0%), English (380 | 16.7%), German (221 | 9.7%), American (212 | 9.3%), and Swedish (111 | 4.9%), together accounting for 63.7% of all Cimarron County residents.
| Ancestry | # Population | % Population |
| American | 212 | 9.3% |
| Austrian | 2 | 0.1% |
| British | 1 | 0.0% |
| Canadian | 3 | 0.1% |
| Cherokee | 88 | 3.9% |
| Cuban | 15 | 0.7% |
| Czechoslovakian | 1 | 0.0% |
| Dutch | 4 | 0.2% |
| Dutch West Indian | 9 | 0.4% |
| English | 380 | 16.7% |
| European | 15 | 0.7% |
| French | 33 | 1.5% |
| German | 221 | 9.7% |
| Irish | 104 | 4.6% |
| Mexican | 523 | 23.0% |
| Norwegian | 2 | 0.1% |
| Scotch-Irish | 5 | 0.2% |
| Scottish | 12 | 0.5% |
| Slovene | 5 | 0.2% |
| Spaniard | 6 | 0.3% |
| Spanish American Indian | 12 | 0.5% |
| Swedish | 111 | 4.9% |
| Welsh | 5 | 0.2% | View All 23 Rows |
Immigrants in Cimarron County
The most numerous immigrant groups reported in Cimarron County came from Central America (86 | 3.8%), Latin America (86 | 3.8%), Mexico (86 | 3.8%), England (1 | 0.0%), and Europe (1 | 0.0%), together accounting for 11.5% of all Cimarron County residents.
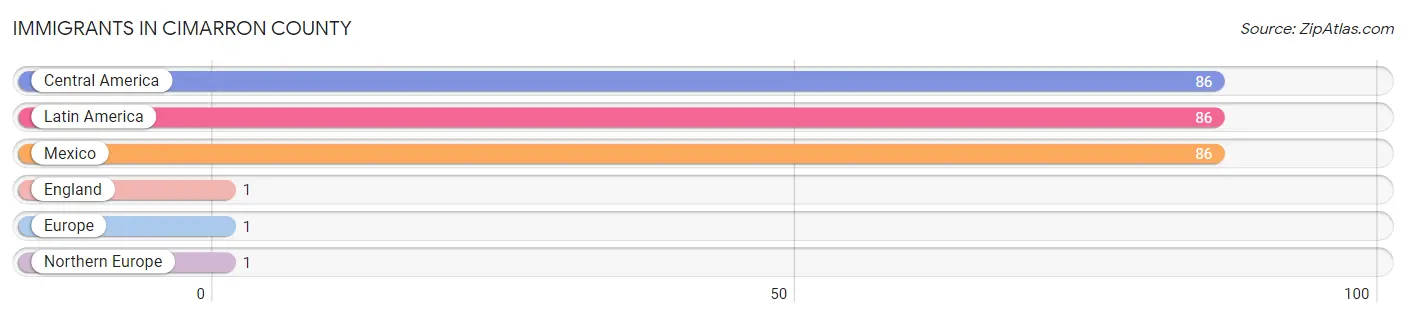
| Immigration Origin | # Population | % Population |
| Central America | 86 | 3.8% |
| England | 1 | 0.0% |
| Europe | 1 | 0.0% |
| Latin America | 86 | 3.8% |
| Mexico | 86 | 3.8% |
| Northern Europe | 1 | 0.0% | View All 6 Rows |
Sex and Age in Cimarron County
Sex and Age in Cimarron County
The most populous age groups in Cimarron County are 45 to 49 Years (128 | 11.1%) for men and 70 to 74 Years (108 | 9.6%) for women.
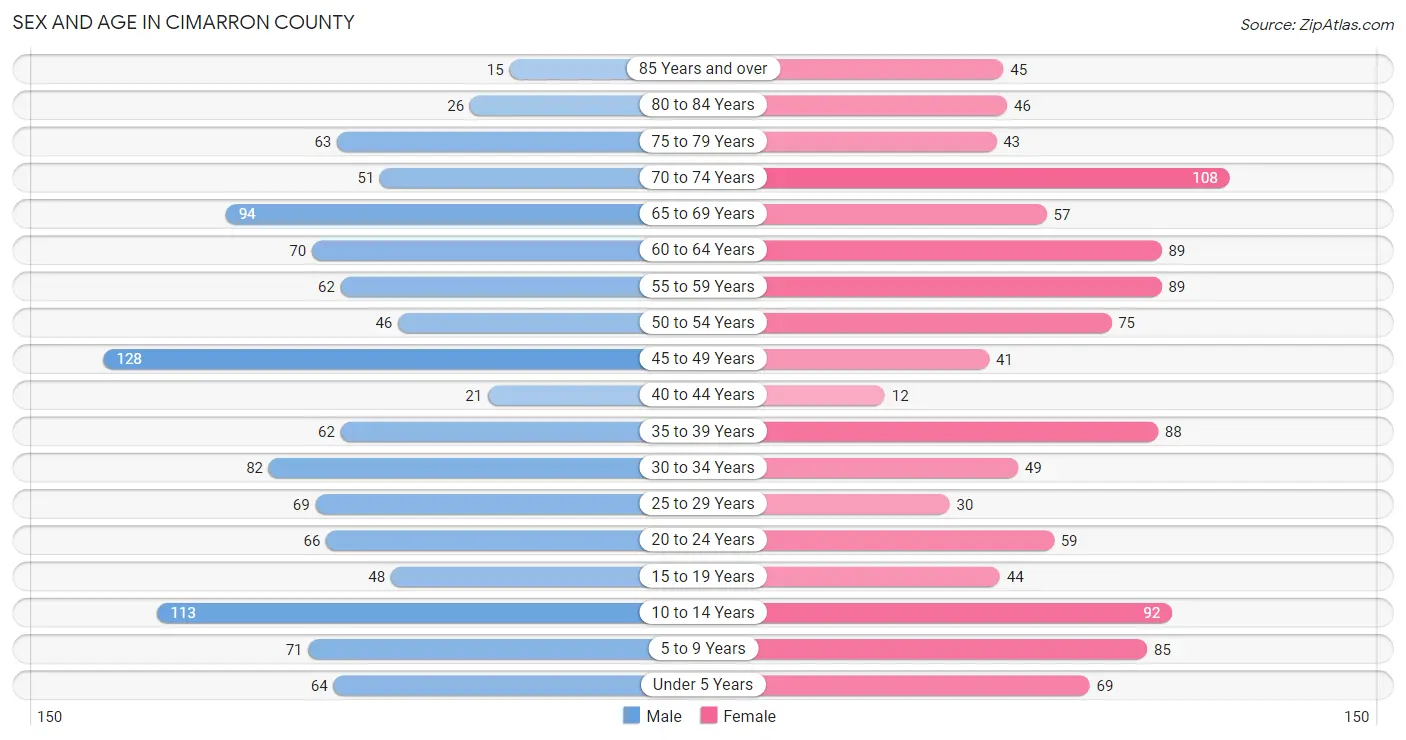
| Age Bracket | Male | Female |
| Under 5 Years | 64 (5.6%) | 69 (6.2%) |
| 5 to 9 Years | 71 (6.2%) | 85 (7.6%) |
| 10 to 14 Years | 113 (9.8%) | 92 (8.2%) |
| 15 to 19 Years | 48 (4.2%) | 44 (3.9%) |
| 20 to 24 Years | 66 (5.7%) | 59 (5.3%) |
| 25 to 29 Years | 69 (6.0%) | 30 (2.7%) |
| 30 to 34 Years | 82 (7.1%) | 49 (4.4%) |
| 35 to 39 Years | 62 (5.4%) | 88 (7.9%) |
| 40 to 44 Years | 21 (1.8%) | 12 (1.1%) |
| 45 to 49 Years | 128 (11.1%) | 41 (3.7%) |
| 50 to 54 Years | 46 (4.0%) | 75 (6.7%) |
| 55 to 59 Years | 62 (5.4%) | 89 (7.9%) |
| 60 to 64 Years | 70 (6.1%) | 89 (7.9%) |
| 65 to 69 Years | 94 (8.2%) | 57 (5.1%) |
| 70 to 74 Years | 51 (4.4%) | 108 (9.6%) |
| 75 to 79 Years | 63 (5.5%) | 43 (3.8%) |
| 80 to 84 Years | 26 (2.3%) | 46 (4.1%) |
| 85 Years and over | 15 (1.3%) | 45 (4.0%) |
| Total | 1,151 (100.0%) | 1,121 (100.0%) |
Families and Households in Cimarron County
Median Family Size in Cimarron County
The median family size in Cimarron County is 3.75 persons per family, with single male/father families (9 | 1.8%) accounting for the largest median family size of 14.33 persons per family. On the other hand, married-couple families (459 | 90.7%) represent the smallest median family size with 3.24 persons per family.
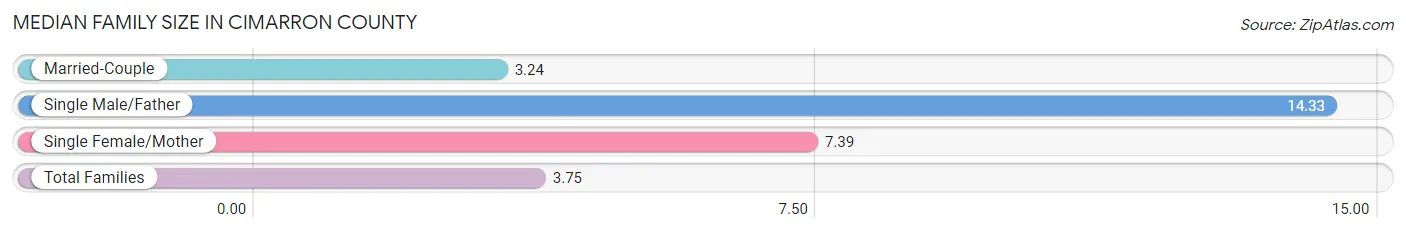
| Family Type | # Families | Family Size |
| Married-Couple | 459 (90.7%) | 3.24 |
| Single Male/Father | 9 (1.8%) | 14.33 |
| Single Female/Mother | 38 (7.5%) | 7.39 |
| Total Families | 506 (100.0%) | 3.75 |
Median Household Size in Cimarron County
The median household size in Cimarron County is 3.00 persons per household, with single male/father households (9 | 1.2%) accounting for the largest median household size of 14.33 persons per household. non-family households (246 | 32.7%) represent the smallest median household size with 1.17 persons per household.
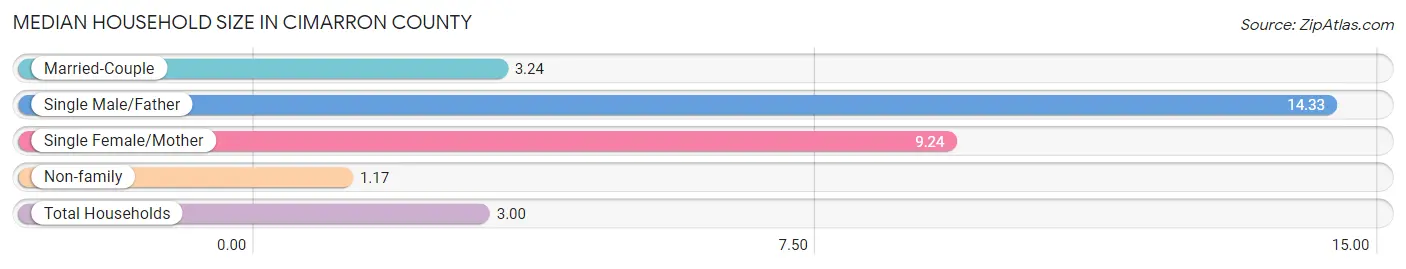
| Household Type | # Households | Household Size |
| Married-Couple | 459 (61.0%) | 3.24 |
| Single Male/Father | 9 (1.2%) | 14.33 |
| Single Female/Mother | 38 (5.1%) | 9.24 |
| Non-family | 246 (32.7%) | 1.17 |
| Total Households | 752 (100.0%) | 3.00 |
Household Size by Marriage Status in Cimarron County
Out of a total of 752 households in Cimarron County, 506 (67.3%) are family households, while 246 (32.7%) are nonfamily households. The most numerous type of family households are 2-person households, comprising 295, and the most common type of nonfamily households are 1-person households, comprising 227.
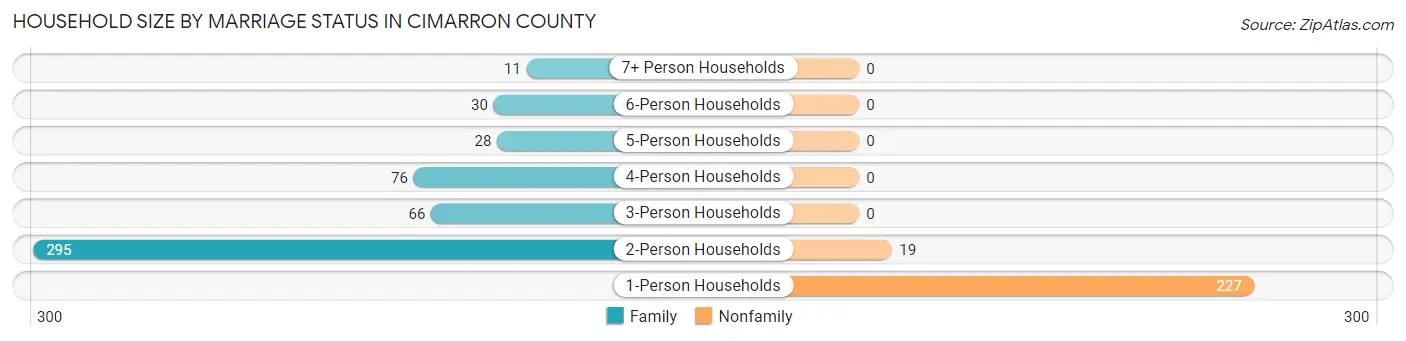
| Household Size | Family Households | Nonfamily Households |
| 1-Person Households | - | 227 (30.2%) |
| 2-Person Households | 295 (39.2%) | 19 (2.5%) |
| 3-Person Households | 66 (8.8%) | 0 (0.0%) |
| 4-Person Households | 76 (10.1%) | 0 (0.0%) |
| 5-Person Households | 28 (3.7%) | 0 (0.0%) |
| 6-Person Households | 30 (4.0%) | 0 (0.0%) |
| 7+ Person Households | 11 (1.5%) | 0 (0.0%) |
| Total | 506 (67.3%) | 246 (32.7%) |
Female Fertility in Cimarron County
Fertility by Age in Cimarron County
Average fertility rate in Cimarron County is 11.0 births per 1,000 women. Women in the age bracket of 20 to 34 years have the highest fertility rate with 29.0 births per 1,000 women. Women in the age bracket of 20 to 34 years acount for 100.0% of all women with births.
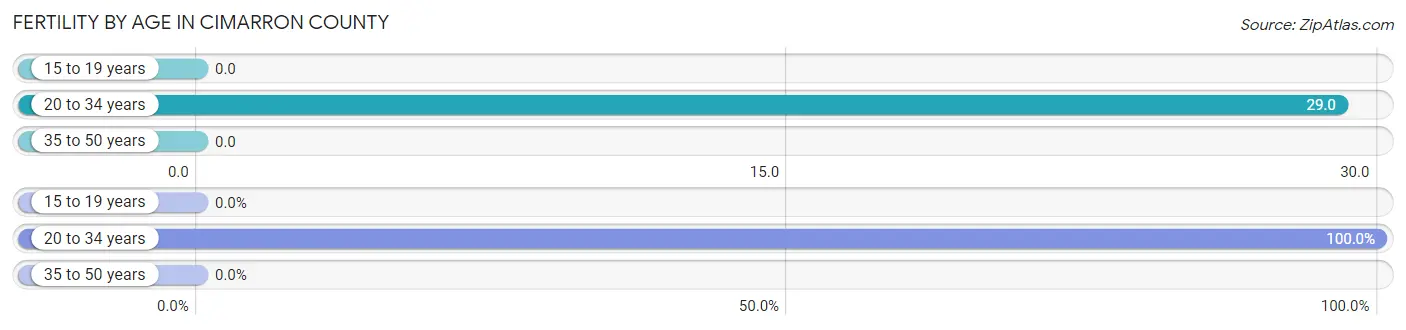
| Age Bracket | Women with Births | Births / 1,000 Women |
| 15 to 19 years | 0 (0.0%) | 0.0 |
| 20 to 34 years | 4 (100.0%) | 29.0 |
| 35 to 50 years | 0 (0.0%) | 0.0 |
| Total | 4 (100.0%) | 11.0 |
Fertility by Age by Marriage Status in Cimarron County
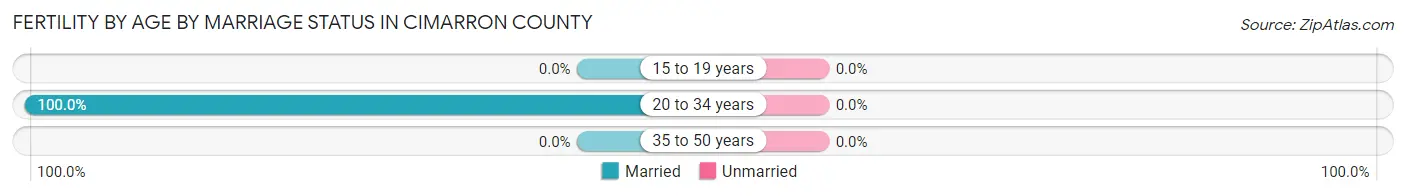
| Age Bracket | Married | Unmarried |
| 15 to 19 years | 0 (0.0%) | 0 (0.0%) |
| 20 to 34 years | 4 (100.0%) | 0 (0.0%) |
| 35 to 50 years | 0 (0.0%) | 0 (0.0%) |
| Total | 4 (100.0%) | 0 (0.0%) |
Fertility by Education in Cimarron County
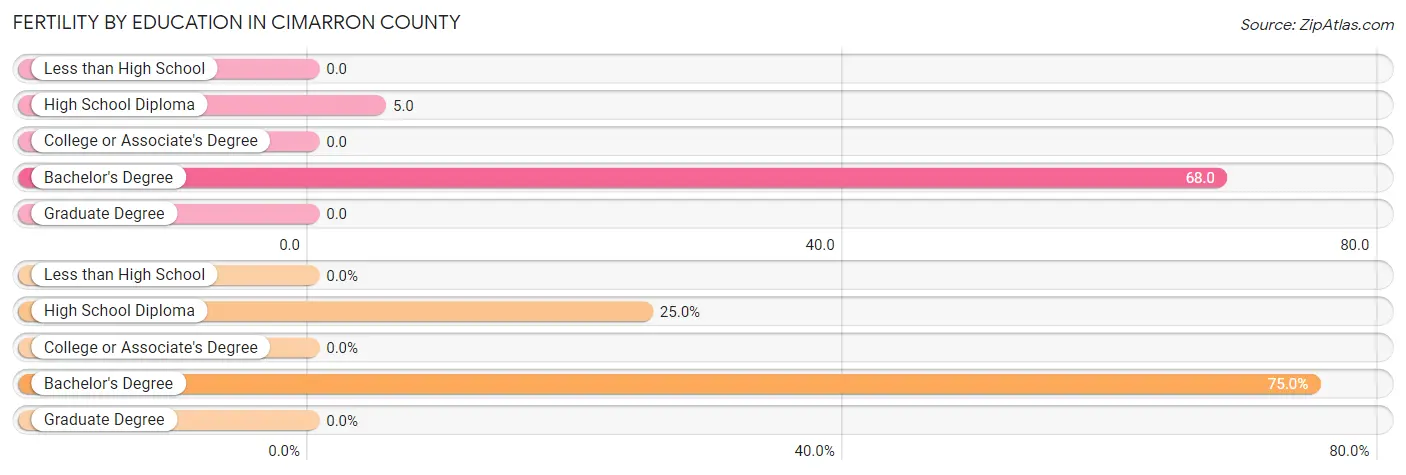
| Educational Attainment | Women with Births | Births / 1,000 Women |
| Less than High School | 0 (0.0%) | 0.0 |
| High School Diploma | 1 (25.0%) | 5.0 |
| College or Associate's Degree | 0 (0.0%) | 0.0 |
| Bachelor's Degree | 3 (75.0%) | 68.0 |
| Graduate Degree | 0 (0.0%) | 0.0 |
| Total | 4 (100.0%) | 11.0 |
Fertility by Education by Marriage Status in Cimarron County
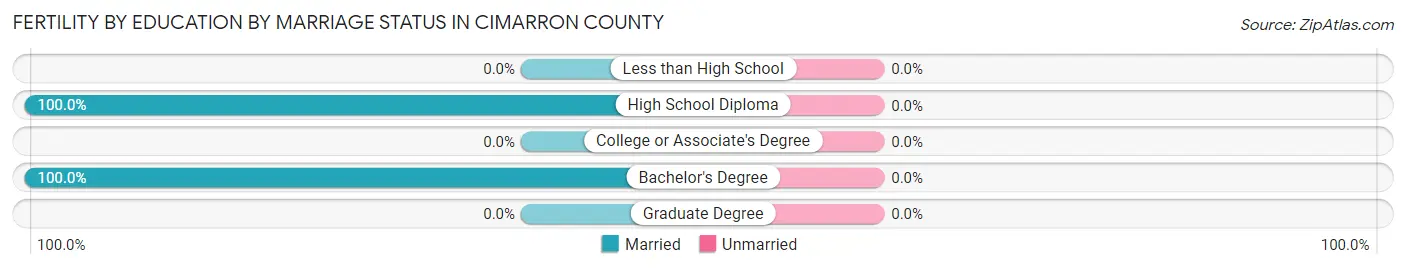
| Educational Attainment | Married | Unmarried |
| Less than High School | 0 (0.0%) | 0 (0.0%) |
| High School Diploma | 1 (100.0%) | 0 (0.0%) |
| College or Associate's Degree | 0 (0.0%) | 0 (0.0%) |
| Bachelor's Degree | 3 (100.0%) | 0 (0.0%) |
| Graduate Degree | 0 (0.0%) | 0 (0.0%) |
| Total | 4 (100.0%) | 0 (0.0%) |
Employment Characteristics in Cimarron County
Employment by Class of Employer in Cimarron County
Among the 1,082 employed individuals in Cimarron County, private company employees (464 | 42.9%), self-employed (not incorporated) (293 | 27.1%), and local government employees (170 | 15.7%) make up the most common classes of employment.
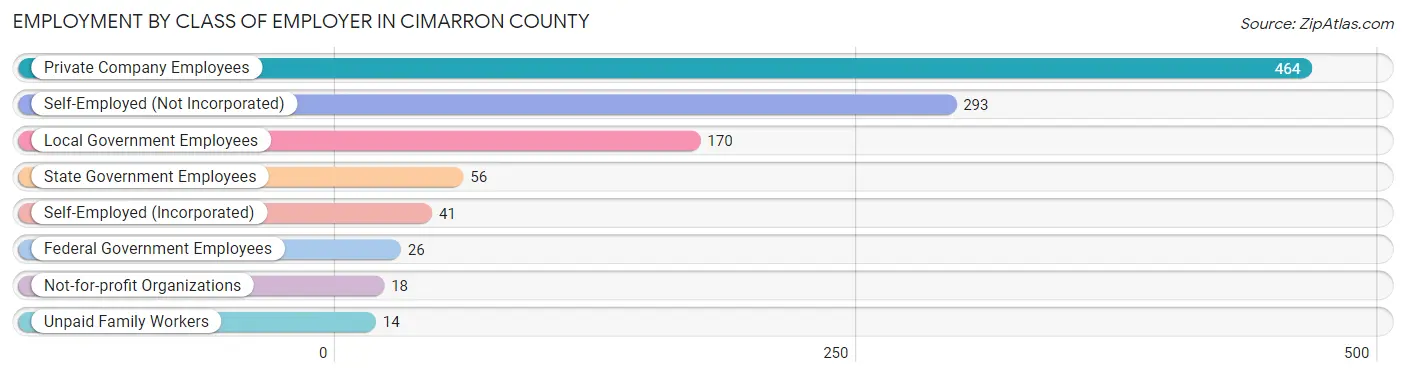
| Employer Class | # Employees | % Employees |
| Private Company Employees | 464 | 42.9% |
| Self-Employed (Incorporated) | 41 | 3.8% |
| Self-Employed (Not Incorporated) | 293 | 27.1% |
| Not-for-profit Organizations | 18 | 1.7% |
| Local Government Employees | 170 | 15.7% |
| State Government Employees | 56 | 5.2% |
| Federal Government Employees | 26 | 2.4% |
| Unpaid Family Workers | 14 | 1.3% |
| Total | 1,082 | 100.0% |
Employment Status by Age in Cimarron County
According to the labor force statistics for Cimarron County, out of the total population over 16 years of age (1,775), 61.2% or 1,086 individuals are in the labor force, with 0.2% or 2 of them unemployed. The age group with the highest labor force participation rate is 20 to 24 years, with 94.4% or 118 individuals in the labor force. Within the labor force, the 55 to 59 years age range has the highest percentage of unemployed individuals, with 0.8% or 1 of them being unemployed.
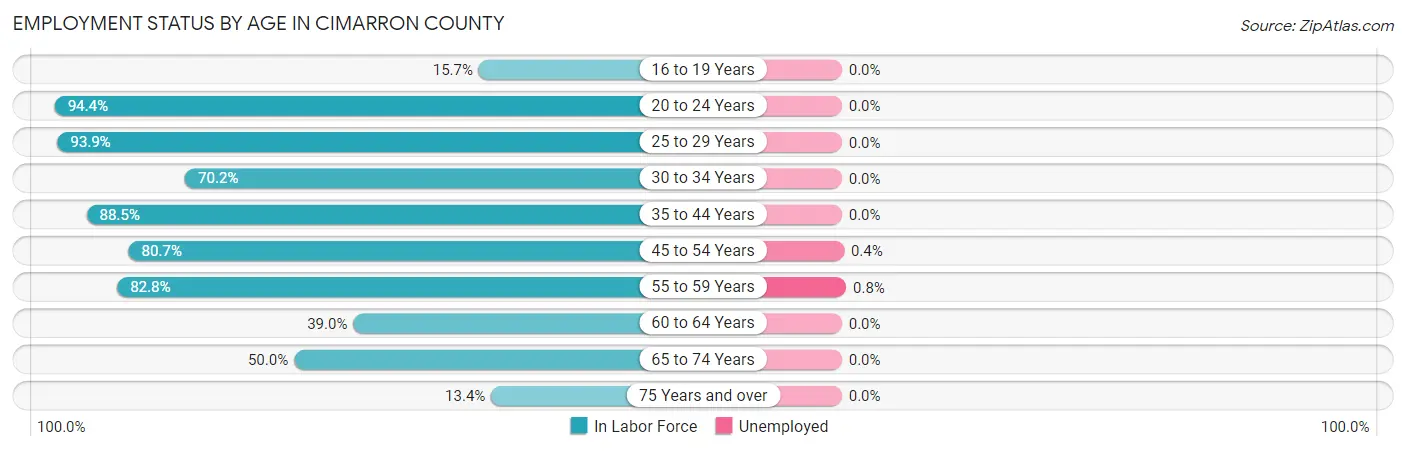
| Age Bracket | In Labor Force | Unemployed |
| 16 to 19 Years | 14 (15.7%) | 0 (0.0%) |
| 20 to 24 Years | 118 (94.4%) | 0 (0.0%) |
| 25 to 29 Years | 93 (93.9%) | 0 (0.0%) |
| 30 to 34 Years | 92 (70.2%) | 0 (0.0%) |
| 35 to 44 Years | 162 (88.5%) | 0 (0.0%) |
| 45 to 54 Years | 234 (80.7%) | 1 (0.4%) |
| 55 to 59 Years | 125 (82.8%) | 1 (0.8%) |
| 60 to 64 Years | 62 (39.0%) | 0 (0.0%) |
| 65 to 74 Years | 155 (50.0%) | 0 (0.0%) |
| 75 Years and over | 32 (13.4%) | 0 (0.0%) |
| Total | 1,086 (61.2%) | 2 (0.2%) |
Employment Status by Educational Attainment in Cimarron County
According to labor force statistics for Cimarron County, 75.8% of individuals (768) out of the total population between 25 and 64 years of age (1,013) are in the labor force, with 0.3% or 2 of them being unemployed. The group with the highest labor force participation rate are those with the educational attainment of high school diploma, with 89.9% or 382 individuals in the labor force. Within the labor force, individuals with college / associate degree education have the highest percentage of unemployment, with 0.7% or 1 of them being unemployed.
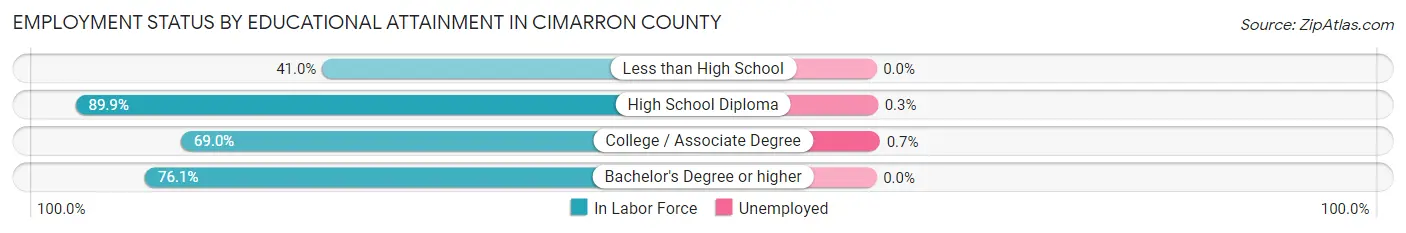
| Educational Attainment | In Labor Force | Unemployed |
| Less than High School | 55 (41.0%) | 0 (0.0%) |
| High School Diploma | 382 (89.9%) | 1 (0.3%) |
| College / Associate Degree | 140 (69.0%) | 1 (0.7%) |
| Bachelor's Degree or higher | 191 (76.1%) | 0 (0.0%) |
| Total | 768 (75.8%) | 3 (0.3%) |
Employment Occupations by Sex in Cimarron County
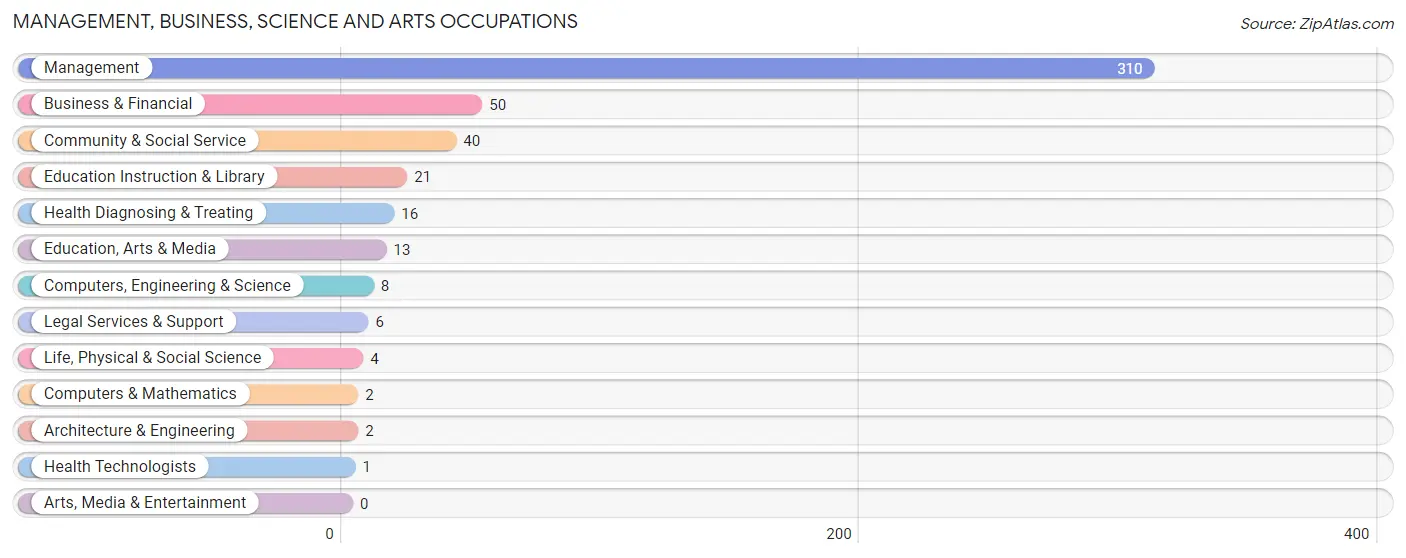
Management, Business, Science and Arts Occupations
The most common Management, Business, Science and Arts occupations in Cimarron County are Management (310 | 28.6%), Business & Financial (50 | 4.6%), Community & Social Service (40 | 3.7%), Education Instruction & Library (21 | 1.9%), and Health Diagnosing & Treating (16 | 1.5%).
Management, Business, Science and Arts Occupations by Sex
Within the Management, Business, Science and Arts occupations in Cimarron County, the most male-oriented occupations are Computers, Engineering & Science (100.0%), Computers & Mathematics (100.0%), and Architecture & Engineering (100.0%), while the most female-oriented occupations are Legal Services & Support (100.0%), Health Diagnosing & Treating (93.8%), and Education Instruction & Library (85.7%).
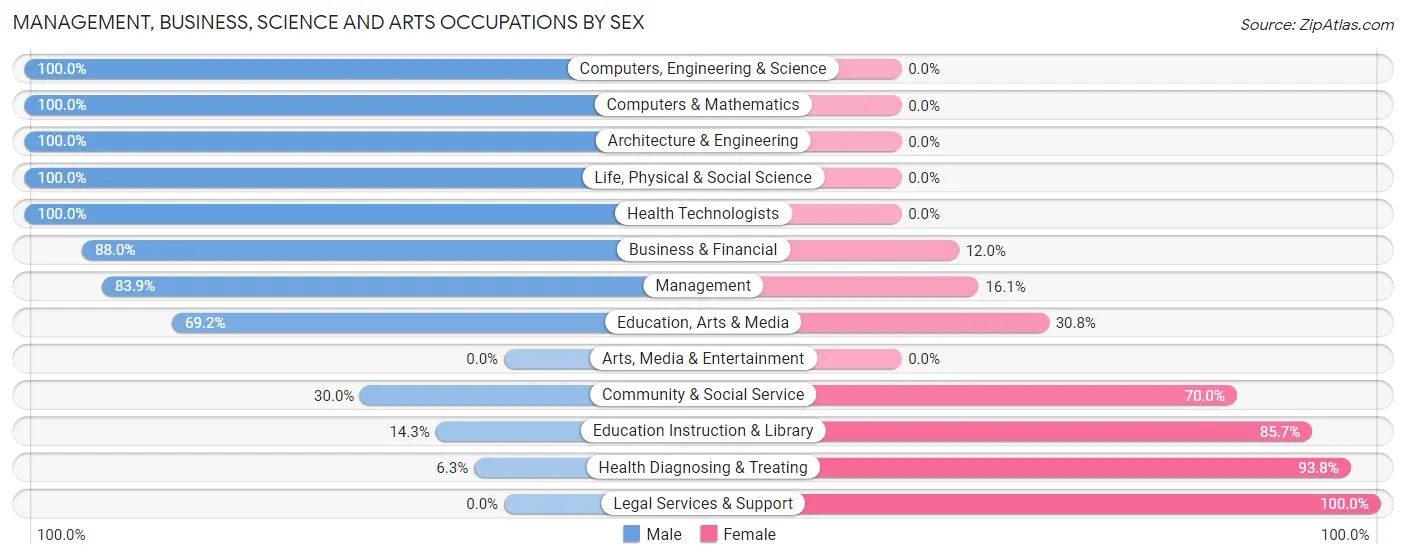
| Occupation | Male | Female |
| Management | 260 (83.9%) | 50 (16.1%) |
| Business & Financial | 44 (88.0%) | 6 (12.0%) |
| Computers, Engineering & Science | 8 (100.0%) | 0 (0.0%) |
| Computers & Mathematics | 2 (100.0%) | 0 (0.0%) |
| Architecture & Engineering | 2 (100.0%) | 0 (0.0%) |
| Life, Physical & Social Science | 4 (100.0%) | 0 (0.0%) |
| Community & Social Service | 12 (30.0%) | 28 (70.0%) |
| Education, Arts & Media | 9 (69.2%) | 4 (30.8%) |
| Legal Services & Support | 0 (0.0%) | 6 (100.0%) |
| Education Instruction & Library | 3 (14.3%) | 18 (85.7%) |
| Arts, Media & Entertainment | 0 (0.0%) | 0 (0.0%) |
| Health Diagnosing & Treating | 1 (6.2%) | 15 (93.8%) |
| Health Technologists | 1 (100.0%) | 0 (0.0%) |
| Total (Category) | 325 (76.6%) | 99 (23.4%) |
| Total (Overall) | 700 (64.5%) | 385 (35.5%) |
Services Occupations
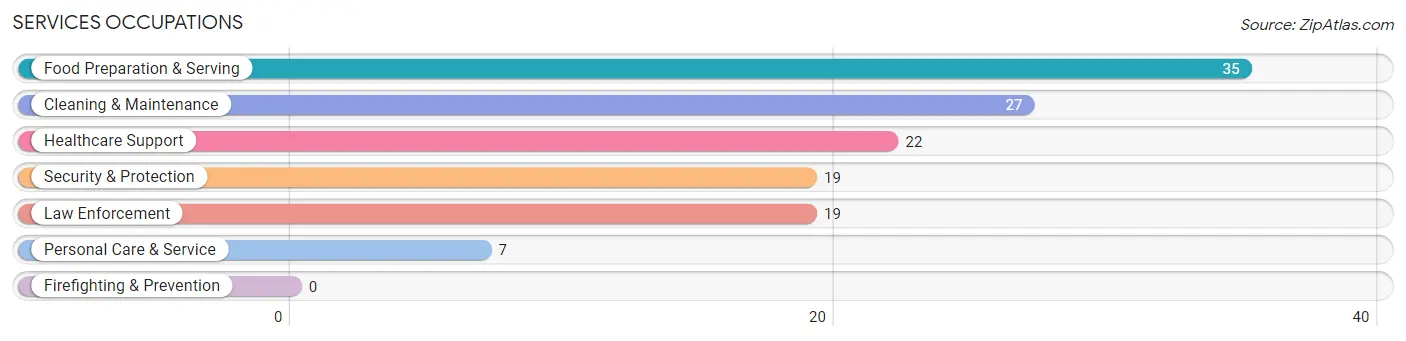
The most common Services occupations in Cimarron County are Food Preparation & Serving (35 | 3.2%), Cleaning & Maintenance (27 | 2.5%), Healthcare Support (22 | 2.0%), Security & Protection (19 | 1.8%), and Law Enforcement (19 | 1.8%).
Services Occupations by Sex
Within the Services occupations in Cimarron County, the most male-oriented occupations are Security & Protection (89.5%), Law Enforcement (89.5%), and Personal Care & Service (85.7%), while the most female-oriented occupations are Healthcare Support (100.0%), Food Preparation & Serving (100.0%), and Cleaning & Maintenance (81.5%).
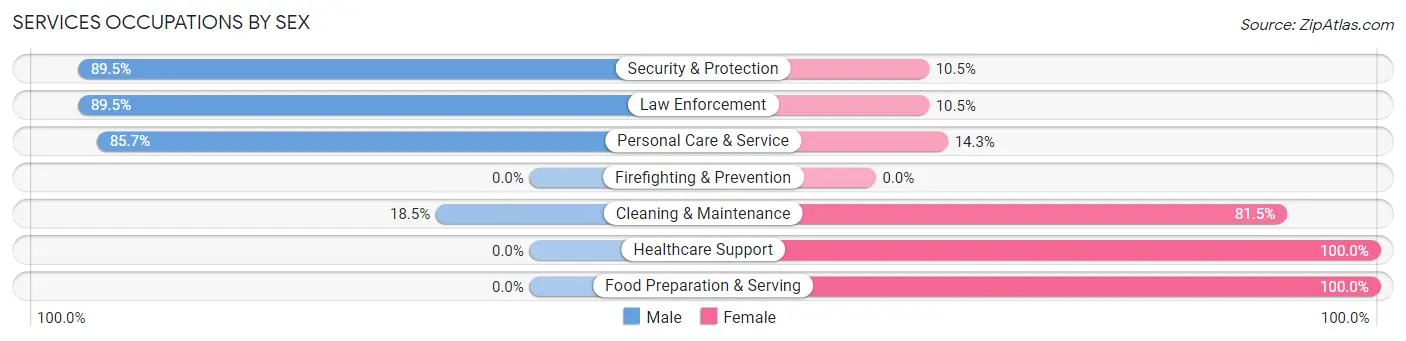
| Occupation | Male | Female |
| Healthcare Support | 0 (0.0%) | 22 (100.0%) |
| Security & Protection | 17 (89.5%) | 2 (10.5%) |
| Firefighting & Prevention | 0 (0.0%) | 0 (0.0%) |
| Law Enforcement | 17 (89.5%) | 2 (10.5%) |
| Food Preparation & Serving | 0 (0.0%) | 35 (100.0%) |
| Cleaning & Maintenance | 5 (18.5%) | 22 (81.5%) |
| Personal Care & Service | 6 (85.7%) | 1 (14.3%) |
| Total (Category) | 28 (25.5%) | 82 (74.6%) |
| Total (Overall) | 700 (64.5%) | 385 (35.5%) |
Sales and Office Occupations
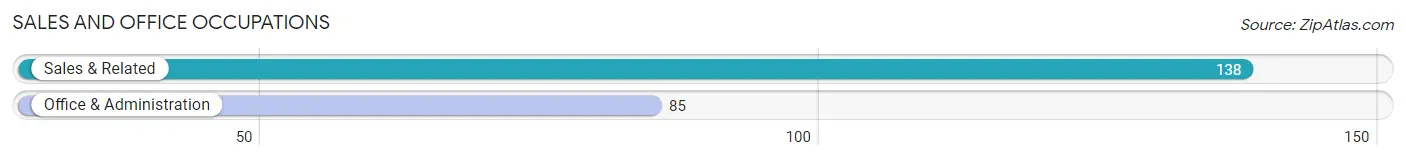
The most common Sales and Office occupations in Cimarron County are Sales & Related (138 | 12.7%), and Office & Administration (85 | 7.8%).
Sales and Office Occupations by Sex

| Occupation | Male | Female |
| Sales & Related | 58 (42.0%) | 80 (58.0%) |
| Office & Administration | 16 (18.8%) | 69 (81.2%) |
| Total (Category) | 74 (33.2%) | 149 (66.8%) |
| Total (Overall) | 700 (64.5%) | 385 (35.5%) |
Natural Resources, Construction and Maintenance Occupations
The most common Natural Resources, Construction and Maintenance occupations in Cimarron County are Farming, Fishing & Forestry (65 | 6.0%), Construction & Extraction (53 | 4.9%), and Installation, Maintenance & Repair (50 | 4.6%).
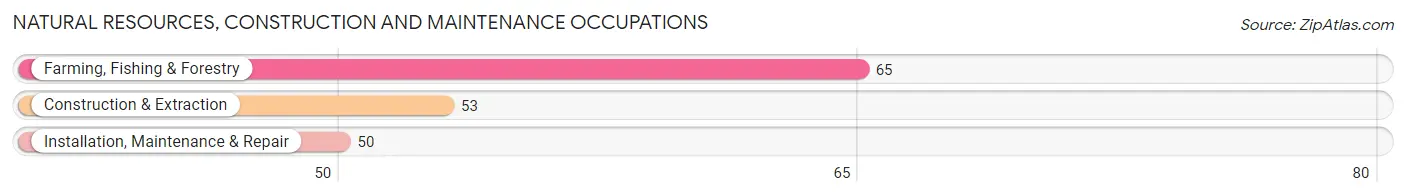
Natural Resources, Construction and Maintenance Occupations by Sex
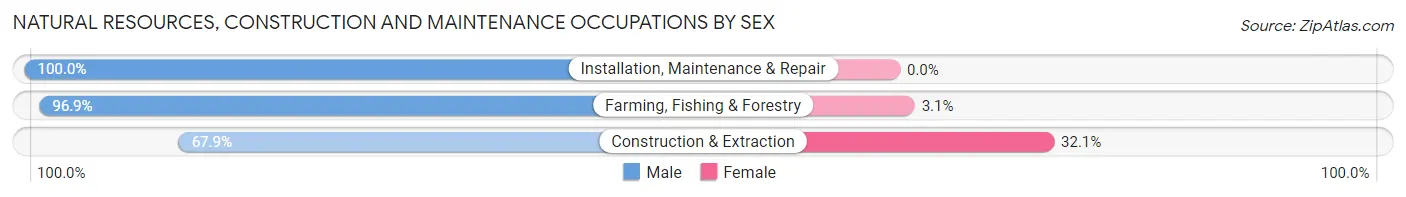
| Occupation | Male | Female |
| Farming, Fishing & Forestry | 63 (96.9%) | 2 (3.1%) |
| Construction & Extraction | 36 (67.9%) | 17 (32.1%) |
| Installation, Maintenance & Repair | 50 (100.0%) | 0 (0.0%) |
| Total (Category) | 149 (88.7%) | 19 (11.3%) |
| Total (Overall) | 700 (64.5%) | 385 (35.5%) |
Production, Transportation and Moving Occupations
The most common Production, Transportation and Moving occupations in Cimarron County are Material Moving (78 | 7.2%), Transportation (74 | 6.8%), and Production (8 | 0.7%).
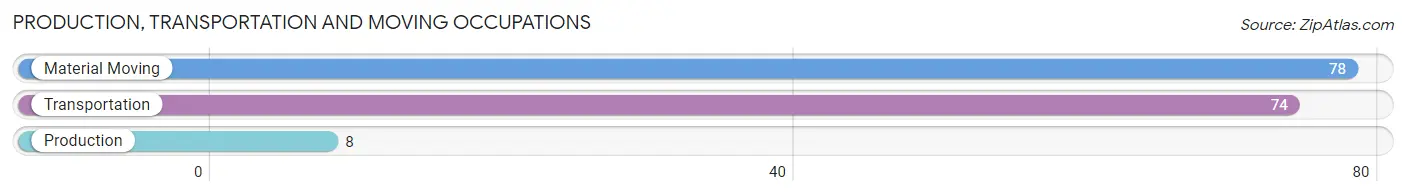
Production, Transportation and Moving Occupations by Sex
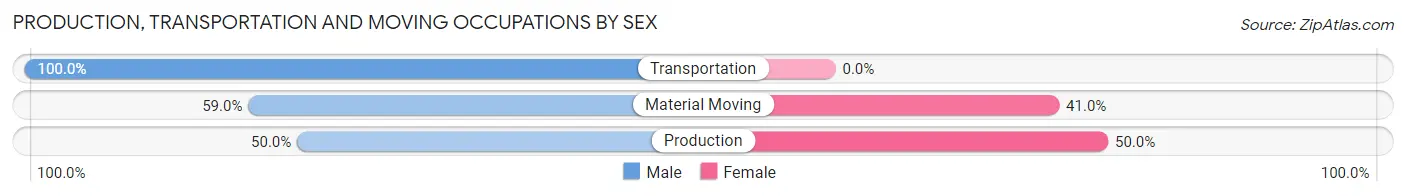
| Occupation | Male | Female |
| Production | 4 (50.0%) | 4 (50.0%) |
| Transportation | 74 (100.0%) | 0 (0.0%) |
| Material Moving | 46 (59.0%) | 32 (41.0%) |
| Total (Category) | 124 (77.5%) | 36 (22.5%) |
| Total (Overall) | 700 (64.5%) | 385 (35.5%) |
Employment Industries by Sex in Cimarron County
Employment Industries in Cimarron County
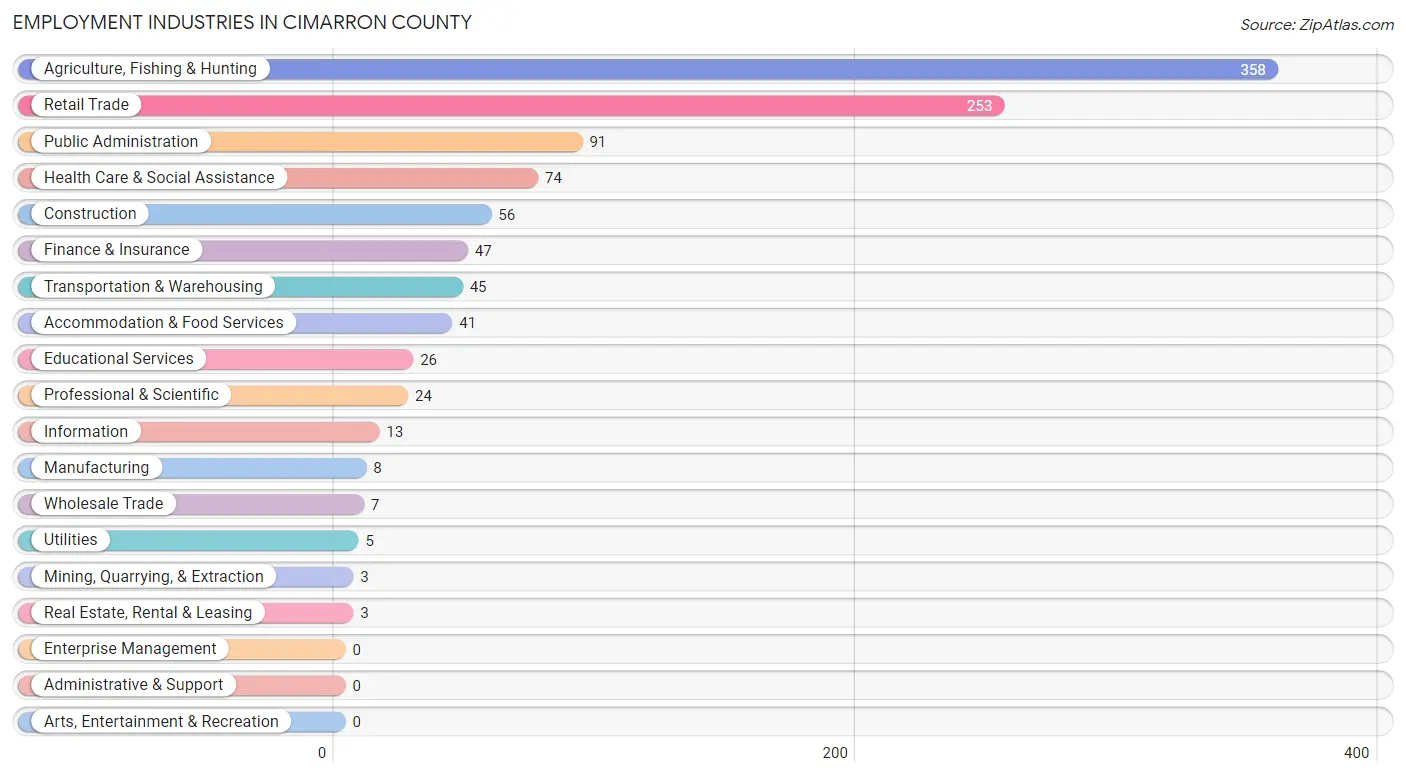
The major employment industries in Cimarron County include Agriculture, Fishing & Hunting (358 | 33.0%), Retail Trade (253 | 23.3%), Public Administration (91 | 8.4%), Health Care & Social Assistance (74 | 6.8%), and Construction (56 | 5.2%).
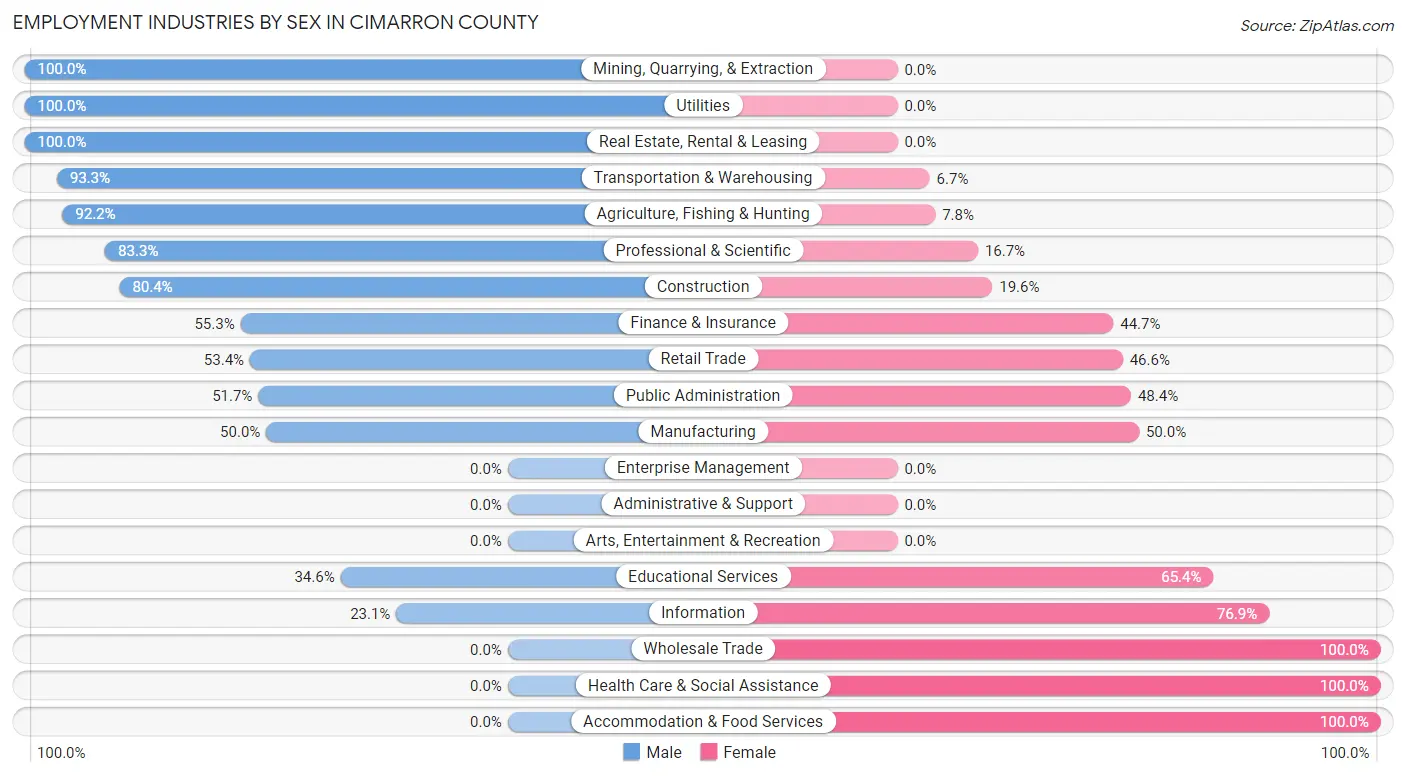
Employment Industries by Sex in Cimarron County
The Cimarron County industries that see more men than women are Mining, Quarrying, & Extraction (100.0%), Utilities (100.0%), and Real Estate, Rental & Leasing (100.0%), whereas the industries that tend to have a higher number of women are Wholesale Trade (100.0%), Health Care & Social Assistance (100.0%), and Accommodation & Food Services (100.0%).
| Industry | Male | Female |
| Agriculture, Fishing & Hunting | 330 (92.2%) | 28 (7.8%) |
| Mining, Quarrying, & Extraction | 3 (100.0%) | 0 (0.0%) |
| Construction | 45 (80.4%) | 11 (19.6%) |
| Manufacturing | 4 (50.0%) | 4 (50.0%) |
| Wholesale Trade | 0 (0.0%) | 7 (100.0%) |
| Retail Trade | 135 (53.4%) | 118 (46.6%) |
| Transportation & Warehousing | 42 (93.3%) | 3 (6.7%) |
| Utilities | 5 (100.0%) | 0 (0.0%) |
| Information | 3 (23.1%) | 10 (76.9%) |
| Finance & Insurance | 26 (55.3%) | 21 (44.7%) |
| Real Estate, Rental & Leasing | 3 (100.0%) | 0 (0.0%) |
| Professional & Scientific | 20 (83.3%) | 4 (16.7%) |
| Enterprise Management | 0 (0.0%) | 0 (0.0%) |
| Administrative & Support | 0 (0.0%) | 0 (0.0%) |
| Educational Services | 9 (34.6%) | 17 (65.4%) |
| Health Care & Social Assistance | 0 (0.0%) | 74 (100.0%) |
| Arts, Entertainment & Recreation | 0 (0.0%) | 0 (0.0%) |
| Accommodation & Food Services | 0 (0.0%) | 41 (100.0%) |
| Public Administration | 47 (51.6%) | 44 (48.3%) |
| Total | 700 (64.5%) | 385 (35.5%) |
Education in Cimarron County
School Enrollment in Cimarron County
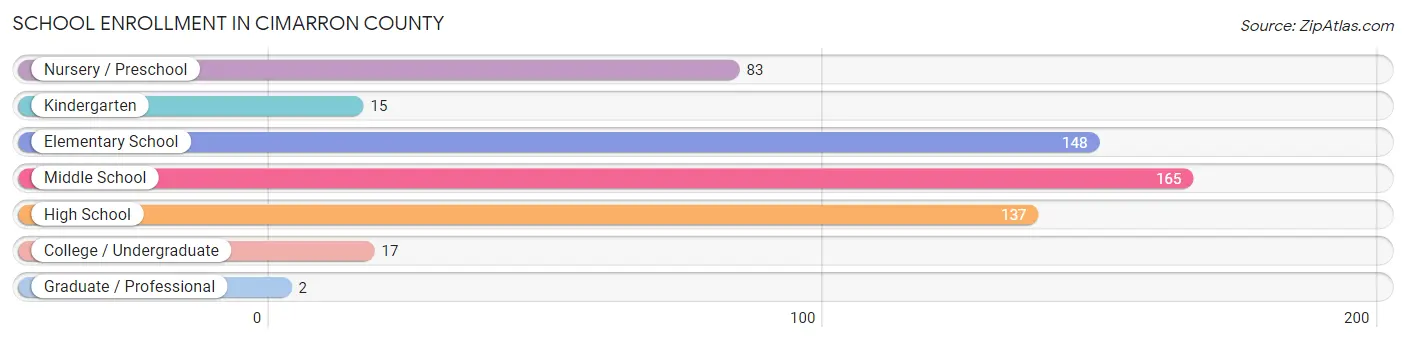
The most common levels of schooling among the 567 students in Cimarron County are middle school (165 | 29.1%), elementary school (148 | 26.1%), and high school (137 | 24.2%).
| School Level | # Students | % Students |
| Nursery / Preschool | 83 | 14.6% |
| Kindergarten | 15 | 2.6% |
| Elementary School | 148 | 26.1% |
| Middle School | 165 | 29.1% |
| High School | 137 | 24.2% |
| College / Undergraduate | 17 | 3.0% |
| Graduate / Professional | 2 | 0.4% |
| Total | 567 | 100.0% |
School Enrollment by Age by Funding Source in Cimarron County
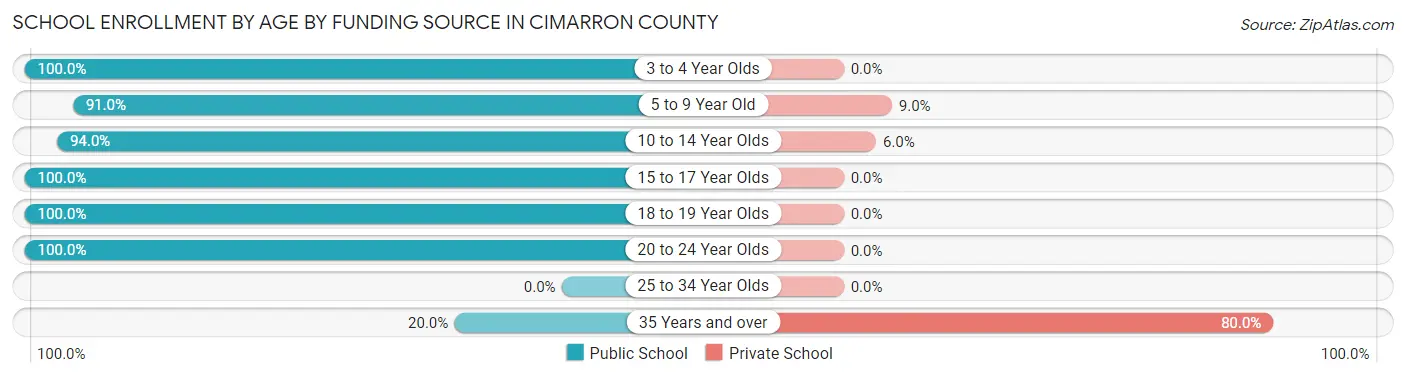
Out of a total of 567 students who are enrolled in schools in Cimarron County, 34 (6.0%) attend a private institution, while the remaining 533 (94.0%) are enrolled in public schools. The age group of 35 years and over has the highest likelihood of being enrolled in private schools, with 8 (80.0% in the age bracket) enrolled. Conversely, the age group of 3 to 4 year olds has the lowest likelihood of being enrolled in a private school, with 70 (100.0% in the age bracket) attending a public institution.
| Age Bracket | Public School | Private School |
| 3 to 4 Year Olds | 70 (100.0%) | 0 (0.0%) |
| 5 to 9 Year Old | 142 (91.0%) | 14 (9.0%) |
| 10 to 14 Year Olds | 187 (94.0%) | 12 (6.0%) |
| 15 to 17 Year Olds | 57 (100.0%) | 0 (0.0%) |
| 18 to 19 Year Olds | 34 (100.0%) | 0 (0.0%) |
| 20 to 24 Year Olds | 41 (100.0%) | 0 (0.0%) |
| 25 to 34 Year Olds | 0 (0.0%) | 0 (0.0%) |
| 35 Years and over | 2 (20.0%) | 8 (80.0%) |
| Total | 533 (94.0%) | 34 (6.0%) |
Educational Attainment by Field of Study in Cimarron County
Business (135 | 21.1%), bio, nature & agricultural (124 | 19.3%), education (115 | 17.9%), arts & humanities (92 | 14.3%), and physical & health sciences (86 | 13.4%) are the most common fields of study among 641 individuals in Cimarron County who have obtained a bachelor's degree or higher.
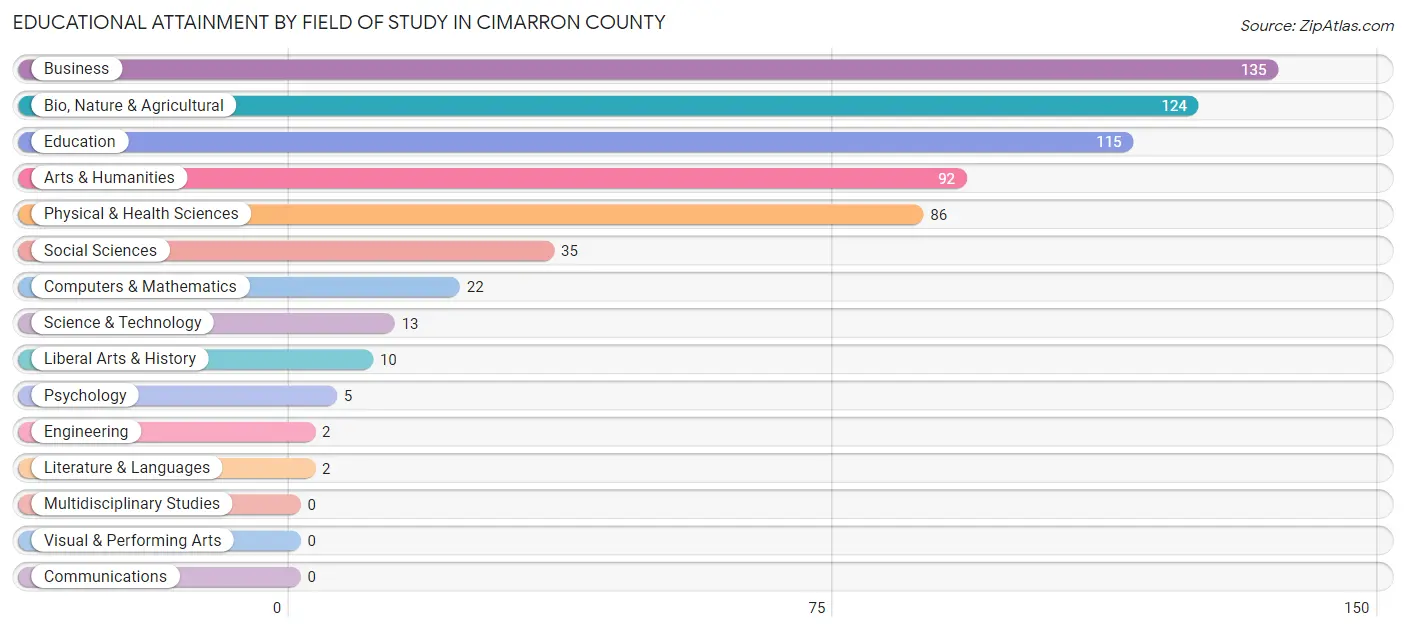
| Field of Study | # Graduates | % Graduates |
| Computers & Mathematics | 22 | 3.4% |
| Bio, Nature & Agricultural | 124 | 19.3% |
| Physical & Health Sciences | 86 | 13.4% |
| Psychology | 5 | 0.8% |
| Social Sciences | 35 | 5.5% |
| Engineering | 2 | 0.3% |
| Multidisciplinary Studies | 0 | 0.0% |
| Science & Technology | 13 | 2.0% |
| Business | 135 | 21.1% |
| Education | 115 | 17.9% |
| Literature & Languages | 2 | 0.3% |
| Liberal Arts & History | 10 | 1.6% |
| Visual & Performing Arts | 0 | 0.0% |
| Communications | 0 | 0.0% |
| Arts & Humanities | 92 | 14.3% |
| Total | 641 | 100.0% |
Transportation & Commute in Cimarron County
Vehicle Availability by Sex in Cimarron County
The most prevalent vehicle ownership categories in Cimarron County are males with 2 vehicles (248, accounting for 35.4%) and females with 2 vehicles (170, making up 64.9%).
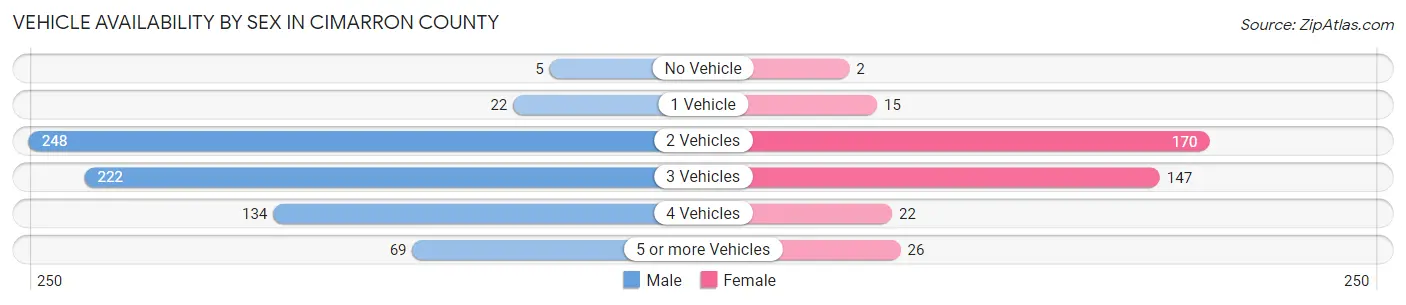
| Vehicles Available | Male | Female |
| No Vehicle | 5 (0.7%) | 2 (0.5%) |
| 1 Vehicle | 22 (3.1%) | 15 (3.9%) |
| 2 Vehicles | 248 (35.4%) | 170 (44.5%) |
| 3 Vehicles | 222 (31.7%) | 147 (38.5%) |
| 4 Vehicles | 134 (19.1%) | 22 (5.8%) |
| 5 or more Vehicles | 69 (9.9%) | 26 (6.8%) |
| Total | 700 (100.0%) | 382 (100.0%) |
Commute Time in Cimarron County
The most frequently occuring commute durations in Cimarron County are less than 5 minutes (385 commuters, 42.5%), 5 to 9 minutes (252 commuters, 27.9%), and 10 to 14 minutes (79 commuters, 8.7%).
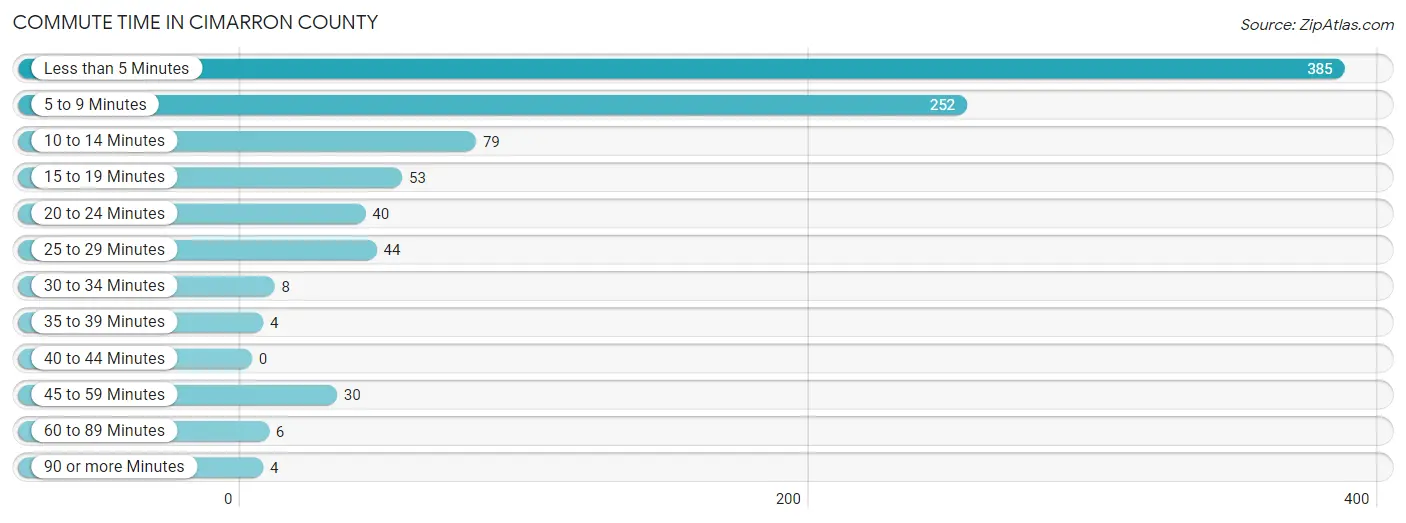
| Commute Time | # Commuters | % Commuters |
| Less than 5 Minutes | 385 | 42.5% |
| 5 to 9 Minutes | 252 | 27.9% |
| 10 to 14 Minutes | 79 | 8.7% |
| 15 to 19 Minutes | 53 | 5.9% |
| 20 to 24 Minutes | 40 | 4.4% |
| 25 to 29 Minutes | 44 | 4.9% |
| 30 to 34 Minutes | 8 | 0.9% |
| 35 to 39 Minutes | 4 | 0.4% |
| 40 to 44 Minutes | 0 | 0.0% |
| 45 to 59 Minutes | 30 | 3.3% |
| 60 to 89 Minutes | 6 | 0.7% |
| 90 or more Minutes | 4 | 0.4% |
Commute Time by Sex in Cimarron County
The most common commute times in Cimarron County are less than 5 minutes (213 commuters, 38.5%) for males and less than 5 minutes (172 commuters, 48.9%) for females.
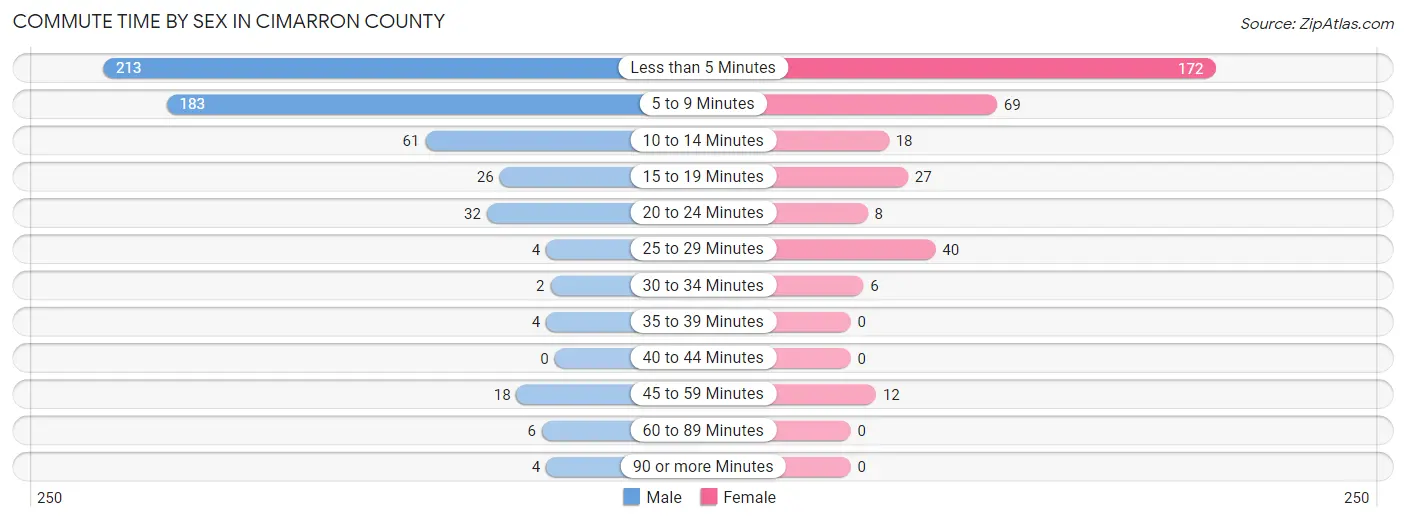
| Commute Time | Male | Female |
| Less than 5 Minutes | 213 (38.5%) | 172 (48.9%) |
| 5 to 9 Minutes | 183 (33.1%) | 69 (19.6%) |
| 10 to 14 Minutes | 61 (11.0%) | 18 (5.1%) |
| 15 to 19 Minutes | 26 (4.7%) | 27 (7.7%) |
| 20 to 24 Minutes | 32 (5.8%) | 8 (2.3%) |
| 25 to 29 Minutes | 4 (0.7%) | 40 (11.4%) |
| 30 to 34 Minutes | 2 (0.4%) | 6 (1.7%) |
| 35 to 39 Minutes | 4 (0.7%) | 0 (0.0%) |
| 40 to 44 Minutes | 0 (0.0%) | 0 (0.0%) |
| 45 to 59 Minutes | 18 (3.3%) | 12 (3.4%) |
| 60 to 89 Minutes | 6 (1.1%) | 0 (0.0%) |
| 90 or more Minutes | 4 (0.7%) | 0 (0.0%) |
Time of Departure to Work by Sex in Cimarron County
The most frequent times of departure to work in Cimarron County are 7:00 AM to 7:29 AM (200, 36.2%) for males and 7:30 AM to 7:59 AM (67, 19.0%) for females.
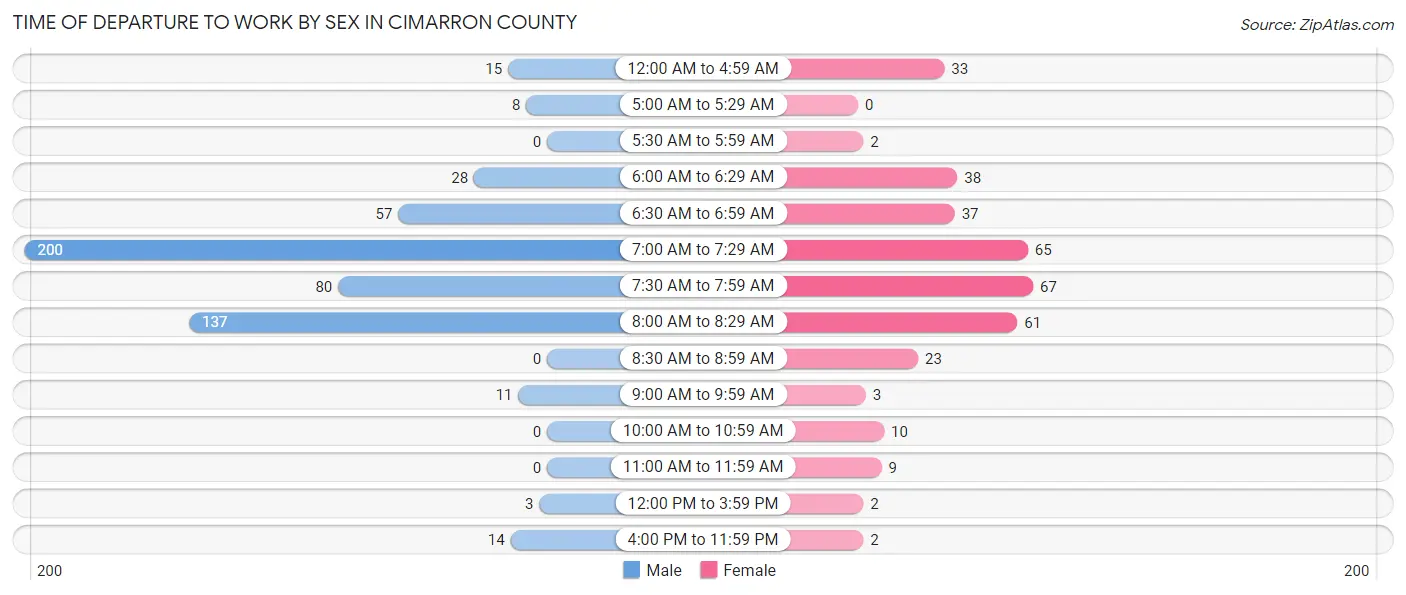
| Time of Departure | Male | Female |
| 12:00 AM to 4:59 AM | 15 (2.7%) | 33 (9.4%) |
| 5:00 AM to 5:29 AM | 8 (1.5%) | 0 (0.0%) |
| 5:30 AM to 5:59 AM | 0 (0.0%) | 2 (0.6%) |
| 6:00 AM to 6:29 AM | 28 (5.1%) | 38 (10.8%) |
| 6:30 AM to 6:59 AM | 57 (10.3%) | 37 (10.5%) |
| 7:00 AM to 7:29 AM | 200 (36.2%) | 65 (18.5%) |
| 7:30 AM to 7:59 AM | 80 (14.5%) | 67 (19.0%) |
| 8:00 AM to 8:29 AM | 137 (24.8%) | 61 (17.3%) |
| 8:30 AM to 8:59 AM | 0 (0.0%) | 23 (6.5%) |
| 9:00 AM to 9:59 AM | 11 (2.0%) | 3 (0.9%) |
| 10:00 AM to 10:59 AM | 0 (0.0%) | 10 (2.8%) |
| 11:00 AM to 11:59 AM | 0 (0.0%) | 9 (2.6%) |
| 12:00 PM to 3:59 PM | 3 (0.5%) | 2 (0.6%) |
| 4:00 PM to 11:59 PM | 14 (2.5%) | 2 (0.6%) |
| Total | 553 (100.0%) | 352 (100.0%) |
Housing Occupancy in Cimarron County
Occupancy by Ownership in Cimarron County
Of the total 752 dwellings in Cimarron County, owner-occupied units account for 609 (81.0%), while renter-occupied units make up 143 (19.0%).
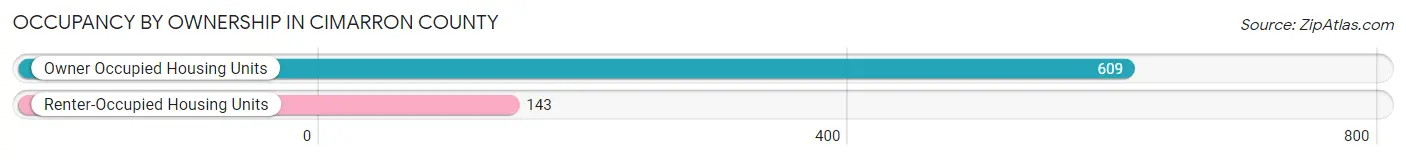
| Occupancy | # Housing Units | % Housing Units |
| Owner Occupied Housing Units | 609 | 81.0% |
| Renter-Occupied Housing Units | 143 | 19.0% |
| Total Occupied Housing Units | 752 | 100.0% |
Occupancy by Household Size in Cimarron County
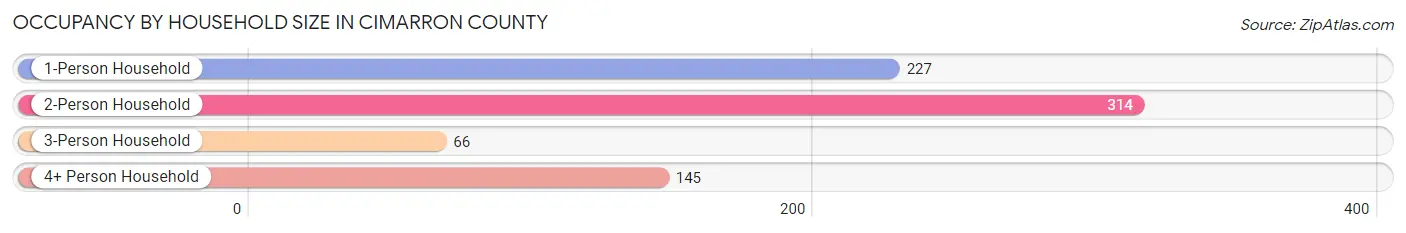
| Household Size | # Housing Units | % Housing Units |
| 1-Person Household | 227 | 30.2% |
| 2-Person Household | 314 | 41.8% |
| 3-Person Household | 66 | 8.8% |
| 4+ Person Household | 145 | 19.3% |
| Total Housing Units | 752 | 100.0% |
Occupancy by Ownership by Household Size in Cimarron County
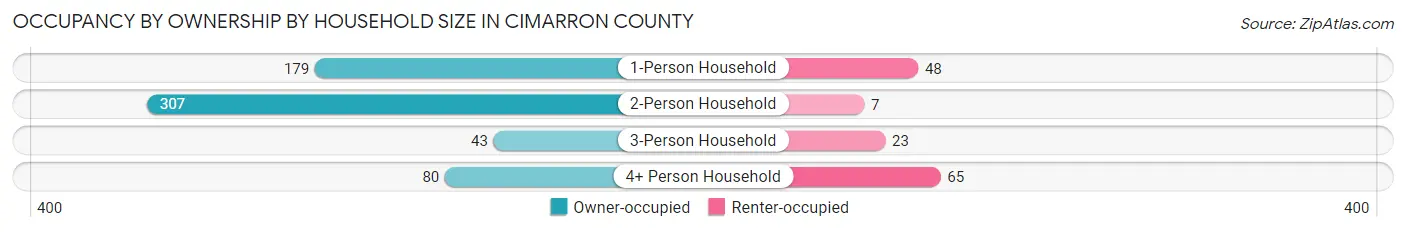
| Household Size | Owner-occupied | Renter-occupied |
| 1-Person Household | 179 (78.8%) | 48 (21.1%) |
| 2-Person Household | 307 (97.8%) | 7 (2.2%) |
| 3-Person Household | 43 (65.1%) | 23 (34.8%) |
| 4+ Person Household | 80 (55.2%) | 65 (44.8%) |
| Total Housing Units | 609 (81.0%) | 143 (19.0%) |
Occupancy by Educational Attainment in Cimarron County
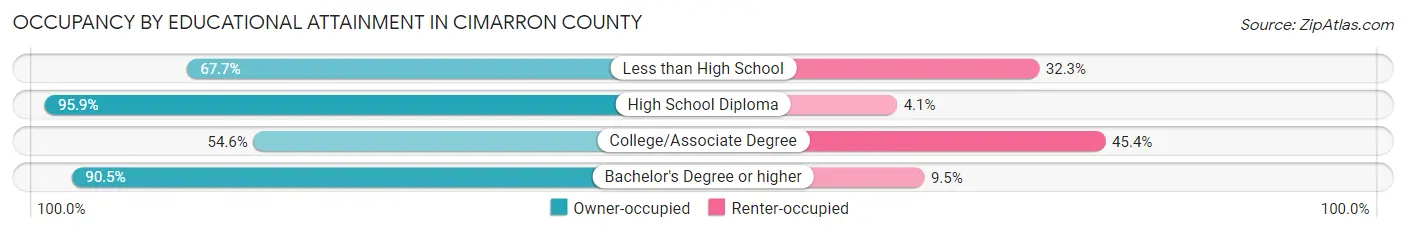
| Household Size | Owner-occupied | Renter-occupied |
| Less than High School | 63 (67.7%) | 30 (32.3%) |
| High School Diploma | 212 (95.9%) | 9 (4.1%) |
| College/Associate Degree | 95 (54.6%) | 79 (45.4%) |
| Bachelor's Degree or higher | 239 (90.5%) | 25 (9.5%) |
Occupancy by Age of Householder in Cimarron County
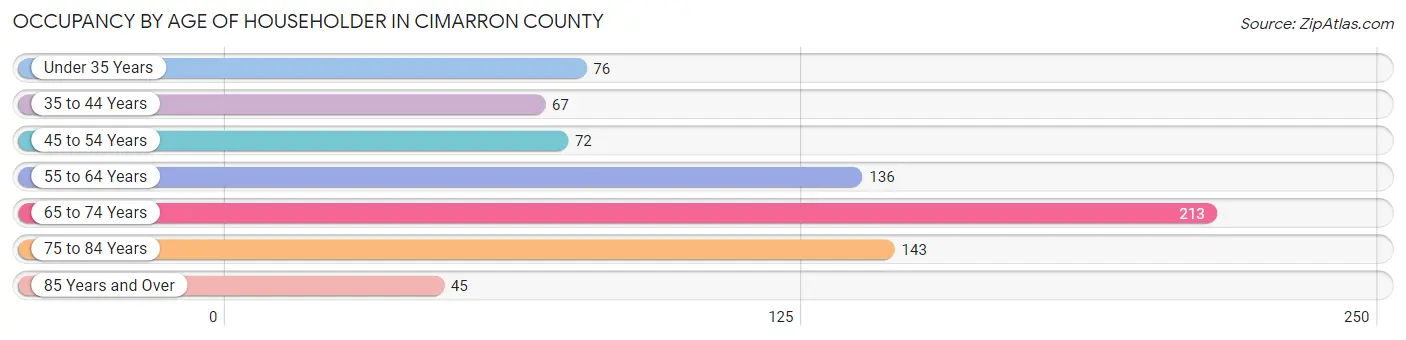
| Age Bracket | # Households | % Households |
| Under 35 Years | 76 | 10.1% |
| 35 to 44 Years | 67 | 8.9% |
| 45 to 54 Years | 72 | 9.6% |
| 55 to 64 Years | 136 | 18.1% |
| 65 to 74 Years | 213 | 28.3% |
| 75 to 84 Years | 143 | 19.0% |
| 85 Years and Over | 45 | 6.0% |
| Total | 752 | 100.0% |
Housing Finances in Cimarron County
Median Income by Occupancy in Cimarron County
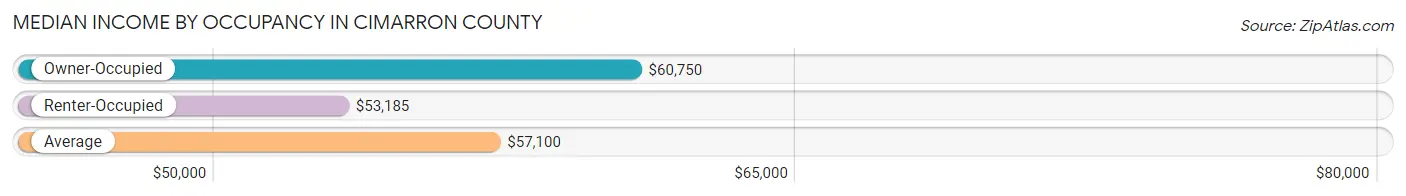
| Occupancy Type | # Households | Median Income |
| Owner-Occupied | 609 (81.0%) | $60,750 |
| Renter-Occupied | 143 (19.0%) | $53,185 |
| Average | 752 (100.0%) | $57,100 |
Occupancy by Householder Income Bracket in Cimarron County
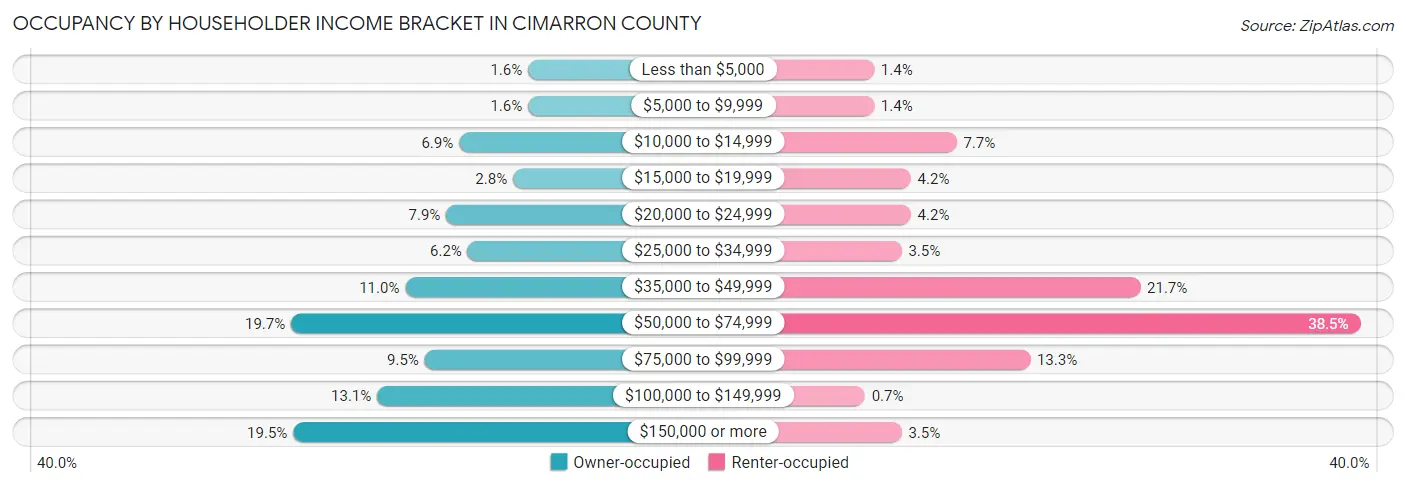
| Income Bracket | Owner-occupied | Renter-occupied |
| Less than $5,000 | 10 (1.6%) | 2 (1.4%) |
| $5,000 to $9,999 | 10 (1.6%) | 2 (1.4%) |
| $10,000 to $14,999 | 42 (6.9%) | 11 (7.7%) |
| $15,000 to $19,999 | 17 (2.8%) | 6 (4.2%) |
| $20,000 to $24,999 | 48 (7.9%) | 6 (4.2%) |
| $25,000 to $34,999 | 38 (6.2%) | 5 (3.5%) |
| $35,000 to $49,999 | 67 (11.0%) | 31 (21.7%) |
| $50,000 to $74,999 | 120 (19.7%) | 55 (38.5%) |
| $75,000 to $99,999 | 58 (9.5%) | 19 (13.3%) |
| $100,000 to $149,999 | 80 (13.1%) | 1 (0.7%) |
| $150,000 or more | 119 (19.5%) | 5 (3.5%) |
| Total | 609 (100.0%) | 143 (100.0%) |
Monthly Housing Cost Tiers in Cimarron County
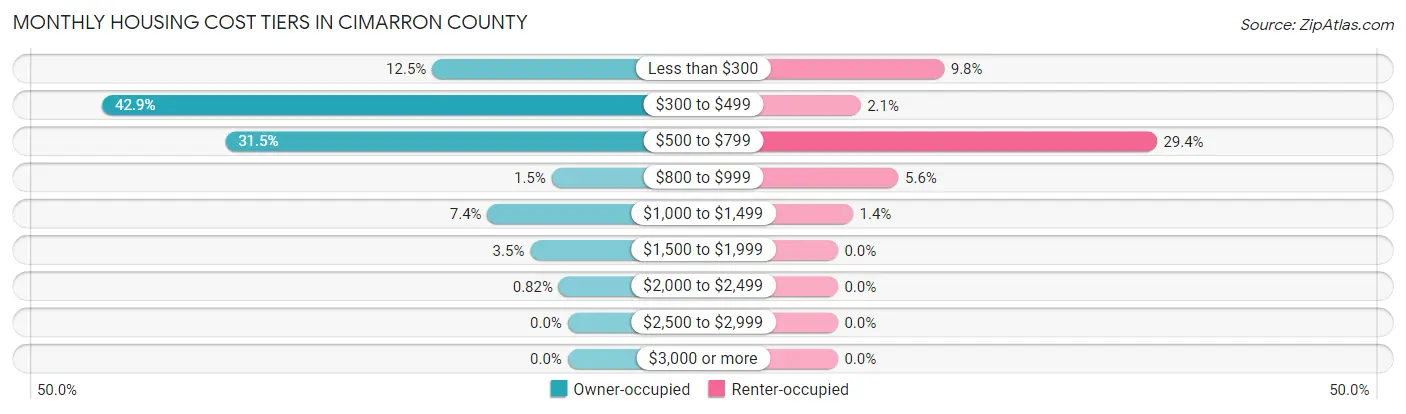
| Monthly Cost | Owner-occupied | Renter-occupied |
| Less than $300 | 76 (12.5%) | 14 (9.8%) |
| $300 to $499 | 261 (42.9%) | 3 (2.1%) |
| $500 to $799 | 192 (31.5%) | 42 (29.4%) |
| $800 to $999 | 9 (1.5%) | 8 (5.6%) |
| $1,000 to $1,499 | 45 (7.4%) | 2 (1.4%) |
| $1,500 to $1,999 | 21 (3.5%) | 0 (0.0%) |
| $2,000 to $2,499 | 5 (0.8%) | 0 (0.0%) |
| $2,500 to $2,999 | 0 (0.0%) | 0 (0.0%) |
| $3,000 or more | 0 (0.0%) | 0 (0.0%) |
| Total | 609 (100.0%) | 143 (100.0%) |
Physical Housing Characteristics in Cimarron County
Housing Structures in Cimarron County
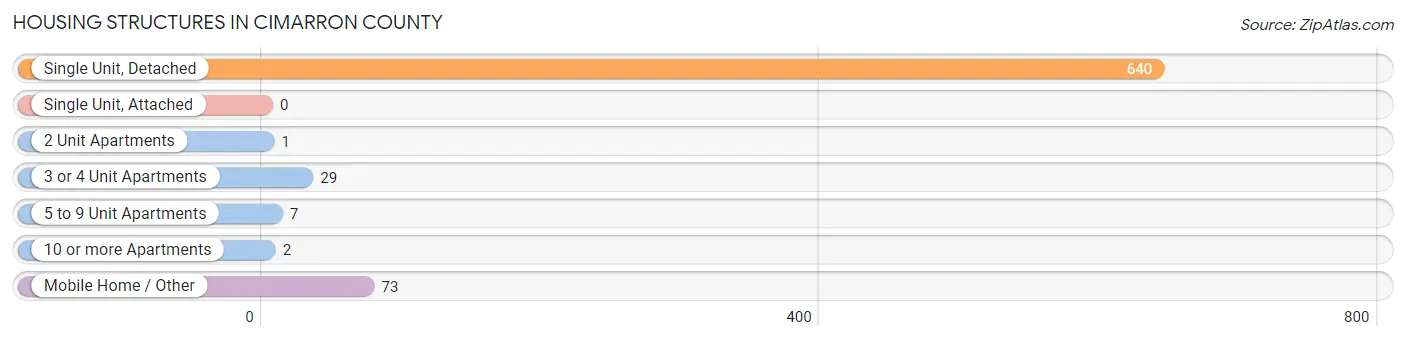
| Structure Type | # Housing Units | % Housing Units |
| Single Unit, Detached | 640 | 85.1% |
| Single Unit, Attached | 0 | 0.0% |
| 2 Unit Apartments | 1 | 0.1% |
| 3 or 4 Unit Apartments | 29 | 3.9% |
| 5 to 9 Unit Apartments | 7 | 0.9% |
| 10 or more Apartments | 2 | 0.3% |
| Mobile Home / Other | 73 | 9.7% |
| Total | 752 | 100.0% |
Housing Structures by Occupancy in Cimarron County
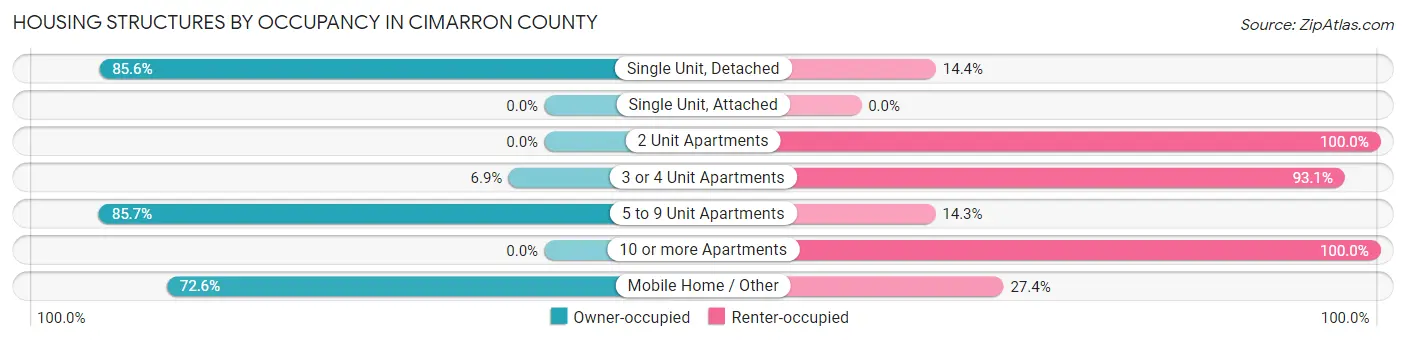
| Structure Type | Owner-occupied | Renter-occupied |
| Single Unit, Detached | 548 (85.6%) | 92 (14.4%) |
| Single Unit, Attached | 0 (0.0%) | 0 (0.0%) |
| 2 Unit Apartments | 0 (0.0%) | 1 (100.0%) |
| 3 or 4 Unit Apartments | 2 (6.9%) | 27 (93.1%) |
| 5 to 9 Unit Apartments | 6 (85.7%) | 1 (14.3%) |
| 10 or more Apartments | 0 (0.0%) | 2 (100.0%) |
| Mobile Home / Other | 53 (72.6%) | 20 (27.4%) |
| Total | 609 (81.0%) | 143 (19.0%) |
Housing Structures by Number of Rooms in Cimarron County
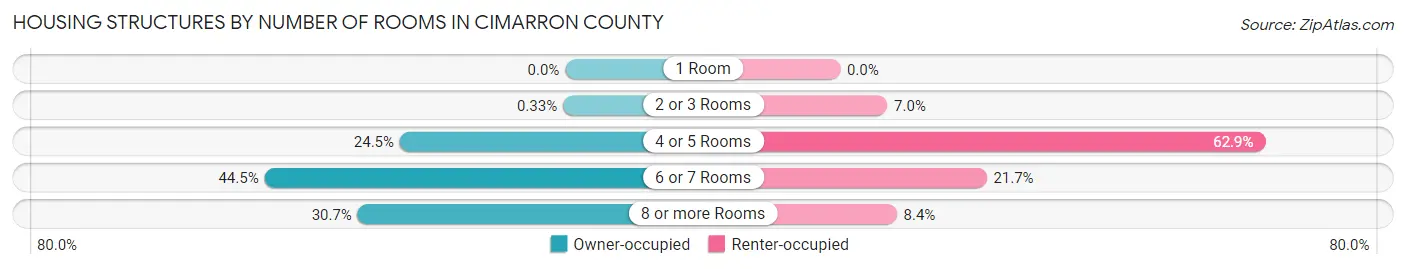
| Number of Rooms | Owner-occupied | Renter-occupied |
| 1 Room | 0 (0.0%) | 0 (0.0%) |
| 2 or 3 Rooms | 2 (0.3%) | 10 (7.0%) |
| 4 or 5 Rooms | 149 (24.5%) | 90 (62.9%) |
| 6 or 7 Rooms | 271 (44.5%) | 31 (21.7%) |
| 8 or more Rooms | 187 (30.7%) | 12 (8.4%) |
| Total | 609 (100.0%) | 143 (100.0%) |
Housing Structure by Heating Type in Cimarron County
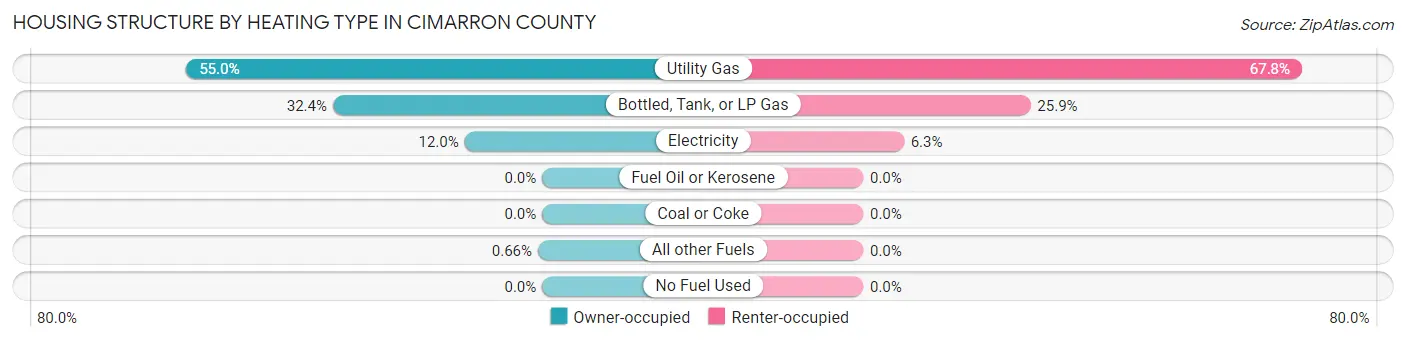
| Heating Type | Owner-occupied | Renter-occupied |
| Utility Gas | 335 (55.0%) | 97 (67.8%) |
| Bottled, Tank, or LP Gas | 197 (32.4%) | 37 (25.9%) |
| Electricity | 73 (12.0%) | 9 (6.3%) |
| Fuel Oil or Kerosene | 0 (0.0%) | 0 (0.0%) |
| Coal or Coke | 0 (0.0%) | 0 (0.0%) |
| All other Fuels | 4 (0.7%) | 0 (0.0%) |
| No Fuel Used | 0 (0.0%) | 0 (0.0%) |
| Total | 609 (100.0%) | 143 (100.0%) |
Household Vehicle Usage in Cimarron County
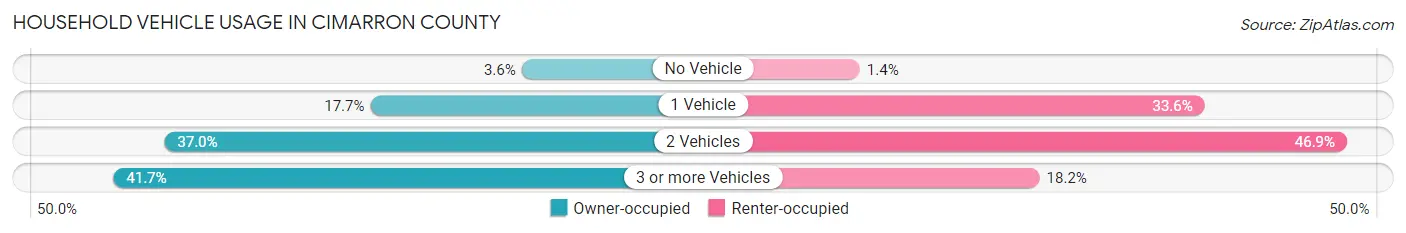
| Vehicles per Household | Owner-occupied | Renter-occupied |
| No Vehicle | 22 (3.6%) | 2 (1.4%) |
| 1 Vehicle | 108 (17.7%) | 48 (33.6%) |
| 2 Vehicles | 225 (36.9%) | 67 (46.9%) |
| 3 or more Vehicles | 254 (41.7%) | 26 (18.2%) |
| Total | 609 (100.0%) | 143 (100.0%) |
Real Estate & Mortgages in Cimarron County
Real Estate and Mortgage Overview in Cimarron County
| Characteristic | Without Mortgage | With Mortgage |
| Housing Units | 498 | 111 |
| Median Property Value | $79,700 | $73,200 |
| Median Household Income | $63,409 | $2 |
| Monthly Housing Costs | $443 | $0 |
| Real Estate Taxes | $290 | $0 |
Property Value by Mortgage Status in Cimarron County
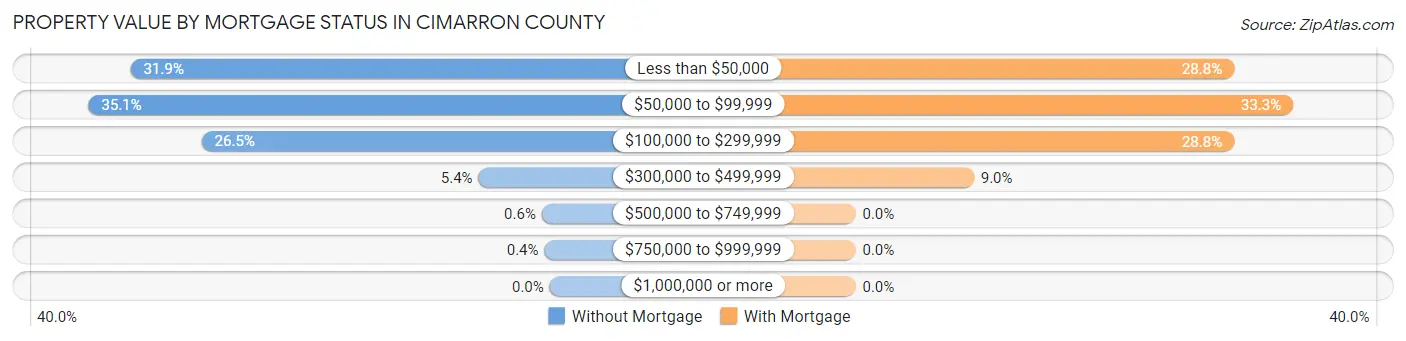
| Property Value | Without Mortgage | With Mortgage |
| Less than $50,000 | 159 (31.9%) | 32 (28.8%) |
| $50,000 to $99,999 | 175 (35.1%) | 37 (33.3%) |
| $100,000 to $299,999 | 132 (26.5%) | 32 (28.8%) |
| $300,000 to $499,999 | 27 (5.4%) | 10 (9.0%) |
| $500,000 to $749,999 | 3 (0.6%) | 0 (0.0%) |
| $750,000 to $999,999 | 2 (0.4%) | 0 (0.0%) |
| $1,000,000 or more | 0 (0.0%) | 0 (0.0%) |
| Total | 498 (100.0%) | 111 (100.0%) |
Household Income by Mortgage Status in Cimarron County
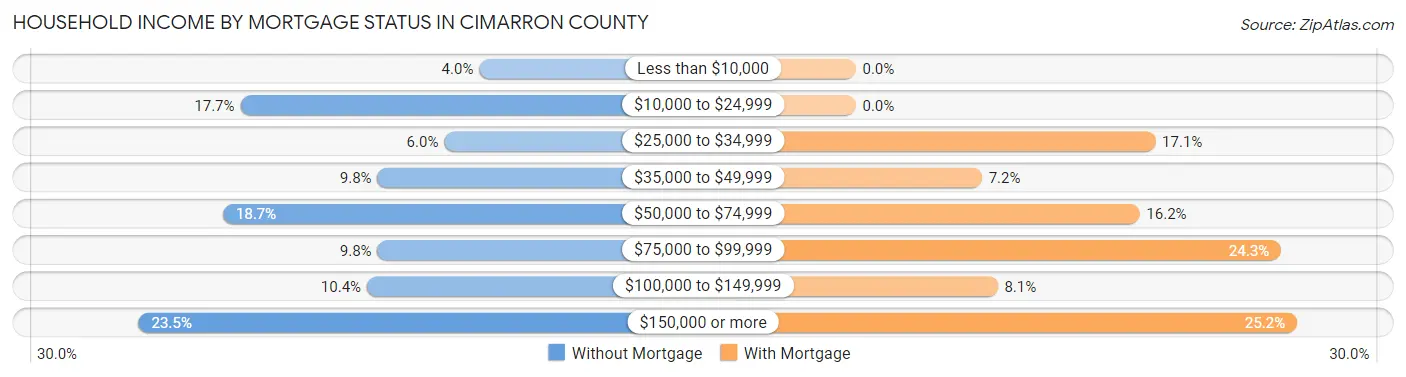
| Household Income | Without Mortgage | With Mortgage |
| Less than $10,000 | 20 (4.0%) | 0 (0.0%) |
| $10,000 to $24,999 | 88 (17.7%) | 0 (0.0%) |
| $25,000 to $34,999 | 30 (6.0%) | 19 (17.1%) |
| $35,000 to $49,999 | 49 (9.8%) | 8 (7.2%) |
| $50,000 to $74,999 | 93 (18.7%) | 18 (16.2%) |
| $75,000 to $99,999 | 49 (9.8%) | 27 (24.3%) |
| $100,000 to $149,999 | 52 (10.4%) | 9 (8.1%) |
| $150,000 or more | 117 (23.5%) | 28 (25.2%) |
| Total | 498 (100.0%) | 111 (100.0%) |
Property Value to Household Income Ratio in Cimarron County
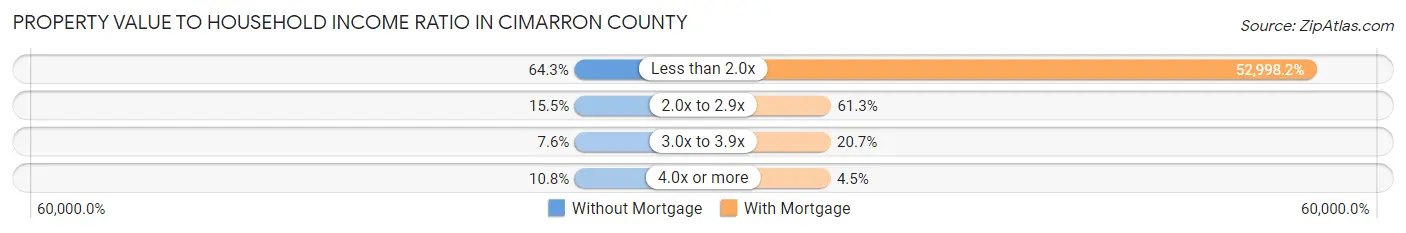
| Value-to-Income Ratio | Without Mortgage | With Mortgage |
| Less than 2.0x | 320 (64.3%) | 58,828 (52,998.2%) |
| 2.0x to 2.9x | 77 (15.5%) | 68 (61.3%) |
| 3.0x to 3.9x | 38 (7.6%) | 23 (20.7%) |
| 4.0x or more | 54 (10.8%) | 5 (4.5%) |
| Total | 498 (100.0%) | 111 (100.0%) |
Real Estate Taxes by Mortgage Status in Cimarron County
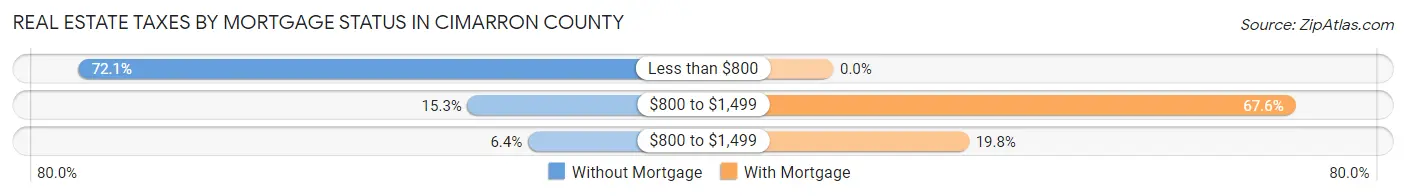
| Property Taxes | Without Mortgage | With Mortgage |
| Less than $800 | 359 (72.1%) | 0 (0.0%) |
| $800 to $1,499 | 76 (15.3%) | 75 (67.6%) |
| $800 to $1,499 | 32 (6.4%) | 22 (19.8%) |
| Total | 498 (100.0%) | 111 (100.0%) |
Health & Disability in Cimarron County
Health Insurance Coverage by Age in Cimarron County
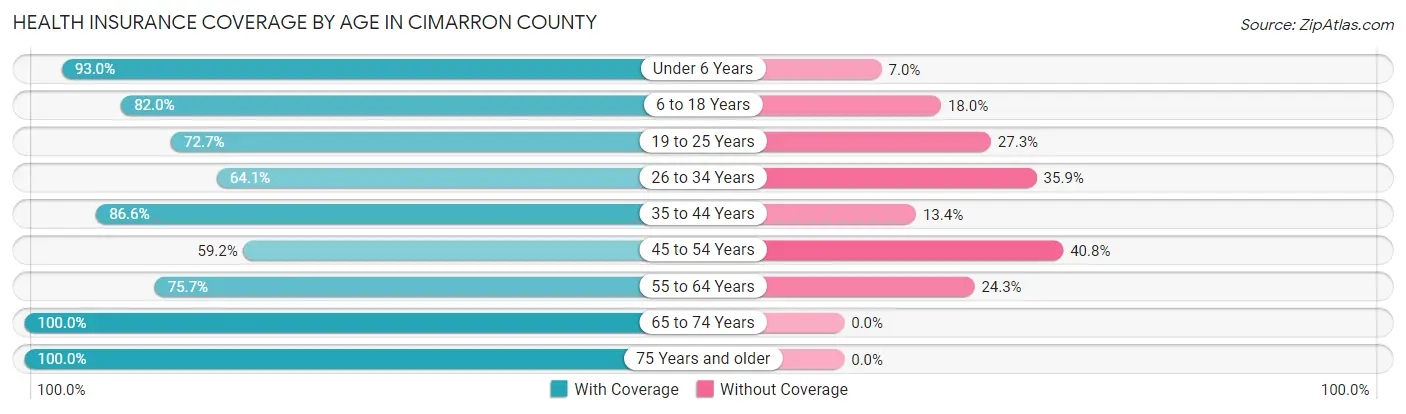
| Age Bracket | With Coverage | Without Coverage |
| Under 6 Years | 147 (93.0%) | 11 (7.0%) |
| 6 to 18 Years | 350 (82.0%) | 77 (18.0%) |
| 19 to 25 Years | 93 (72.7%) | 35 (27.3%) |
| 26 to 34 Years | 143 (64.1%) | 80 (35.9%) |
| 35 to 44 Years | 149 (86.6%) | 23 (13.4%) |
| 45 to 54 Years | 171 (59.2%) | 118 (40.8%) |
| 55 to 64 Years | 234 (75.7%) | 75 (24.3%) |
| 65 to 74 Years | 310 (100.0%) | 0 (0.0%) |
| 75 Years and older | 237 (100.0%) | 0 (0.0%) |
| Total | 1,834 (81.4%) | 419 (18.6%) |
Health Insurance Coverage by Citizenship Status in Cimarron County
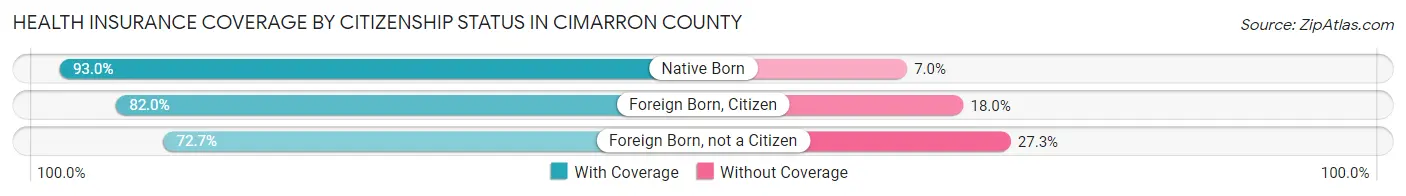
| Citizenship Status | With Coverage | Without Coverage |
| Native Born | 147 (93.0%) | 11 (7.0%) |
| Foreign Born, Citizen | 350 (82.0%) | 77 (18.0%) |
| Foreign Born, not a Citizen | 93 (72.7%) | 35 (27.3%) |
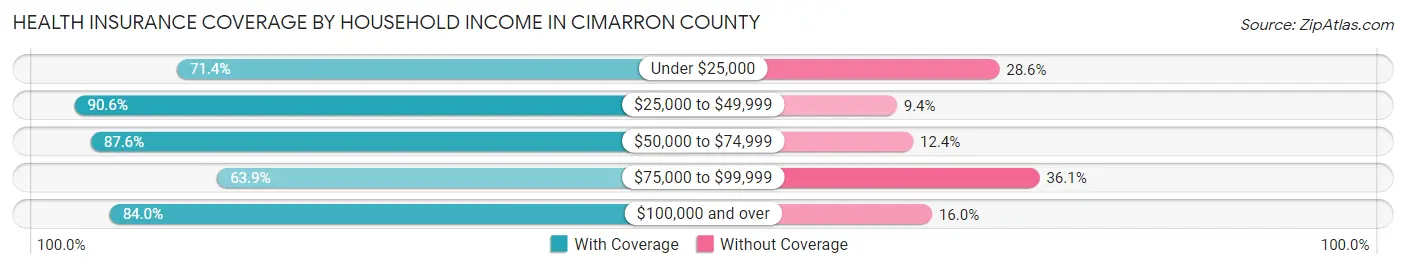
Health Insurance Coverage by Household Income in Cimarron County
| Household Income | With Coverage | Without Coverage |
| Under $25,000 | 155 (71.4%) | 62 (28.6%) |
| $25,000 to $49,999 | 300 (90.6%) | 31 (9.4%) |
| $50,000 to $74,999 | 529 (87.6%) | 75 (12.4%) |
| $75,000 to $99,999 | 239 (63.9%) | 135 (36.1%) |
| $100,000 and over | 611 (84.0%) | 116 (16.0%) |
Public vs Private Health Insurance Coverage by Age in Cimarron County
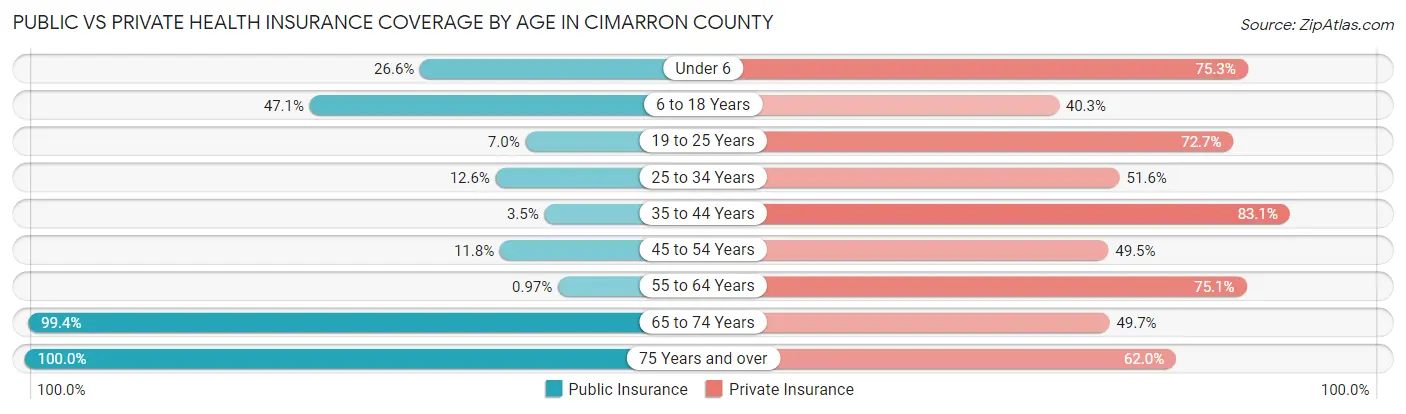
| Age Bracket | Public Insurance | Private Insurance |
| Under 6 | 42 (26.6%) | 119 (75.3%) |
| 6 to 18 Years | 201 (47.1%) | 172 (40.3%) |
| 19 to 25 Years | 9 (7.0%) | 93 (72.7%) |
| 25 to 34 Years | 28 (12.6%) | 115 (51.6%) |
| 35 to 44 Years | 6 (3.5%) | 143 (83.1%) |
| 45 to 54 Years | 34 (11.8%) | 143 (49.5%) |
| 55 to 64 Years | 3 (1.0%) | 232 (75.1%) |
| 65 to 74 Years | 308 (99.4%) | 154 (49.7%) |
| 75 Years and over | 237 (100.0%) | 147 (62.0%) |
| Total | 868 (38.5%) | 1,318 (58.5%) |
Disability Status by Sex by Age in Cimarron County
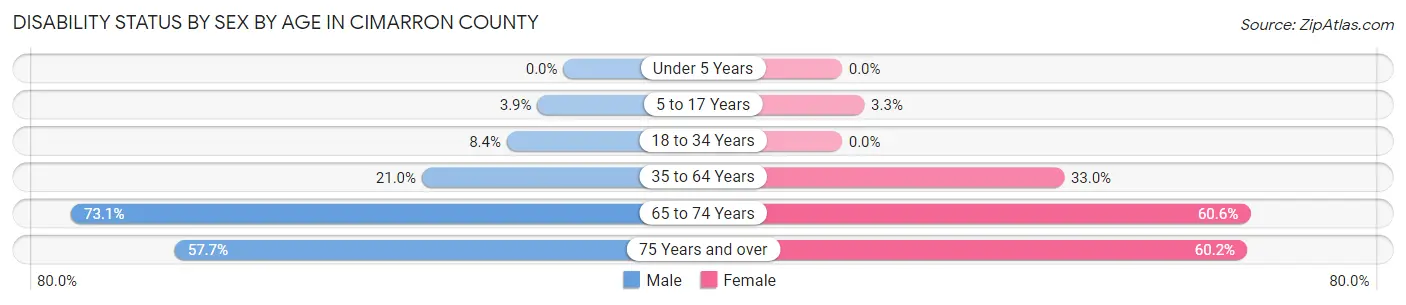
| Age Bracket | Male | Female |
| Under 5 Years | 0 (0.0%) | 0 (0.0%) |
| 5 to 17 Years | 8 (3.9%) | 7 (3.3%) |
| 18 to 34 Years | 20 (8.4%) | 0 (0.0%) |
| 35 to 64 Years | 79 (21.0%) | 130 (33.0%) |
| 65 to 74 Years | 106 (73.1%) | 100 (60.6%) |
| 75 Years and over | 60 (57.7%) | 80 (60.2%) |
Disability Class by Sex by Age in Cimarron County
Disability Class: Hearing Difficulty
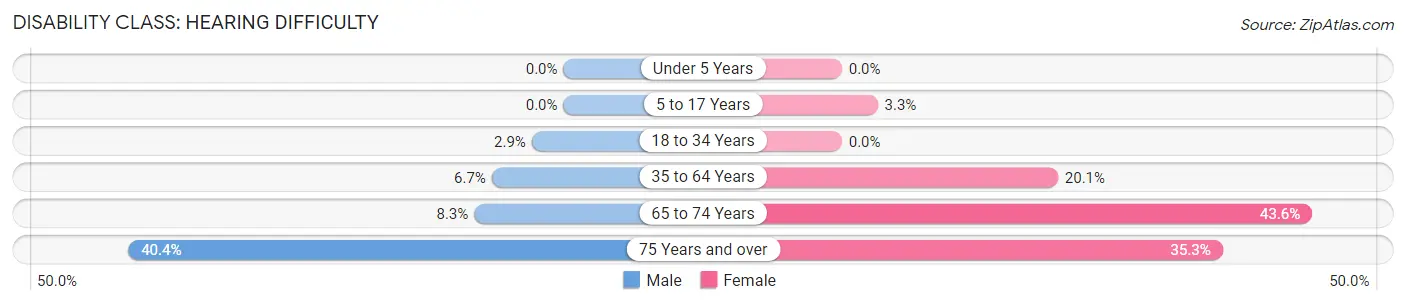
| Age Bracket | Male | Female |
| Under 5 Years | 0 (0.0%) | 0 (0.0%) |
| 5 to 17 Years | 0 (0.0%) | 7 (3.3%) |
| 18 to 34 Years | 7 (2.9%) | 0 (0.0%) |
| 35 to 64 Years | 25 (6.7%) | 79 (20.1%) |
| 65 to 74 Years | 12 (8.3%) | 72 (43.6%) |
| 75 Years and over | 42 (40.4%) | 47 (35.3%) |
Disability Class: Vision Difficulty
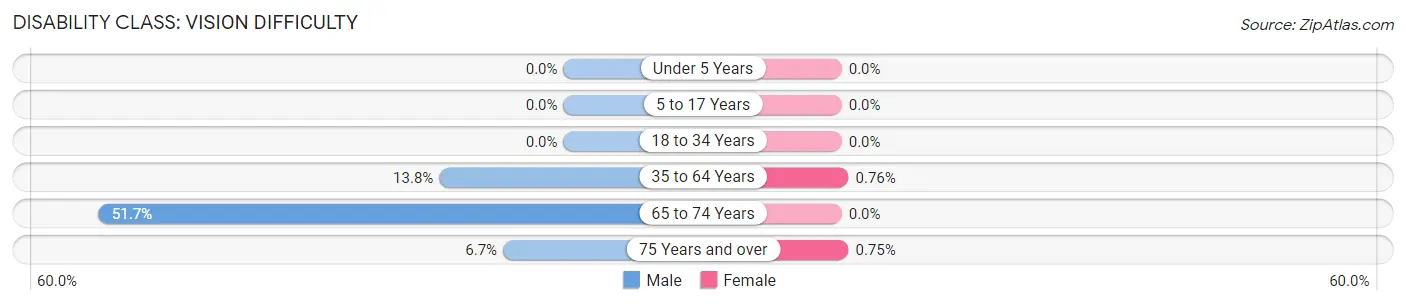
| Age Bracket | Male | Female |
| Under 5 Years | 0 (0.0%) | 0 (0.0%) |
| 5 to 17 Years | 0 (0.0%) | 0 (0.0%) |
| 18 to 34 Years | 0 (0.0%) | 0 (0.0%) |
| 35 to 64 Years | 52 (13.8%) | 3 (0.8%) |
| 65 to 74 Years | 75 (51.7%) | 0 (0.0%) |
| 75 Years and over | 7 (6.7%) | 1 (0.7%) |
Disability Class: Cognitive Difficulty
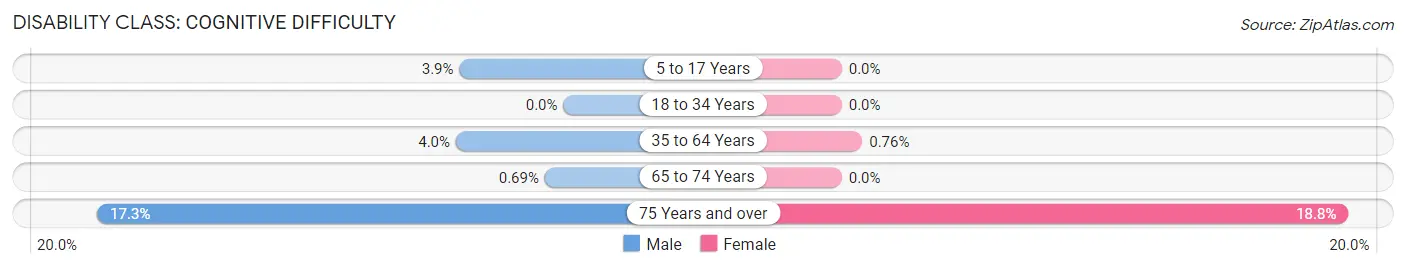
| Age Bracket | Male | Female |
| 5 to 17 Years | 8 (3.9%) | 0 (0.0%) |
| 18 to 34 Years | 0 (0.0%) | 0 (0.0%) |
| 35 to 64 Years | 15 (4.0%) | 3 (0.8%) |
| 65 to 74 Years | 1 (0.7%) | 0 (0.0%) |
| 75 Years and over | 18 (17.3%) | 25 (18.8%) |
Disability Class: Ambulatory Difficulty
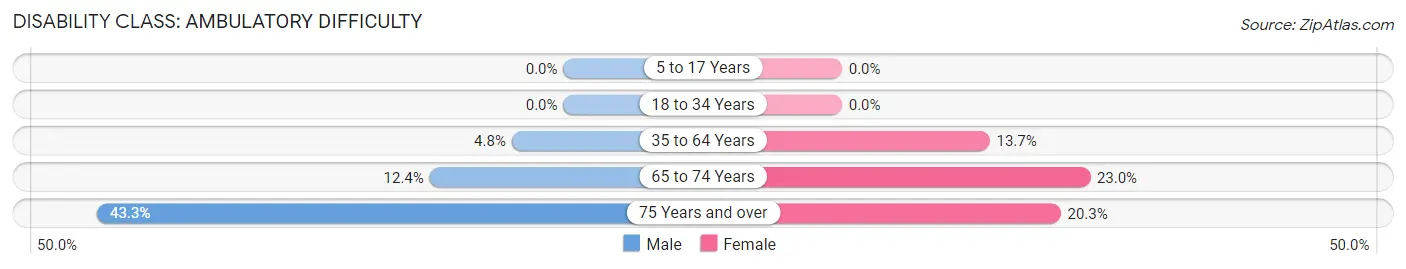
| Age Bracket | Male | Female |
| 5 to 17 Years | 0 (0.0%) | 0 (0.0%) |
| 18 to 34 Years | 0 (0.0%) | 0 (0.0%) |
| 35 to 64 Years | 18 (4.8%) | 54 (13.7%) |
| 65 to 74 Years | 18 (12.4%) | 38 (23.0%) |
| 75 Years and over | 45 (43.3%) | 27 (20.3%) |
Disability Class: Self-Care Difficulty
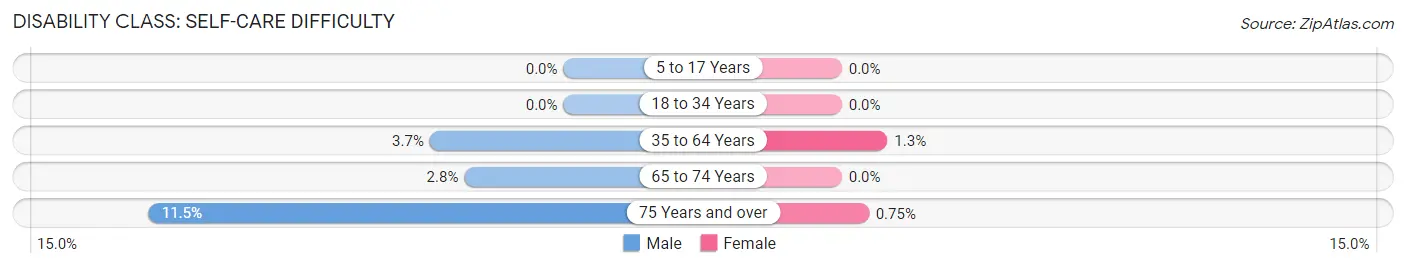
| Age Bracket | Male | Female |
| 5 to 17 Years | 0 (0.0%) | 0 (0.0%) |
| 18 to 34 Years | 0 (0.0%) | 0 (0.0%) |
| 35 to 64 Years | 14 (3.7%) | 5 (1.3%) |
| 65 to 74 Years | 4 (2.8%) | 0 (0.0%) |
| 75 Years and over | 12 (11.5%) | 1 (0.7%) |
Technology Access in Cimarron County
Computing Device Access in Cimarron County
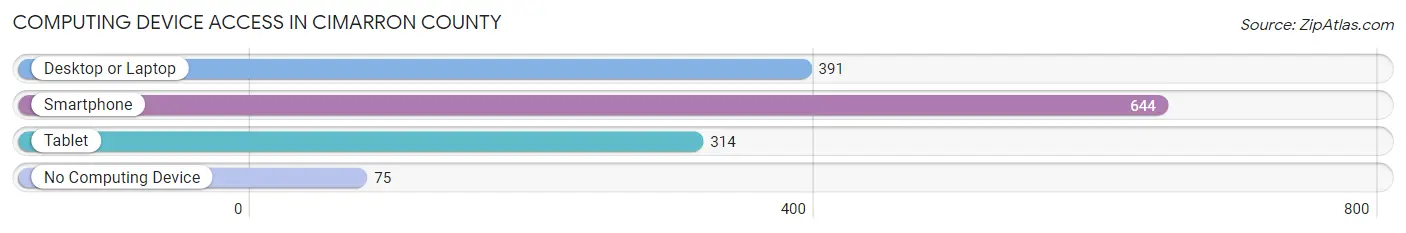
| Device Type | # Households | % Households |
| Desktop or Laptop | 391 | 52.0% |
| Smartphone | 644 | 85.6% |
| Tablet | 314 | 41.8% |
| No Computing Device | 75 | 10.0% |
| Total | 752 | 100.0% |
Internet Access in Cimarron County
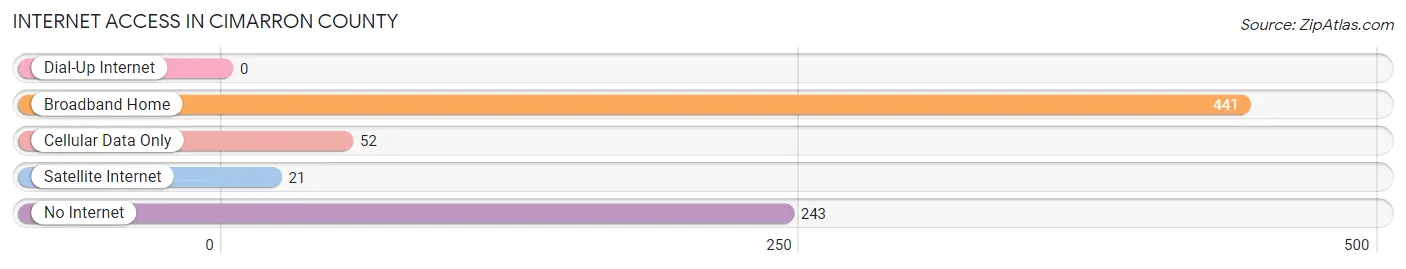
| Internet Type | # Households | % Households |
| Dial-Up Internet | 0 | 0.0% |
| Broadband Home | 441 | 58.6% |
| Cellular Data Only | 52 | 6.9% |
| Satellite Internet | 21 | 2.8% |
| No Internet | 243 | 32.3% |
| Total | 752 | 100.0% |
Cimarron County Summary
Cimarron County is located in the Oklahoma Panhandle, in the northwest corner of the state. It is bordered by Texas to the south, New Mexico to the west, and Colorado to the north. The county seat is Boise City, and the county has a total area of 1,841 square miles. As of the 2010 census, the population was 2,475, making it the least populous county in Oklahoma.
Geography
Cimarron County is located in the Oklahoma Panhandle, in the northwest corner of the state. It is bordered by Texas to the south, New Mexico to the west, and Colorado to the north. The county has a total area of 1,841 square miles, of which 1,837 square miles is land and 4.3 square miles is water. The county is mostly flat, with some rolling hills in the western part. The highest point in the county is the summit of Black Mesa, at 4,973 feet above sea level.
The county is home to several natural features, including Black Mesa, the highest point in Oklahoma, and the Cimarron River, which flows through the county from north to south. The county also contains several small lakes, including Lake Carl Etling and Lake Carl Etling State Park.
Climate
Cimarron County has a semi-arid climate, with hot summers and cold winters. The average annual temperature is 54°F, and the average annual precipitation is 17.5 inches.
Demographics
As of the 2010 census, there were 2,475 people, 1,039 households, and 690 families living in the county. The population density was 1.3 people per square mile. The racial makeup of the county was 94.2% White, 0.2% African American, 1.2% Native American, 0.2% Asian, 0.1% Pacific Islander, 2.3% from other races, and 1.9% from two or more races. Hispanic or Latino of any race were 4.7% of the population.
The median income for a household in the county was $30,938, and the median income for a family was $36,250. Males had a median income of $25,000 versus $20,000 for females. The per capita income for the county was $14,945. About 14.2% of families and 17.2% of the population were below the poverty line, including 22.2% of those under age 18 and 11.2% of those age 65 or over.
Economy
Cimarron County's economy is largely based on agriculture, with wheat, sorghum, and hay being the main crops. Cattle and sheep are also raised in the county. The county is also home to several oil and gas fields, and there is some mining of coal and other minerals.
The county is served by two airports, the Boise City Municipal Airport and the Cimarron County Airport. The county is also served by two railroads, the Burlington Northern Santa Fe and the Union Pacific.
Conclusion
Cimarron County is located in the Oklahoma Panhandle, in the northwest corner of the state. It has a total area of 1,841 square miles, and as of the 2010 census, the population was 2,475. The county has a semi-arid climate, with hot summers and cold winters. The economy is largely based on agriculture, with wheat, sorghum, and hay being the main crops. Cattle and sheep are also raised in the county, and there is some mining of coal and other minerals. The county is served by two airports and two railroads, and is home to several natural features, including Black Mesa, the highest point in Oklahoma, and the Cimarron River.
Common Questions
What is Per Capita Income in Cimarron County?
Per Capita income in Cimarron County is $33,925.
What is the Median Family Income in Cimarron County?
Median Family Income in Cimarron County is $76,786.
What is the Median Household income in Cimarron County?
Median Household Income in Cimarron County is $57,100.
What is Income or Wage Gap in Cimarron County?
Income or Wage Gap in Cimarron County is 58.0%.
Women in Cimarron County earn 42.0 cents for every dollar earned by a man.
What is Family Income Deficit in Cimarron County?
Family Income Deficit in Cimarron County is $3,717.
Families that are below poverty line in Cimarron County earn $3,717 less on average than the poverty threshold level.
What is Inequality or Gini Index in Cimarron County?
Inequality or Gini Index in Cimarron County is 0.46.
What is the Total Population of Cimarron County?
Total Population of Cimarron County is 2,272.
What is the Total Male Population of Cimarron County?
Total Male Population of Cimarron County is 1,151.
What is the Total Female Population of Cimarron County?
Total Female Population of Cimarron County is 1,121.
What is the Ratio of Males per 100 Females in Cimarron County?
There are 102.68 Males per 100 Females in Cimarron County.
What is the Ratio of Females per 100 Males in Cimarron County?
There are 97.39 Females per 100 Males in Cimarron County.
What is the Median Population Age in Cimarron County?
Median Population Age in Cimarron County is 45.9 Years.
What is the Average Family Size in Cimarron County
Average Family Size in Cimarron County is 3.8 People.
What is the Average Household Size in Cimarron County
Average Household Size in Cimarron County is 3.0 People.
How Large is the Labor Force in Cimarron County?
There are 1,086 People in the Labor Forcein in Cimarron County.
What is the Percentage of People in the Labor Force in Cimarron County?
61.2% of People are in the Labor Force in Cimarron County.
What is the Unemployment Rate in Cimarron County?
Unemployment Rate in Cimarron County is 0.2%.