Blaine County, OK Map & Demographics
Blaine County Map
Blaine County Overview
$30,442
PER CAPITA INCOME
$70,617
AVG FAMILY INCOME
$56,843
AVG HOUSEHOLD INCOME
44.2%
WAGE / INCOME GAP [ % ]
55.8¢/ $1
WAGE / INCOME GAP [ $ ]
0.44
INEQUALITY / GINI INDEX
8,661
TOTAL POPULATION
4,674
MALE POPULATION
3,987
FEMALE POPULATION
117.23
MALES / 100 FEMALES
85.30
FEMALES / 100 MALES
41.3
MEDIAN AGE
2.7
AVG FAMILY SIZE
2.2
AVG HOUSEHOLD SIZE
3,312
LABOR FORCE [ PEOPLE ]
48.3%
PERCENT IN LABOR FORCE
6.8%
UNEMPLOYMENT RATE
Income in Blaine County
Income Overview in Blaine County
Per Capita Income in Blaine County is $30,442, while median incomes of families and households are $70,617 and $56,843 respectively.
| Characteristic | Number | Measure |
| Per Capita Income | 8,661 | $30,442 |
| Median Family Income | 2,206 | $70,617 |
| Mean Family Income | 2,206 | $90,176 |
| Median Household Income | 3,431 | $56,843 |
| Mean Household Income | 3,431 | $79,015 |
| Income Deficit | 2,206 | $0 |
| Wage / Income Gap (%) | 8,661 | 44.21% |
| Wage / Income Gap ($) | 8,661 | 55.79¢ per $1 |
| Gini / Inequality Index | 8,661 | 0.44 |
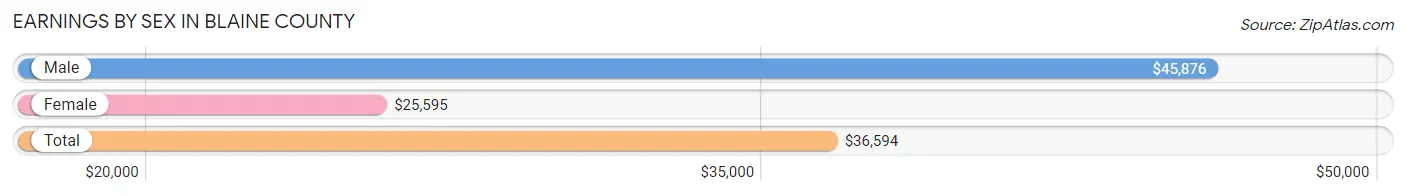
Earnings by Sex in Blaine County
Average Earnings in Blaine County are $36,594, $45,876 for men and $25,595 for women, a difference of 44.2%.
| Sex | Number | Average Earnings |
| Male | 2,082 (54.7%) | $45,876 |
| Female | 1,722 (45.3%) | $25,595 |
| Total | 3,804 (100.0%) | $36,594 |
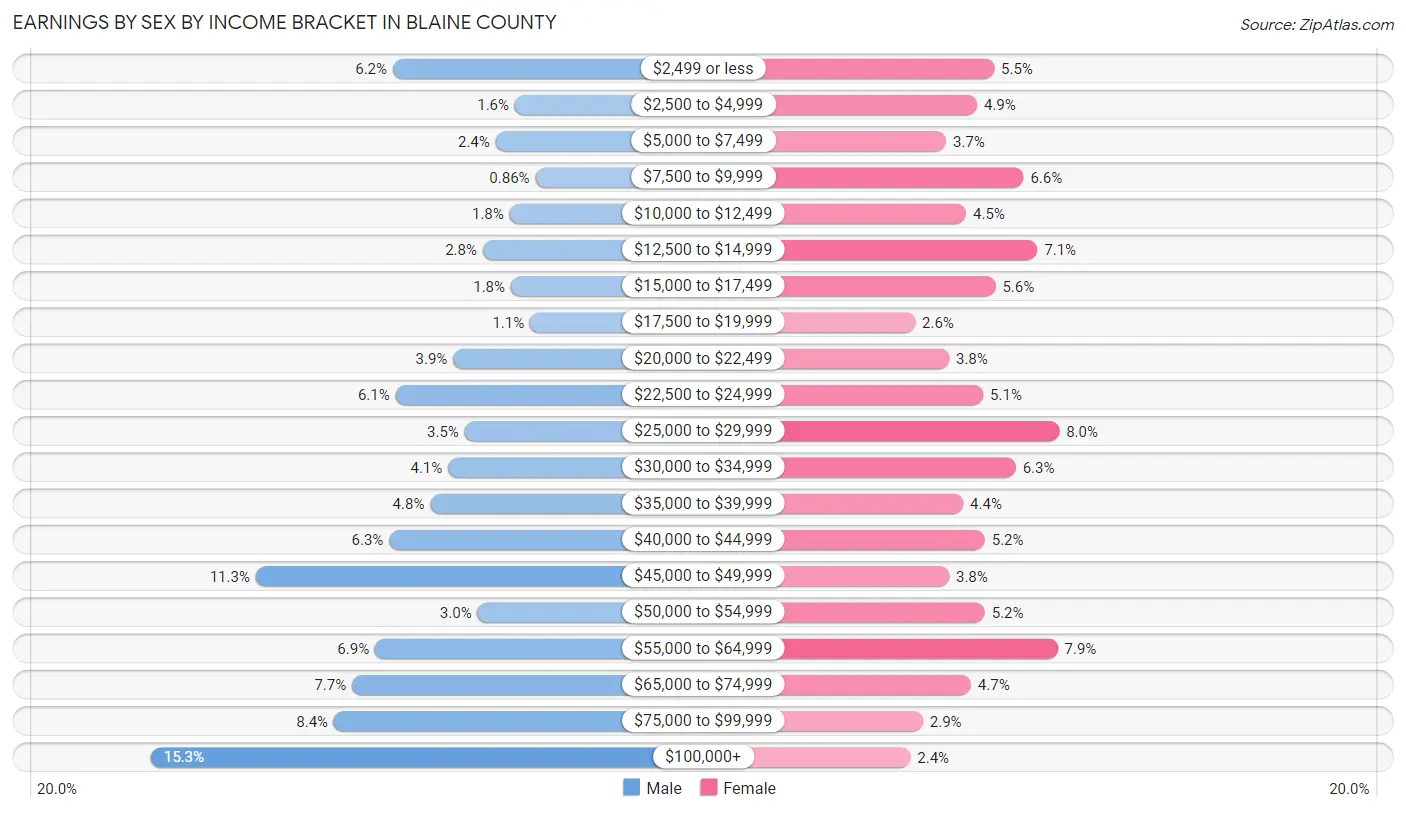
Earnings by Sex by Income Bracket in Blaine County
The most common earnings brackets in Blaine County are $100,000+ for men (318 | 15.3%) and $25,000 to $29,999 for women (137 | 8.0%).
| Income | Male | Female |
| $2,499 or less | 129 (6.2%) | 95 (5.5%) |
| $2,500 to $4,999 | 34 (1.6%) | 84 (4.9%) |
| $5,000 to $7,499 | 49 (2.4%) | 64 (3.7%) |
| $7,500 to $9,999 | 18 (0.9%) | 114 (6.6%) |
| $10,000 to $12,499 | 38 (1.8%) | 77 (4.5%) |
| $12,500 to $14,999 | 59 (2.8%) | 123 (7.1%) |
| $15,000 to $17,499 | 37 (1.8%) | 96 (5.6%) |
| $17,500 to $19,999 | 22 (1.1%) | 44 (2.6%) |
| $20,000 to $22,499 | 82 (3.9%) | 66 (3.8%) |
| $22,500 to $24,999 | 127 (6.1%) | 88 (5.1%) |
| $25,000 to $29,999 | 73 (3.5%) | 137 (8.0%) |
| $30,000 to $34,999 | 86 (4.1%) | 109 (6.3%) |
| $35,000 to $39,999 | 100 (4.8%) | 75 (4.4%) |
| $40,000 to $44,999 | 132 (6.3%) | 89 (5.2%) |
| $45,000 to $49,999 | 236 (11.3%) | 66 (3.8%) |
| $50,000 to $54,999 | 63 (3.0%) | 89 (5.2%) |
| $55,000 to $64,999 | 143 (6.9%) | 136 (7.9%) |
| $65,000 to $74,999 | 161 (7.7%) | 80 (4.6%) |
| $75,000 to $99,999 | 175 (8.4%) | 49 (2.9%) |
| $100,000+ | 318 (15.3%) | 41 (2.4%) |
| Total | 2,082 (100.0%) | 1,722 (100.0%) |
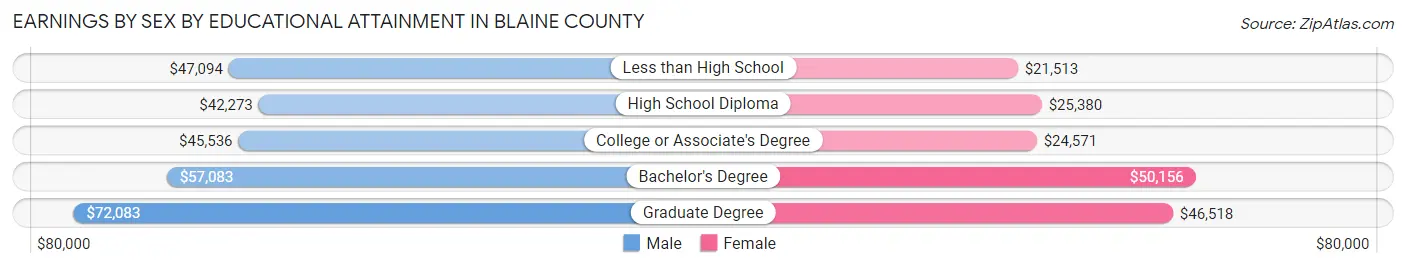
Earnings by Sex by Educational Attainment in Blaine County
Average earnings in Blaine County are $46,320 for men and $29,066 for women, a difference of 37.2%. Men with an educational attainment of graduate degree enjoy the highest average annual earnings of $72,083, while those with high school diploma education earn the least with $42,273. Women with an educational attainment of bachelor's degree earn the most with the average annual earnings of $50,156, while those with less than high school education have the smallest earnings of $21,513.
| Educational Attainment | Male Income | Female Income |
| Less than High School | $47,094 | $21,513 |
| High School Diploma | $42,273 | $25,380 |
| College or Associate's Degree | $45,536 | $24,571 |
| Bachelor's Degree | $57,083 | $50,156 |
| Graduate Degree | $72,083 | $46,518 |
| Total | $46,320 | $29,066 |
Family Income in Blaine County
Family Income Brackets in Blaine County
According to the Blaine County family income data, there are 457 families falling into the $50,000 to $74,999 income range, which is the most common income bracket and makes up 20.7% of all families. Conversely, the $10,000 to $14,999 income bracket is the least frequent group with only 55 families (2.5%) belonging to this category.
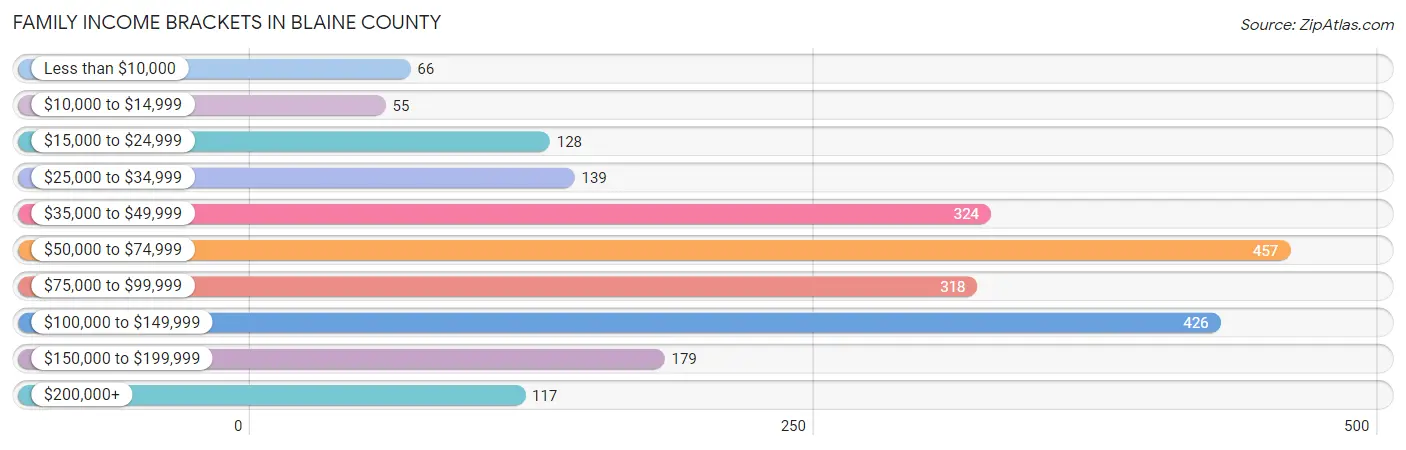
| Income Bracket | # Families | % Families |
| Less than $10,000 | 66 | 3.0% |
| $10,000 to $14,999 | 55 | 2.5% |
| $15,000 to $24,999 | 128 | 5.8% |
| $25,000 to $34,999 | 139 | 6.3% |
| $35,000 to $49,999 | 324 | 14.7% |
| $50,000 to $74,999 | 457 | 20.7% |
| $75,000 to $99,999 | 318 | 14.4% |
| $100,000 to $149,999 | 426 | 19.3% |
| $150,000 to $199,999 | 179 | 8.1% |
| $200,000+ | 117 | 5.3% |
Family Income by Famaliy Size in Blaine County
5-person families (162 | 7.3%) account for the highest median family income in Blaine County with $89,500 per family, while 2-person families (1,074 | 48.7%) have the highest median income of $34,000 per family member.
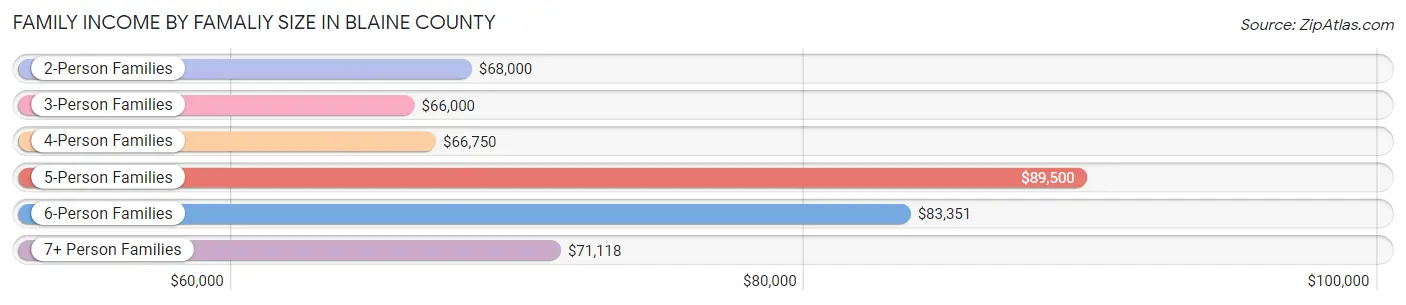
| Income Bracket | # Families | Median Income |
| 2-Person Families | 1,074 (48.7%) | $68,000 |
| 3-Person Families | 580 (26.3%) | $66,000 |
| 4-Person Families | 283 (12.8%) | $66,750 |
| 5-Person Families | 162 (7.3%) | $89,500 |
| 6-Person Families | 86 (3.9%) | $83,351 |
| 7+ Person Families | 21 (0.9%) | $71,118 |
| Total | 2,206 (100.0%) | $70,617 |
Family Income by Number of Earners in Blaine County
The median family income in Blaine County is $70,617, with families comprising 3+ earners (204) having the highest median family income of $139,688, while families with no earners (387) have the lowest median family income of $50,096, accounting for 9.2% and 17.5% of families, respectively.
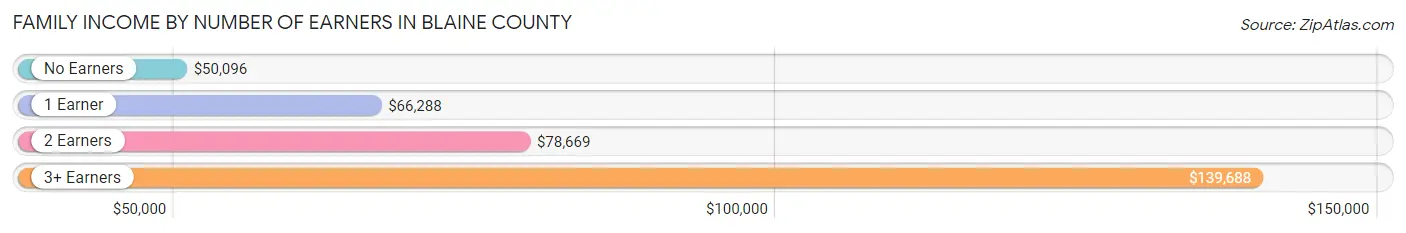
| Number of Earners | # Families | Median Income |
| No Earners | 387 (17.5%) | $50,096 |
| 1 Earner | 770 (34.9%) | $66,288 |
| 2 Earners | 845 (38.3%) | $78,669 |
| 3+ Earners | 204 (9.2%) | $139,688 |
| Total | 2,206 (100.0%) | $70,617 |
Household Income in Blaine County
Household Income Brackets in Blaine County
With 741 households falling in the category, the $50,000 to $74,999 income range is the most frequent in Blaine County, accounting for 21.6% of all households. In contrast, only 134 households (3.9%) fall into the less than $10,000 income bracket, making it the least populous group.
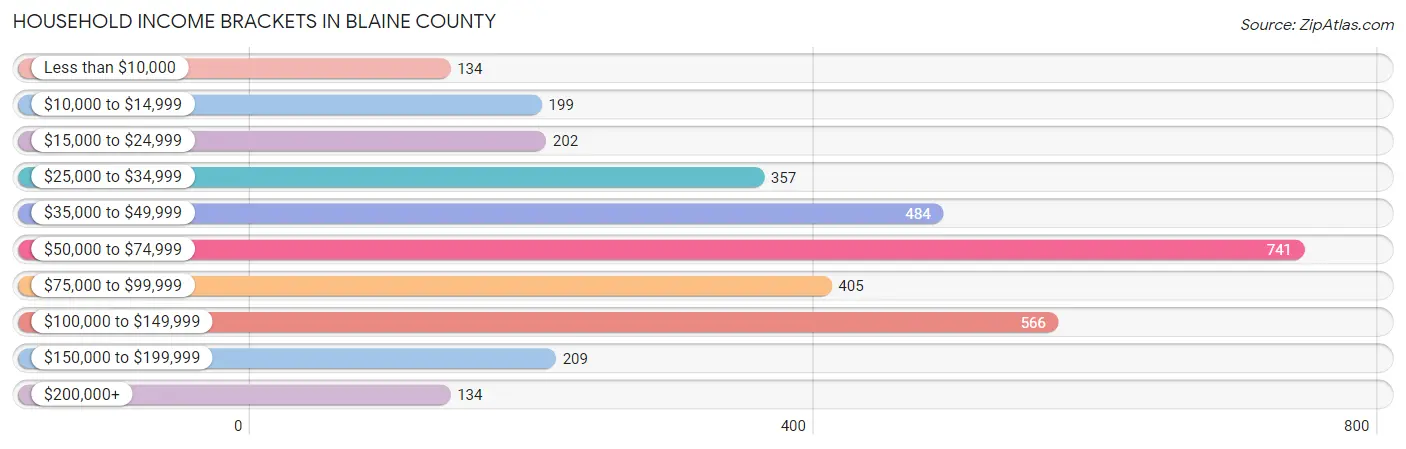
| Income Bracket | # Households | % Households |
| Less than $10,000 | 134 | 3.9% |
| $10,000 to $14,999 | 199 | 5.8% |
| $15,000 to $24,999 | 202 | 5.9% |
| $25,000 to $34,999 | 357 | 10.4% |
| $35,000 to $49,999 | 484 | 14.1% |
| $50,000 to $74,999 | 741 | 21.6% |
| $75,000 to $99,999 | 405 | 11.8% |
| $100,000 to $149,999 | 566 | 16.5% |
| $150,000 to $199,999 | 209 | 6.1% |
| $200,000+ | 134 | 3.9% |
Household Income by Householder Age in Blaine County
The median household income in Blaine County is $56,843, with the highest median household income of $70,583 found in the 45 to 64 years age bracket for the primary householder. A total of 1,208 households (35.2%) fall into this category. Meanwhile, the 15 to 24 years age bracket for the primary householder has the lowest median household income of $51,250, with 190 households (5.5%) in this group.
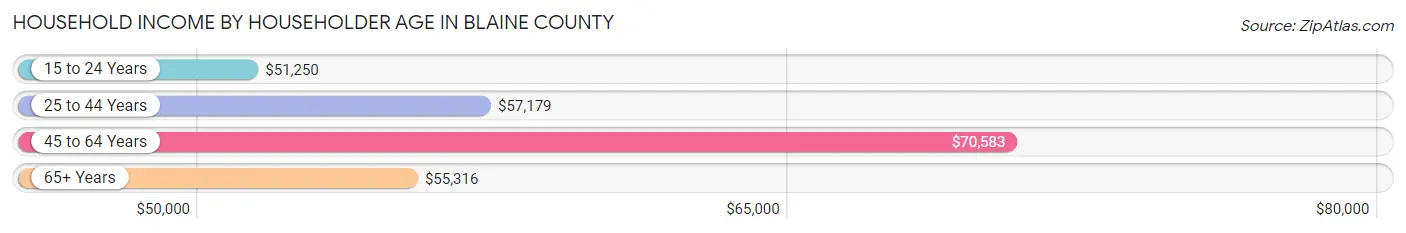
| Income Bracket | # Households | Median Income |
| 15 to 24 Years | 190 (5.5%) | $51,250 |
| 25 to 44 Years | 933 (27.2%) | $57,179 |
| 45 to 64 Years | 1,208 (35.2%) | $70,583 |
| 65+ Years | 1,100 (32.1%) | $55,316 |
| Total | 3,431 (100.0%) | $56,843 |
Poverty in Blaine County
Income Below Poverty by Sex and Age in Blaine County
With 10.6% poverty level for males and 16.5% for females among the residents of Blaine County, 5 year old males and 18 to 24 year old females are the most vulnerable to poverty, with 13 males (50.0%) and 75 females (35.7%) in their respective age groups living below the poverty level.
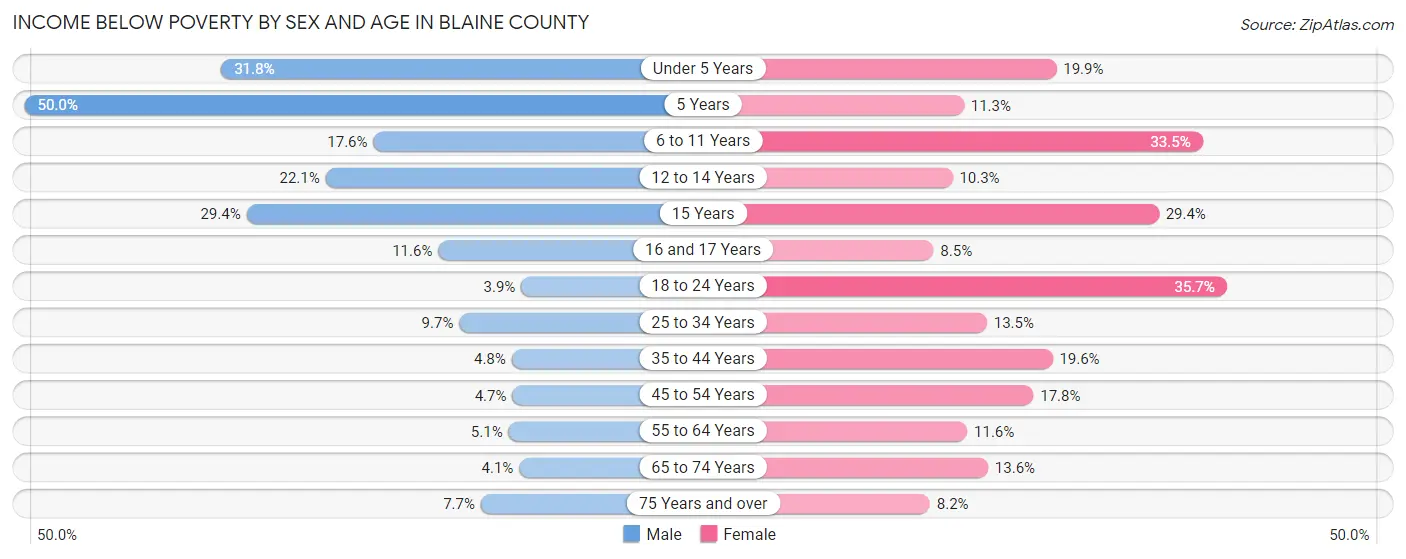
| Age Bracket | Male | Female |
| Under 5 Years | 60 (31.8%) | 44 (19.9%) |
| 5 Years | 13 (50.0%) | 6 (11.3%) |
| 6 to 11 Years | 85 (17.6%) | 81 (33.5%) |
| 12 to 14 Years | 47 (22.1%) | 19 (10.3%) |
| 15 Years | 20 (29.4%) | 15 (29.4%) |
| 16 and 17 Years | 13 (11.6%) | 13 (8.5%) |
| 18 to 24 Years | 9 (3.9%) | 75 (35.7%) |
| 25 to 34 Years | 37 (9.7%) | 63 (13.5%) |
| 35 to 44 Years | 12 (4.8%) | 79 (19.6%) |
| 45 to 54 Years | 18 (4.7%) | 75 (17.8%) |
| 55 to 64 Years | 27 (5.1%) | 70 (11.6%) |
| 65 to 74 Years | 18 (4.1%) | 64 (13.6%) |
| 75 Years and over | 20 (7.7%) | 30 (8.2%) |
| Total | 379 (10.6%) | 634 (16.5%) |
Income Above Poverty by Sex and Age in Blaine County
According to the poverty statistics in Blaine County, males aged 18 to 24 years and females aged 75 years and over are the age groups that are most secure financially, with 96.1% of males and 91.8% of females in these age groups living above the poverty line.
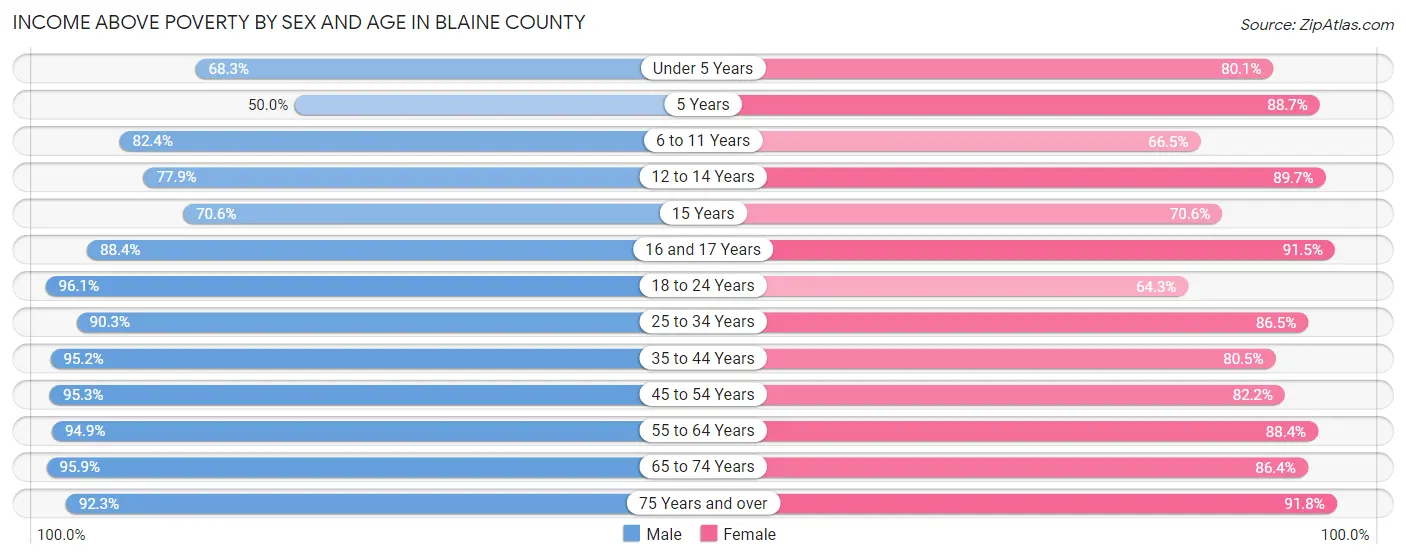
| Age Bracket | Male | Female |
| Under 5 Years | 129 (68.2%) | 177 (80.1%) |
| 5 Years | 13 (50.0%) | 47 (88.7%) |
| 6 to 11 Years | 397 (82.4%) | 161 (66.5%) |
| 12 to 14 Years | 166 (77.9%) | 166 (89.7%) |
| 15 Years | 48 (70.6%) | 36 (70.6%) |
| 16 and 17 Years | 99 (88.4%) | 140 (91.5%) |
| 18 to 24 Years | 221 (96.1%) | 135 (64.3%) |
| 25 to 34 Years | 346 (90.3%) | 405 (86.5%) |
| 35 to 44 Years | 238 (95.2%) | 325 (80.4%) |
| 45 to 54 Years | 362 (95.3%) | 347 (82.2%) |
| 55 to 64 Years | 503 (94.9%) | 532 (88.4%) |
| 65 to 74 Years | 421 (95.9%) | 408 (86.4%) |
| 75 Years and over | 241 (92.3%) | 337 (91.8%) |
| Total | 3,184 (89.4%) | 3,216 (83.5%) |
Income Below Poverty Among Married-Couple Families in Blaine County
The poverty statistics for married-couple families in Blaine County show that 3.5% or 58 of the total 1,664 families live below the poverty line. Families with no children have the highest poverty rate of 3.9%, comprising of 39 families. On the other hand, families with 5 or more children have the lowest poverty rate of 0.0%, which includes 0 families.
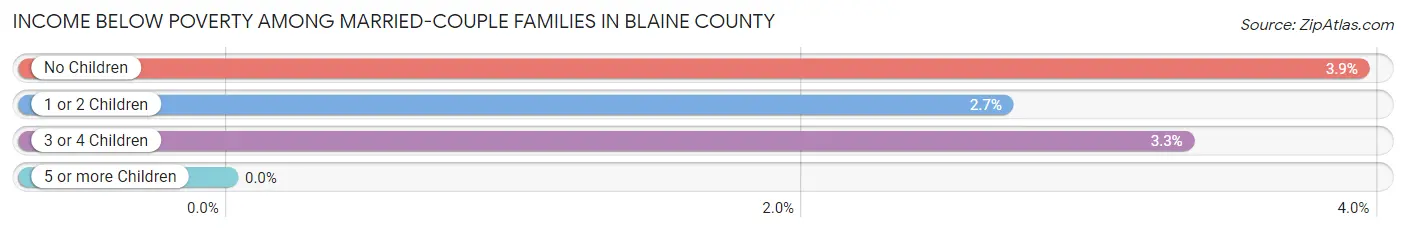
| Children | Above Poverty | Below Poverty |
| No Children | 950 (96.1%) | 39 (3.9%) |
| 1 or 2 Children | 469 (97.3%) | 13 (2.7%) |
| 3 or 4 Children | 174 (96.7%) | 6 (3.3%) |
| 5 or more Children | 13 (100.0%) | 0 (0.0%) |
| Total | 1,606 (96.5%) | 58 (3.5%) |
Income Below Poverty Among Single-Parent Households in Blaine County
According to the poverty data in Blaine County, 4.4% or 6 single-father households and 45.5% or 185 single-mother households are living below the poverty line. Among single-father households, those with 1 or 2 children have the highest poverty rate, with 6 households (8.3%) experiencing poverty. Likewise, among single-mother households, those with 5 or more children have the highest poverty rate, with 4 households (100.0%) falling below the poverty line.
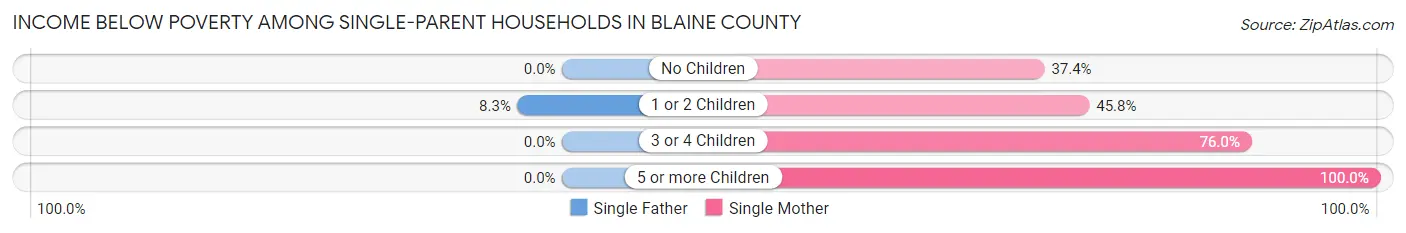
| Children | Single Father | Single Mother |
| No Children | 0 (0.0%) | 49 (37.4%) |
| 1 or 2 Children | 6 (8.3%) | 113 (45.8%) |
| 3 or 4 Children | 0 (0.0%) | 19 (76.0%) |
| 5 or more Children | 0 (0.0%) | 4 (100.0%) |
| Total | 6 (4.4%) | 185 (45.5%) |
Income Below Poverty Among Married-Couple vs Single-Parent Households in Blaine County
The poverty data for Blaine County shows that 58 of the married-couple family households (3.5%) and 191 of the single-parent households (35.2%) are living below the poverty level. Within the married-couple family households, those with no children have the highest poverty rate, with 39 households (3.9%) falling below the poverty line. Among the single-parent households, those with 5 or more children have the highest poverty rate, with 4 household (100.0%) living below poverty.
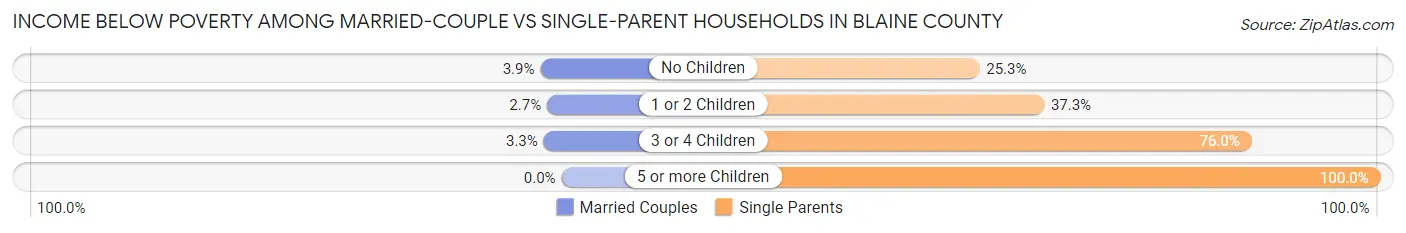
| Children | Married-Couple Families | Single-Parent Households |
| No Children | 39 (3.9%) | 49 (25.3%) |
| 1 or 2 Children | 13 (2.7%) | 119 (37.3%) |
| 3 or 4 Children | 6 (3.3%) | 19 (76.0%) |
| 5 or more Children | 0 (0.0%) | 4 (100.0%) |
| Total | 58 (3.5%) | 191 (35.2%) |
Race in Blaine County
The most populous races in Blaine County are White / Caucasian (6,709 | 77.5%), Hispanic or Latino (1,176 | 13.6%), and Two or more Races (749 | 8.6%).
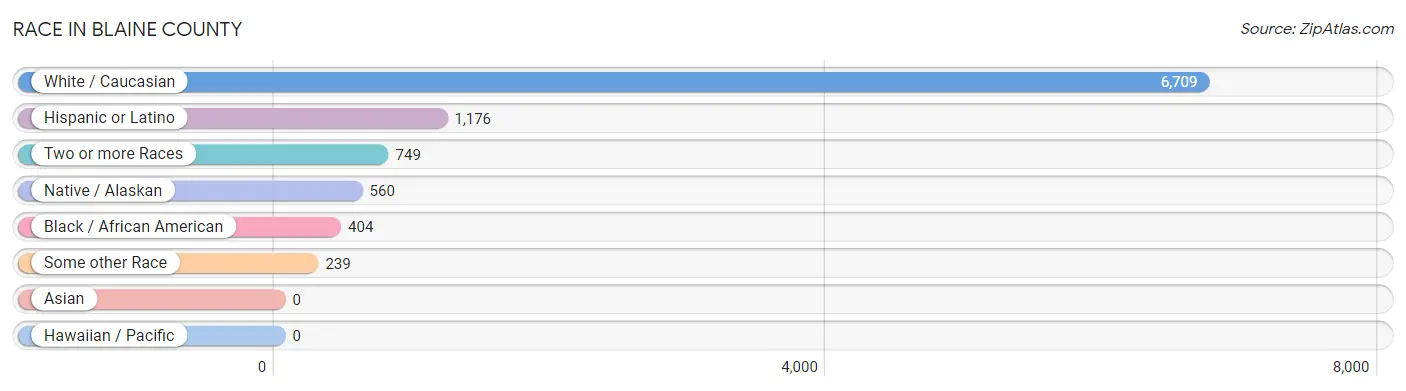
| Race | # Population | % Population |
| Asian | 0 | 0.0% |
| Black / African American | 404 | 4.7% |
| Hawaiian / Pacific | 0 | 0.0% |
| Hispanic or Latino | 1,176 | 13.6% |
| Native / Alaskan | 560 | 6.5% |
| White / Caucasian | 6,709 | 77.5% |
| Two or more Races | 749 | 8.6% |
| Some other Race | 239 | 2.8% |
| Total | 8,661 | 100.0% |
Ancestry in Blaine County
The most populous ancestries reported in Blaine County are German (1,812 | 20.9%), Mexican (970 | 11.2%), English (873 | 10.1%), Irish (689 | 8.0%), and American (412 | 4.8%), together accounting for 54.9% of all Blaine County residents.
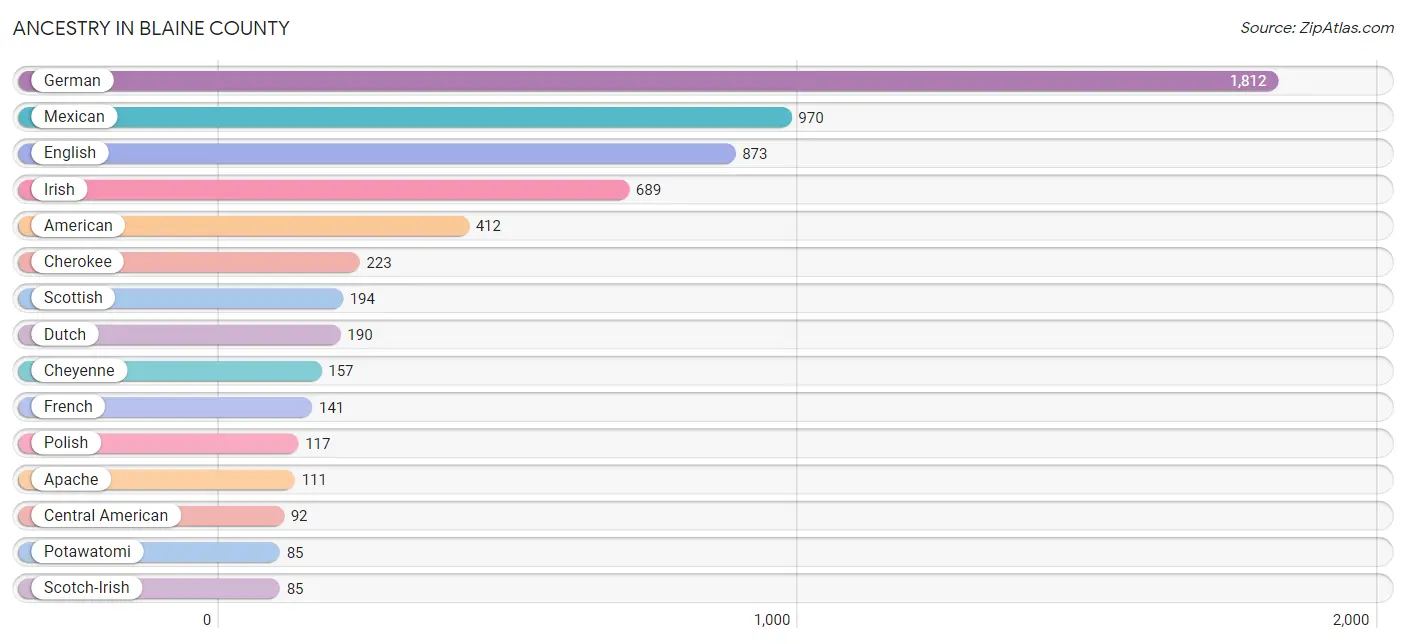
| Ancestry | # Population | % Population |
| African | 20 | 0.2% |
| American | 412 | 4.8% |
| Apache | 111 | 1.3% |
| Arapaho | 30 | 0.4% |
| Barbadian | 15 | 0.2% |
| Basque | 29 | 0.3% |
| Bhutanese | 11 | 0.1% |
| Blackfeet | 9 | 0.1% |
| British | 27 | 0.3% |
| Central American | 92 | 1.1% |
| Central American Indian | 30 | 0.4% |
| Cherokee | 223 | 2.6% |
| Cheyenne | 157 | 1.8% |
| Chickasaw | 4 | 0.1% |
| Choctaw | 50 | 0.6% |
| Colombian | 3 | 0.0% |
| Comanche | 21 | 0.2% |
| Creek | 45 | 0.5% |
| Czech | 63 | 0.7% |
| Danish | 12 | 0.1% |
| Dominican | 10 | 0.1% |
| Dutch | 190 | 2.2% |
| Dutch West Indian | 8 | 0.1% |
| Ecuadorian | 7 | 0.1% |
| English | 873 | 10.1% |
| European | 35 | 0.4% |
| French | 141 | 1.6% |
| French Canadian | 25 | 0.3% |
| German | 1,812 | 20.9% |
| German Russian | 1 | 0.0% |
| Honduran | 51 | 0.6% |
| Hungarian | 7 | 0.1% |
| Irish | 689 | 8.0% |
| Israeli | 9 | 0.1% |
| Italian | 12 | 0.1% |
| Jamaican | 4 | 0.1% |
| Kiowa | 23 | 0.3% |
| Korean | 5 | 0.1% |
| Liberian | 1 | 0.0% |
| Mexican | 970 | 11.2% |
| Northern European | 13 | 0.2% |
| Norwegian | 65 | 0.7% |
| Osage | 2 | 0.0% |
| Ottawa | 15 | 0.2% |
| Pennsylvania German | 3 | 0.0% |
| Polish | 117 | 1.3% |
| Potawatomi | 85 | 1.0% |
| Romanian | 11 | 0.1% |
| Russian | 10 | 0.1% |
| Salvadoran | 41 | 0.5% |
| Samoan | 14 | 0.2% |
| Scotch-Irish | 85 | 1.0% |
| Scottish | 194 | 2.2% |
| Seminole | 15 | 0.2% |
| Sioux | 18 | 0.2% |
| South African | 3 | 0.0% |
| South American | 10 | 0.1% |
| Spaniard | 20 | 0.2% |
| Subsaharan African | 24 | 0.3% |
| Swedish | 79 | 0.9% |
| Swiss | 31 | 0.4% |
| Welsh | 37 | 0.4% | View All 62 Rows |
Immigrants in Blaine County
The most numerous immigrant groups reported in Blaine County came from Latin America (534 | 6.2%), Central America (501 | 5.8%), Mexico (409 | 4.7%), Honduras (51 | 0.6%), and El Salvador (41 | 0.5%), together accounting for 17.7% of all Blaine County residents.
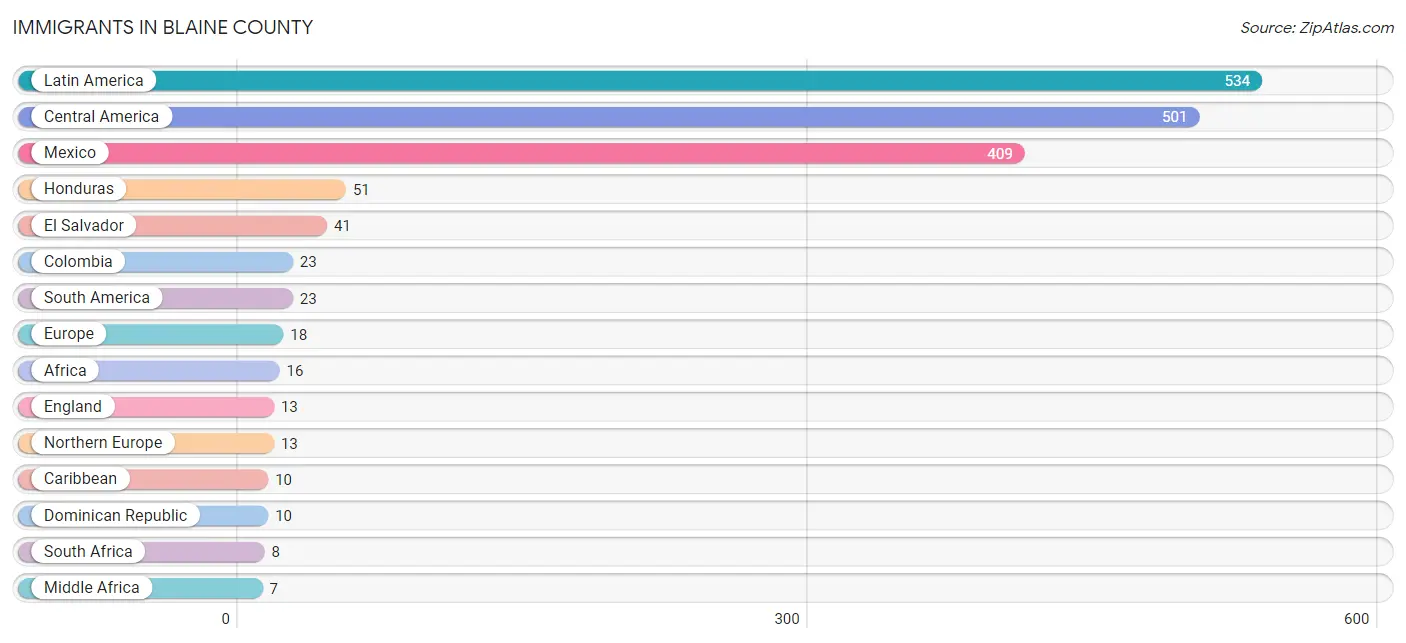
| Immigration Origin | # Population | % Population |
| Africa | 16 | 0.2% |
| Caribbean | 10 | 0.1% |
| Central America | 501 | 5.8% |
| Colombia | 23 | 0.3% |
| Dominican Republic | 10 | 0.1% |
| Eastern Europe | 5 | 0.1% |
| El Salvador | 41 | 0.5% |
| England | 13 | 0.2% |
| Europe | 18 | 0.2% |
| Honduras | 51 | 0.6% |
| Latin America | 534 | 6.2% |
| Liberia | 1 | 0.0% |
| Mexico | 409 | 4.7% |
| Middle Africa | 7 | 0.1% |
| Northern Europe | 13 | 0.2% |
| Romania | 5 | 0.1% |
| South Africa | 8 | 0.1% |
| South America | 23 | 0.3% |
| Western Africa | 1 | 0.0% | View All 19 Rows |
Sex and Age in Blaine County
Sex and Age in Blaine County
The most populous age groups in Blaine County are 10 to 14 Years (391 | 8.4%) for men and 10 to 14 Years (344 | 8.6%) for women.
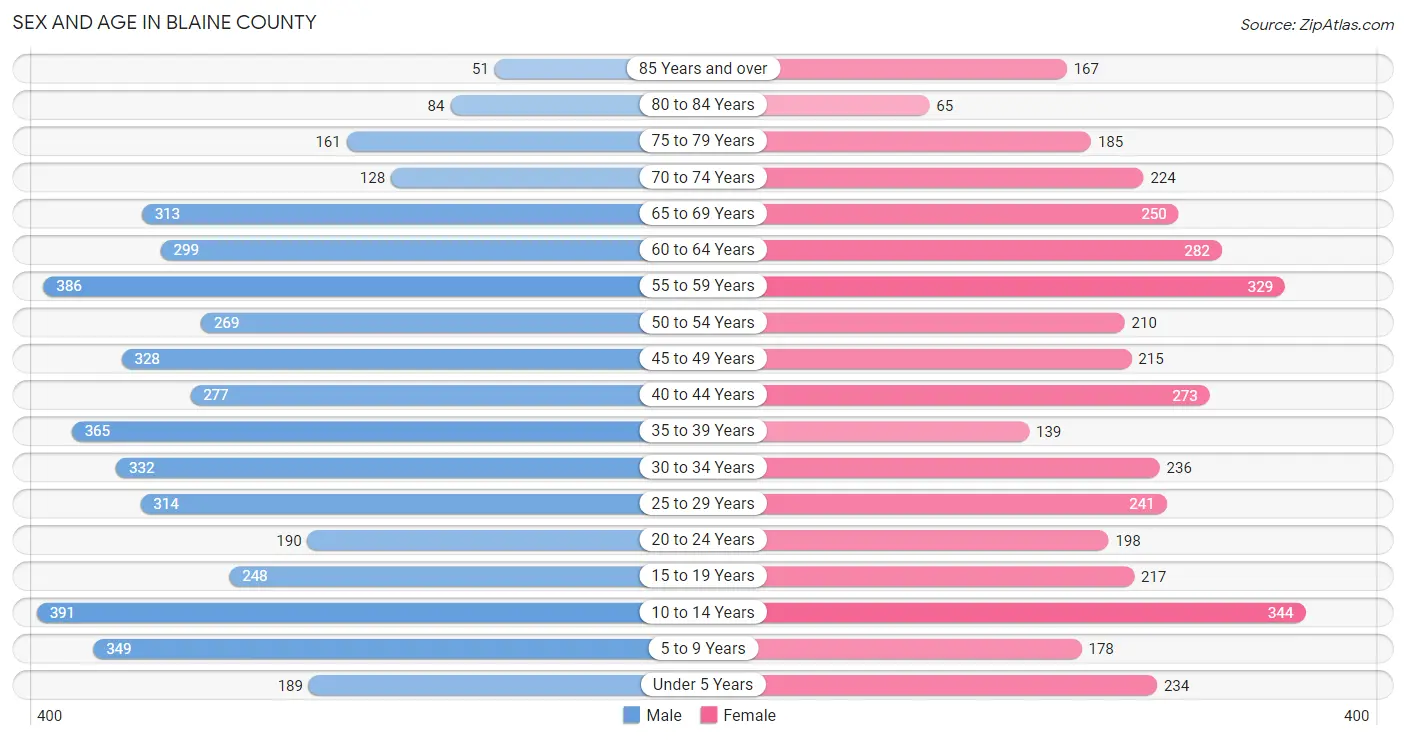
| Age Bracket | Male | Female |
| Under 5 Years | 189 (4.0%) | 234 (5.9%) |
| 5 to 9 Years | 349 (7.5%) | 178 (4.5%) |
| 10 to 14 Years | 391 (8.4%) | 344 (8.6%) |
| 15 to 19 Years | 248 (5.3%) | 217 (5.4%) |
| 20 to 24 Years | 190 (4.1%) | 198 (5.0%) |
| 25 to 29 Years | 314 (6.7%) | 241 (6.0%) |
| 30 to 34 Years | 332 (7.1%) | 236 (5.9%) |
| 35 to 39 Years | 365 (7.8%) | 139 (3.5%) |
| 40 to 44 Years | 277 (5.9%) | 273 (6.9%) |
| 45 to 49 Years | 328 (7.0%) | 215 (5.4%) |
| 50 to 54 Years | 269 (5.8%) | 210 (5.3%) |
| 55 to 59 Years | 386 (8.3%) | 329 (8.3%) |
| 60 to 64 Years | 299 (6.4%) | 282 (7.1%) |
| 65 to 69 Years | 313 (6.7%) | 250 (6.3%) |
| 70 to 74 Years | 128 (2.7%) | 224 (5.6%) |
| 75 to 79 Years | 161 (3.4%) | 185 (4.6%) |
| 80 to 84 Years | 84 (1.8%) | 65 (1.6%) |
| 85 Years and over | 51 (1.1%) | 167 (4.2%) |
| Total | 4,674 (100.0%) | 3,987 (100.0%) |
Families and Households in Blaine County
Median Family Size in Blaine County
The median family size in Blaine County is 2.74 persons per family, with married-couple families (1,664 | 75.4%) accounting for the largest median family size of 2.83 persons per family. On the other hand, single male/father families (135 | 6.1%) represent the smallest median family size with 2.38 persons per family.
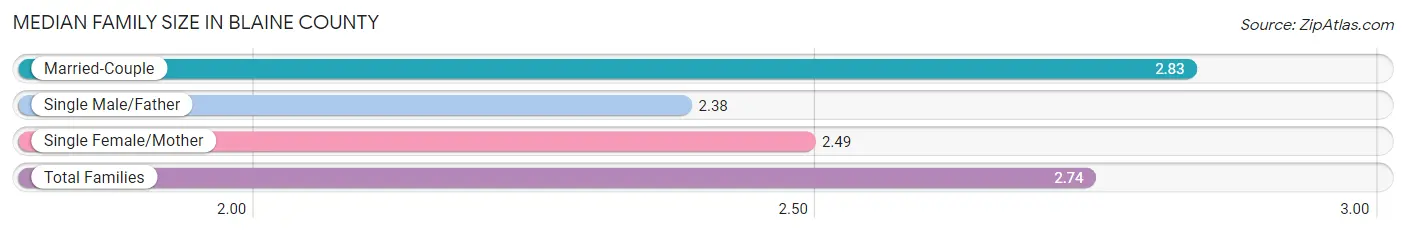
| Family Type | # Families | Family Size |
| Married-Couple | 1,664 (75.4%) | 2.83 |
| Single Male/Father | 135 (6.1%) | 2.38 |
| Single Female/Mother | 407 (18.4%) | 2.49 |
| Total Families | 2,206 (100.0%) | 2.74 |
Median Household Size in Blaine County
The median household size in Blaine County is 2.18 persons per household, with married-couple households (1,664 | 48.5%) accounting for the largest median household size of 2.83 persons per household. non-family households (1,225 | 35.7%) represent the smallest median household size with 1.10 persons per household.
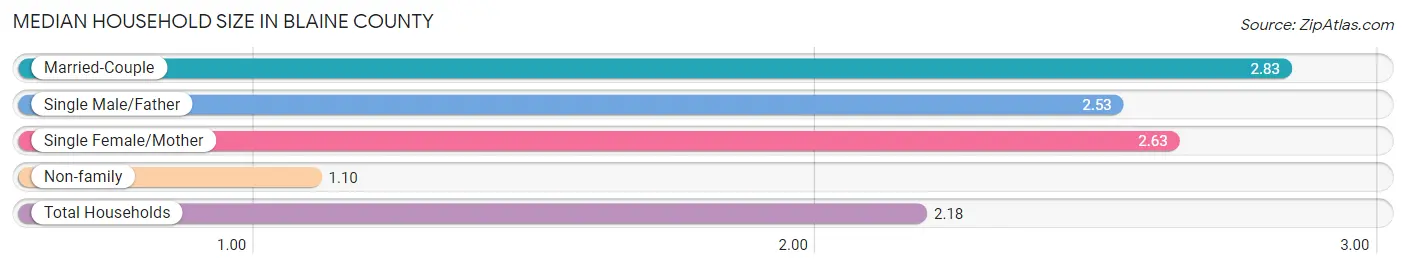
| Household Type | # Households | Household Size |
| Married-Couple | 1,664 (48.5%) | 2.83 |
| Single Male/Father | 135 (3.9%) | 2.53 |
| Single Female/Mother | 407 (11.9%) | 2.63 |
| Non-family | 1,225 (35.7%) | 1.10 |
| Total Households | 3,431 (100.0%) | 2.18 |
Household Size by Marriage Status in Blaine County
Out of a total of 3,431 households in Blaine County, 2,206 (64.3%) are family households, while 1,225 (35.7%) are nonfamily households. The most numerous type of family households are 2-person households, comprising 1,016, and the most common type of nonfamily households are 1-person households, comprising 1,111.
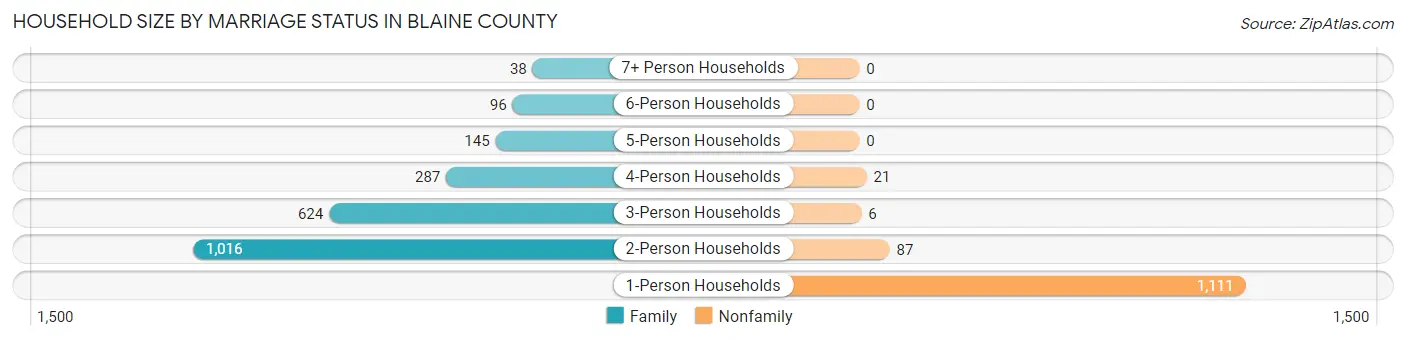
| Household Size | Family Households | Nonfamily Households |
| 1-Person Households | - | 1,111 (32.4%) |
| 2-Person Households | 1,016 (29.6%) | 87 (2.5%) |
| 3-Person Households | 624 (18.2%) | 6 (0.2%) |
| 4-Person Households | 287 (8.4%) | 21 (0.6%) |
| 5-Person Households | 145 (4.2%) | 0 (0.0%) |
| 6-Person Households | 96 (2.8%) | 0 (0.0%) |
| 7+ Person Households | 38 (1.1%) | 0 (0.0%) |
| Total | 2,206 (64.3%) | 1,225 (35.7%) |
Female Fertility in Blaine County
Fertility by Age in Blaine County
Average fertility rate in Blaine County is 79.0 births per 1,000 women. Women in the age bracket of 20 to 34 years have the highest fertility rate with 160.0 births per 1,000 women. Women in the age bracket of 20 to 34 years acount for 87.8% of all women with births.
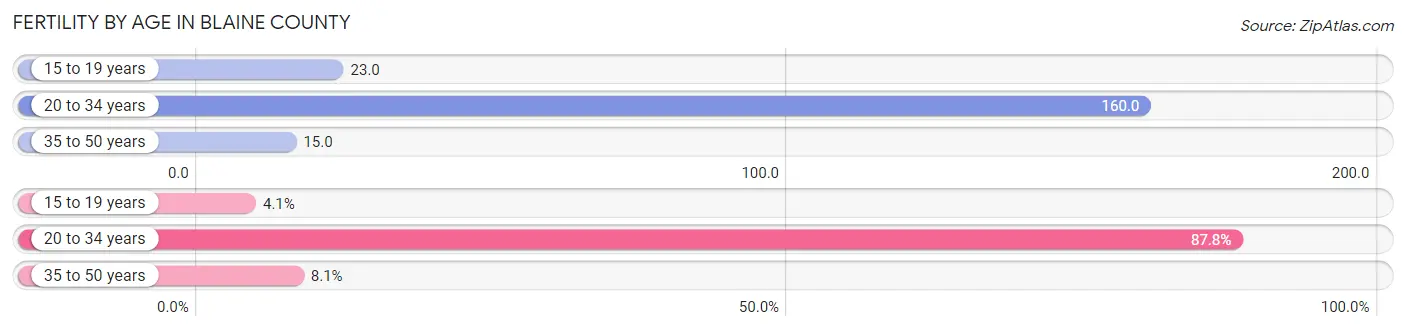
| Age Bracket | Women with Births | Births / 1,000 Women |
| 15 to 19 years | 5 (4.1%) | 23.0 |
| 20 to 34 years | 108 (87.8%) | 160.0 |
| 35 to 50 years | 10 (8.1%) | 15.0 |
| Total | 123 (100.0%) | 79.0 |
Fertility by Age by Marriage Status in Blaine County
95.9% of women with births (123) in Blaine County are married. The highest percentage of unmarried women with births falls into 15 to 19 years age bracket with 100.0% of them unmarried at the time of birth, while the lowest percentage of unmarried women with births belong to 20 to 34 years age bracket with 0.0% of them unmarried.
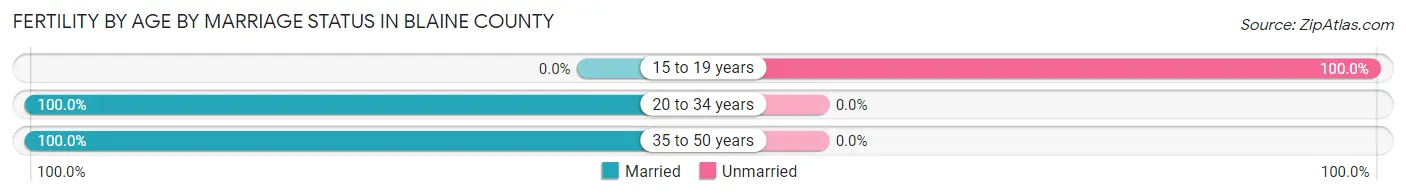
| Age Bracket | Married | Unmarried |
| 15 to 19 years | 0 (0.0%) | 5 (100.0%) |
| 20 to 34 years | 108 (100.0%) | 0 (0.0%) |
| 35 to 50 years | 10 (100.0%) | 0 (0.0%) |
| Total | 118 (95.9%) | 5 (4.1%) |
Fertility by Education in Blaine County
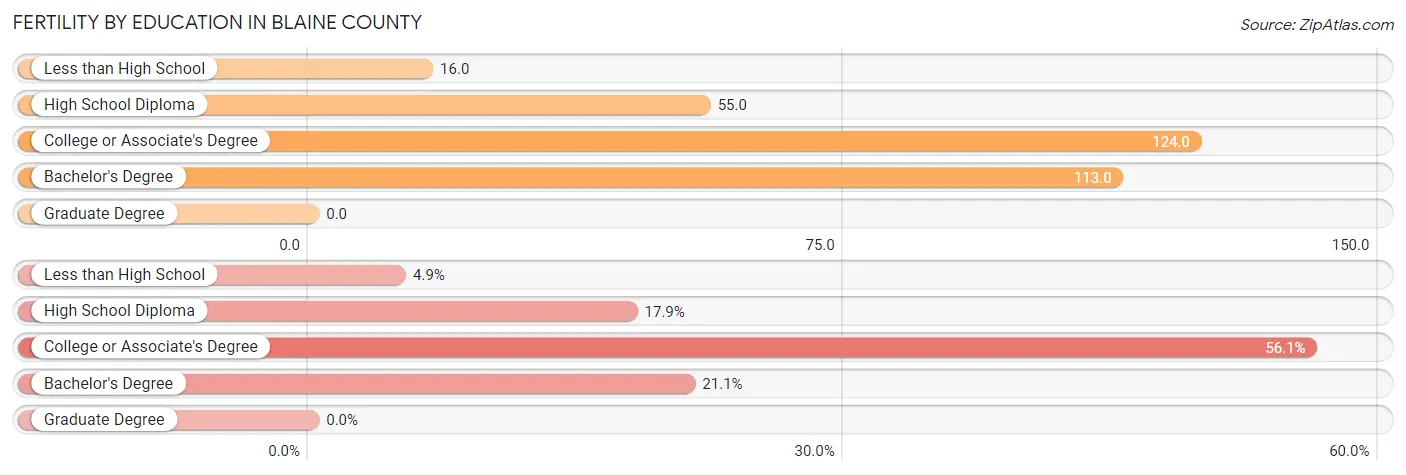
| Educational Attainment | Women with Births | Births / 1,000 Women |
| Less than High School | 6 (4.9%) | 16.0 |
| High School Diploma | 22 (17.9%) | 55.0 |
| College or Associate's Degree | 69 (56.1%) | 124.0 |
| Bachelor's Degree | 26 (21.1%) | 113.0 |
| Graduate Degree | 0 (0.0%) | 0.0 |
| Total | 123 (100.0%) | 79.0 |
Fertility by Education by Marriage Status in Blaine County
4.1% of women with births in Blaine County are unmarried. Women with the educational attainment of high school diploma are most likely to be married with 100.0% of them married at childbirth, while women with the educational attainment of less than high school are least likely to be married with 83.3% of them unmarried at childbirth.
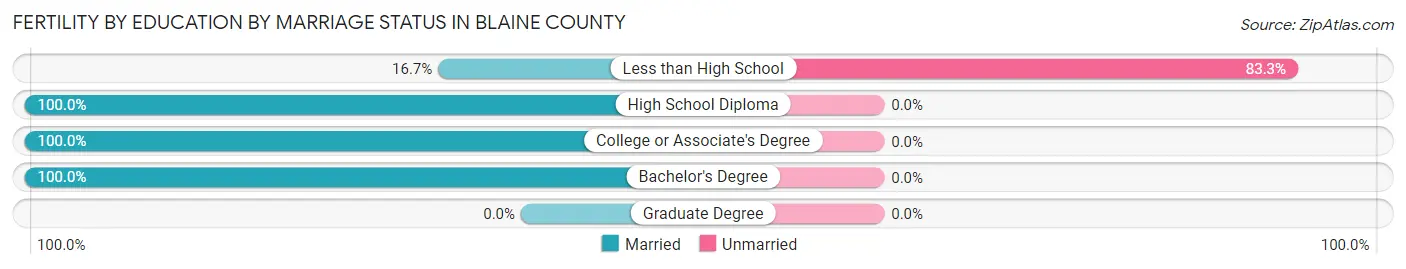
| Educational Attainment | Married | Unmarried |
| Less than High School | 1 (16.7%) | 5 (83.3%) |
| High School Diploma | 22 (100.0%) | 0 (0.0%) |
| College or Associate's Degree | 69 (100.0%) | 0 (0.0%) |
| Bachelor's Degree | 26 (100.0%) | 0 (0.0%) |
| Graduate Degree | 0 (0.0%) | 0 (0.0%) |
| Total | 118 (95.9%) | 5 (4.1%) |
Employment Characteristics in Blaine County
Employment by Class of Employer in Blaine County
Among the 3,028 employed individuals in Blaine County, private company employees (1,889 | 62.4%), local government employees (320 | 10.6%), and self-employed (not incorporated) (317 | 10.5%) make up the most common classes of employment.
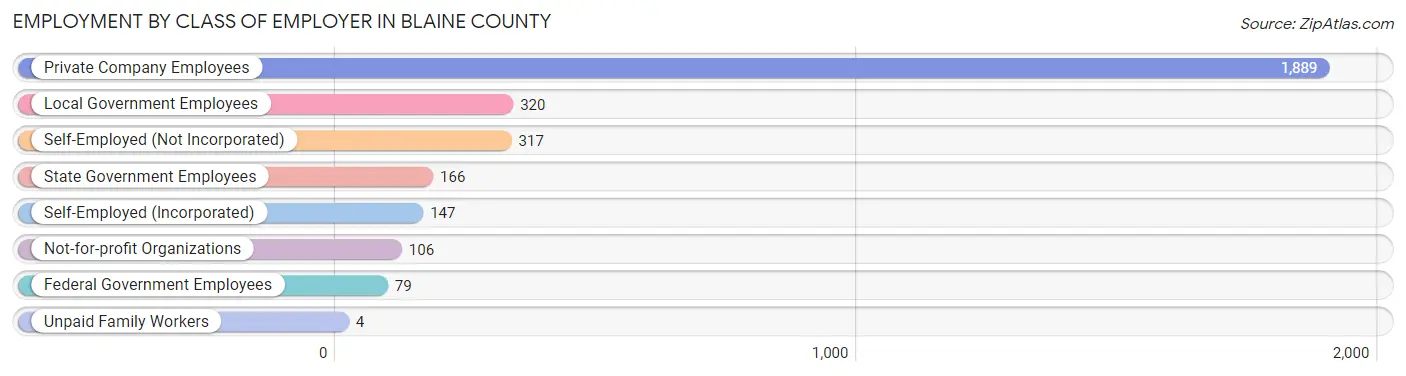
| Employer Class | # Employees | % Employees |
| Private Company Employees | 1,889 | 62.4% |
| Self-Employed (Incorporated) | 147 | 4.9% |
| Self-Employed (Not Incorporated) | 317 | 10.5% |
| Not-for-profit Organizations | 106 | 3.5% |
| Local Government Employees | 320 | 10.6% |
| State Government Employees | 166 | 5.5% |
| Federal Government Employees | 79 | 2.6% |
| Unpaid Family Workers | 4 | 0.1% |
| Total | 3,028 | 100.0% |
Employment Status by Age in Blaine County
According to the labor force statistics for Blaine County, out of the total population over 16 years of age (6,857), 48.3% or 3,312 individuals are in the labor force, with 6.8% or 225 of them unemployed. The age group with the highest labor force participation rate is 20 to 24 years, with 75.0% or 291 individuals in the labor force. Within the labor force, the 60 to 64 years age range has the highest percentage of unemployed individuals, with 17.0% or 53 of them being unemployed.
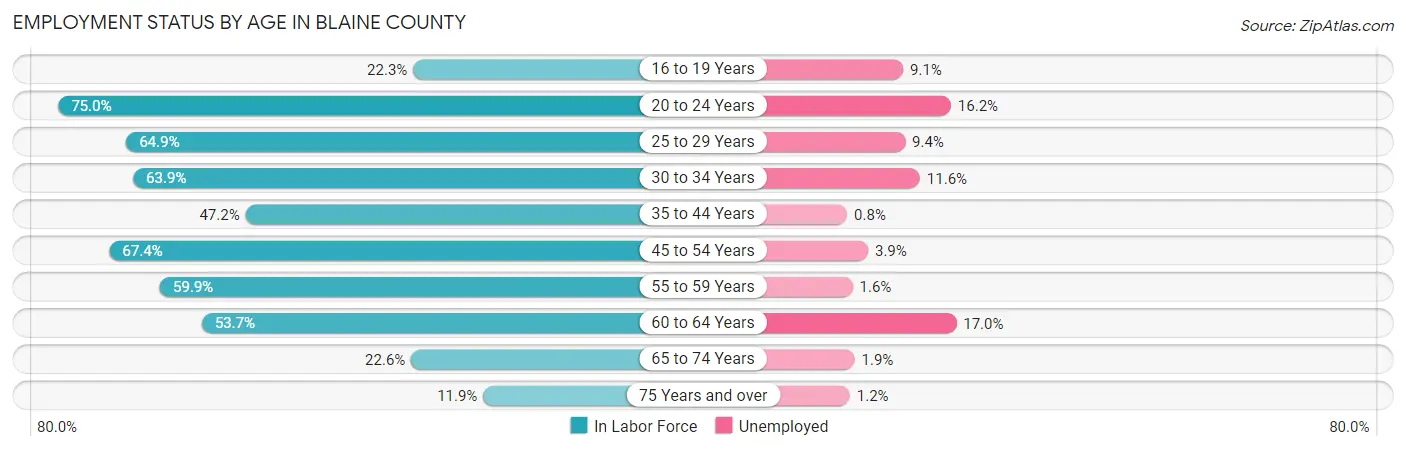
| Age Bracket | In Labor Force | Unemployed |
| 16 to 19 Years | 77 (22.3%) | 7 (9.1%) |
| 20 to 24 Years | 291 (75.0%) | 47 (16.2%) |
| 25 to 29 Years | 360 (64.9%) | 34 (9.4%) |
| 30 to 34 Years | 363 (63.9%) | 42 (11.6%) |
| 35 to 44 Years | 497 (47.2%) | 4 (0.8%) |
| 45 to 54 Years | 689 (67.4%) | 27 (3.9%) |
| 55 to 59 Years | 428 (59.9%) | 7 (1.6%) |
| 60 to 64 Years | 312 (53.7%) | 53 (17.0%) |
| 65 to 74 Years | 207 (22.6%) | 4 (1.9%) |
| 75 Years and over | 85 (11.9%) | 1 (1.2%) |
| Total | 3,312 (48.3%) | 225 (6.8%) |
Employment Status by Educational Attainment in Blaine County
According to labor force statistics for Blaine County, 59.0% of individuals (2,652) out of the total population between 25 and 64 years of age (4,495) are in the labor force, with 6.3% or 167 of them being unemployed. The group with the highest labor force participation rate are those with the educational attainment of bachelor's degree or higher, with 76.9% or 591 individuals in the labor force. Within the labor force, individuals with high school diploma education have the highest percentage of unemployment, with 13.3% or 125 of them being unemployed.
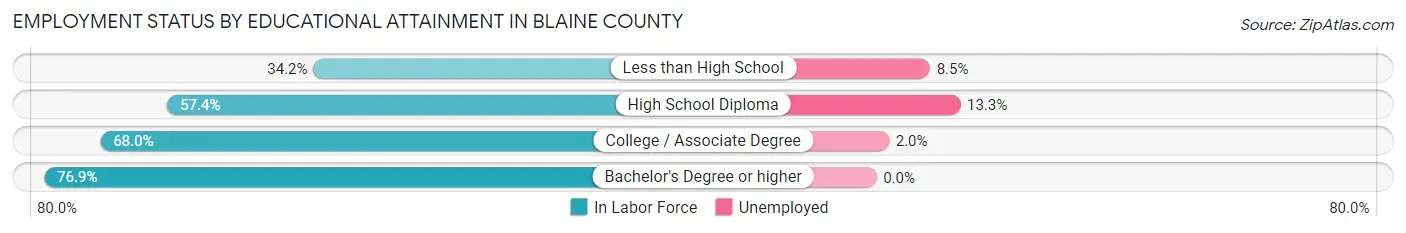
| Educational Attainment | In Labor Force | Unemployed |
| Less than High School | 305 (34.2%) | 76 (8.5%) |
| High School Diploma | 940 (57.4%) | 218 (13.3%) |
| College / Associate Degree | 814 (68.0%) | 24 (2.0%) |
| Bachelor's Degree or higher | 591 (76.9%) | 0 (0.0%) |
| Total | 2,652 (59.0%) | 283 (6.3%) |
Employment Occupations by Sex in Blaine County
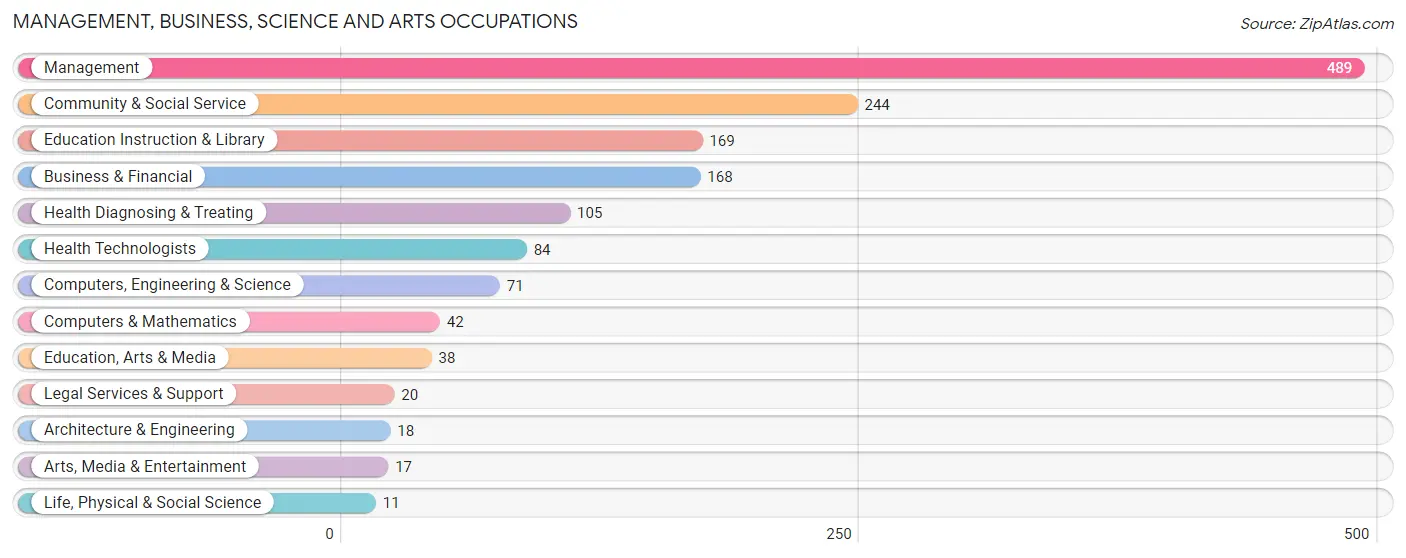
Management, Business, Science and Arts Occupations
The most common Management, Business, Science and Arts occupations in Blaine County are Management (489 | 15.9%), Community & Social Service (244 | 7.9%), Education Instruction & Library (169 | 5.5%), Business & Financial (168 | 5.4%), and Health Diagnosing & Treating (105 | 3.4%).
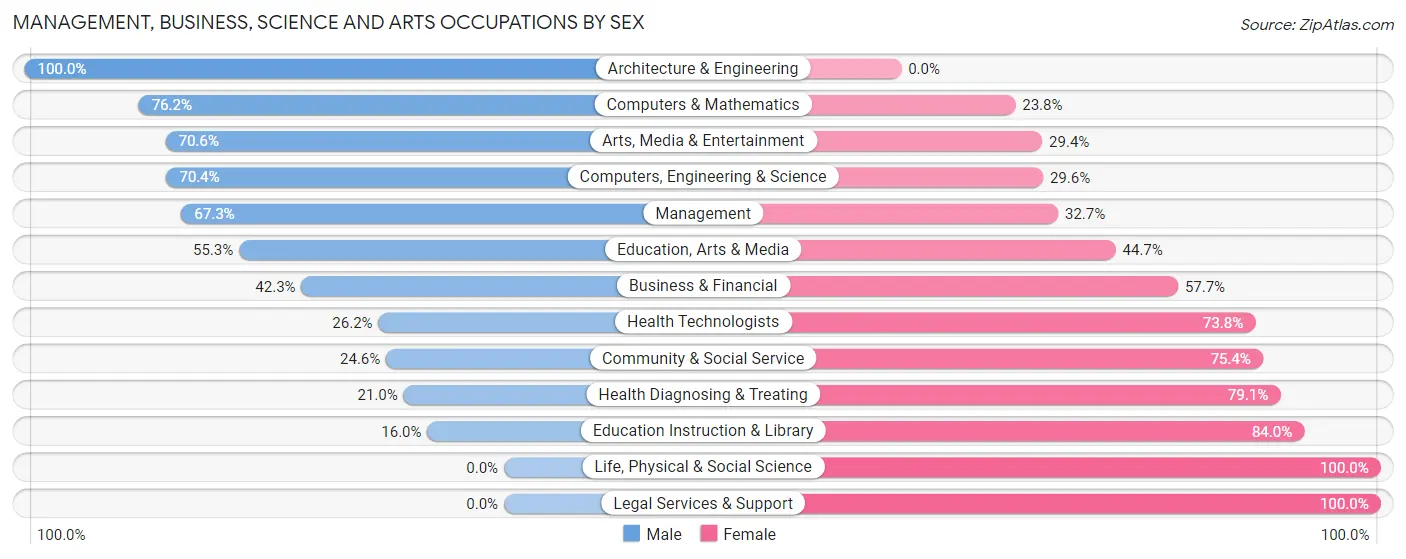
Management, Business, Science and Arts Occupations by Sex
Within the Management, Business, Science and Arts occupations in Blaine County, the most male-oriented occupations are Architecture & Engineering (100.0%), Computers & Mathematics (76.2%), and Arts, Media & Entertainment (70.6%), while the most female-oriented occupations are Life, Physical & Social Science (100.0%), Legal Services & Support (100.0%), and Education Instruction & Library (84.0%).
| Occupation | Male | Female |
| Management | 329 (67.3%) | 160 (32.7%) |
| Business & Financial | 71 (42.3%) | 97 (57.7%) |
| Computers, Engineering & Science | 50 (70.4%) | 21 (29.6%) |
| Computers & Mathematics | 32 (76.2%) | 10 (23.8%) |
| Architecture & Engineering | 18 (100.0%) | 0 (0.0%) |
| Life, Physical & Social Science | 0 (0.0%) | 11 (100.0%) |
| Community & Social Service | 60 (24.6%) | 184 (75.4%) |
| Education, Arts & Media | 21 (55.3%) | 17 (44.7%) |
| Legal Services & Support | 0 (0.0%) | 20 (100.0%) |
| Education Instruction & Library | 27 (16.0%) | 142 (84.0%) |
| Arts, Media & Entertainment | 12 (70.6%) | 5 (29.4%) |
| Health Diagnosing & Treating | 22 (20.9%) | 83 (79.0%) |
| Health Technologists | 22 (26.2%) | 62 (73.8%) |
| Total (Category) | 532 (49.4%) | 545 (50.6%) |
| Total (Overall) | 1,659 (53.8%) | 1,425 (46.2%) |
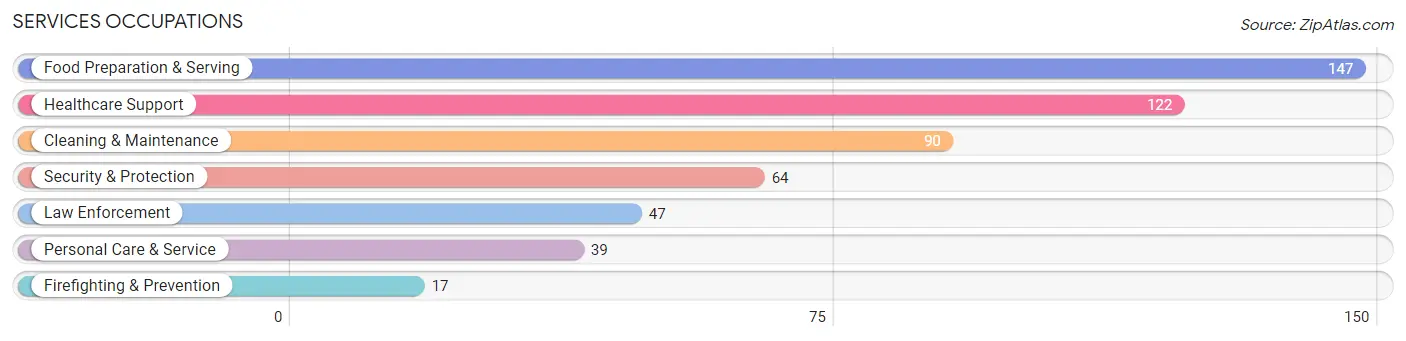
Services Occupations
The most common Services occupations in Blaine County are Food Preparation & Serving (147 | 4.8%), Healthcare Support (122 | 4.0%), Cleaning & Maintenance (90 | 2.9%), Security & Protection (64 | 2.1%), and Law Enforcement (47 | 1.5%).
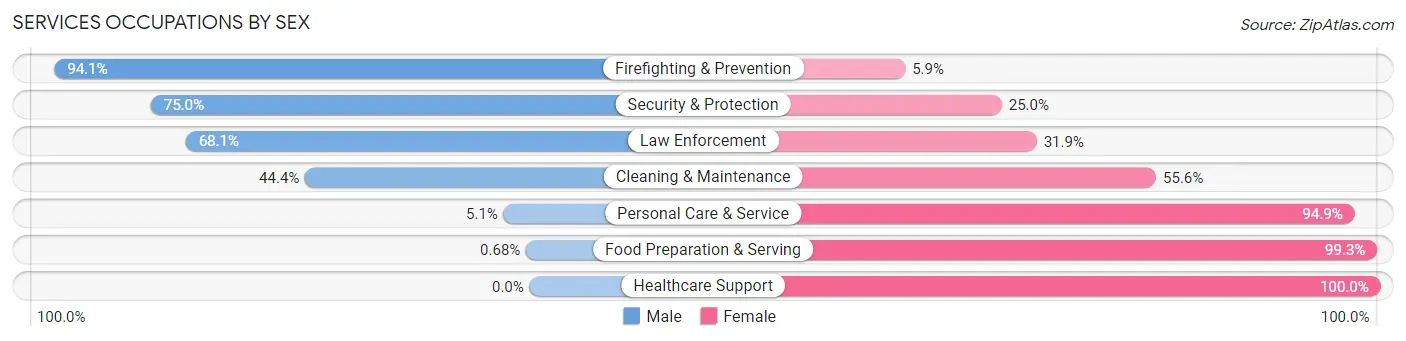
Services Occupations by Sex
Within the Services occupations in Blaine County, the most male-oriented occupations are Firefighting & Prevention (94.1%), Security & Protection (75.0%), and Law Enforcement (68.1%), while the most female-oriented occupations are Healthcare Support (100.0%), Food Preparation & Serving (99.3%), and Personal Care & Service (94.9%).
| Occupation | Male | Female |
| Healthcare Support | 0 (0.0%) | 122 (100.0%) |
| Security & Protection | 48 (75.0%) | 16 (25.0%) |
| Firefighting & Prevention | 16 (94.1%) | 1 (5.9%) |
| Law Enforcement | 32 (68.1%) | 15 (31.9%) |
| Food Preparation & Serving | 1 (0.7%) | 146 (99.3%) |
| Cleaning & Maintenance | 40 (44.4%) | 50 (55.6%) |
| Personal Care & Service | 2 (5.1%) | 37 (94.9%) |
| Total (Category) | 91 (19.7%) | 371 (80.3%) |
| Total (Overall) | 1,659 (53.8%) | 1,425 (46.2%) |
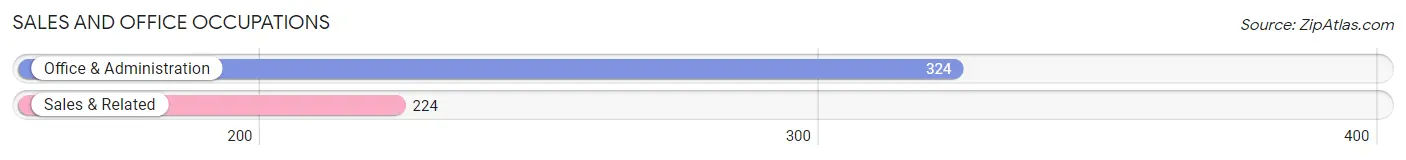
Sales and Office Occupations
The most common Sales and Office occupations in Blaine County are Office & Administration (324 | 10.5%), and Sales & Related (224 | 7.3%).
Sales and Office Occupations by Sex
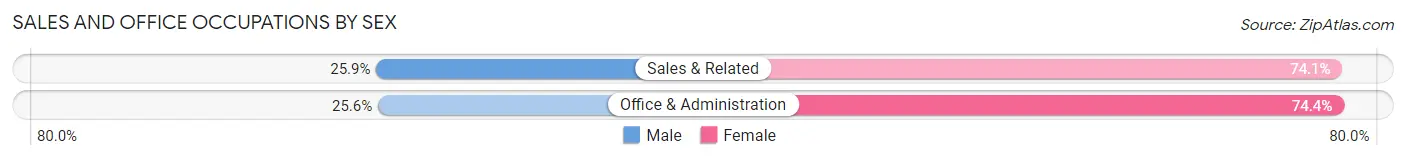
| Occupation | Male | Female |
| Sales & Related | 58 (25.9%) | 166 (74.1%) |
| Office & Administration | 83 (25.6%) | 241 (74.4%) |
| Total (Category) | 141 (25.7%) | 407 (74.3%) |
| Total (Overall) | 1,659 (53.8%) | 1,425 (46.2%) |
Natural Resources, Construction and Maintenance Occupations
The most common Natural Resources, Construction and Maintenance occupations in Blaine County are Construction & Extraction (200 | 6.5%), Installation, Maintenance & Repair (196 | 6.4%), and Farming, Fishing & Forestry (110 | 3.6%).

Natural Resources, Construction and Maintenance Occupations by Sex
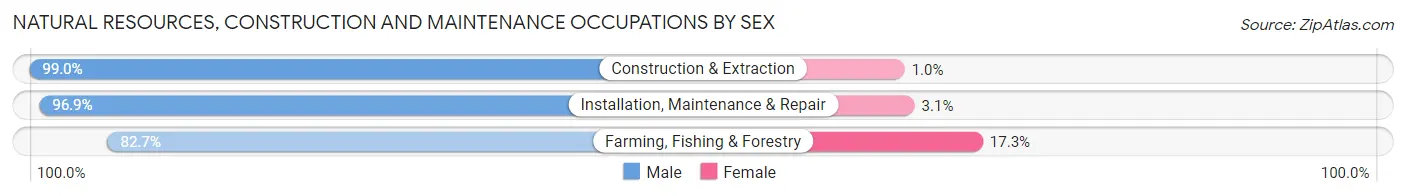
| Occupation | Male | Female |
| Farming, Fishing & Forestry | 91 (82.7%) | 19 (17.3%) |
| Construction & Extraction | 198 (99.0%) | 2 (1.0%) |
| Installation, Maintenance & Repair | 190 (96.9%) | 6 (3.1%) |
| Total (Category) | 479 (94.7%) | 27 (5.3%) |
| Total (Overall) | 1,659 (53.8%) | 1,425 (46.2%) |
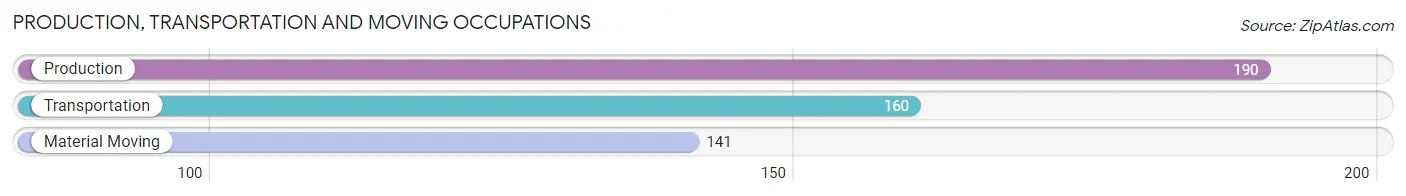
Production, Transportation and Moving Occupations
The most common Production, Transportation and Moving occupations in Blaine County are Production (190 | 6.2%), Transportation (160 | 5.2%), and Material Moving (141 | 4.6%).
Production, Transportation and Moving Occupations by Sex
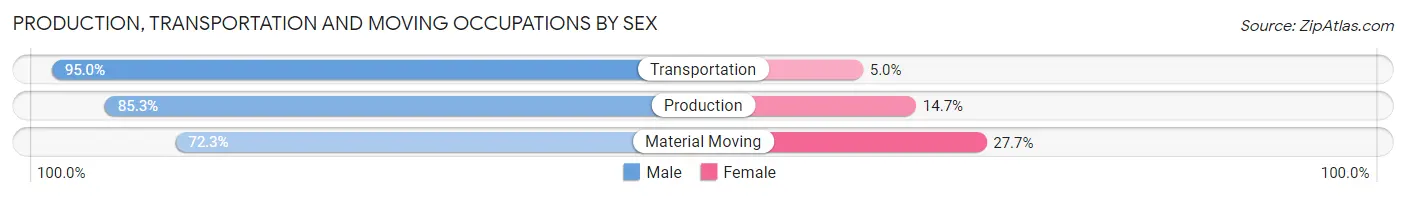
| Occupation | Male | Female |
| Production | 162 (85.3%) | 28 (14.7%) |
| Transportation | 152 (95.0%) | 8 (5.0%) |
| Material Moving | 102 (72.3%) | 39 (27.7%) |
| Total (Category) | 416 (84.7%) | 75 (15.3%) |
| Total (Overall) | 1,659 (53.8%) | 1,425 (46.2%) |
Employment Industries by Sex in Blaine County
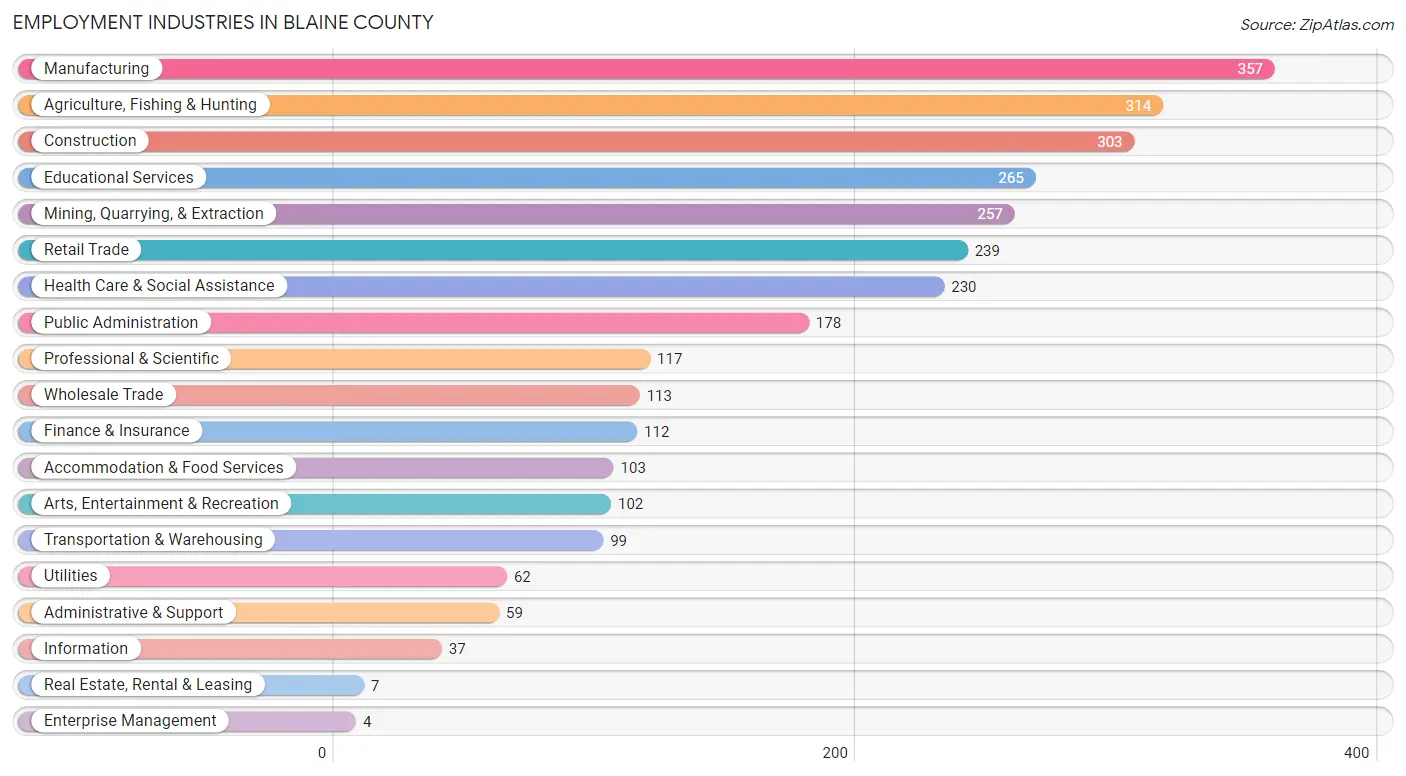
Employment Industries in Blaine County
The major employment industries in Blaine County include Manufacturing (357 | 11.6%), Agriculture, Fishing & Hunting (314 | 10.2%), Construction (303 | 9.8%), Educational Services (265 | 8.6%), and Mining, Quarrying, & Extraction (257 | 8.3%).
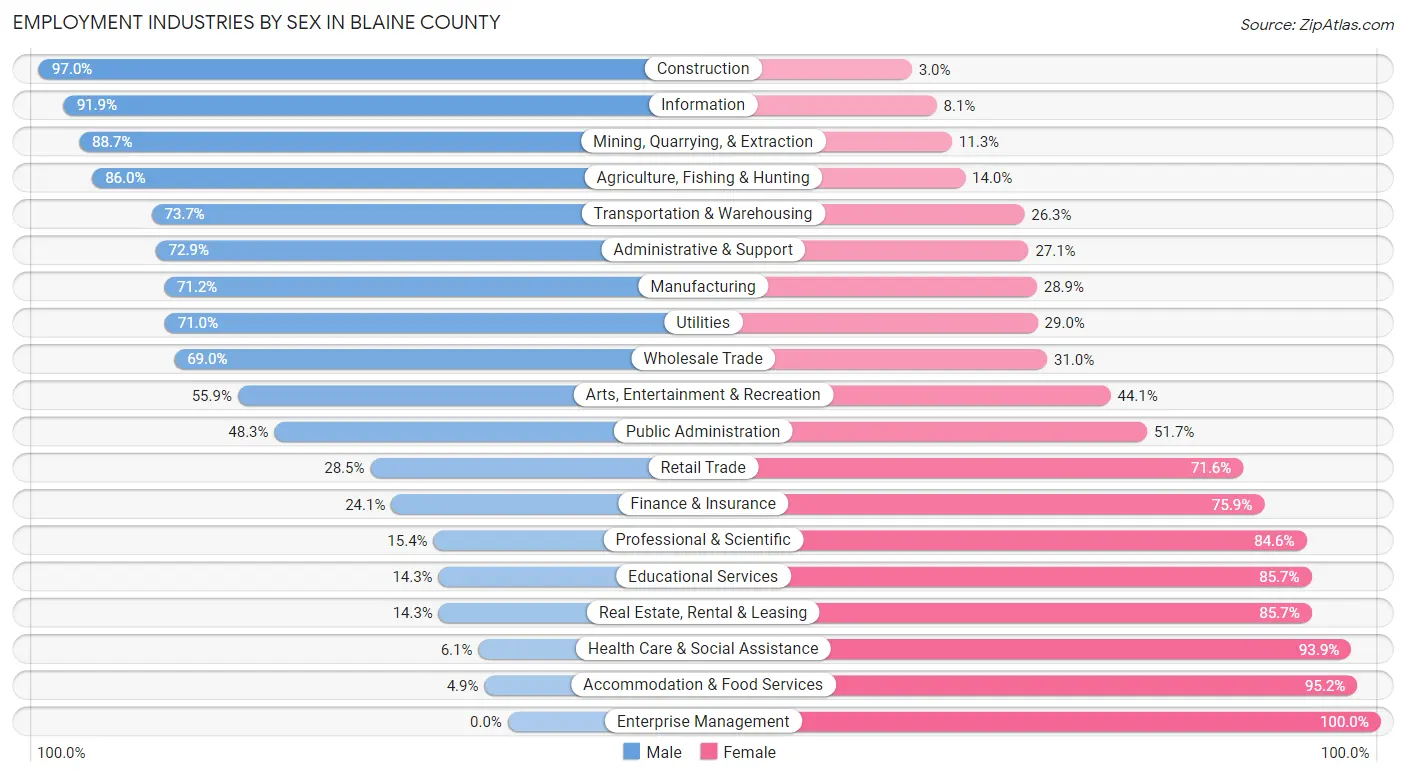
Employment Industries by Sex in Blaine County
The Blaine County industries that see more men than women are Construction (97.0%), Information (91.9%), and Mining, Quarrying, & Extraction (88.7%), whereas the industries that tend to have a higher number of women are Enterprise Management (100.0%), Accommodation & Food Services (95.2%), and Health Care & Social Assistance (93.9%).
| Industry | Male | Female |
| Agriculture, Fishing & Hunting | 270 (86.0%) | 44 (14.0%) |
| Mining, Quarrying, & Extraction | 228 (88.7%) | 29 (11.3%) |
| Construction | 294 (97.0%) | 9 (3.0%) |
| Manufacturing | 254 (71.2%) | 103 (28.8%) |
| Wholesale Trade | 78 (69.0%) | 35 (31.0%) |
| Retail Trade | 68 (28.4%) | 171 (71.6%) |
| Transportation & Warehousing | 73 (73.7%) | 26 (26.3%) |
| Utilities | 44 (71.0%) | 18 (29.0%) |
| Information | 34 (91.9%) | 3 (8.1%) |
| Finance & Insurance | 27 (24.1%) | 85 (75.9%) |
| Real Estate, Rental & Leasing | 1 (14.3%) | 6 (85.7%) |
| Professional & Scientific | 18 (15.4%) | 99 (84.6%) |
| Enterprise Management | 0 (0.0%) | 4 (100.0%) |
| Administrative & Support | 43 (72.9%) | 16 (27.1%) |
| Educational Services | 38 (14.3%) | 227 (85.7%) |
| Health Care & Social Assistance | 14 (6.1%) | 216 (93.9%) |
| Arts, Entertainment & Recreation | 57 (55.9%) | 45 (44.1%) |
| Accommodation & Food Services | 5 (4.9%) | 98 (95.2%) |
| Public Administration | 86 (48.3%) | 92 (51.7%) |
| Total | 1,659 (53.8%) | 1,425 (46.2%) |
Education in Blaine County
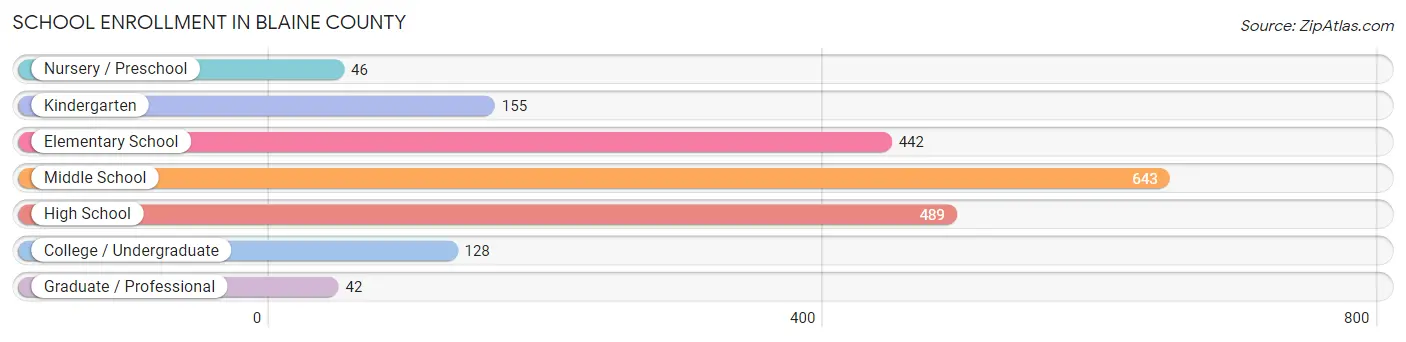
School Enrollment in Blaine County
The most common levels of schooling among the 1,945 students in Blaine County are middle school (643 | 33.1%), high school (489 | 25.1%), and elementary school (442 | 22.7%).
| School Level | # Students | % Students |
| Nursery / Preschool | 46 | 2.4% |
| Kindergarten | 155 | 8.0% |
| Elementary School | 442 | 22.7% |
| Middle School | 643 | 33.1% |
| High School | 489 | 25.1% |
| College / Undergraduate | 128 | 6.6% |
| Graduate / Professional | 42 | 2.2% |
| Total | 1,945 | 100.0% |
School Enrollment by Age by Funding Source in Blaine County
Out of a total of 1,945 students who are enrolled in schools in Blaine County, 132 (6.8%) attend a private institution, while the remaining 1,813 (93.2%) are enrolled in public schools. The age group of 20 to 24 year olds has the highest likelihood of being enrolled in private schools, with 6 (20.0% in the age bracket) enrolled. Conversely, the age group of 35 years and over has the lowest likelihood of being enrolled in a private school, with 64 (100.0% in the age bracket) attending a public institution.
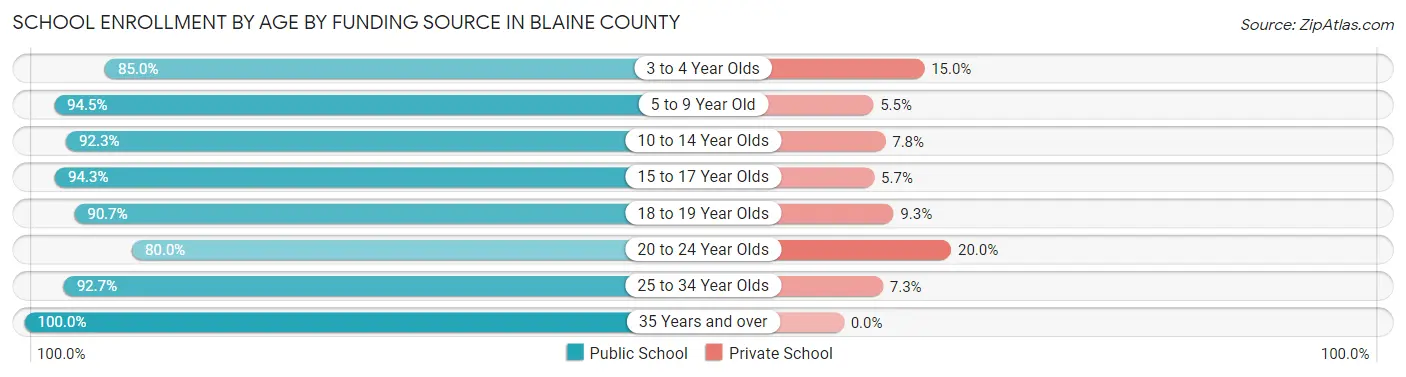
| Age Bracket | Public School | Private School |
| 3 to 4 Year Olds | 34 (85.0%) | 6 (15.0%) |
| 5 to 9 Year Old | 498 (94.5%) | 29 (5.5%) |
| 10 to 14 Year Olds | 667 (92.2%) | 56 (7.7%) |
| 15 to 17 Year Olds | 349 (94.3%) | 21 (5.7%) |
| 18 to 19 Year Olds | 49 (90.7%) | 5 (9.3%) |
| 20 to 24 Year Olds | 24 (80.0%) | 6 (20.0%) |
| 25 to 34 Year Olds | 127 (92.7%) | 10 (7.3%) |
| 35 Years and over | 64 (100.0%) | 0 (0.0%) |
| Total | 1,813 (93.2%) | 132 (6.8%) |
Educational Attainment by Field of Study in Blaine County
Education (355 | 31.3%), business (220 | 19.4%), science & technology (148 | 13.1%), bio, nature & agricultural (82 | 7.2%), and arts & humanities (73 | 6.4%) are the most common fields of study among 1,133 individuals in Blaine County who have obtained a bachelor's degree or higher.
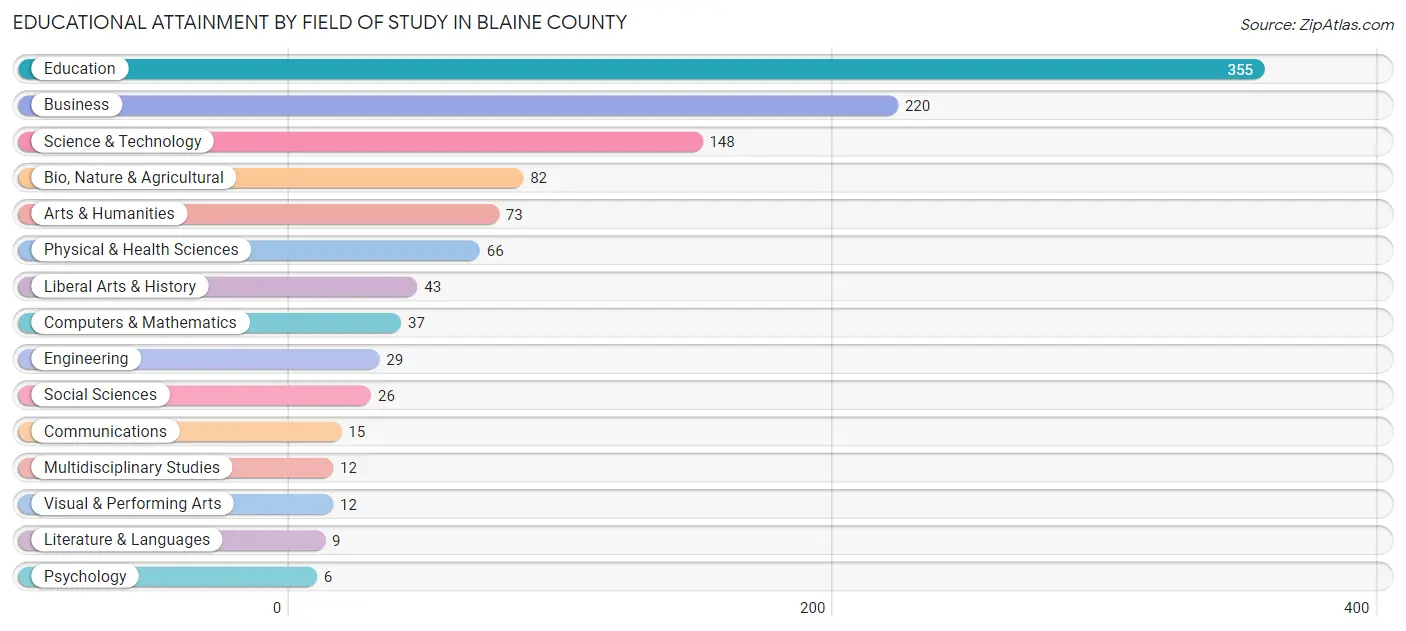
| Field of Study | # Graduates | % Graduates |
| Computers & Mathematics | 37 | 3.3% |
| Bio, Nature & Agricultural | 82 | 7.2% |
| Physical & Health Sciences | 66 | 5.8% |
| Psychology | 6 | 0.5% |
| Social Sciences | 26 | 2.3% |
| Engineering | 29 | 2.6% |
| Multidisciplinary Studies | 12 | 1.1% |
| Science & Technology | 148 | 13.1% |
| Business | 220 | 19.4% |
| Education | 355 | 31.3% |
| Literature & Languages | 9 | 0.8% |
| Liberal Arts & History | 43 | 3.8% |
| Visual & Performing Arts | 12 | 1.1% |
| Communications | 15 | 1.3% |
| Arts & Humanities | 73 | 6.4% |
| Total | 1,133 | 100.0% |
Transportation & Commute in Blaine County
Vehicle Availability by Sex in Blaine County
The most prevalent vehicle ownership categories in Blaine County are males with 2 vehicles (729, accounting for 44.9%) and females with 2 vehicles (507, making up 52.1%).
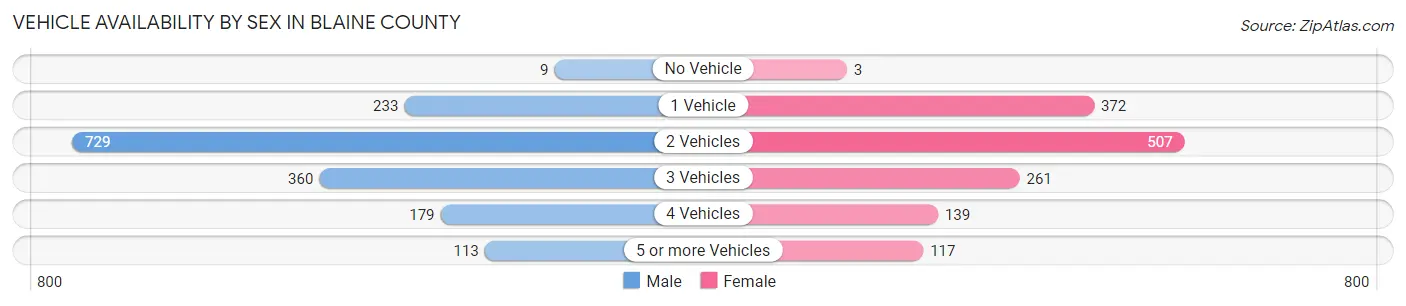
| Vehicles Available | Male | Female |
| No Vehicle | 9 (0.5%) | 3 (0.2%) |
| 1 Vehicle | 233 (14.4%) | 372 (26.6%) |
| 2 Vehicles | 729 (44.9%) | 507 (36.2%) |
| 3 Vehicles | 360 (22.2%) | 261 (18.7%) |
| 4 Vehicles | 179 (11.0%) | 139 (9.9%) |
| 5 or more Vehicles | 113 (7.0%) | 117 (8.4%) |
| Total | 1,623 (100.0%) | 1,399 (100.0%) |
Commute Time in Blaine County
The most frequently occuring commute durations in Blaine County are less than 5 minutes (551 commuters, 18.8%), 5 to 9 minutes (490 commuters, 16.7%), and 15 to 19 minutes (424 commuters, 14.4%).
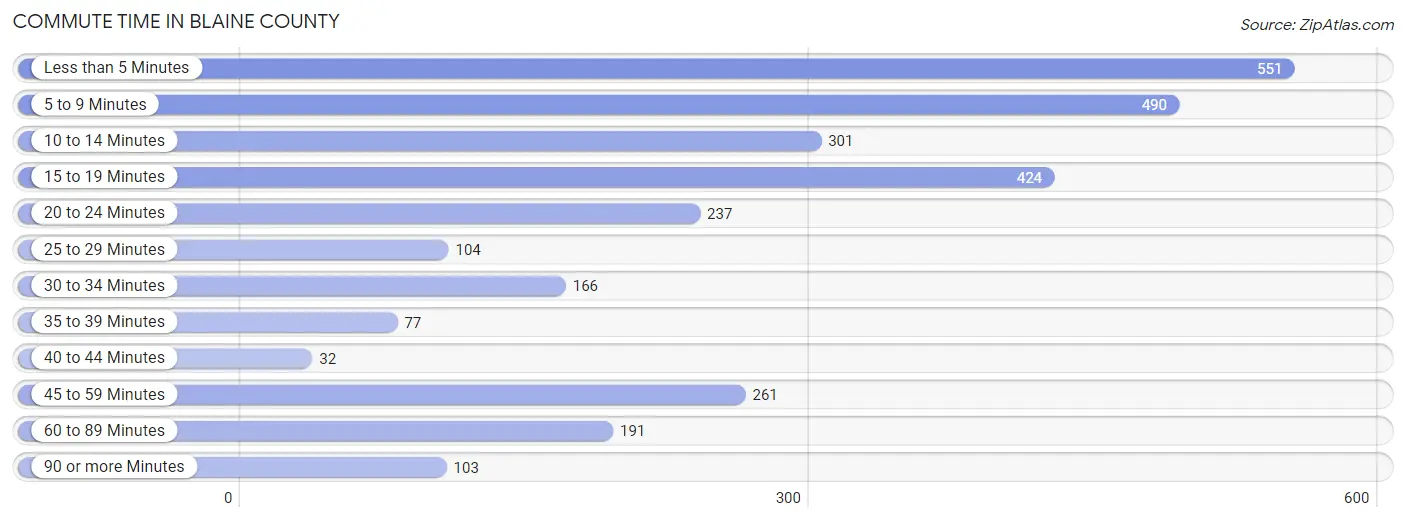
| Commute Time | # Commuters | % Commuters |
| Less than 5 Minutes | 551 | 18.8% |
| 5 to 9 Minutes | 490 | 16.7% |
| 10 to 14 Minutes | 301 | 10.2% |
| 15 to 19 Minutes | 424 | 14.4% |
| 20 to 24 Minutes | 237 | 8.1% |
| 25 to 29 Minutes | 104 | 3.5% |
| 30 to 34 Minutes | 166 | 5.7% |
| 35 to 39 Minutes | 77 | 2.6% |
| 40 to 44 Minutes | 32 | 1.1% |
| 45 to 59 Minutes | 261 | 8.9% |
| 60 to 89 Minutes | 191 | 6.5% |
| 90 or more Minutes | 103 | 3.5% |
Commute Time by Sex in Blaine County
The most common commute times in Blaine County are 15 to 19 minutes (265 commuters, 16.9%) for males and less than 5 minutes (332 commuters, 24.3%) for females.
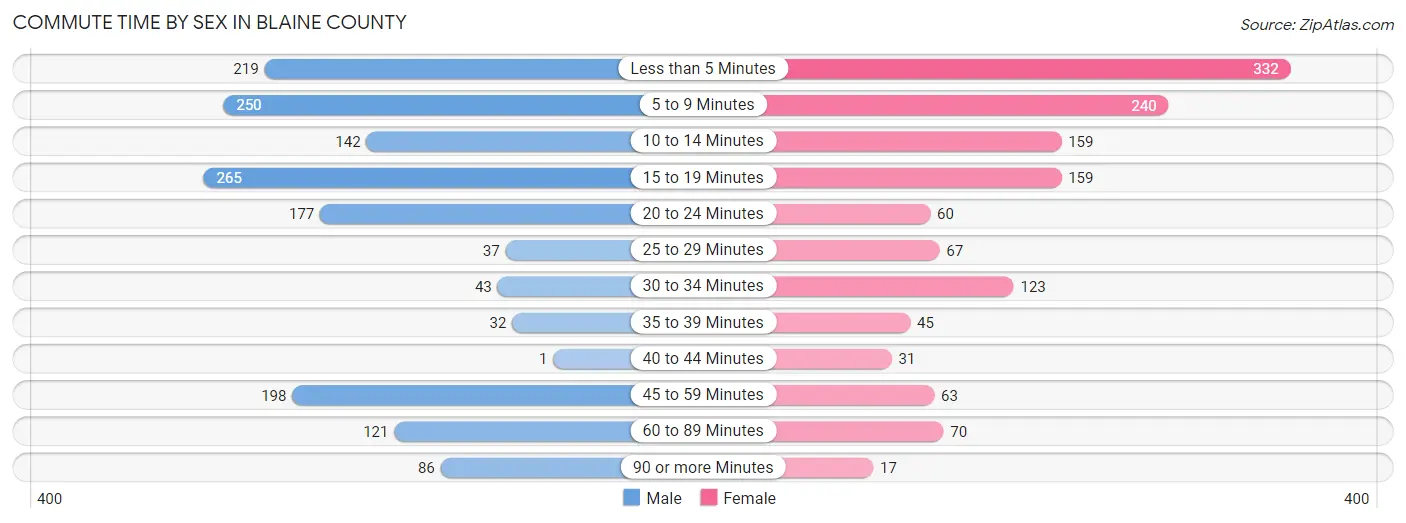
| Commute Time | Male | Female |
| Less than 5 Minutes | 219 (13.9%) | 332 (24.3%) |
| 5 to 9 Minutes | 250 (15.9%) | 240 (17.6%) |
| 10 to 14 Minutes | 142 (9.0%) | 159 (11.6%) |
| 15 to 19 Minutes | 265 (16.9%) | 159 (11.6%) |
| 20 to 24 Minutes | 177 (11.3%) | 60 (4.4%) |
| 25 to 29 Minutes | 37 (2.4%) | 67 (4.9%) |
| 30 to 34 Minutes | 43 (2.7%) | 123 (9.0%) |
| 35 to 39 Minutes | 32 (2.0%) | 45 (3.3%) |
| 40 to 44 Minutes | 1 (0.1%) | 31 (2.3%) |
| 45 to 59 Minutes | 198 (12.6%) | 63 (4.6%) |
| 60 to 89 Minutes | 121 (7.7%) | 70 (5.1%) |
| 90 or more Minutes | 86 (5.5%) | 17 (1.2%) |
Time of Departure to Work by Sex in Blaine County
The most frequent times of departure to work in Blaine County are 7:00 AM to 7:29 AM (289, 18.4%) for males and 7:30 AM to 7:59 AM (323, 23.6%) for females.
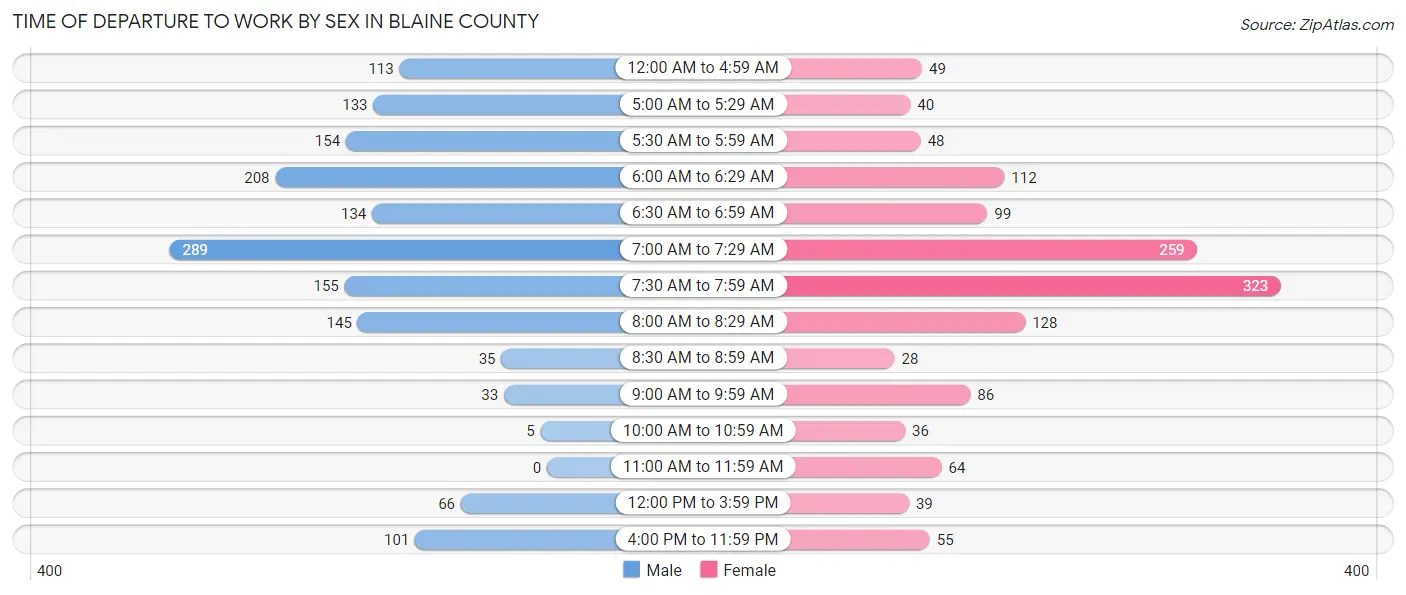
| Time of Departure | Male | Female |
| 12:00 AM to 4:59 AM | 113 (7.2%) | 49 (3.6%) |
| 5:00 AM to 5:29 AM | 133 (8.5%) | 40 (2.9%) |
| 5:30 AM to 5:59 AM | 154 (9.8%) | 48 (3.5%) |
| 6:00 AM to 6:29 AM | 208 (13.2%) | 112 (8.2%) |
| 6:30 AM to 6:59 AM | 134 (8.5%) | 99 (7.2%) |
| 7:00 AM to 7:29 AM | 289 (18.4%) | 259 (19.0%) |
| 7:30 AM to 7:59 AM | 155 (9.9%) | 323 (23.6%) |
| 8:00 AM to 8:29 AM | 145 (9.2%) | 128 (9.4%) |
| 8:30 AM to 8:59 AM | 35 (2.2%) | 28 (2.1%) |
| 9:00 AM to 9:59 AM | 33 (2.1%) | 86 (6.3%) |
| 10:00 AM to 10:59 AM | 5 (0.3%) | 36 (2.6%) |
| 11:00 AM to 11:59 AM | 0 (0.0%) | 64 (4.7%) |
| 12:00 PM to 3:59 PM | 66 (4.2%) | 39 (2.9%) |
| 4:00 PM to 11:59 PM | 101 (6.4%) | 55 (4.0%) |
| Total | 1,571 (100.0%) | 1,366 (100.0%) |
Housing Occupancy in Blaine County
Occupancy by Ownership in Blaine County
Of the total 3,431 dwellings in Blaine County, owner-occupied units account for 2,412 (70.3%), while renter-occupied units make up 1,019 (29.7%).
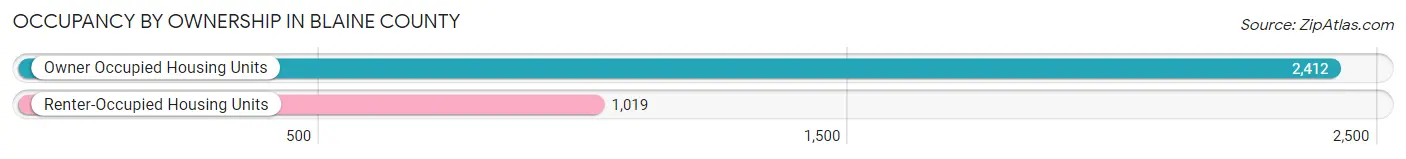
| Occupancy | # Housing Units | % Housing Units |
| Owner Occupied Housing Units | 2,412 | 70.3% |
| Renter-Occupied Housing Units | 1,019 | 29.7% |
| Total Occupied Housing Units | 3,431 | 100.0% |
Occupancy by Household Size in Blaine County
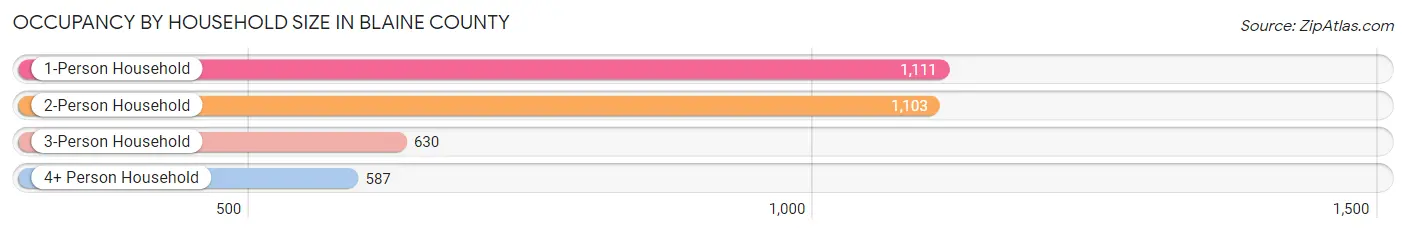
| Household Size | # Housing Units | % Housing Units |
| 1-Person Household | 1,111 | 32.4% |
| 2-Person Household | 1,103 | 32.2% |
| 3-Person Household | 630 | 18.4% |
| 4+ Person Household | 587 | 17.1% |
| Total Housing Units | 3,431 | 100.0% |
Occupancy by Ownership by Household Size in Blaine County
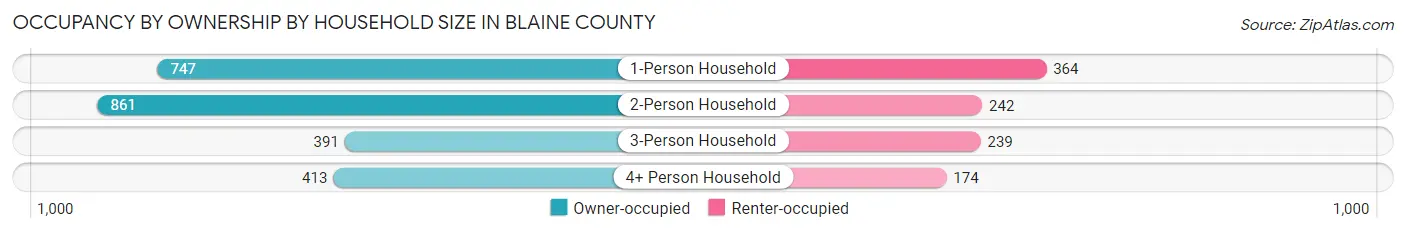
| Household Size | Owner-occupied | Renter-occupied |
| 1-Person Household | 747 (67.2%) | 364 (32.8%) |
| 2-Person Household | 861 (78.1%) | 242 (21.9%) |
| 3-Person Household | 391 (62.1%) | 239 (37.9%) |
| 4+ Person Household | 413 (70.4%) | 174 (29.6%) |
| Total Housing Units | 2,412 (70.3%) | 1,019 (29.7%) |
Occupancy by Educational Attainment in Blaine County
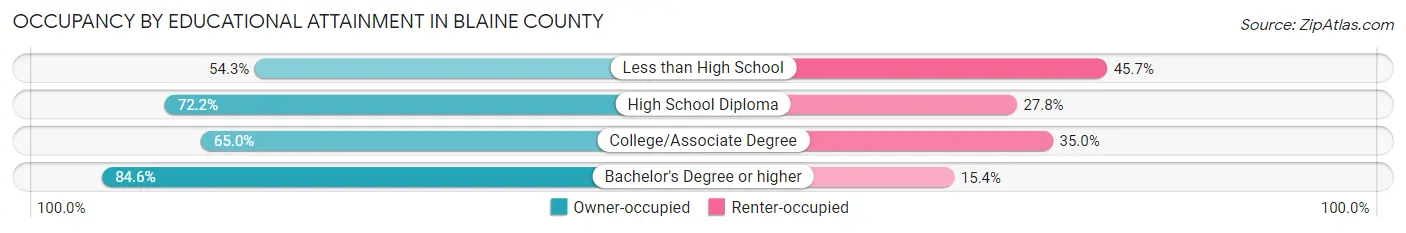
| Household Size | Owner-occupied | Renter-occupied |
| Less than High School | 209 (54.3%) | 176 (45.7%) |
| High School Diploma | 867 (72.2%) | 334 (27.8%) |
| College/Associate Degree | 748 (65.0%) | 402 (35.0%) |
| Bachelor's Degree or higher | 588 (84.6%) | 107 (15.4%) |
Occupancy by Age of Householder in Blaine County
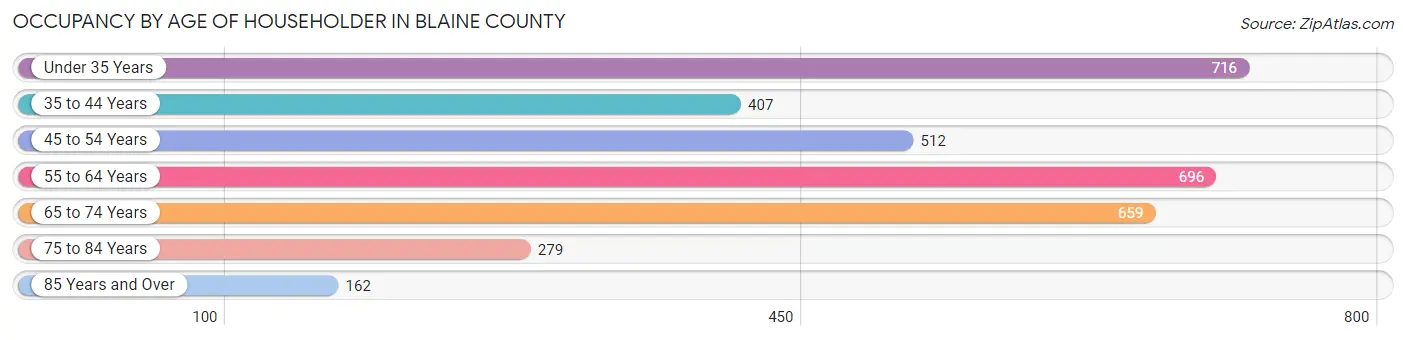
| Age Bracket | # Households | % Households |
| Under 35 Years | 716 | 20.9% |
| 35 to 44 Years | 407 | 11.9% |
| 45 to 54 Years | 512 | 14.9% |
| 55 to 64 Years | 696 | 20.3% |
| 65 to 74 Years | 659 | 19.2% |
| 75 to 84 Years | 279 | 8.1% |
| 85 Years and Over | 162 | 4.7% |
| Total | 3,431 | 100.0% |
Housing Finances in Blaine County
Median Income by Occupancy in Blaine County
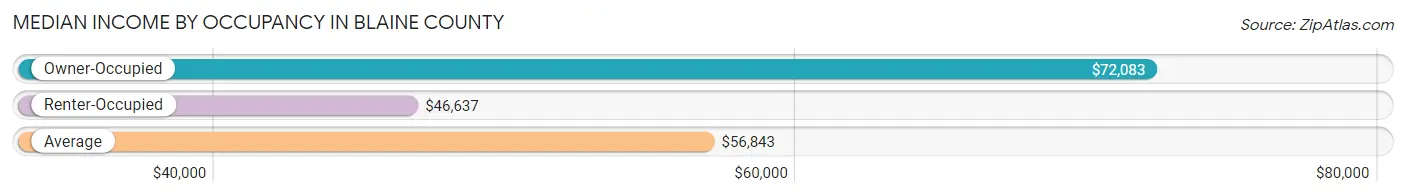
| Occupancy Type | # Households | Median Income |
| Owner-Occupied | 2,412 (70.3%) | $72,083 |
| Renter-Occupied | 1,019 (29.7%) | $46,637 |
| Average | 3,431 (100.0%) | $56,843 |
Occupancy by Householder Income Bracket in Blaine County
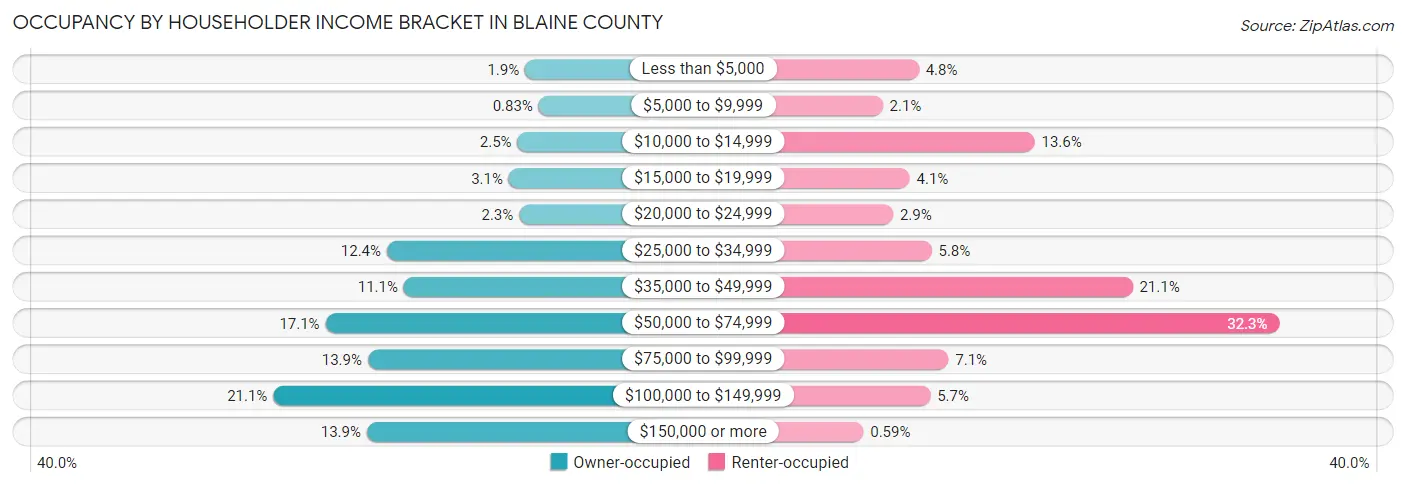
| Income Bracket | Owner-occupied | Renter-occupied |
| Less than $5,000 | 45 (1.9%) | 49 (4.8%) |
| $5,000 to $9,999 | 20 (0.8%) | 21 (2.1%) |
| $10,000 to $14,999 | 59 (2.5%) | 139 (13.6%) |
| $15,000 to $19,999 | 75 (3.1%) | 42 (4.1%) |
| $20,000 to $24,999 | 56 (2.3%) | 29 (2.9%) |
| $25,000 to $34,999 | 299 (12.4%) | 59 (5.8%) |
| $35,000 to $49,999 | 268 (11.1%) | 215 (21.1%) |
| $50,000 to $74,999 | 412 (17.1%) | 329 (32.3%) |
| $75,000 to $99,999 | 334 (13.9%) | 72 (7.1%) |
| $100,000 to $149,999 | 508 (21.1%) | 58 (5.7%) |
| $150,000 or more | 336 (13.9%) | 6 (0.6%) |
| Total | 2,412 (100.0%) | 1,019 (100.0%) |
Monthly Housing Cost Tiers in Blaine County
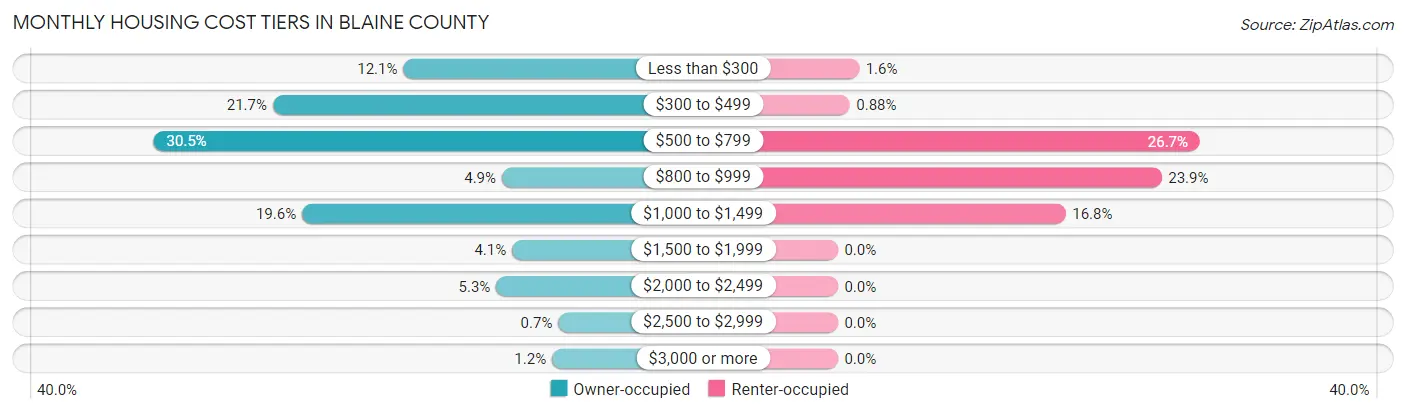
| Monthly Cost | Owner-occupied | Renter-occupied |
| Less than $300 | 292 (12.1%) | 16 (1.6%) |
| $300 to $499 | 524 (21.7%) | 9 (0.9%) |
| $500 to $799 | 736 (30.5%) | 272 (26.7%) |
| $800 to $999 | 117 (4.9%) | 243 (23.8%) |
| $1,000 to $1,499 | 472 (19.6%) | 171 (16.8%) |
| $1,500 to $1,999 | 99 (4.1%) | 0 (0.0%) |
| $2,000 to $2,499 | 127 (5.3%) | 0 (0.0%) |
| $2,500 to $2,999 | 17 (0.7%) | 0 (0.0%) |
| $3,000 or more | 28 (1.2%) | 0 (0.0%) |
| Total | 2,412 (100.0%) | 1,019 (100.0%) |
Physical Housing Characteristics in Blaine County
Housing Structures in Blaine County
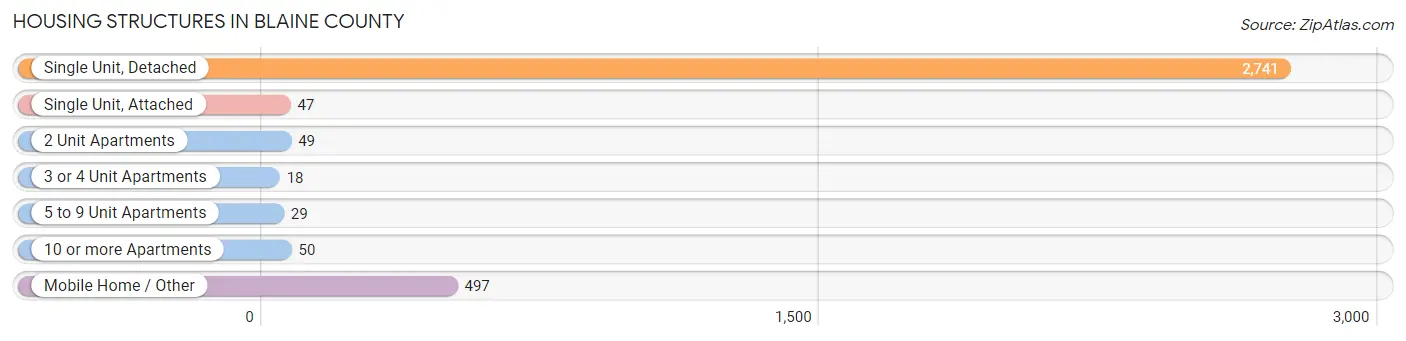
| Structure Type | # Housing Units | % Housing Units |
| Single Unit, Detached | 2,741 | 79.9% |
| Single Unit, Attached | 47 | 1.4% |
| 2 Unit Apartments | 49 | 1.4% |
| 3 or 4 Unit Apartments | 18 | 0.5% |
| 5 to 9 Unit Apartments | 29 | 0.9% |
| 10 or more Apartments | 50 | 1.5% |
| Mobile Home / Other | 497 | 14.5% |
| Total | 3,431 | 100.0% |
Housing Structures by Occupancy in Blaine County
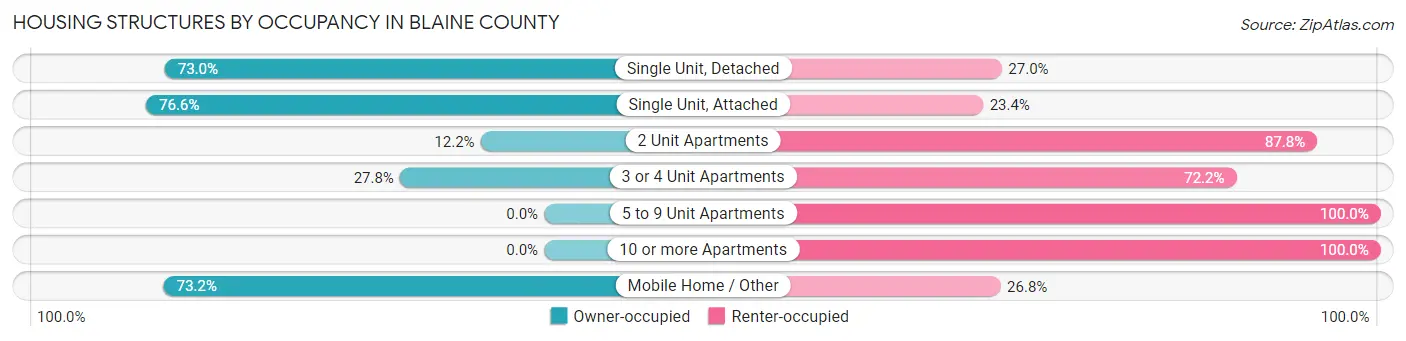
| Structure Type | Owner-occupied | Renter-occupied |
| Single Unit, Detached | 2,001 (73.0%) | 740 (27.0%) |
| Single Unit, Attached | 36 (76.6%) | 11 (23.4%) |
| 2 Unit Apartments | 6 (12.2%) | 43 (87.8%) |
| 3 or 4 Unit Apartments | 5 (27.8%) | 13 (72.2%) |
| 5 to 9 Unit Apartments | 0 (0.0%) | 29 (100.0%) |
| 10 or more Apartments | 0 (0.0%) | 50 (100.0%) |
| Mobile Home / Other | 364 (73.2%) | 133 (26.8%) |
| Total | 2,412 (70.3%) | 1,019 (29.7%) |
Housing Structures by Number of Rooms in Blaine County
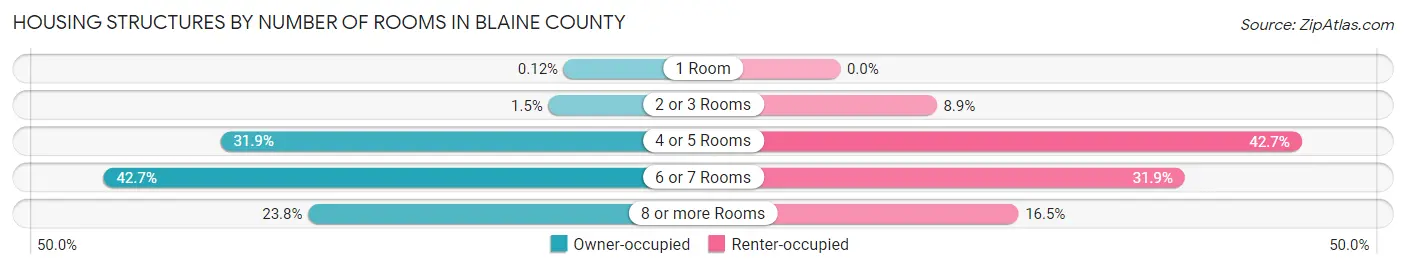
| Number of Rooms | Owner-occupied | Renter-occupied |
| 1 Room | 3 (0.1%) | 0 (0.0%) |
| 2 or 3 Rooms | 37 (1.5%) | 91 (8.9%) |
| 4 or 5 Rooms | 769 (31.9%) | 435 (42.7%) |
| 6 or 7 Rooms | 1,030 (42.7%) | 325 (31.9%) |
| 8 or more Rooms | 573 (23.8%) | 168 (16.5%) |
| Total | 2,412 (100.0%) | 1,019 (100.0%) |
Housing Structure by Heating Type in Blaine County
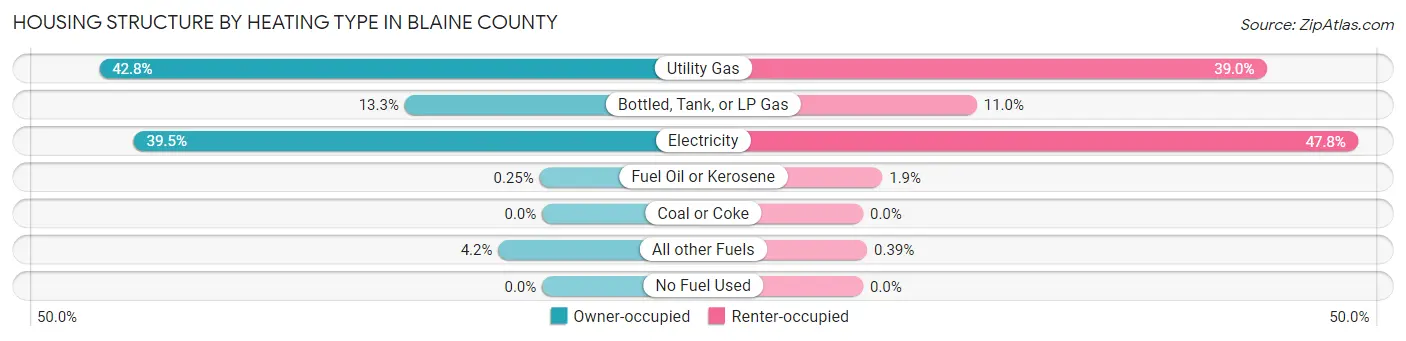
| Heating Type | Owner-occupied | Renter-occupied |
| Utility Gas | 1,032 (42.8%) | 397 (39.0%) |
| Bottled, Tank, or LP Gas | 320 (13.3%) | 112 (11.0%) |
| Electricity | 952 (39.5%) | 487 (47.8%) |
| Fuel Oil or Kerosene | 6 (0.3%) | 19 (1.9%) |
| Coal or Coke | 0 (0.0%) | 0 (0.0%) |
| All other Fuels | 102 (4.2%) | 4 (0.4%) |
| No Fuel Used | 0 (0.0%) | 0 (0.0%) |
| Total | 2,412 (100.0%) | 1,019 (100.0%) |
Household Vehicle Usage in Blaine County
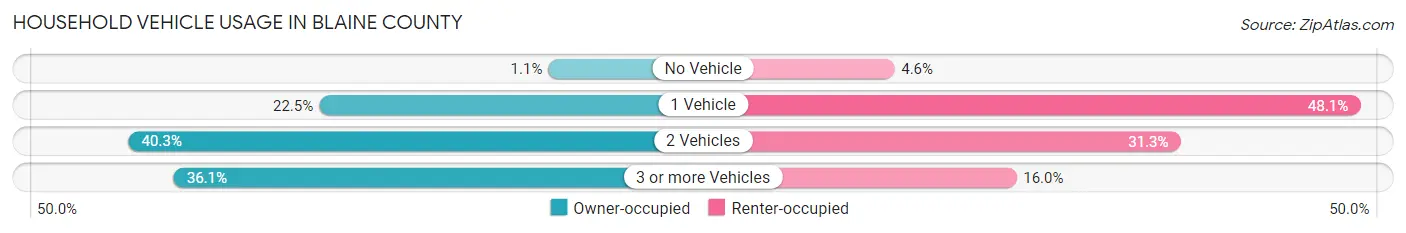
| Vehicles per Household | Owner-occupied | Renter-occupied |
| No Vehicle | 27 (1.1%) | 47 (4.6%) |
| 1 Vehicle | 543 (22.5%) | 490 (48.1%) |
| 2 Vehicles | 972 (40.3%) | 319 (31.3%) |
| 3 or more Vehicles | 870 (36.1%) | 163 (16.0%) |
| Total | 2,412 (100.0%) | 1,019 (100.0%) |
Real Estate & Mortgages in Blaine County
Real Estate and Mortgage Overview in Blaine County
| Characteristic | Without Mortgage | With Mortgage |
| Housing Units | 1,477 | 935 |
| Median Property Value | $113,500 | $148,000 |
| Median Household Income | $55,972 | $92 |
| Monthly Housing Costs | $473 | $28 |
| Real Estate Taxes | $583 | $74 |
Property Value by Mortgage Status in Blaine County
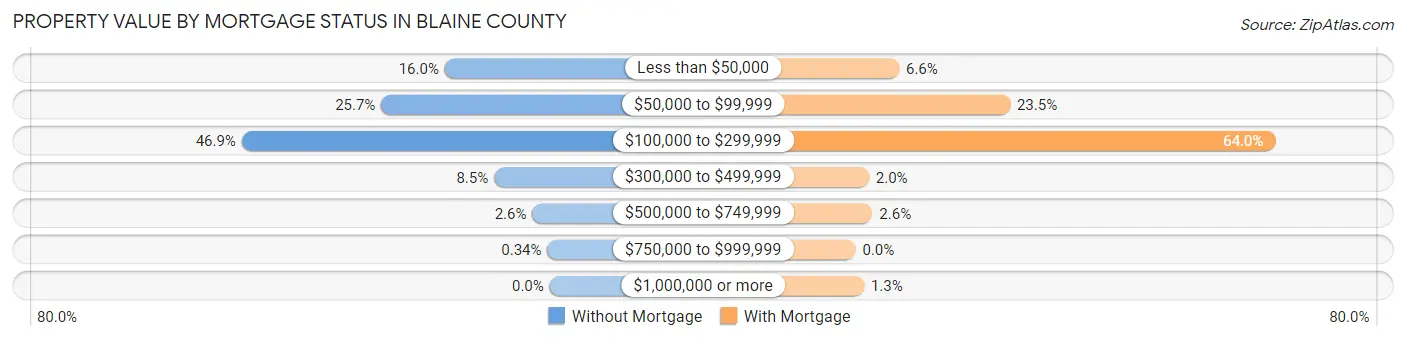
| Property Value | Without Mortgage | With Mortgage |
| Less than $50,000 | 236 (16.0%) | 62 (6.6%) |
| $50,000 to $99,999 | 379 (25.7%) | 220 (23.5%) |
| $100,000 to $299,999 | 693 (46.9%) | 598 (64.0%) |
| $300,000 to $499,999 | 125 (8.5%) | 19 (2.0%) |
| $500,000 to $749,999 | 39 (2.6%) | 24 (2.6%) |
| $750,000 to $999,999 | 5 (0.3%) | 0 (0.0%) |
| $1,000,000 or more | 0 (0.0%) | 12 (1.3%) |
| Total | 1,477 (100.0%) | 935 (100.0%) |
Household Income by Mortgage Status in Blaine County
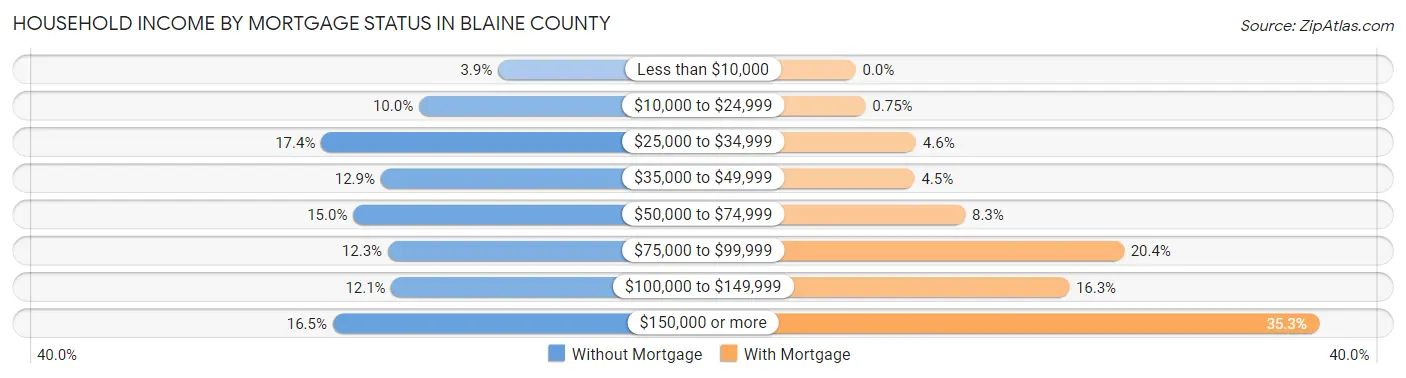
| Household Income | Without Mortgage | With Mortgage |
| Less than $10,000 | 58 (3.9%) | 0 (0.0%) |
| $10,000 to $24,999 | 147 (10.0%) | 7 (0.7%) |
| $25,000 to $34,999 | 257 (17.4%) | 43 (4.6%) |
| $35,000 to $49,999 | 190 (12.9%) | 42 (4.5%) |
| $50,000 to $74,999 | 221 (15.0%) | 78 (8.3%) |
| $75,000 to $99,999 | 182 (12.3%) | 191 (20.4%) |
| $100,000 to $149,999 | 178 (12.0%) | 152 (16.3%) |
| $150,000 or more | 244 (16.5%) | 330 (35.3%) |
| Total | 1,477 (100.0%) | 935 (100.0%) |
Property Value to Household Income Ratio in Blaine County
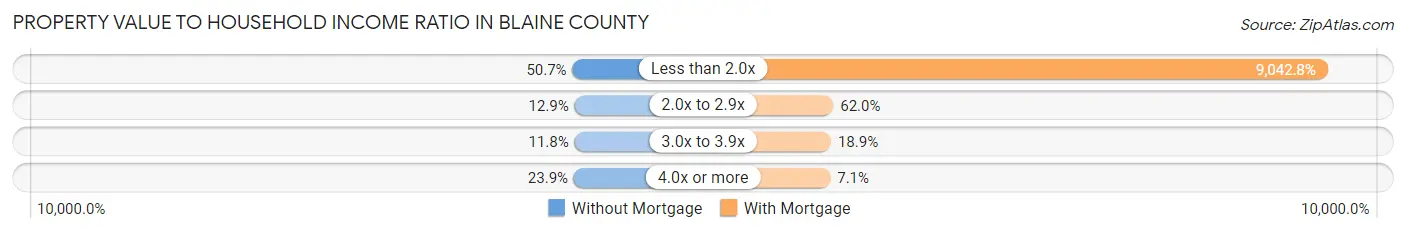
| Value-to-Income Ratio | Without Mortgage | With Mortgage |
| Less than 2.0x | 749 (50.7%) | 84,550 (9,042.8%) |
| 2.0x to 2.9x | 190 (12.9%) | 580 (62.0%) |
| 3.0x to 3.9x | 174 (11.8%) | 177 (18.9%) |
| 4.0x or more | 353 (23.9%) | 66 (7.1%) |
| Total | 1,477 (100.0%) | 935 (100.0%) |
Real Estate Taxes by Mortgage Status in Blaine County
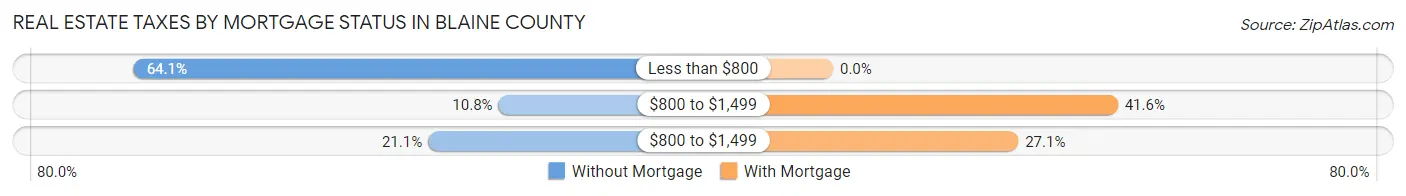
| Property Taxes | Without Mortgage | With Mortgage |
| Less than $800 | 946 (64.0%) | 0 (0.0%) |
| $800 to $1,499 | 159 (10.8%) | 389 (41.6%) |
| $800 to $1,499 | 311 (21.1%) | 253 (27.1%) |
| Total | 1,477 (100.0%) | 935 (100.0%) |
Health & Disability in Blaine County
Health Insurance Coverage by Age in Blaine County
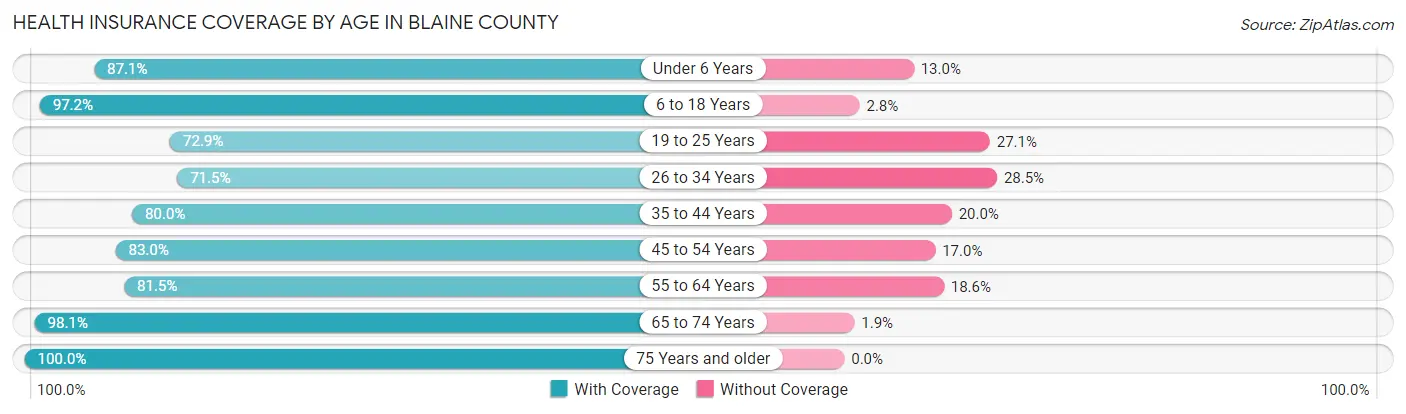
| Age Bracket | With Coverage | Without Coverage |
| Under 6 Years | 437 (87.1%) | 65 (13.0%) |
| 6 to 18 Years | 1,571 (97.2%) | 46 (2.8%) |
| 19 to 25 Years | 400 (72.9%) | 149 (27.1%) |
| 26 to 34 Years | 495 (71.5%) | 197 (28.5%) |
| 35 to 44 Years | 523 (80.0%) | 131 (20.0%) |
| 45 to 54 Years | 666 (83.0%) | 136 (17.0%) |
| 55 to 64 Years | 922 (81.5%) | 210 (18.5%) |
| 65 to 74 Years | 894 (98.1%) | 17 (1.9%) |
| 75 Years and older | 628 (100.0%) | 0 (0.0%) |
| Total | 6,536 (87.3%) | 951 (12.7%) |
Health Insurance Coverage by Citizenship Status in Blaine County
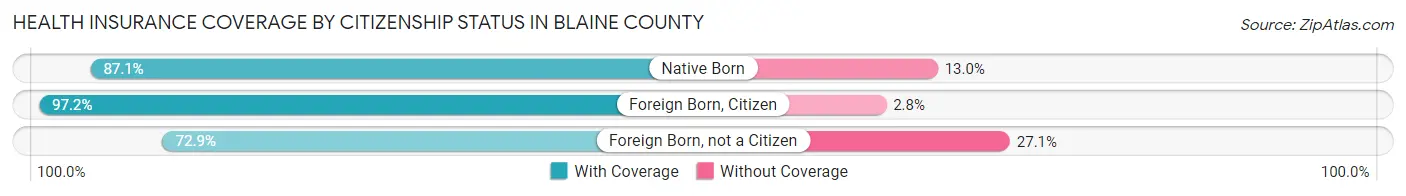
| Citizenship Status | With Coverage | Without Coverage |
| Native Born | 437 (87.1%) | 65 (13.0%) |
| Foreign Born, Citizen | 1,571 (97.2%) | 46 (2.8%) |
| Foreign Born, not a Citizen | 400 (72.9%) | 149 (27.1%) |
Health Insurance Coverage by Household Income in Blaine County
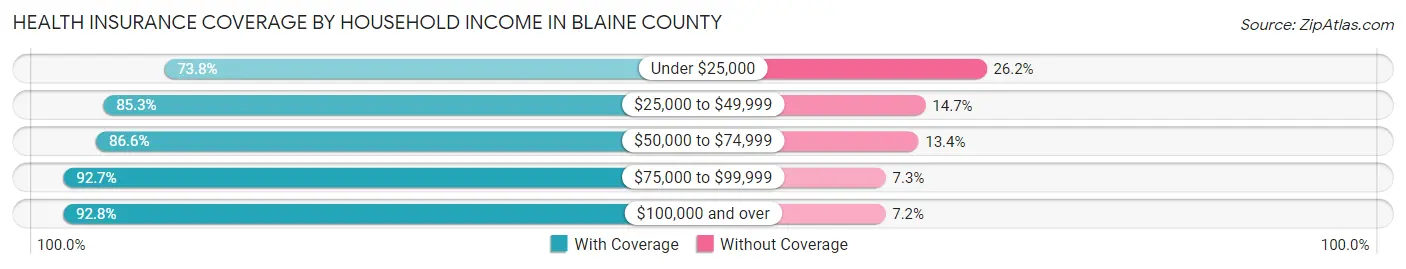
| Household Income | With Coverage | Without Coverage |
| Under $25,000 | 731 (73.8%) | 259 (26.2%) |
| $25,000 to $49,999 | 1,395 (85.3%) | 241 (14.7%) |
| $50,000 to $74,999 | 1,417 (86.6%) | 219 (13.4%) |
| $75,000 to $99,999 | 906 (92.7%) | 71 (7.3%) |
| $100,000 and over | 2,072 (92.8%) | 161 (7.2%) |
Public vs Private Health Insurance Coverage by Age in Blaine County
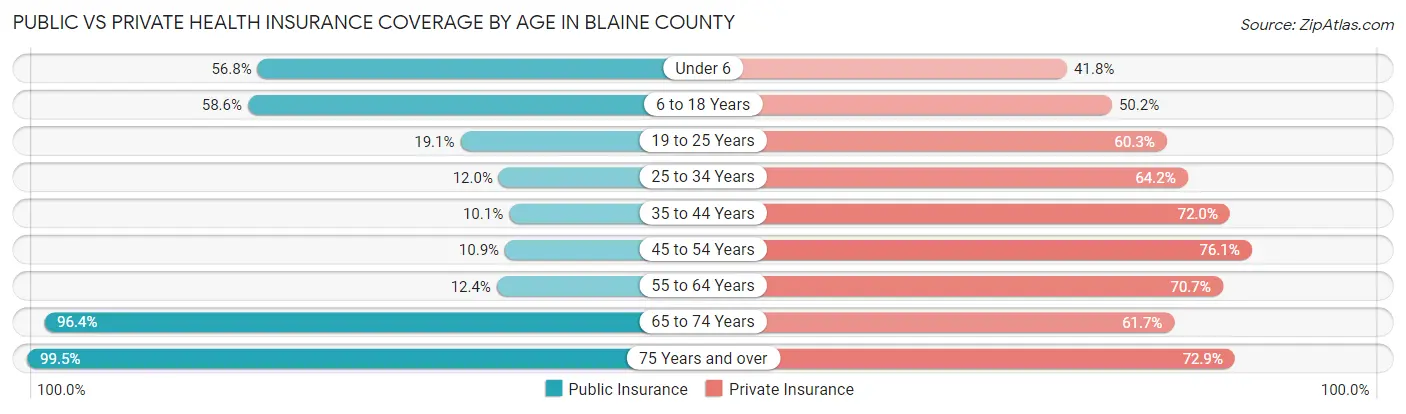
| Age Bracket | Public Insurance | Private Insurance |
| Under 6 | 285 (56.8%) | 210 (41.8%) |
| 6 to 18 Years | 947 (58.6%) | 811 (50.1%) |
| 19 to 25 Years | 105 (19.1%) | 331 (60.3%) |
| 25 to 34 Years | 83 (12.0%) | 444 (64.2%) |
| 35 to 44 Years | 66 (10.1%) | 471 (72.0%) |
| 45 to 54 Years | 87 (10.8%) | 610 (76.1%) |
| 55 to 64 Years | 140 (12.4%) | 800 (70.7%) |
| 65 to 74 Years | 878 (96.4%) | 562 (61.7%) |
| 75 Years and over | 625 (99.5%) | 458 (72.9%) |
| Total | 3,216 (42.9%) | 4,697 (62.7%) |
Disability Status by Sex by Age in Blaine County
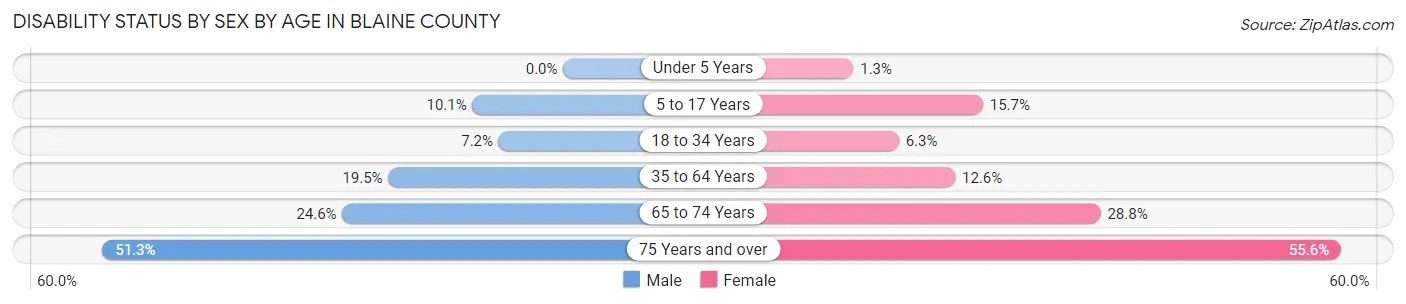
| Age Bracket | Male | Female |
| Under 5 Years | 0 (0.0%) | 3 (1.3%) |
| 5 to 17 Years | 93 (10.1%) | 114 (15.7%) |
| 18 to 34 Years | 44 (7.2%) | 43 (6.3%) |
| 35 to 64 Years | 226 (19.5%) | 180 (12.6%) |
| 65 to 74 Years | 108 (24.6%) | 136 (28.8%) |
| 75 Years and over | 134 (51.3%) | 204 (55.6%) |
Disability Class by Sex by Age in Blaine County
Disability Class: Hearing Difficulty
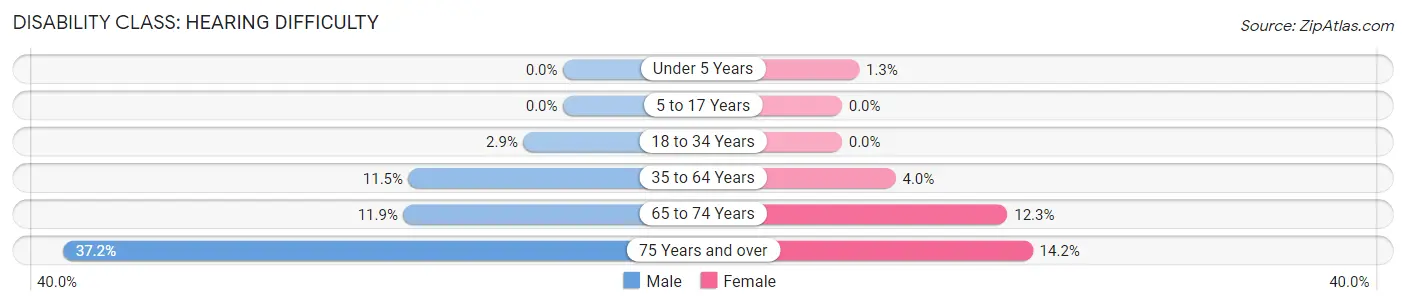
| Age Bracket | Male | Female |
| Under 5 Years | 0 (0.0%) | 3 (1.3%) |
| 5 to 17 Years | 0 (0.0%) | 0 (0.0%) |
| 18 to 34 Years | 18 (2.9%) | 0 (0.0%) |
| 35 to 64 Years | 133 (11.5%) | 57 (4.0%) |
| 65 to 74 Years | 52 (11.8%) | 58 (12.3%) |
| 75 Years and over | 97 (37.2%) | 52 (14.2%) |
Disability Class: Vision Difficulty
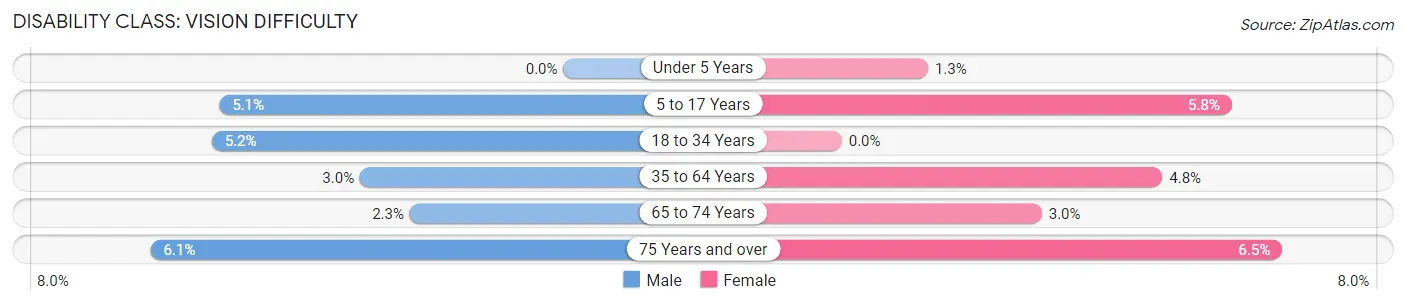
| Age Bracket | Male | Female |
| Under 5 Years | 0 (0.0%) | 3 (1.3%) |
| 5 to 17 Years | 47 (5.1%) | 42 (5.8%) |
| 18 to 34 Years | 32 (5.2%) | 0 (0.0%) |
| 35 to 64 Years | 35 (3.0%) | 68 (4.8%) |
| 65 to 74 Years | 10 (2.3%) | 14 (3.0%) |
| 75 Years and over | 16 (6.1%) | 24 (6.5%) |
Disability Class: Cognitive Difficulty
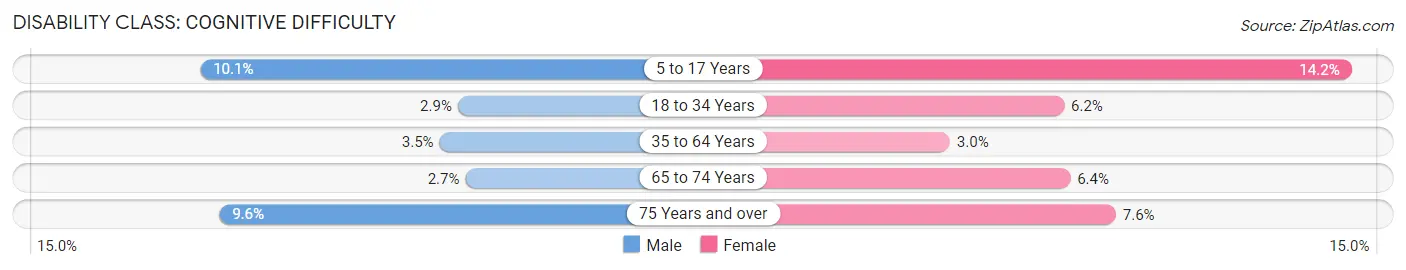
| Age Bracket | Male | Female |
| 5 to 17 Years | 93 (10.1%) | 103 (14.2%) |
| 18 to 34 Years | 18 (2.9%) | 42 (6.2%) |
| 35 to 64 Years | 40 (3.5%) | 43 (3.0%) |
| 65 to 74 Years | 12 (2.7%) | 30 (6.4%) |
| 75 Years and over | 25 (9.6%) | 28 (7.6%) |
Disability Class: Ambulatory Difficulty
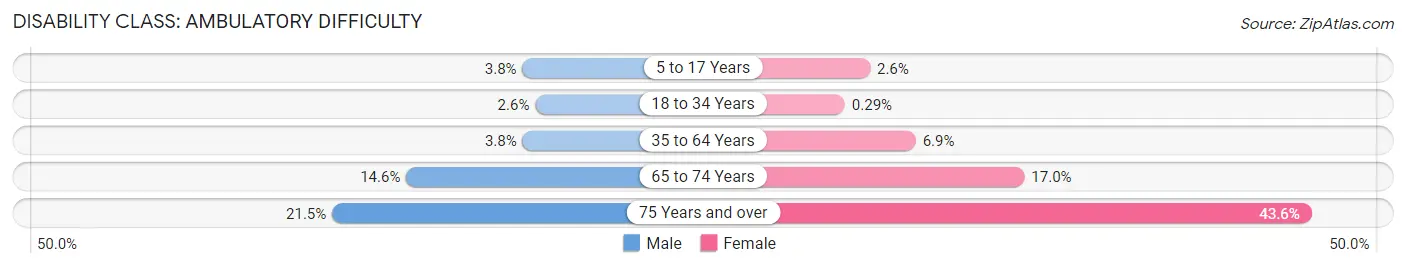
| Age Bracket | Male | Female |
| 5 to 17 Years | 35 (3.8%) | 19 (2.6%) |
| 18 to 34 Years | 16 (2.6%) | 2 (0.3%) |
| 35 to 64 Years | 44 (3.8%) | 98 (6.9%) |
| 65 to 74 Years | 64 (14.6%) | 80 (17.0%) |
| 75 Years and over | 56 (21.5%) | 160 (43.6%) |
Disability Class: Self-Care Difficulty
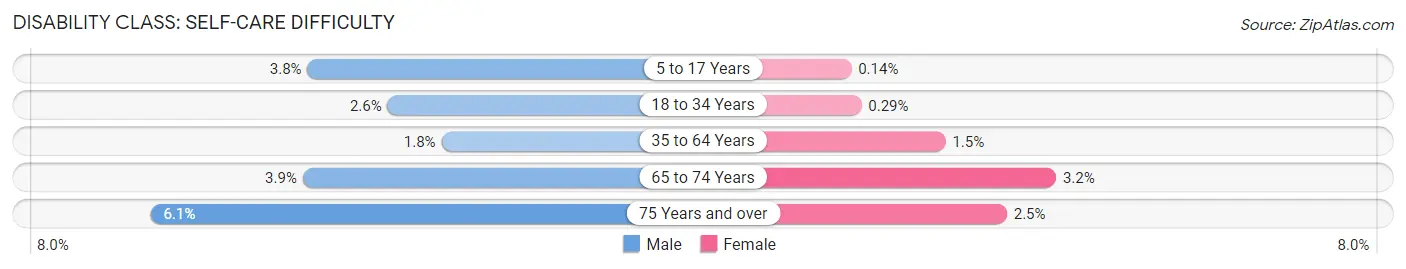
| Age Bracket | Male | Female |
| 5 to 17 Years | 35 (3.8%) | 1 (0.1%) |
| 18 to 34 Years | 16 (2.6%) | 2 (0.3%) |
| 35 to 64 Years | 21 (1.8%) | 22 (1.5%) |
| 65 to 74 Years | 17 (3.9%) | 15 (3.2%) |
| 75 Years and over | 16 (6.1%) | 9 (2.5%) |
Technology Access in Blaine County
Computing Device Access in Blaine County
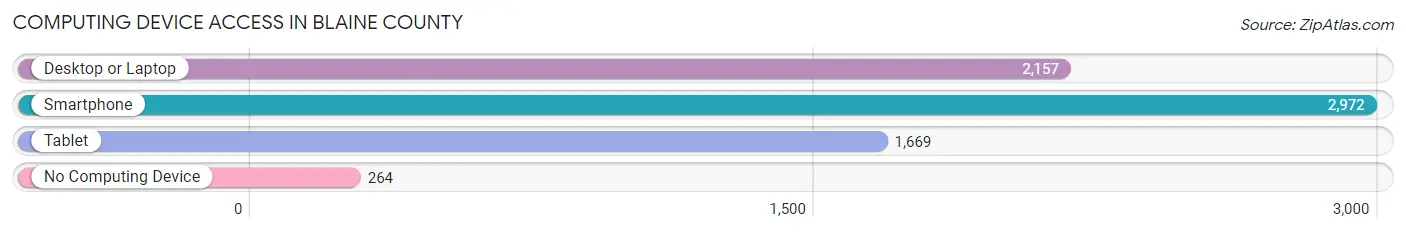
| Device Type | # Households | % Households |
| Desktop or Laptop | 2,157 | 62.9% |
| Smartphone | 2,972 | 86.6% |
| Tablet | 1,669 | 48.6% |
| No Computing Device | 264 | 7.7% |
| Total | 3,431 | 100.0% |
Internet Access in Blaine County
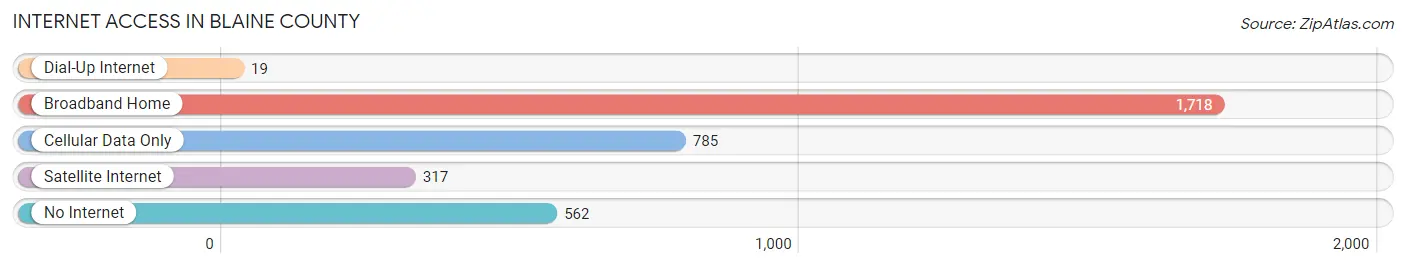
| Internet Type | # Households | % Households |
| Dial-Up Internet | 19 | 0.5% |
| Broadband Home | 1,718 | 50.1% |
| Cellular Data Only | 785 | 22.9% |
| Satellite Internet | 317 | 9.2% |
| No Internet | 562 | 16.4% |
| Total | 3,431 | 100.0% |
Blaine County Summary
Blaine County is located in the western part of Oklahoma, and is bordered by Kingfisher, Canadian, Major, Dewey, and Custer Counties. The county seat is Watonga, and the county was named for James G. Blaine, a former U.S. Secretary of State. The county covers an area of 1,072 square miles, and has a population of 11,845 as of the 2020 census.
History
Blaine County was established in 1907, and was originally part of the Cheyenne-Arapaho Reservation. The county was created from parts of Kingfisher, Canadian, and Major Counties. The county was named for James G. Blaine, a former U.S. Secretary of State. The county seat was originally located in Geary, but was moved to Watonga in 1910.
Geography
Blaine County is located in the western part of Oklahoma, and is bordered by Kingfisher, Canadian, Major, Dewey, and Custer Counties. The county covers an area of 1,072 square miles, and has a population of 11,845 as of the 2020 census. The county is mostly rural, with the majority of the population living in small towns and rural areas. The county is home to several lakes, including Canton Lake, Watonga Lake, and Okeene Lake.
Economy
The economy of Blaine County is largely based on agriculture and oil and gas production. The county is home to several large farms, and is a major producer of wheat, corn, and other grains. The county is also home to several oil and gas fields, and is a major producer of natural gas. Other industries in the county include manufacturing, retail, and tourism.
Demographics
As of the 2020 census, Blaine County had a population of 11,845. The population is mostly white (90.2%), with small percentages of Native American (3.2%), African American (2.2%), and Hispanic (2.2%) populations. The median household income in the county is $45,845, and the median age is 40.7 years. The county has a poverty rate of 13.2%, and the unemployment rate is 3.7%.
Conclusion
Blaine County is a rural county located in the western part of Oklahoma. The county has a population of 11,845, and is mostly white. The economy of the county is largely based on agriculture and oil and gas production, and the county is home to several large farms and oil and gas fields. The median household income in the county is $45,845, and the poverty rate is 13.2%. Blaine County is a rural county with a rich history and a strong economy.
Common Questions
What is Per Capita Income in Blaine County?
Per Capita income in Blaine County is $30,442.
What is the Median Family Income in Blaine County?
Median Family Income in Blaine County is $70,617.
What is the Median Household income in Blaine County?
Median Household Income in Blaine County is $56,843.
What is Income or Wage Gap in Blaine County?
Income or Wage Gap in Blaine County is 44.2%.
Women in Blaine County earn 55.8 cents for every dollar earned by a man.
What is Inequality or Gini Index in Blaine County?
Inequality or Gini Index in Blaine County is 0.44.
What is the Total Population of Blaine County?
Total Population of Blaine County is 8,661.
What is the Total Male Population of Blaine County?
Total Male Population of Blaine County is 4,674.
What is the Total Female Population of Blaine County?
Total Female Population of Blaine County is 3,987.
What is the Ratio of Males per 100 Females in Blaine County?
There are 117.23 Males per 100 Females in Blaine County.
What is the Ratio of Females per 100 Males in Blaine County?
There are 85.30 Females per 100 Males in Blaine County.
What is the Median Population Age in Blaine County?
Median Population Age in Blaine County is 41.3 Years.
What is the Average Family Size in Blaine County
Average Family Size in Blaine County is 2.7 People.
What is the Average Household Size in Blaine County
Average Household Size in Blaine County is 2.2 People.
How Large is the Labor Force in Blaine County?
There are 3,312 People in the Labor Forcein in Blaine County.
What is the Percentage of People in the Labor Force in Blaine County?
48.3% of People are in the Labor Force in Blaine County.
What is the Unemployment Rate in Blaine County?
Unemployment Rate in Blaine County is 6.8%.