Alfalfa County, OK Map & Demographics
Alfalfa County Map
Alfalfa County Overview
$28,976
PER CAPITA INCOME
$89,609
AVG FAMILY INCOME
$75,028
AVG HOUSEHOLD INCOME
30.9%
WAGE / INCOME GAP [ % ]
69.1¢/ $1
WAGE / INCOME GAP [ $ ]
0.39
INEQUALITY / GINI INDEX
5,683
TOTAL POPULATION
3,547
MALE POPULATION
2,136
FEMALE POPULATION
166.06
MALES / 100 FEMALES
60.22
FEMALES / 100 MALES
43.6
MEDIAN AGE
3.0
AVG FAMILY SIZE
2.5
AVG HOUSEHOLD SIZE
2,204
LABOR FORCE [ PEOPLE ]
47.5%
PERCENT IN LABOR FORCE
4.0%
UNEMPLOYMENT RATE
Alfalfa County Area Codes
Income in Alfalfa County
Income Overview in Alfalfa County
Per Capita Income in Alfalfa County is $28,976, while median incomes of families and households are $89,609 and $75,028 respectively.
| Characteristic | Number | Measure |
| Per Capita Income | 5,683 | $28,976 |
| Median Family Income | 1,275 | $89,609 |
| Mean Family Income | 1,275 | $95,919 |
| Median Household Income | 1,829 | $75,028 |
| Mean Household Income | 1,829 | $84,094 |
| Income Deficit | 1,275 | $0 |
| Wage / Income Gap (%) | 5,683 | 30.91% |
| Wage / Income Gap ($) | 5,683 | 69.09¢ per $1 |
| Gini / Inequality Index | 5,683 | 0.39 |
Earnings by Sex in Alfalfa County
Average Earnings in Alfalfa County are $34,662, $41,384 for men and $28,594 for women, a difference of 30.9%.
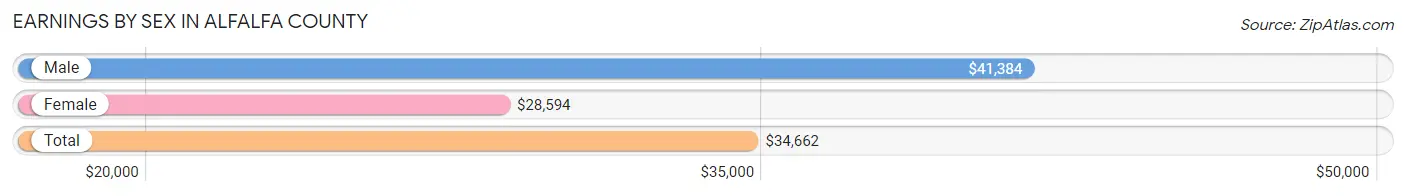
| Sex | Number | Average Earnings |
| Male | 1,784 (64.7%) | $41,384 |
| Female | 973 (35.3%) | $28,594 |
| Total | 2,757 (100.0%) | $34,662 |
Earnings by Sex by Income Bracket in Alfalfa County
The most common earnings brackets in Alfalfa County are $100,000+ for men (232 | 13.0%) and $40,000 to $44,999 for women (84 | 8.6%).
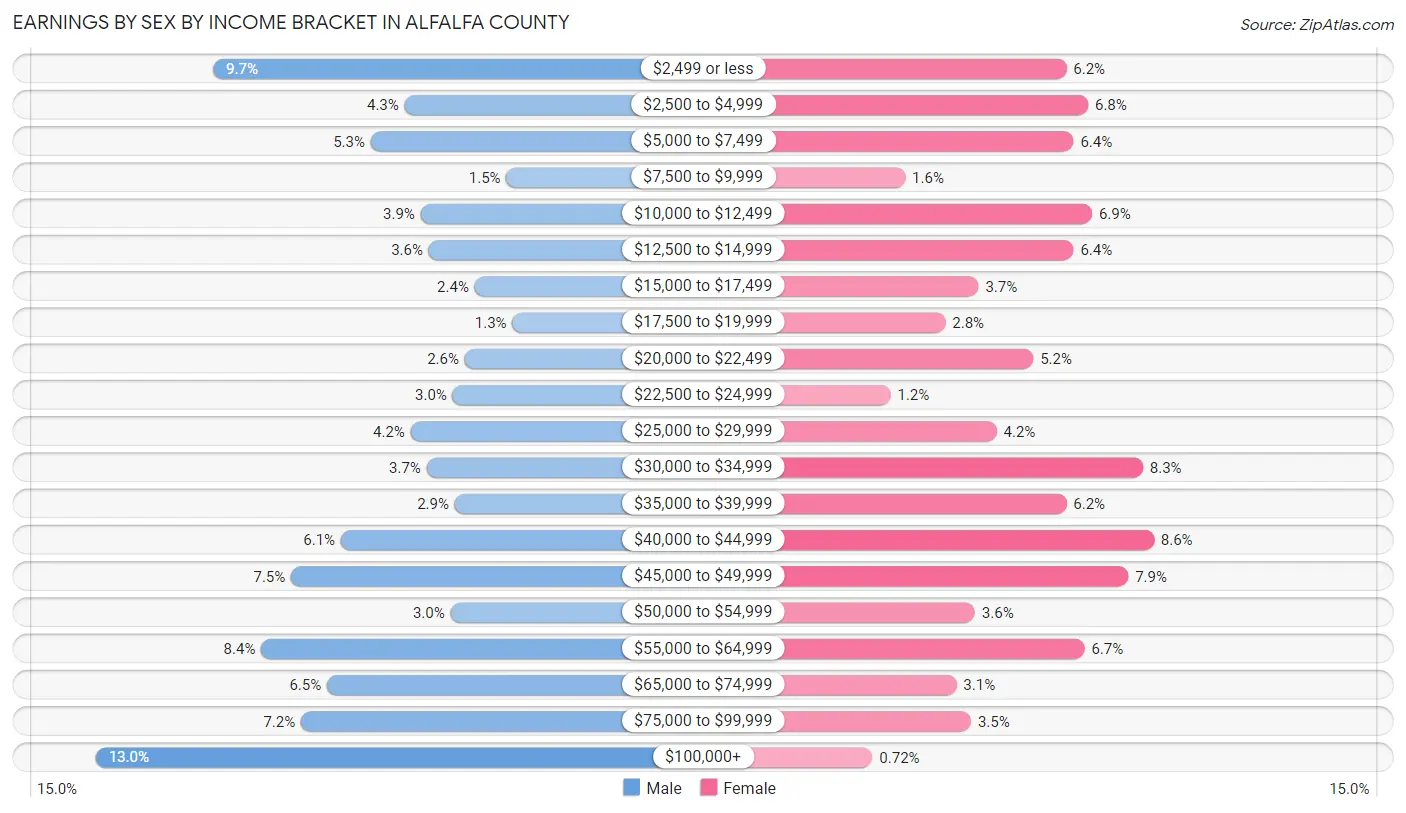
| Income | Male | Female |
| $2,499 or less | 173 (9.7%) | 60 (6.2%) |
| $2,500 to $4,999 | 77 (4.3%) | 66 (6.8%) |
| $5,000 to $7,499 | 94 (5.3%) | 62 (6.4%) |
| $7,500 to $9,999 | 26 (1.5%) | 16 (1.6%) |
| $10,000 to $12,499 | 69 (3.9%) | 67 (6.9%) |
| $12,500 to $14,999 | 65 (3.6%) | 62 (6.4%) |
| $15,000 to $17,499 | 42 (2.4%) | 36 (3.7%) |
| $17,500 to $19,999 | 23 (1.3%) | 27 (2.8%) |
| $20,000 to $22,499 | 47 (2.6%) | 51 (5.2%) |
| $22,500 to $24,999 | 53 (3.0%) | 12 (1.2%) |
| $25,000 to $29,999 | 74 (4.2%) | 41 (4.2%) |
| $30,000 to $34,999 | 66 (3.7%) | 81 (8.3%) |
| $35,000 to $39,999 | 52 (2.9%) | 60 (6.2%) |
| $40,000 to $44,999 | 109 (6.1%) | 84 (8.6%) |
| $45,000 to $49,999 | 134 (7.5%) | 77 (7.9%) |
| $50,000 to $54,999 | 54 (3.0%) | 35 (3.6%) |
| $55,000 to $64,999 | 149 (8.4%) | 65 (6.7%) |
| $65,000 to $74,999 | 116 (6.5%) | 30 (3.1%) |
| $75,000 to $99,999 | 129 (7.2%) | 34 (3.5%) |
| $100,000+ | 232 (13.0%) | 7 (0.7%) |
| Total | 1,784 (100.0%) | 973 (100.0%) |
Earnings by Sex by Educational Attainment in Alfalfa County
Average earnings in Alfalfa County are $43,939 for men and $32,969 for women, a difference of 25.0%. Men with an educational attainment of bachelor's degree enjoy the highest average annual earnings of $71,000, while those with high school diploma education earn the least with $33,226. Women with an educational attainment of graduate degree earn the most with the average annual earnings of $46,739, while those with less than high school education have the smallest earnings of $11,316.
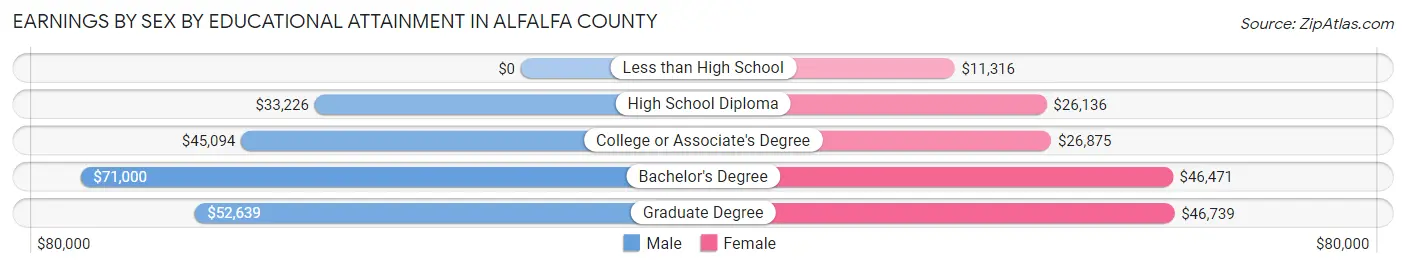
| Educational Attainment | Male Income | Female Income |
| Less than High School | - | - |
| High School Diploma | $33,226 | $26,136 |
| College or Associate's Degree | $45,094 | $26,875 |
| Bachelor's Degree | $71,000 | $46,471 |
| Graduate Degree | $52,639 | $46,739 |
| Total | $43,939 | $32,969 |
Family Income in Alfalfa County
Family Income Brackets in Alfalfa County
According to the Alfalfa County family income data, there are 354 families falling into the $100,000 to $149,999 income range, which is the most common income bracket and makes up 27.8% of all families. Conversely, the less than $10,000 income bracket is the least frequent group with only 20 families (1.6%) belonging to this category.
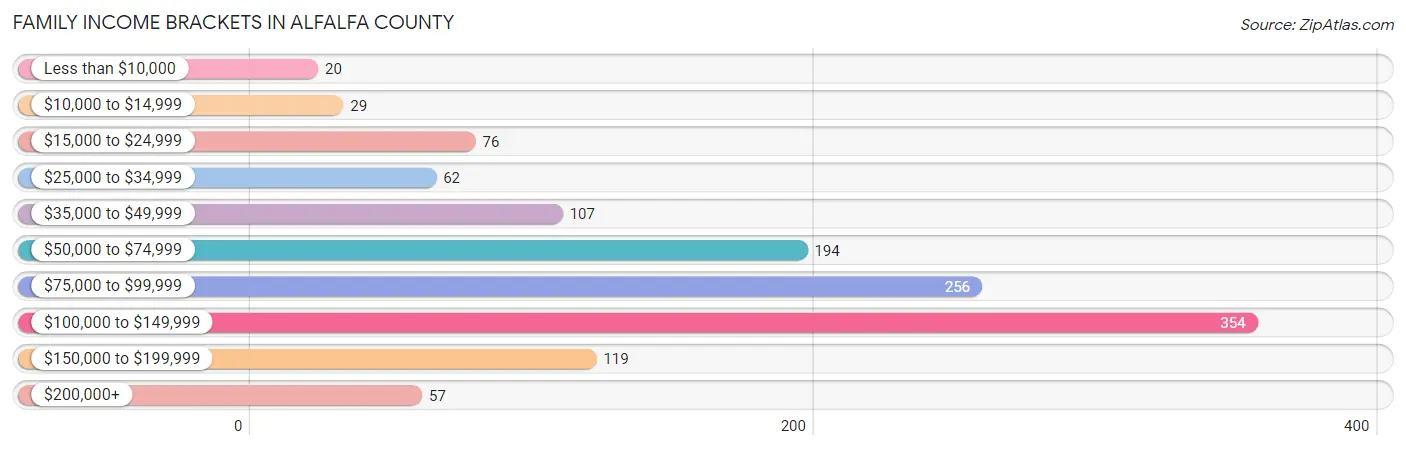
| Income Bracket | # Families | % Families |
| Less than $10,000 | 20 | 1.6% |
| $10,000 to $14,999 | 29 | 2.3% |
| $15,000 to $24,999 | 76 | 6.0% |
| $25,000 to $34,999 | 62 | 4.9% |
| $35,000 to $49,999 | 107 | 8.4% |
| $50,000 to $74,999 | 194 | 15.2% |
| $75,000 to $99,999 | 256 | 20.1% |
| $100,000 to $149,999 | 354 | 27.8% |
| $150,000 to $199,999 | 119 | 9.3% |
| $200,000+ | 57 | 4.5% |
Family Income by Famaliy Size in Alfalfa County
5-person families (127 | 10.0%) account for the highest median family income in Alfalfa County with $124,250 per family, while 2-person families (612 | 48.0%) have the highest median income of $36,146 per family member.
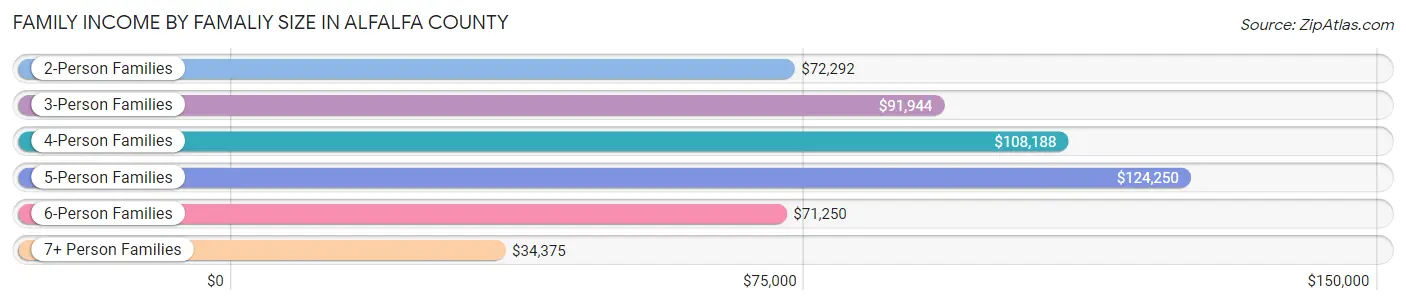
| Income Bracket | # Families | Median Income |
| 2-Person Families | 612 (48.0%) | $72,292 |
| 3-Person Families | 232 (18.2%) | $91,944 |
| 4-Person Families | 225 (17.6%) | $108,188 |
| 5-Person Families | 127 (10.0%) | $124,250 |
| 6-Person Families | 52 (4.1%) | $71,250 |
| 7+ Person Families | 27 (2.1%) | $34,375 |
| Total | 1,275 (100.0%) | $89,609 |
Family Income by Number of Earners in Alfalfa County
The median family income in Alfalfa County is $89,609, with families comprising 2 earners (599) having the highest median family income of $108,380, while families with no earners (148) have the lowest median family income of $37,500, accounting for 47.0% and 11.6% of families, respectively.
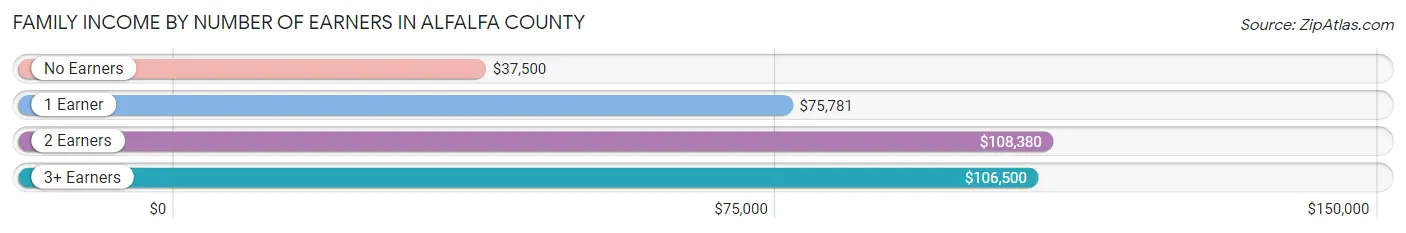
| Number of Earners | # Families | Median Income |
| No Earners | 148 (11.6%) | $37,500 |
| 1 Earner | 436 (34.2%) | $75,781 |
| 2 Earners | 599 (47.0%) | $108,380 |
| 3+ Earners | 92 (7.2%) | $106,500 |
| Total | 1,275 (100.0%) | $89,609 |
Household Income in Alfalfa County
Household Income Brackets in Alfalfa County
With 391 households falling in the category, the $100,000 to $149,999 income range is the most frequent in Alfalfa County, accounting for 21.4% of all households. In contrast, only 59 households (3.2%) fall into the $200,000+ income bracket, making it the least populous group.
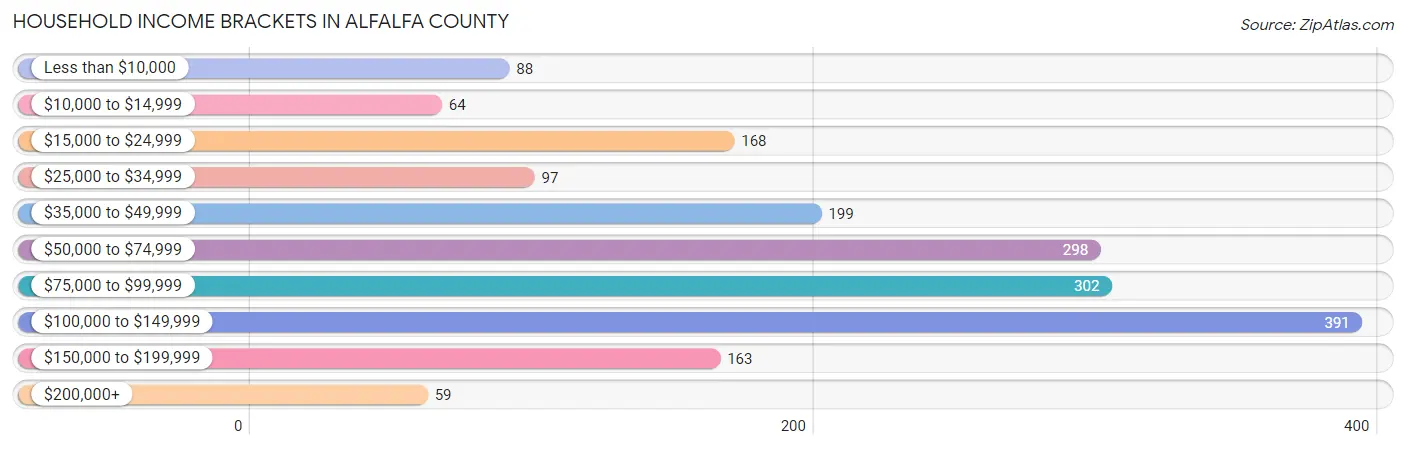
| Income Bracket | # Households | % Households |
| Less than $10,000 | 88 | 4.8% |
| $10,000 to $14,999 | 64 | 3.5% |
| $15,000 to $24,999 | 168 | 9.2% |
| $25,000 to $34,999 | 97 | 5.3% |
| $35,000 to $49,999 | 199 | 10.9% |
| $50,000 to $74,999 | 298 | 16.3% |
| $75,000 to $99,999 | 302 | 16.5% |
| $100,000 to $149,999 | 391 | 21.4% |
| $150,000 to $199,999 | 163 | 8.9% |
| $200,000+ | 59 | 3.2% |
Household Income by Householder Age in Alfalfa County
The median household income in Alfalfa County is $75,028, with the highest median household income of $85,625 found in the 25 to 44 years age bracket for the primary householder. A total of 564 households (30.8%) fall into this category. Meanwhile, the 65+ years age bracket for the primary householder has the lowest median household income of $54,333, with 588 households (32.2%) in this group.
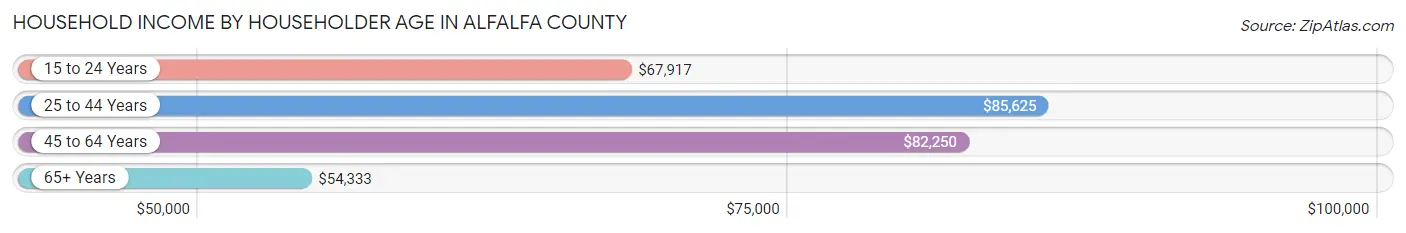
| Income Bracket | # Households | Median Income |
| 15 to 24 Years | 63 (3.4%) | $67,917 |
| 25 to 44 Years | 564 (30.8%) | $85,625 |
| 45 to 64 Years | 614 (33.6%) | $82,250 |
| 65+ Years | 588 (32.2%) | $54,333 |
| Total | 1,829 (100.0%) | $75,028 |
Poverty in Alfalfa County
Income Below Poverty by Sex and Age in Alfalfa County
With 10.4% poverty level for males and 13.3% for females among the residents of Alfalfa County, 12 to 14 year old males and 5 year old females are the most vulnerable to poverty, with 13 males (28.9%) and 12 females (63.2%) in their respective age groups living below the poverty level.
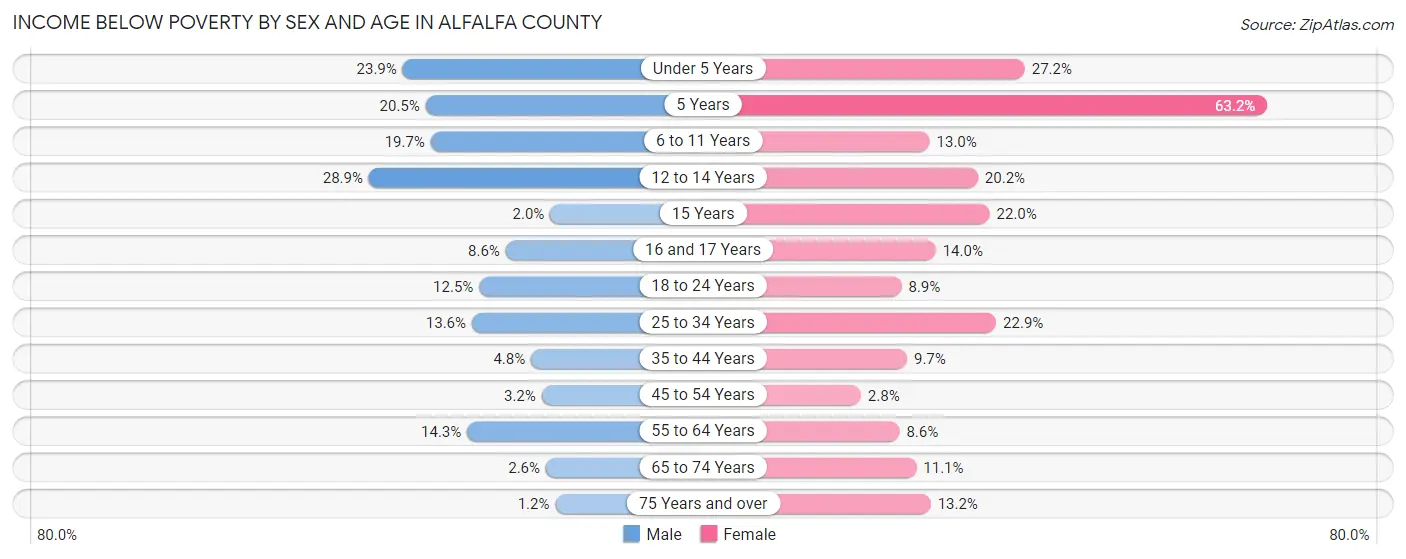
| Age Bracket | Male | Female |
| Under 5 Years | 37 (23.9%) | 28 (27.2%) |
| 5 Years | 9 (20.4%) | 12 (63.2%) |
| 6 to 11 Years | 53 (19.7%) | 27 (13.0%) |
| 12 to 14 Years | 13 (28.9%) | 19 (20.2%) |
| 15 Years | 1 (2.0%) | 9 (22.0%) |
| 16 and 17 Years | 3 (8.6%) | 6 (14.0%) |
| 18 to 24 Years | 19 (12.5%) | 14 (8.9%) |
| 25 to 34 Years | 39 (13.6%) | 55 (22.9%) |
| 35 to 44 Years | 18 (4.8%) | 19 (9.7%) |
| 45 to 54 Years | 10 (3.2%) | 6 (2.8%) |
| 55 to 64 Years | 43 (14.3%) | 25 (8.6%) |
| 65 to 74 Years | 6 (2.6%) | 28 (11.1%) |
| 75 Years and over | 2 (1.2%) | 33 (13.2%) |
| Total | 253 (10.4%) | 281 (13.3%) |
Income Above Poverty by Sex and Age in Alfalfa County
According to the poverty statistics in Alfalfa County, males aged 75 years and over and females aged 45 to 54 years are the age groups that are most secure financially, with 98.8% of males and 97.2% of females in these age groups living above the poverty line.
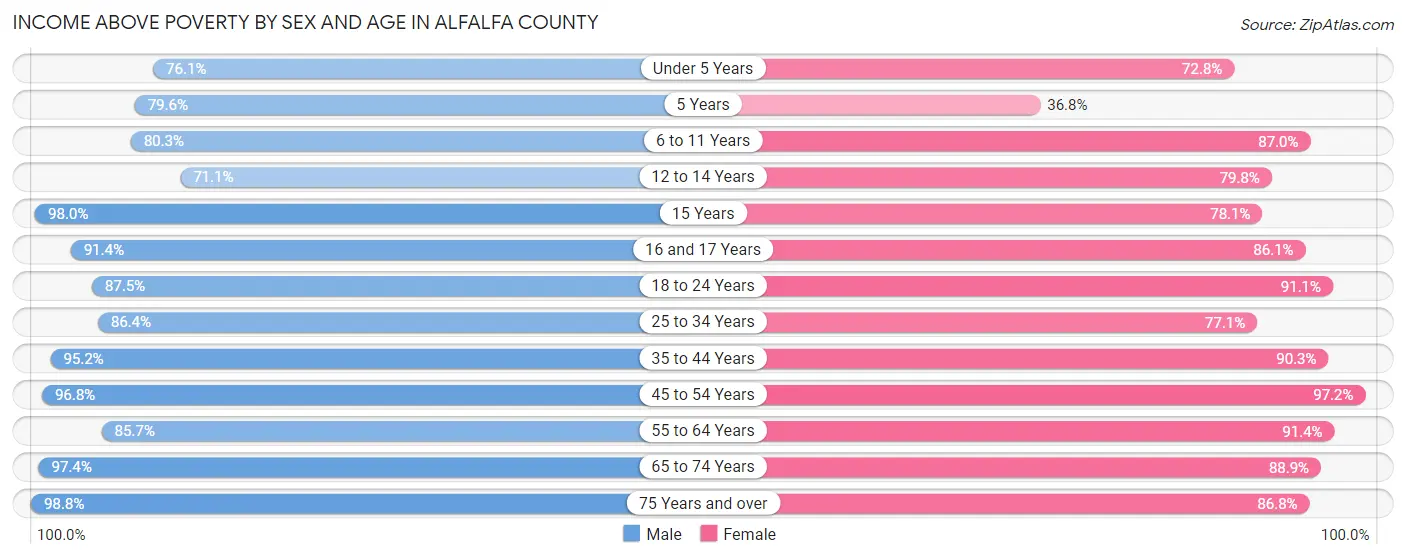
| Age Bracket | Male | Female |
| Under 5 Years | 118 (76.1%) | 75 (72.8%) |
| 5 Years | 35 (79.5%) | 7 (36.8%) |
| 6 to 11 Years | 216 (80.3%) | 180 (87.0%) |
| 12 to 14 Years | 32 (71.1%) | 75 (79.8%) |
| 15 Years | 50 (98.0%) | 32 (78.0%) |
| 16 and 17 Years | 32 (91.4%) | 37 (86.1%) |
| 18 to 24 Years | 133 (87.5%) | 144 (91.1%) |
| 25 to 34 Years | 248 (86.4%) | 185 (77.1%) |
| 35 to 44 Years | 357 (95.2%) | 177 (90.3%) |
| 45 to 54 Years | 300 (96.8%) | 205 (97.2%) |
| 55 to 64 Years | 258 (85.7%) | 267 (91.4%) |
| 65 to 74 Years | 225 (97.4%) | 225 (88.9%) |
| 75 Years and over | 166 (98.8%) | 217 (86.8%) |
| Total | 2,170 (89.6%) | 1,826 (86.7%) |
Income Below Poverty Among Married-Couple Families in Alfalfa County
The poverty statistics for married-couple families in Alfalfa County show that 5.5% or 57 of the total 1,036 families live below the poverty line. Families with 5 or more children have the highest poverty rate of 71.4%, comprising of 5 families. On the other hand, families with 1 or 2 children have the lowest poverty rate of 2.0%, which includes 7 families.
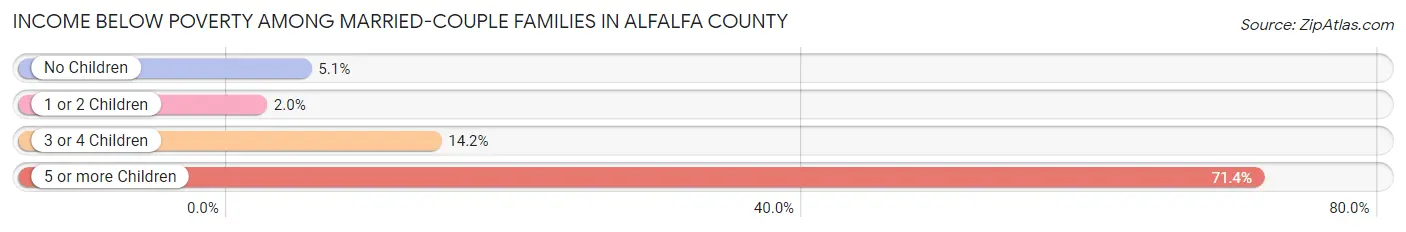
| Children | Above Poverty | Below Poverty |
| No Children | 538 (94.9%) | 29 (5.1%) |
| 1 or 2 Children | 342 (98.0%) | 7 (2.0%) |
| 3 or 4 Children | 97 (85.8%) | 16 (14.2%) |
| 5 or more Children | 2 (28.6%) | 5 (71.4%) |
| Total | 979 (94.5%) | 57 (5.5%) |
Income Below Poverty Among Single-Parent Households in Alfalfa County
According to the poverty data in Alfalfa County, 3.4% or 4 single-father households and 32.5% or 39 single-mother households are living below the poverty line. Among single-father households, those with 1 or 2 children have the highest poverty rate, with 4 households (8.5%) experiencing poverty. Likewise, among single-mother households, those with 5 or more children have the highest poverty rate, with 20 households (100.0%) falling below the poverty line.
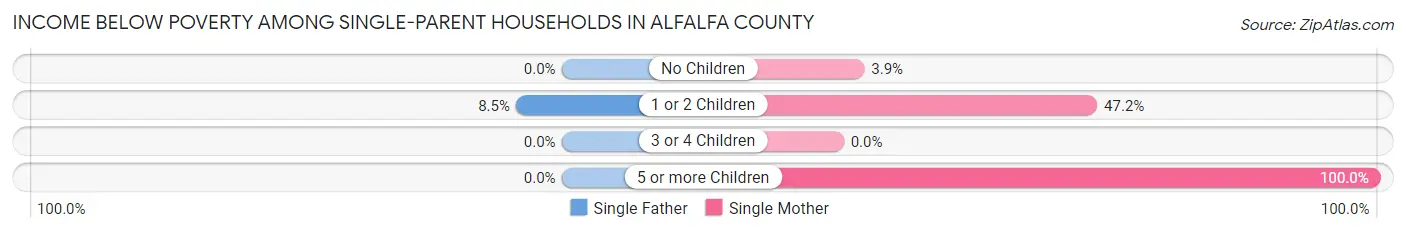
| Children | Single Father | Single Mother |
| No Children | 0 (0.0%) | 2 (3.8%) |
| 1 or 2 Children | 4 (8.5%) | 17 (47.2%) |
| 3 or 4 Children | 0 (0.0%) | 0 (0.0%) |
| 5 or more Children | 0 (0.0%) | 20 (100.0%) |
| Total | 4 (3.4%) | 39 (32.5%) |
Income Below Poverty Among Married-Couple vs Single-Parent Households in Alfalfa County
The poverty data for Alfalfa County shows that 57 of the married-couple family households (5.5%) and 43 of the single-parent households (18.0%) are living below the poverty level. Within the married-couple family households, those with 5 or more children have the highest poverty rate, with 5 households (71.4%) falling below the poverty line. Among the single-parent households, those with 5 or more children have the highest poverty rate, with 20 household (100.0%) living below poverty.
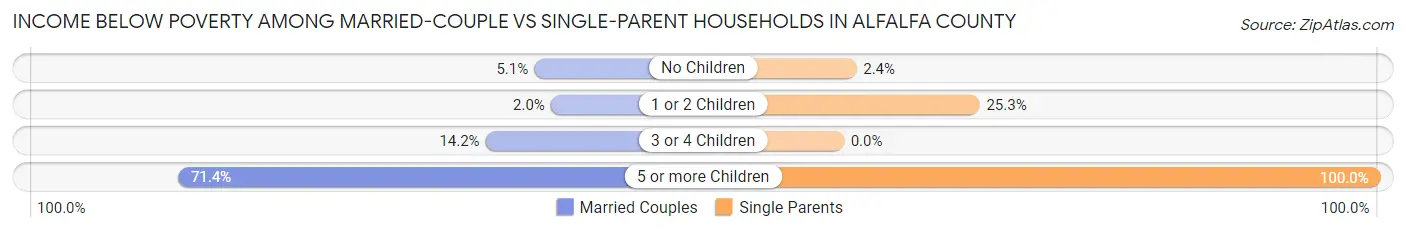
| Children | Married-Couple Families | Single-Parent Households |
| No Children | 29 (5.1%) | 2 (2.4%) |
| 1 or 2 Children | 7 (2.0%) | 21 (25.3%) |
| 3 or 4 Children | 16 (14.2%) | 0 (0.0%) |
| 5 or more Children | 5 (71.4%) | 20 (100.0%) |
| Total | 57 (5.5%) | 43 (18.0%) |
Race in Alfalfa County
The most populous races in Alfalfa County are White / Caucasian (4,695 | 82.6%), Two or more Races (400 | 7.0%), and Hispanic or Latino (376 | 6.6%).
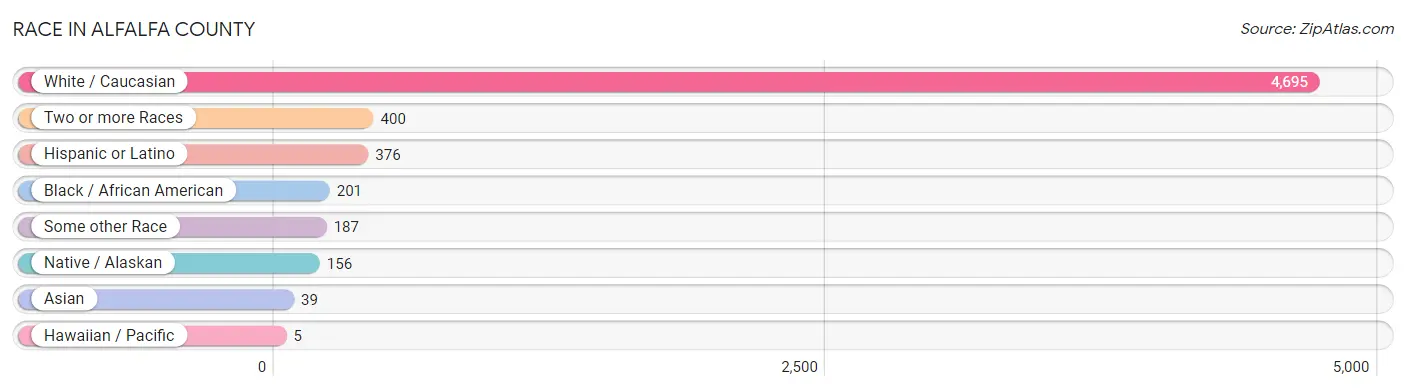
| Race | # Population | % Population |
| Asian | 39 | 0.7% |
| Black / African American | 201 | 3.5% |
| Hawaiian / Pacific | 5 | 0.1% |
| Hispanic or Latino | 376 | 6.6% |
| Native / Alaskan | 156 | 2.8% |
| White / Caucasian | 4,695 | 82.6% |
| Two or more Races | 400 | 7.0% |
| Some other Race | 187 | 3.3% |
| Total | 5,683 | 100.0% |
Ancestry in Alfalfa County
The most populous ancestries reported in Alfalfa County are German (1,293 | 22.8%), English (757 | 13.3%), Irish (621 | 10.9%), American (336 | 5.9%), and Mexican (293 | 5.2%), together accounting for 58.1% of all Alfalfa County residents.
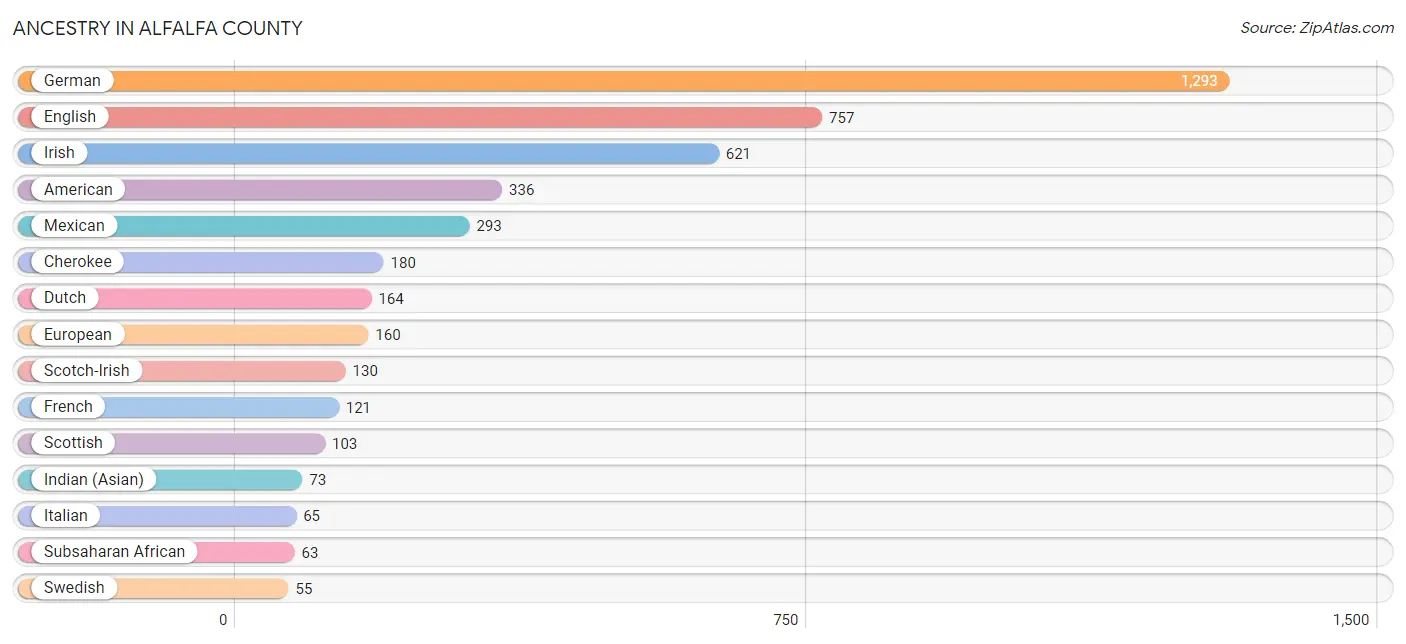
| Ancestry | # Population | % Population |
| African | 17 | 0.3% |
| American | 336 | 5.9% |
| Apache | 9 | 0.2% |
| Armenian | 6 | 0.1% |
| Austrian | 19 | 0.3% |
| Bhutanese | 1 | 0.0% |
| Blackfeet | 3 | 0.1% |
| Brazilian | 3 | 0.1% |
| British | 9 | 0.2% |
| Cherokee | 180 | 3.2% |
| Cheyenne | 1 | 0.0% |
| Chickasaw | 10 | 0.2% |
| Chippewa | 10 | 0.2% |
| Choctaw | 33 | 0.6% |
| Comanche | 7 | 0.1% |
| Creek | 39 | 0.7% |
| Czech | 16 | 0.3% |
| Danish | 41 | 0.7% |
| Dutch | 164 | 2.9% |
| Dutch West Indian | 38 | 0.7% |
| English | 757 | 13.3% |
| European | 160 | 2.8% |
| Fijian | 5 | 0.1% |
| French | 121 | 2.1% |
| German | 1,293 | 22.8% |
| Hungarian | 2 | 0.0% |
| Indian (Asian) | 73 | 1.3% |
| Inupiat | 17 | 0.3% |
| Iranian | 11 | 0.2% |
| Irish | 621 | 10.9% |
| Italian | 65 | 1.1% |
| Kenyan | 11 | 0.2% |
| Korean | 1 | 0.0% |
| Lithuanian | 3 | 0.1% |
| Mexican | 293 | 5.2% |
| Mexican American Indian | 9 | 0.2% |
| Northern European | 13 | 0.2% |
| Norwegian | 9 | 0.2% |
| Pennsylvania German | 5 | 0.1% |
| Peruvian | 1 | 0.0% |
| Polish | 50 | 0.9% |
| Portuguese | 4 | 0.1% |
| Potawatomi | 1 | 0.0% |
| Puerto Rican | 16 | 0.3% |
| Russian | 29 | 0.5% |
| Samoan | 11 | 0.2% |
| Scandinavian | 11 | 0.2% |
| Scotch-Irish | 130 | 2.3% |
| Scottish | 103 | 1.8% |
| South African | 10 | 0.2% |
| South American | 16 | 0.3% |
| Spaniard | 24 | 0.4% |
| Sri Lankan | 35 | 0.6% |
| Subsaharan African | 63 | 1.1% |
| Swedish | 55 | 1.0% |
| Swiss | 6 | 0.1% |
| Ukrainian | 1 | 0.0% |
| Uruguayan | 15 | 0.3% |
| Welsh | 16 | 0.3% |
| Yugoslavian | 12 | 0.2% | View All 60 Rows |
Immigrants in Alfalfa County
The most numerous immigrant groups reported in Alfalfa County came from Central America (105 | 1.8%), Latin America (105 | 1.8%), Mexico (102 | 1.8%), Asia (50 | 0.9%), and China (38 | 0.7%), together accounting for 7.0% of all Alfalfa County residents.
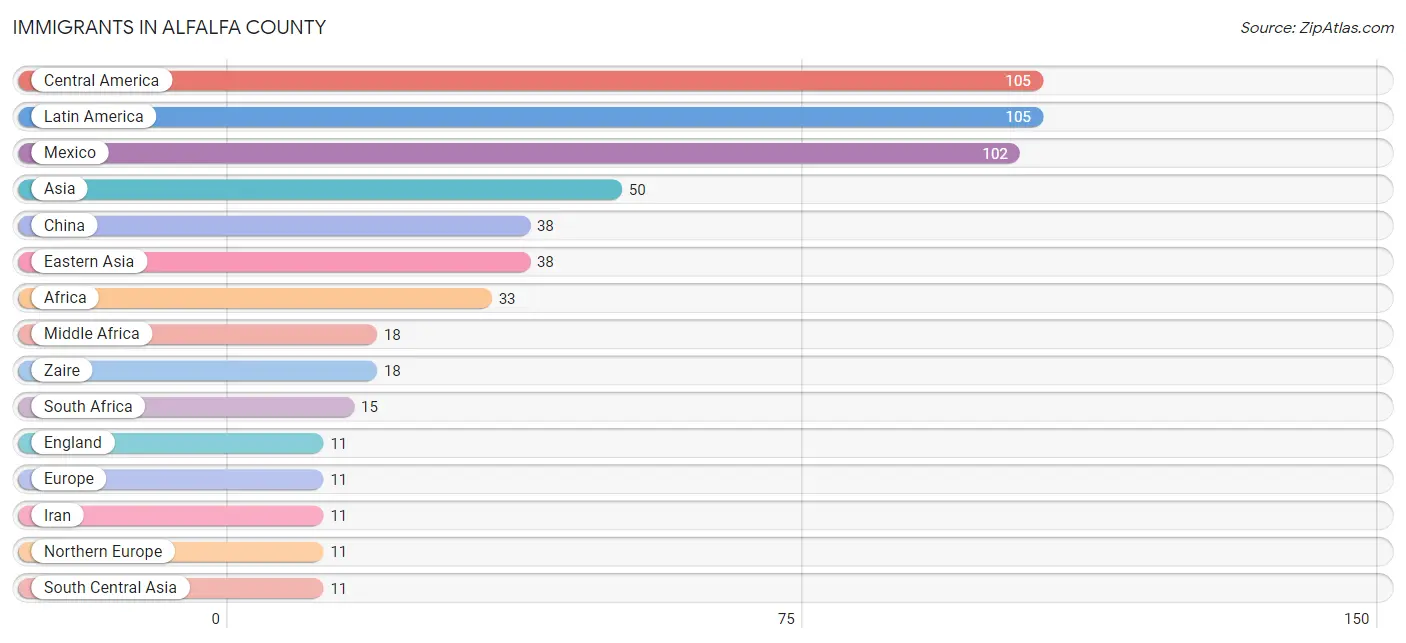
| Immigration Origin | # Population | % Population |
| Africa | 33 | 0.6% |
| Asia | 50 | 0.9% |
| Canada | 7 | 0.1% |
| Central America | 105 | 1.8% |
| China | 38 | 0.7% |
| Eastern Asia | 38 | 0.7% |
| England | 11 | 0.2% |
| Europe | 11 | 0.2% |
| Iran | 11 | 0.2% |
| Latin America | 105 | 1.8% |
| Mexico | 102 | 1.8% |
| Middle Africa | 18 | 0.3% |
| Northern Europe | 11 | 0.2% |
| Oceania | 5 | 0.1% |
| Panama | 3 | 0.1% |
| Philippines | 1 | 0.0% |
| South Africa | 15 | 0.3% |
| South Central Asia | 11 | 0.2% |
| South Eastern Asia | 1 | 0.0% |
| Zaire | 18 | 0.3% | View All 20 Rows |
Sex and Age in Alfalfa County
Sex and Age in Alfalfa County
The most populous age groups in Alfalfa County are 40 to 44 Years (441 | 12.4%) for men and 10 to 14 Years (189 | 8.8%) for women.
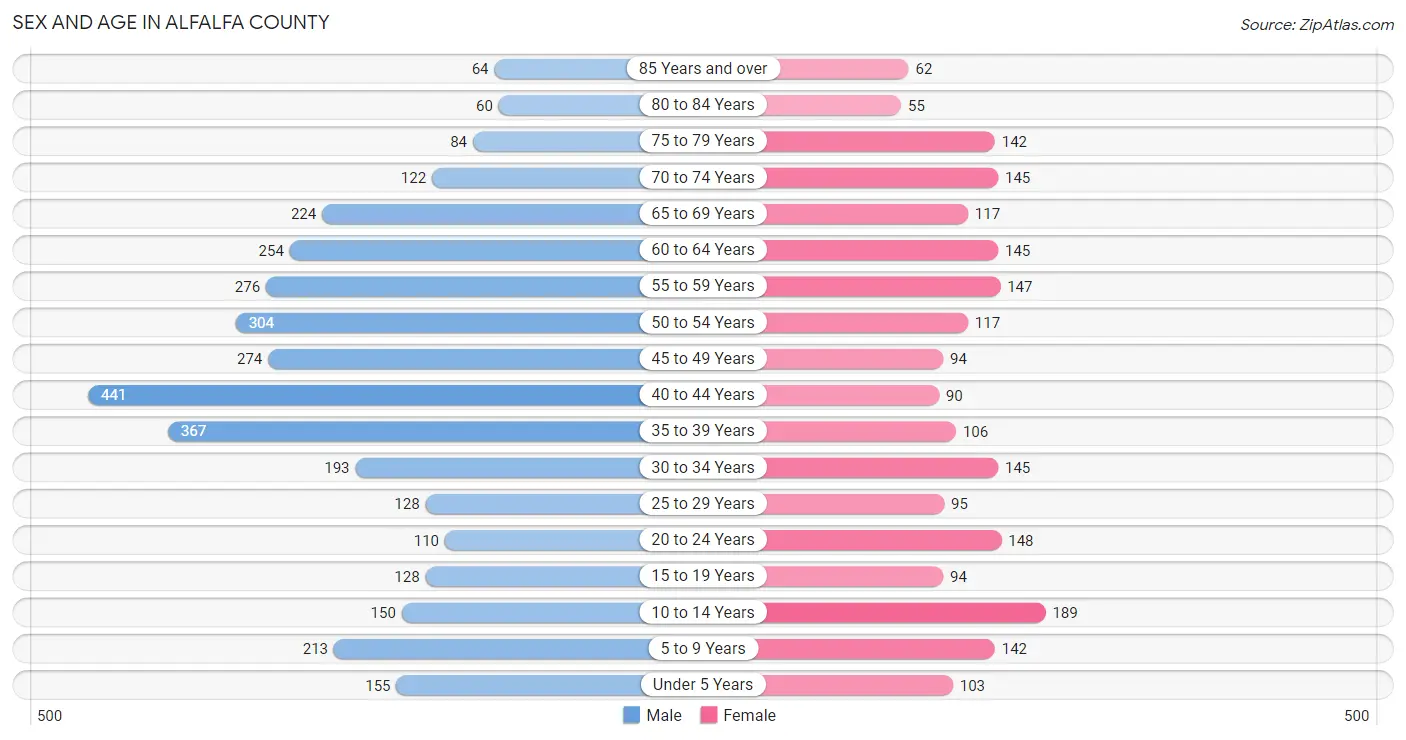
| Age Bracket | Male | Female |
| Under 5 Years | 155 (4.4%) | 103 (4.8%) |
| 5 to 9 Years | 213 (6.0%) | 142 (6.7%) |
| 10 to 14 Years | 150 (4.2%) | 189 (8.8%) |
| 15 to 19 Years | 128 (3.6%) | 94 (4.4%) |
| 20 to 24 Years | 110 (3.1%) | 148 (6.9%) |
| 25 to 29 Years | 128 (3.6%) | 95 (4.4%) |
| 30 to 34 Years | 193 (5.4%) | 145 (6.8%) |
| 35 to 39 Years | 367 (10.3%) | 106 (5.0%) |
| 40 to 44 Years | 441 (12.4%) | 90 (4.2%) |
| 45 to 49 Years | 274 (7.7%) | 94 (4.4%) |
| 50 to 54 Years | 304 (8.6%) | 117 (5.5%) |
| 55 to 59 Years | 276 (7.8%) | 147 (6.9%) |
| 60 to 64 Years | 254 (7.2%) | 145 (6.8%) |
| 65 to 69 Years | 224 (6.3%) | 117 (5.5%) |
| 70 to 74 Years | 122 (3.4%) | 145 (6.8%) |
| 75 to 79 Years | 84 (2.4%) | 142 (6.7%) |
| 80 to 84 Years | 60 (1.7%) | 55 (2.6%) |
| 85 Years and over | 64 (1.8%) | 62 (2.9%) |
| Total | 3,547 (100.0%) | 2,136 (100.0%) |
Families and Households in Alfalfa County
Median Family Size in Alfalfa County
The median family size in Alfalfa County is 3.02 persons per family, with single female/mother families (120 | 9.4%) accounting for the largest median family size of 3.43 persons per family. On the other hand, single male/father families (119 | 9.3%) represent the smallest median family size with 2.43 persons per family.
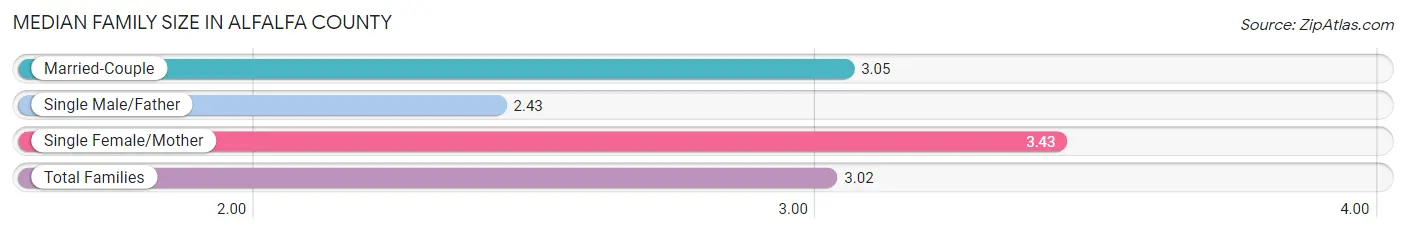
| Family Type | # Families | Family Size |
| Married-Couple | 1,036 (81.2%) | 3.05 |
| Single Male/Father | 119 (9.3%) | 2.43 |
| Single Female/Mother | 120 (9.4%) | 3.43 |
| Total Families | 1,275 (100.0%) | 3.02 |
Median Household Size in Alfalfa County
The median household size in Alfalfa County is 2.48 persons per household, with single female/mother households (120 | 6.6%) accounting for the largest median household size of 3.83 persons per household. non-family households (554 | 30.3%) represent the smallest median household size with 1.12 persons per household.
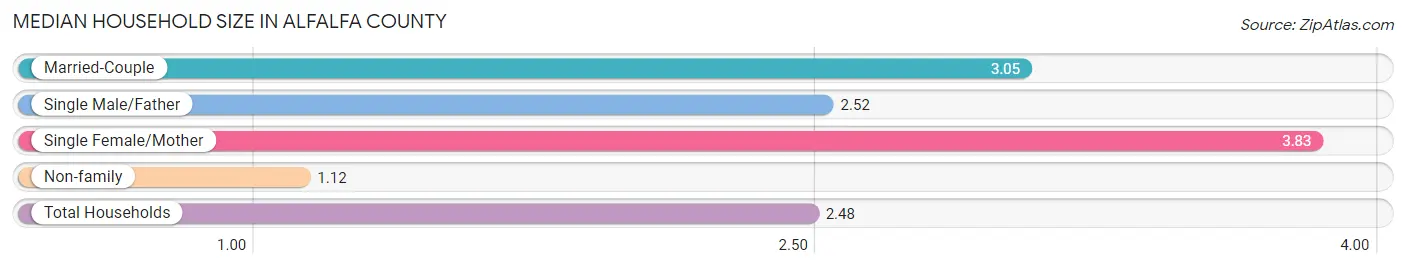
| Household Type | # Households | Household Size |
| Married-Couple | 1,036 (56.6%) | 3.05 |
| Single Male/Father | 119 (6.5%) | 2.52 |
| Single Female/Mother | 120 (6.6%) | 3.83 |
| Non-family | 554 (30.3%) | 1.12 |
| Total Households | 1,829 (100.0%) | 2.48 |
Household Size by Marriage Status in Alfalfa County
Out of a total of 1,829 households in Alfalfa County, 1,275 (69.7%) are family households, while 554 (30.3%) are nonfamily households. The most numerous type of family households are 2-person households, comprising 588, and the most common type of nonfamily households are 1-person households, comprising 518.
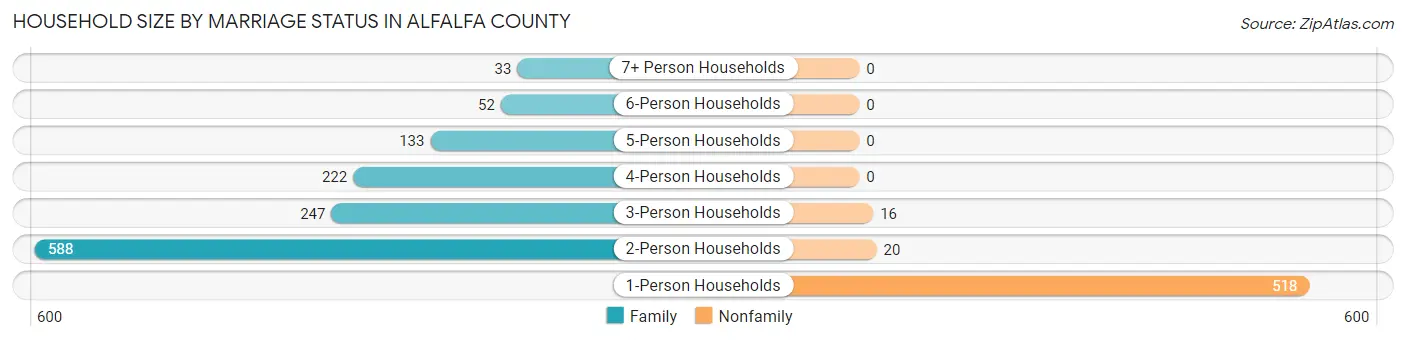
| Household Size | Family Households | Nonfamily Households |
| 1-Person Households | - | 518 (28.3%) |
| 2-Person Households | 588 (32.2%) | 20 (1.1%) |
| 3-Person Households | 247 (13.5%) | 16 (0.9%) |
| 4-Person Households | 222 (12.1%) | 0 (0.0%) |
| 5-Person Households | 133 (7.3%) | 0 (0.0%) |
| 6-Person Households | 52 (2.8%) | 0 (0.0%) |
| 7+ Person Households | 33 (1.8%) | 0 (0.0%) |
| Total | 1,275 (69.7%) | 554 (30.3%) |
Female Fertility in Alfalfa County
Fertility by Age in Alfalfa County
Average fertility rate in Alfalfa County is 72.0 births per 1,000 women. Women in the age bracket of 20 to 34 years have the highest fertility rate with 142.0 births per 1,000 women. Women in the age bracket of 20 to 34 years acount for 96.5% of all women with births.
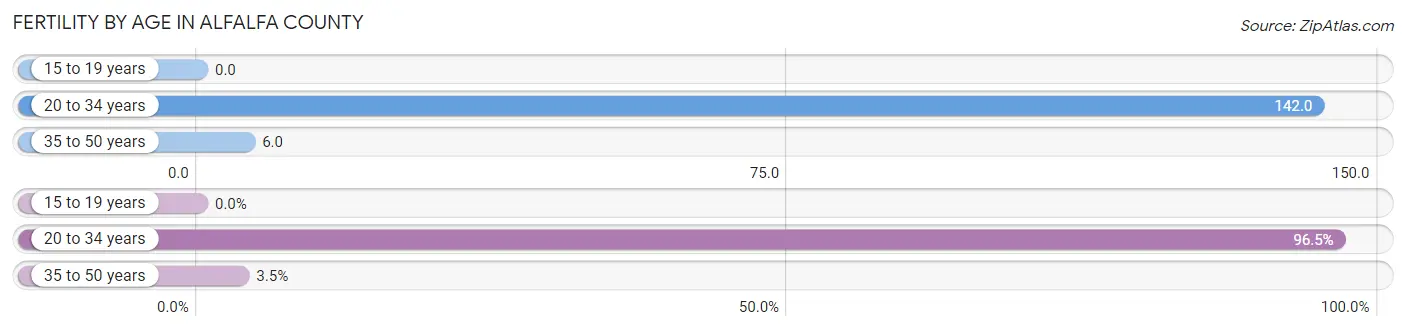
| Age Bracket | Women with Births | Births / 1,000 Women |
| 15 to 19 years | 0 (0.0%) | 0.0 |
| 20 to 34 years | 55 (96.5%) | 142.0 |
| 35 to 50 years | 2 (3.5%) | 6.0 |
| Total | 57 (100.0%) | 72.0 |
Fertility by Age by Marriage Status in Alfalfa County
38.6% of women with births (57) in Alfalfa County are married. The highest percentage of unmarried women with births falls into 20 to 34 years age bracket with 63.6% of them unmarried at the time of birth, while the lowest percentage of unmarried women with births belong to 35 to 50 years age bracket with 0.0% of them unmarried.
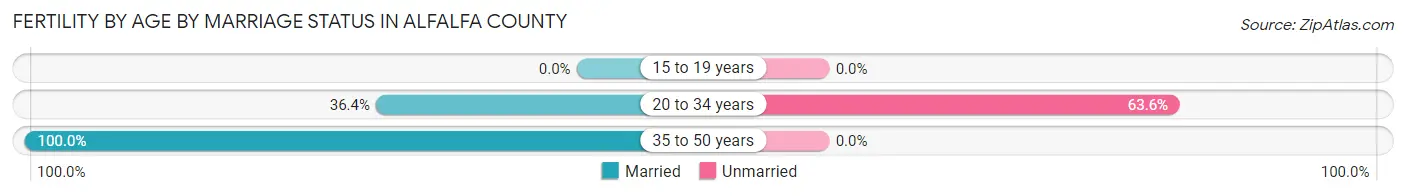
| Age Bracket | Married | Unmarried |
| 15 to 19 years | 0 (0.0%) | 0 (0.0%) |
| 20 to 34 years | 20 (36.4%) | 35 (63.6%) |
| 35 to 50 years | 2 (100.0%) | 0 (0.0%) |
| Total | 22 (38.6%) | 35 (61.4%) |
Fertility by Education in Alfalfa County
Average fertility rate in Alfalfa County is 72.0 births per 1,000 women. Women with the education attainment of high school diploma have the highest fertility rate of 150.0 births per 1,000 women, while women with the education attainment of less than high school have the lowest fertility at 19.0 births per 1,000 women. Women with the education attainment of high school diploma represent 49.1% of all women with births.
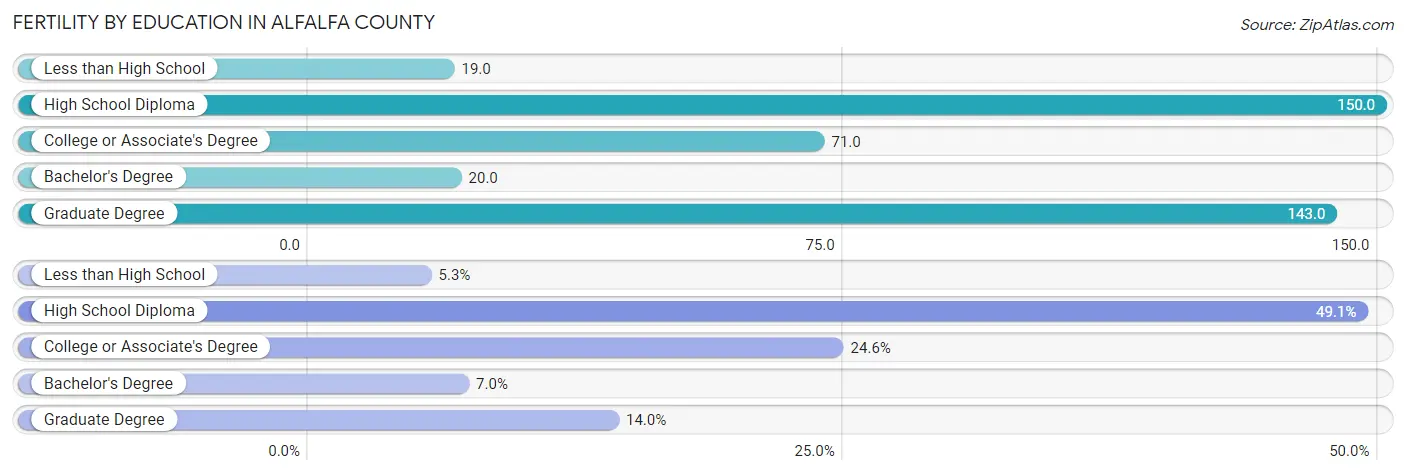
| Educational Attainment | Women with Births | Births / 1,000 Women |
| Less than High School | 3 (5.3%) | 19.0 |
| High School Diploma | 28 (49.1%) | 150.0 |
| College or Associate's Degree | 14 (24.6%) | 71.0 |
| Bachelor's Degree | 4 (7.0%) | 20.0 |
| Graduate Degree | 8 (14.0%) | 143.0 |
| Total | 57 (100.0%) | 72.0 |
Fertility by Education by Marriage Status in Alfalfa County
61.4% of women with births in Alfalfa County are unmarried. Women with the educational attainment of less than high school are most likely to be married with 100.0% of them married at childbirth, while women with the educational attainment of high school diploma are least likely to be married with 100.0% of them unmarried at childbirth.
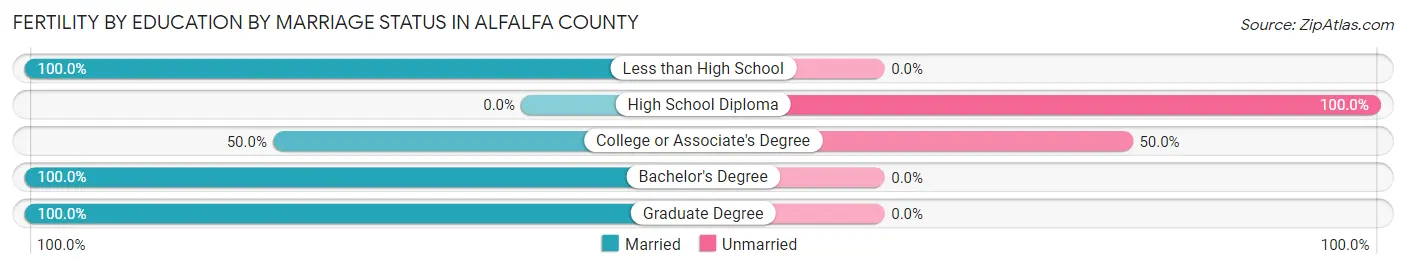
| Educational Attainment | Married | Unmarried |
| Less than High School | 3 (100.0%) | 0 (0.0%) |
| High School Diploma | 0 (0.0%) | 28 (100.0%) |
| College or Associate's Degree | 7 (50.0%) | 7 (50.0%) |
| Bachelor's Degree | 4 (100.0%) | 0 (0.0%) |
| Graduate Degree | 8 (100.0%) | 0 (0.0%) |
| Total | 22 (38.6%) | 35 (61.4%) |
Employment Characteristics in Alfalfa County
Employment by Class of Employer in Alfalfa County
Among the 2,078 employed individuals in Alfalfa County, private company employees (1,099 | 52.9%), self-employed (not incorporated) (273 | 13.1%), and local government employees (252 | 12.1%) make up the most common classes of employment.
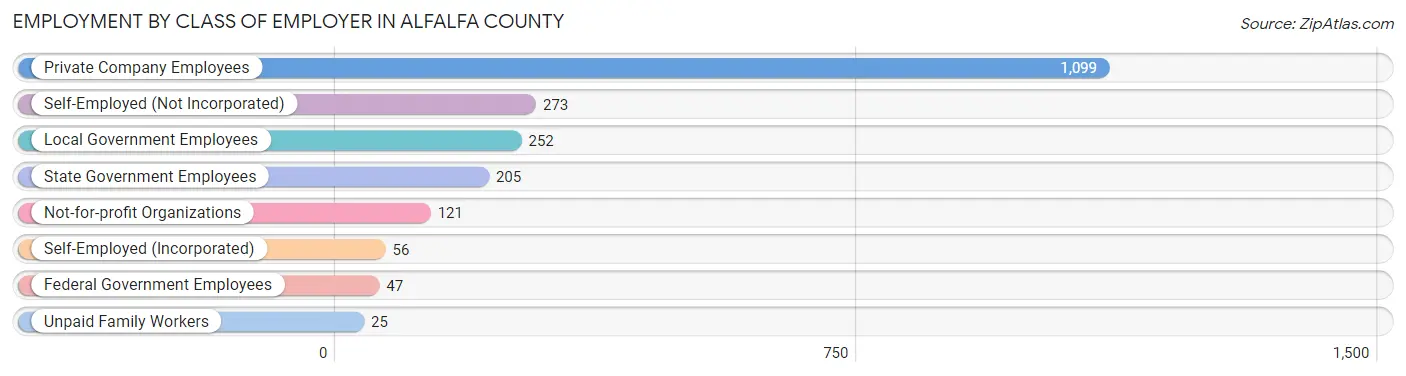
| Employer Class | # Employees | % Employees |
| Private Company Employees | 1,099 | 52.9% |
| Self-Employed (Incorporated) | 56 | 2.7% |
| Self-Employed (Not Incorporated) | 273 | 13.1% |
| Not-for-profit Organizations | 121 | 5.8% |
| Local Government Employees | 252 | 12.1% |
| State Government Employees | 205 | 9.9% |
| Federal Government Employees | 47 | 2.3% |
| Unpaid Family Workers | 25 | 1.2% |
| Total | 2,078 | 100.0% |
Employment Status by Age in Alfalfa County
According to the labor force statistics for Alfalfa County, out of the total population over 16 years of age (4,639), 47.5% or 2,204 individuals are in the labor force, with 4.0% or 88 of them unemployed. The age group with the highest labor force participation rate is 25 to 29 years, with 92.8% or 207 individuals in the labor force. Within the labor force, the 16 to 19 years age range has the highest percentage of unemployed individuals, with 34.3% or 24 of them being unemployed.
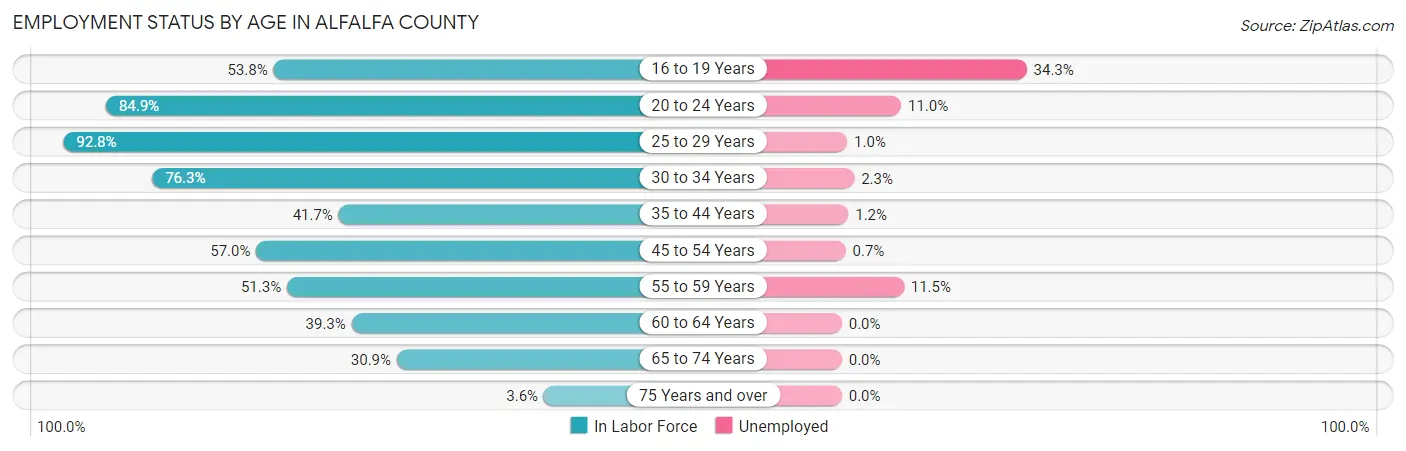
| Age Bracket | In Labor Force | Unemployed |
| 16 to 19 Years | 70 (53.8%) | 24 (34.3%) |
| 20 to 24 Years | 219 (84.9%) | 24 (11.0%) |
| 25 to 29 Years | 207 (92.8%) | 2 (1.0%) |
| 30 to 34 Years | 258 (76.3%) | 6 (2.3%) |
| 35 to 44 Years | 419 (41.7%) | 5 (1.2%) |
| 45 to 54 Years | 450 (57.0%) | 3 (0.7%) |
| 55 to 59 Years | 217 (51.3%) | 25 (11.5%) |
| 60 to 64 Years | 157 (39.3%) | 0 (0.0%) |
| 65 to 74 Years | 188 (30.9%) | 0 (0.0%) |
| 75 Years and over | 17 (3.6%) | 0 (0.0%) |
| Total | 2,204 (47.5%) | 88 (4.0%) |
Employment Status by Educational Attainment in Alfalfa County
According to labor force statistics for Alfalfa County, 53.8% of individuals (1,709) out of the total population between 25 and 64 years of age (3,176) are in the labor force, with 2.4% or 41 of them being unemployed. The group with the highest labor force participation rate are those with the educational attainment of bachelor's degree or higher, with 85.1% or 531 individuals in the labor force. Within the labor force, individuals with bachelor's degree or higher education have the highest percentage of unemployment, with 4.7% or 25 of them being unemployed.
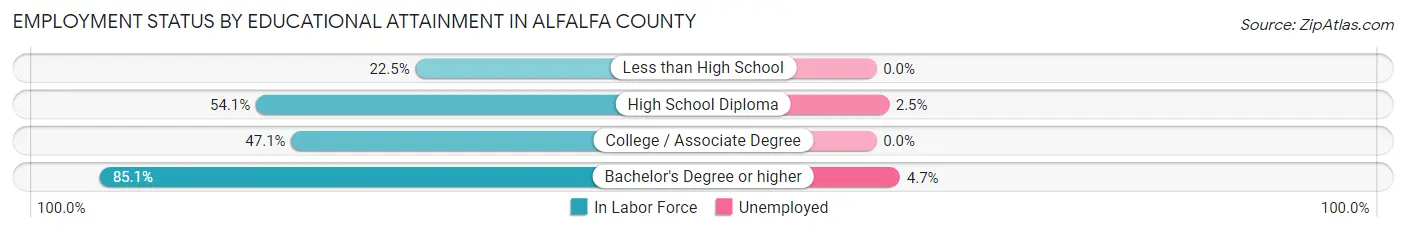
| Educational Attainment | In Labor Force | Unemployed |
| Less than High School | 99 (22.5%) | 0 (0.0%) |
| High School Diploma | 643 (54.1%) | 30 (2.5%) |
| College / Associate Degree | 435 (47.1%) | 0 (0.0%) |
| Bachelor's Degree or higher | 531 (85.1%) | 29 (4.7%) |
| Total | 1,709 (53.8%) | 76 (2.4%) |
Employment Occupations by Sex in Alfalfa County
Management, Business, Science and Arts Occupations
The most common Management, Business, Science and Arts occupations in Alfalfa County are Management (325 | 15.4%), Community & Social Service (238 | 11.3%), Education Instruction & Library (184 | 8.7%), Business & Financial (72 | 3.4%), and Health Diagnosing & Treating (66 | 3.1%).
Management, Business, Science and Arts Occupations by Sex
Within the Management, Business, Science and Arts occupations in Alfalfa County, the most male-oriented occupations are Computers, Engineering & Science (100.0%), Computers & Mathematics (100.0%), and Architecture & Engineering (100.0%), while the most female-oriented occupations are Health Diagnosing & Treating (93.9%), Health Technologists (88.9%), and Legal Services & Support (71.4%).
| Occupation | Male | Female |
| Management | 241 (74.2%) | 84 (25.9%) |
| Business & Financial | 33 (45.8%) | 39 (54.2%) |
| Computers, Engineering & Science | 35 (100.0%) | 0 (0.0%) |
| Computers & Mathematics | 18 (100.0%) | 0 (0.0%) |
| Architecture & Engineering | 17 (100.0%) | 0 (0.0%) |
| Life, Physical & Social Science | 0 (0.0%) | 0 (0.0%) |
| Community & Social Service | 114 (47.9%) | 124 (52.1%) |
| Education, Arts & Media | 22 (59.5%) | 15 (40.5%) |
| Legal Services & Support | 2 (28.6%) | 5 (71.4%) |
| Education Instruction & Library | 86 (46.7%) | 98 (53.3%) |
| Arts, Media & Entertainment | 4 (40.0%) | 6 (60.0%) |
| Health Diagnosing & Treating | 4 (6.1%) | 62 (93.9%) |
| Health Technologists | 4 (11.1%) | 32 (88.9%) |
| Total (Category) | 427 (58.0%) | 309 (42.0%) |
| Total (Overall) | 1,289 (61.0%) | 824 (39.0%) |
Services Occupations
The most common Services occupations in Alfalfa County are Food Preparation & Serving (76 | 3.6%), Cleaning & Maintenance (75 | 3.5%), Security & Protection (61 | 2.9%), Law Enforcement (58 | 2.7%), and Healthcare Support (41 | 1.9%).
Services Occupations by Sex
Within the Services occupations in Alfalfa County, the most male-oriented occupations are Law Enforcement (82.8%), Security & Protection (78.7%), and Cleaning & Maintenance (58.7%), while the most female-oriented occupations are Firefighting & Prevention (100.0%), Personal Care & Service (100.0%), and Healthcare Support (73.2%).
| Occupation | Male | Female |
| Healthcare Support | 11 (26.8%) | 30 (73.2%) |
| Security & Protection | 48 (78.7%) | 13 (21.3%) |
| Firefighting & Prevention | 0 (0.0%) | 3 (100.0%) |
| Law Enforcement | 48 (82.8%) | 10 (17.2%) |
| Food Preparation & Serving | 23 (30.3%) | 53 (69.7%) |
| Cleaning & Maintenance | 44 (58.7%) | 31 (41.3%) |
| Personal Care & Service | 0 (0.0%) | 10 (100.0%) |
| Total (Category) | 126 (47.9%) | 137 (52.1%) |
| Total (Overall) | 1,289 (61.0%) | 824 (39.0%) |
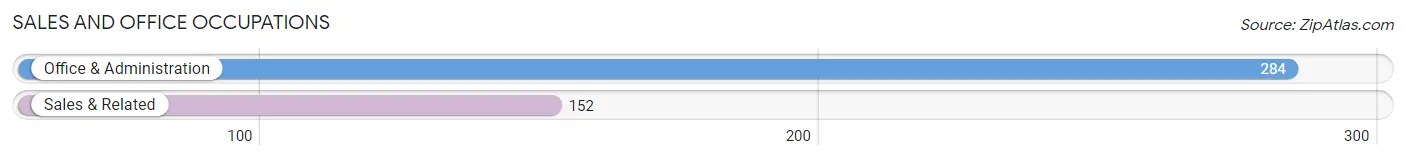
Sales and Office Occupations
The most common Sales and Office occupations in Alfalfa County are Office & Administration (284 | 13.4%), and Sales & Related (152 | 7.2%).
Sales and Office Occupations by Sex

| Occupation | Male | Female |
| Sales & Related | 68 (44.7%) | 84 (55.3%) |
| Office & Administration | 38 (13.4%) | 246 (86.6%) |
| Total (Category) | 106 (24.3%) | 330 (75.7%) |
| Total (Overall) | 1,289 (61.0%) | 824 (39.0%) |
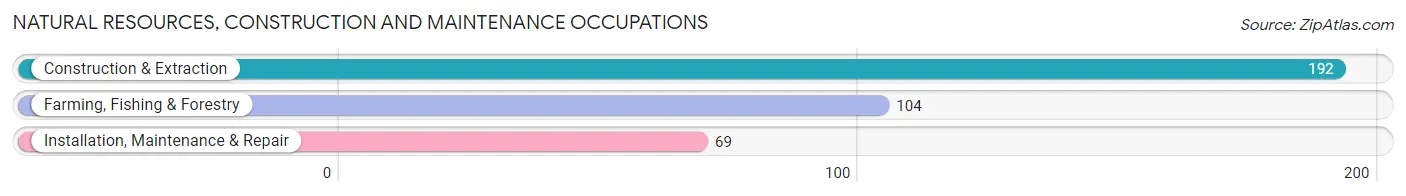
Natural Resources, Construction and Maintenance Occupations
The most common Natural Resources, Construction and Maintenance occupations in Alfalfa County are Construction & Extraction (192 | 9.1%), Farming, Fishing & Forestry (104 | 4.9%), and Installation, Maintenance & Repair (69 | 3.3%).
Natural Resources, Construction and Maintenance Occupations by Sex
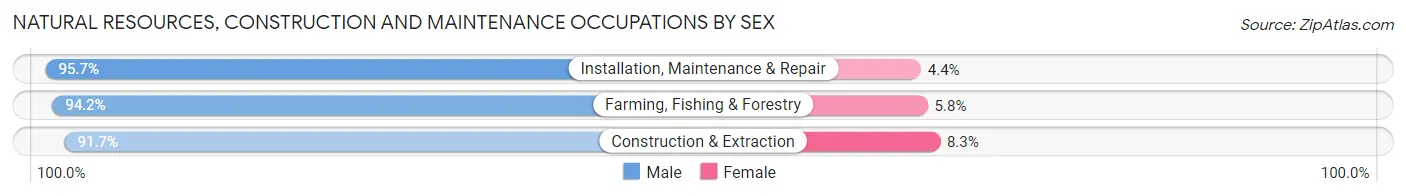
| Occupation | Male | Female |
| Farming, Fishing & Forestry | 98 (94.2%) | 6 (5.8%) |
| Construction & Extraction | 176 (91.7%) | 16 (8.3%) |
| Installation, Maintenance & Repair | 66 (95.7%) | 3 (4.3%) |
| Total (Category) | 340 (93.1%) | 25 (6.9%) |
| Total (Overall) | 1,289 (61.0%) | 824 (39.0%) |
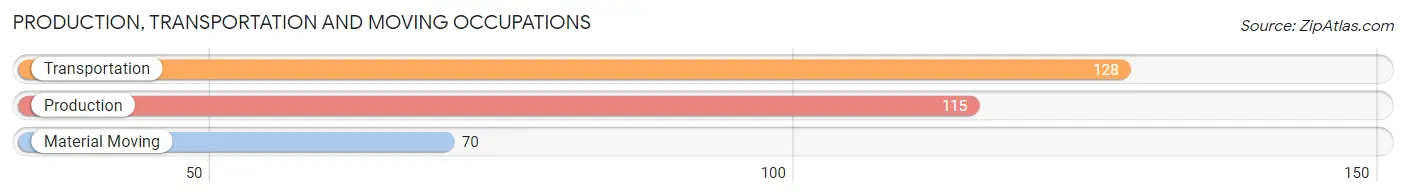
Production, Transportation and Moving Occupations
The most common Production, Transportation and Moving occupations in Alfalfa County are Transportation (128 | 6.1%), Production (115 | 5.4%), and Material Moving (70 | 3.3%).
Production, Transportation and Moving Occupations by Sex
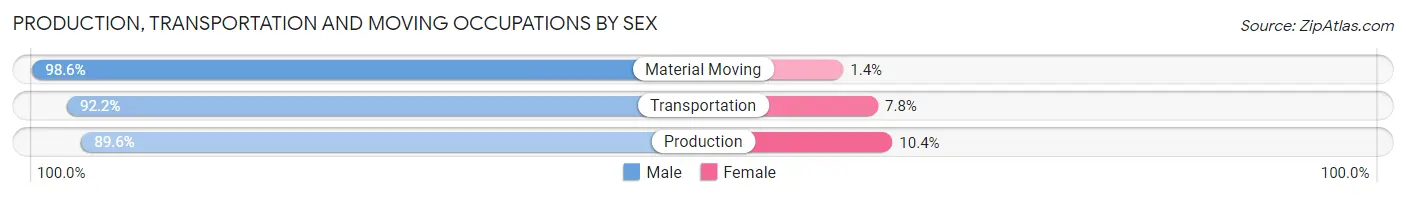
| Occupation | Male | Female |
| Production | 103 (89.6%) | 12 (10.4%) |
| Transportation | 118 (92.2%) | 10 (7.8%) |
| Material Moving | 69 (98.6%) | 1 (1.4%) |
| Total (Category) | 290 (92.6%) | 23 (7.3%) |
| Total (Overall) | 1,289 (61.0%) | 824 (39.0%) |
Employment Industries by Sex in Alfalfa County
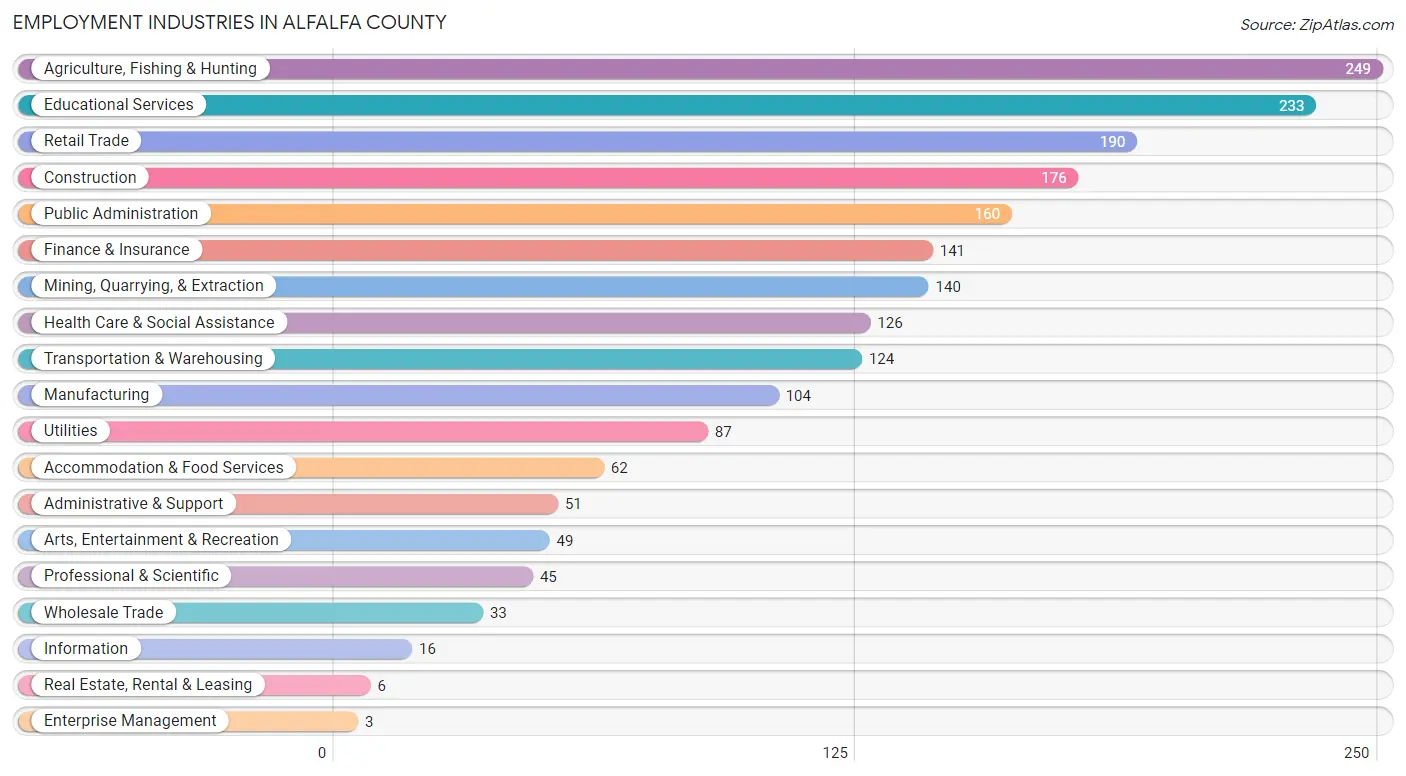
Employment Industries in Alfalfa County
The major employment industries in Alfalfa County include Agriculture, Fishing & Hunting (249 | 11.8%), Educational Services (233 | 11.0%), Retail Trade (190 | 9.0%), Construction (176 | 8.3%), and Public Administration (160 | 7.6%).
Employment Industries by Sex in Alfalfa County
The Alfalfa County industries that see more men than women are Mining, Quarrying, & Extraction (97.9%), Transportation & Warehousing (97.6%), and Agriculture, Fishing & Hunting (89.2%), whereas the industries that tend to have a higher number of women are Enterprise Management (100.0%), Health Care & Social Assistance (92.1%), and Information (87.5%).
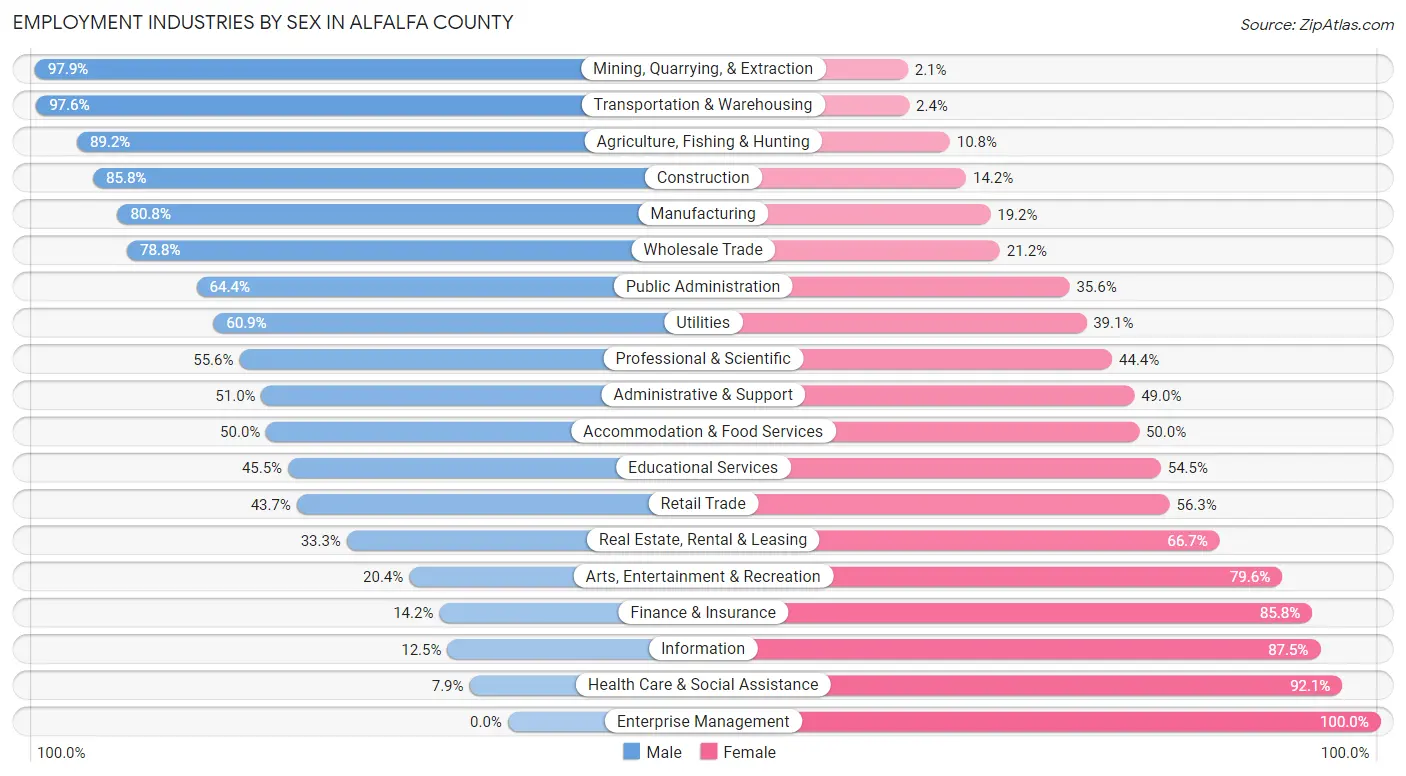
| Industry | Male | Female |
| Agriculture, Fishing & Hunting | 222 (89.2%) | 27 (10.8%) |
| Mining, Quarrying, & Extraction | 137 (97.9%) | 3 (2.1%) |
| Construction | 151 (85.8%) | 25 (14.2%) |
| Manufacturing | 84 (80.8%) | 20 (19.2%) |
| Wholesale Trade | 26 (78.8%) | 7 (21.2%) |
| Retail Trade | 83 (43.7%) | 107 (56.3%) |
| Transportation & Warehousing | 121 (97.6%) | 3 (2.4%) |
| Utilities | 53 (60.9%) | 34 (39.1%) |
| Information | 2 (12.5%) | 14 (87.5%) |
| Finance & Insurance | 20 (14.2%) | 121 (85.8%) |
| Real Estate, Rental & Leasing | 2 (33.3%) | 4 (66.7%) |
| Professional & Scientific | 25 (55.6%) | 20 (44.4%) |
| Enterprise Management | 0 (0.0%) | 3 (100.0%) |
| Administrative & Support | 26 (51.0%) | 25 (49.0%) |
| Educational Services | 106 (45.5%) | 127 (54.5%) |
| Health Care & Social Assistance | 10 (7.9%) | 116 (92.1%) |
| Arts, Entertainment & Recreation | 10 (20.4%) | 39 (79.6%) |
| Accommodation & Food Services | 31 (50.0%) | 31 (50.0%) |
| Public Administration | 103 (64.4%) | 57 (35.6%) |
| Total | 1,289 (61.0%) | 824 (39.0%) |
Education in Alfalfa County
School Enrollment in Alfalfa County
The most common levels of schooling among the 1,012 students in Alfalfa County are elementary school (328 | 32.4%), middle school (272 | 26.9%), and high school (157 | 15.5%).
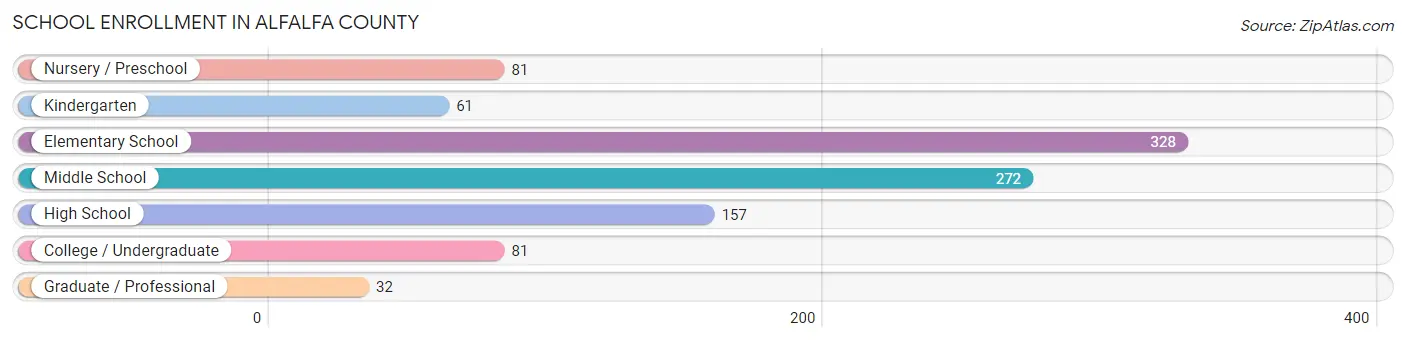
| School Level | # Students | % Students |
| Nursery / Preschool | 81 | 8.0% |
| Kindergarten | 61 | 6.0% |
| Elementary School | 328 | 32.4% |
| Middle School | 272 | 26.9% |
| High School | 157 | 15.5% |
| College / Undergraduate | 81 | 8.0% |
| Graduate / Professional | 32 | 3.2% |
| Total | 1,012 | 100.0% |
School Enrollment by Age by Funding Source in Alfalfa County
Out of a total of 1,012 students who are enrolled in schools in Alfalfa County, 24 (2.4%) attend a private institution, while the remaining 988 (97.6%) are enrolled in public schools. The age group of 10 to 14 year olds has the highest likelihood of being enrolled in private schools, with 14 (4.4% in the age bracket) enrolled. Conversely, the age group of 5 to 9 year old has the lowest likelihood of being enrolled in a private school, with 348 (100.0% in the age bracket) attending a public institution.
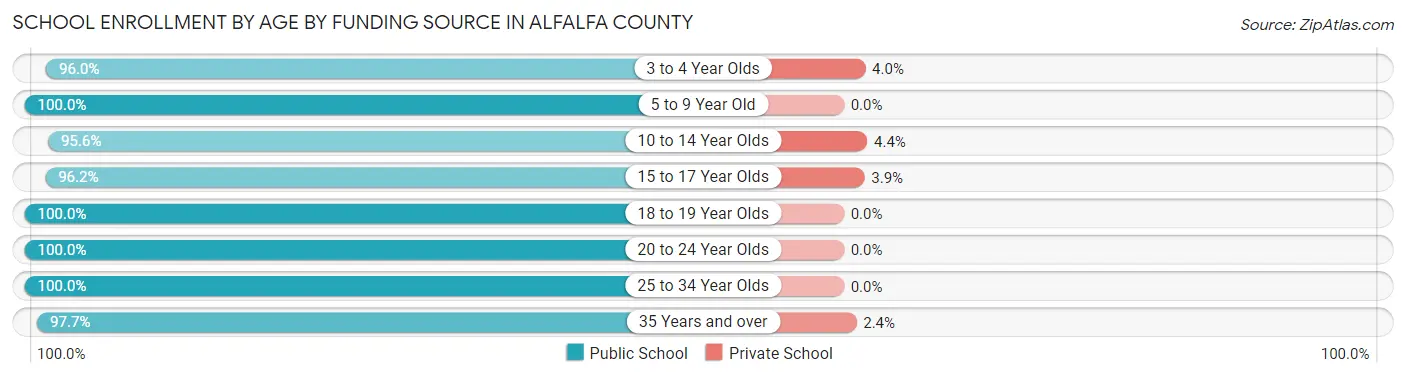
| Age Bracket | Public School | Private School |
| 3 to 4 Year Olds | 48 (96.0%) | 2 (4.0%) |
| 5 to 9 Year Old | 348 (100.0%) | 0 (0.0%) |
| 10 to 14 Year Olds | 307 (95.6%) | 14 (4.4%) |
| 15 to 17 Year Olds | 150 (96.2%) | 6 (3.8%) |
| 18 to 19 Year Olds | 4 (100.0%) | 0 (0.0%) |
| 20 to 24 Year Olds | 27 (100.0%) | 0 (0.0%) |
| 25 to 34 Year Olds | 21 (100.0%) | 0 (0.0%) |
| 35 Years and over | 83 (97.7%) | 2 (2.4%) |
| Total | 988 (97.6%) | 24 (2.4%) |
Educational Attainment by Field of Study in Alfalfa County
Education (251 | 27.4%), bio, nature & agricultural (146 | 15.9%), business (130 | 14.2%), arts & humanities (117 | 12.8%), and science & technology (87 | 9.5%) are the most common fields of study among 917 individuals in Alfalfa County who have obtained a bachelor's degree or higher.
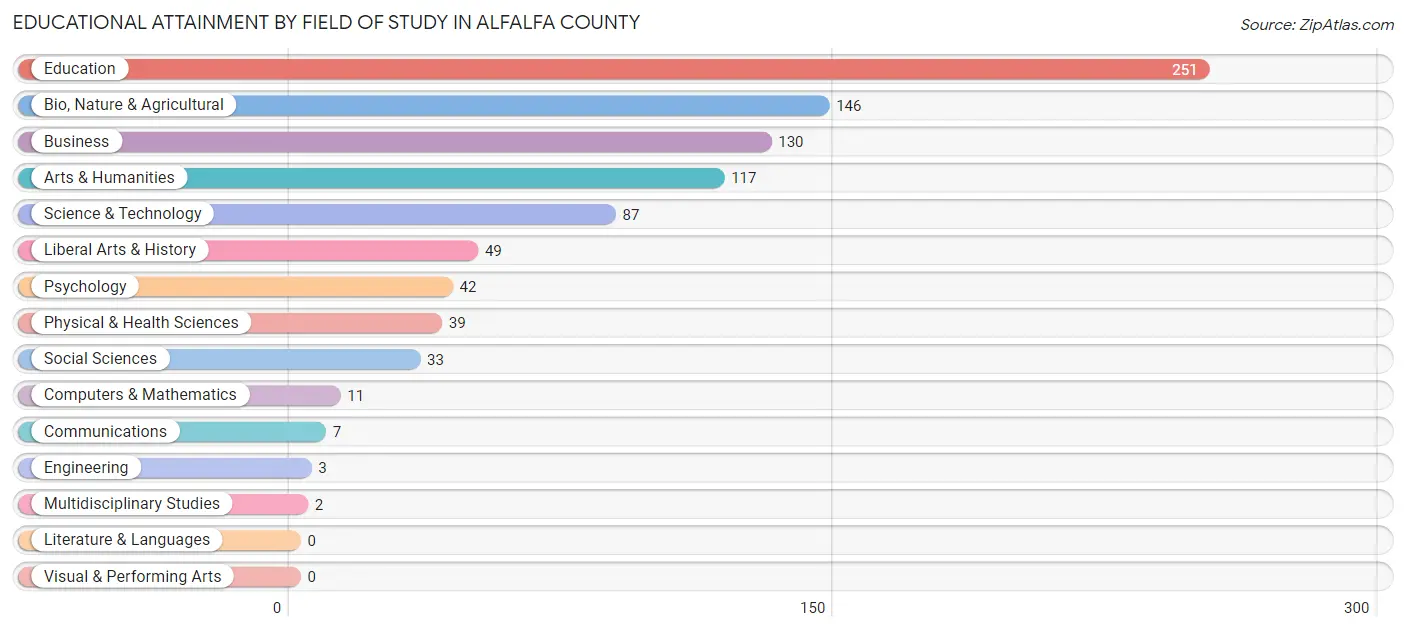
| Field of Study | # Graduates | % Graduates |
| Computers & Mathematics | 11 | 1.2% |
| Bio, Nature & Agricultural | 146 | 15.9% |
| Physical & Health Sciences | 39 | 4.3% |
| Psychology | 42 | 4.6% |
| Social Sciences | 33 | 3.6% |
| Engineering | 3 | 0.3% |
| Multidisciplinary Studies | 2 | 0.2% |
| Science & Technology | 87 | 9.5% |
| Business | 130 | 14.2% |
| Education | 251 | 27.4% |
| Literature & Languages | 0 | 0.0% |
| Liberal Arts & History | 49 | 5.3% |
| Visual & Performing Arts | 0 | 0.0% |
| Communications | 7 | 0.8% |
| Arts & Humanities | 117 | 12.8% |
| Total | 917 | 100.0% |
Transportation & Commute in Alfalfa County
Vehicle Availability by Sex in Alfalfa County
The most prevalent vehicle ownership categories in Alfalfa County are males with 2 vehicles (522, accounting for 41.1%) and females with 2 vehicles (398, making up 64.6%).
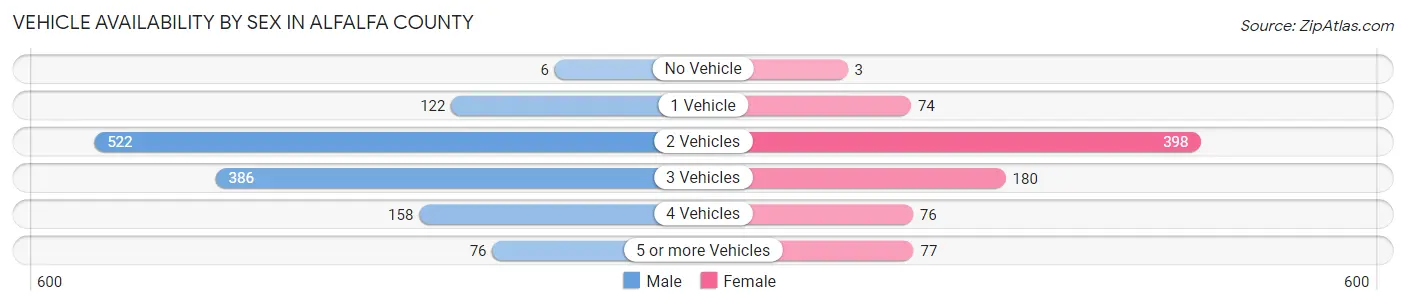
| Vehicles Available | Male | Female |
| No Vehicle | 6 (0.5%) | 3 (0.4%) |
| 1 Vehicle | 122 (9.6%) | 74 (9.2%) |
| 2 Vehicles | 522 (41.1%) | 398 (49.3%) |
| 3 Vehicles | 386 (30.4%) | 180 (22.3%) |
| 4 Vehicles | 158 (12.4%) | 76 (9.4%) |
| 5 or more Vehicles | 76 (6.0%) | 77 (9.5%) |
| Total | 1,270 (100.0%) | 808 (100.0%) |
Commute Time in Alfalfa County
The most frequently occuring commute durations in Alfalfa County are less than 5 minutes (432 commuters, 21.6%), 5 to 9 minutes (329 commuters, 16.5%), and 15 to 19 minutes (201 commuters, 10.1%).
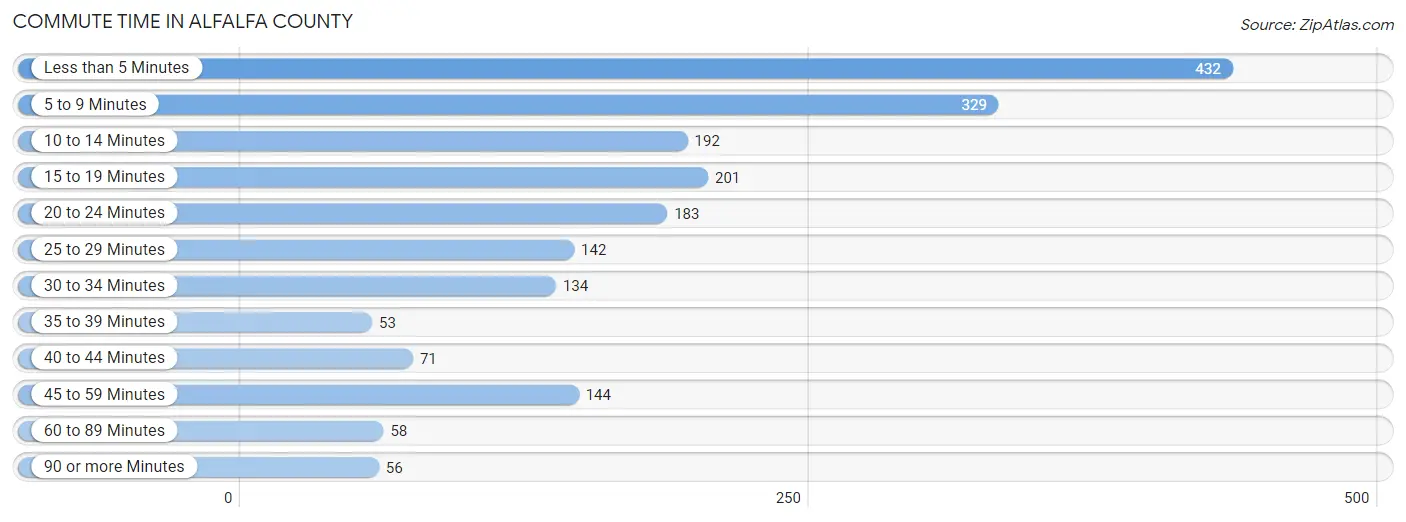
| Commute Time | # Commuters | % Commuters |
| Less than 5 Minutes | 432 | 21.6% |
| 5 to 9 Minutes | 329 | 16.5% |
| 10 to 14 Minutes | 192 | 9.6% |
| 15 to 19 Minutes | 201 | 10.1% |
| 20 to 24 Minutes | 183 | 9.2% |
| 25 to 29 Minutes | 142 | 7.1% |
| 30 to 34 Minutes | 134 | 6.7% |
| 35 to 39 Minutes | 53 | 2.7% |
| 40 to 44 Minutes | 71 | 3.6% |
| 45 to 59 Minutes | 144 | 7.2% |
| 60 to 89 Minutes | 58 | 2.9% |
| 90 or more Minutes | 56 | 2.8% |
Commute Time by Sex in Alfalfa County
The most common commute times in Alfalfa County are less than 5 minutes (239 commuters, 19.3%) for males and less than 5 minutes (193 commuters, 25.5%) for females.
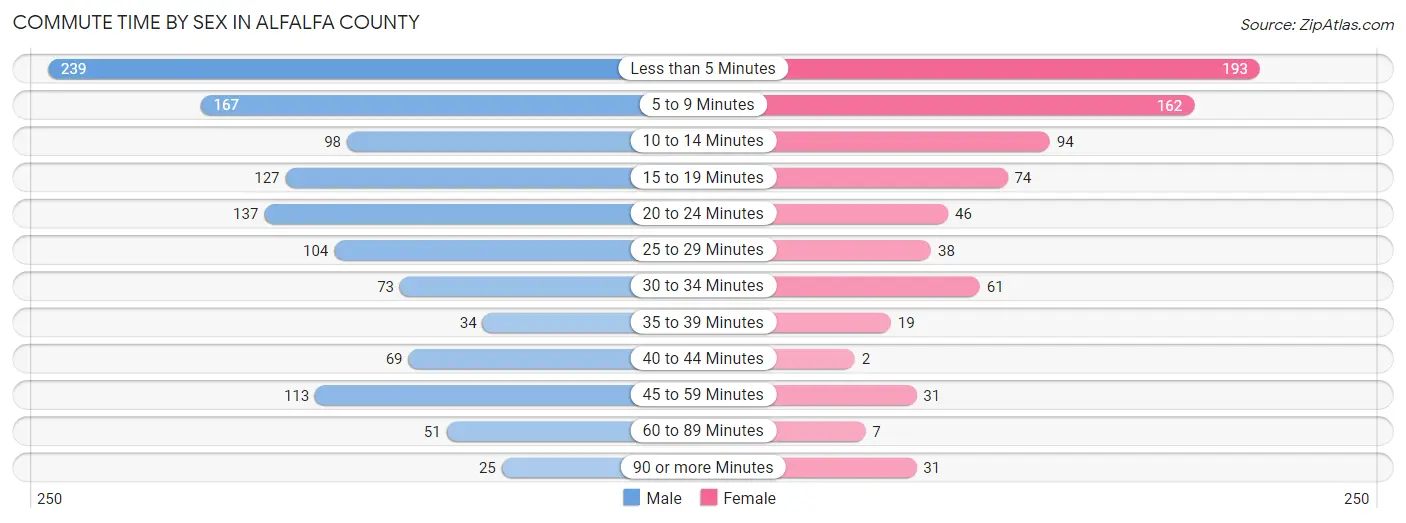
| Commute Time | Male | Female |
| Less than 5 Minutes | 239 (19.3%) | 193 (25.5%) |
| 5 to 9 Minutes | 167 (13.5%) | 162 (21.4%) |
| 10 to 14 Minutes | 98 (7.9%) | 94 (12.4%) |
| 15 to 19 Minutes | 127 (10.3%) | 74 (9.8%) |
| 20 to 24 Minutes | 137 (11.1%) | 46 (6.1%) |
| 25 to 29 Minutes | 104 (8.4%) | 38 (5.0%) |
| 30 to 34 Minutes | 73 (5.9%) | 61 (8.1%) |
| 35 to 39 Minutes | 34 (2.8%) | 19 (2.5%) |
| 40 to 44 Minutes | 69 (5.6%) | 2 (0.3%) |
| 45 to 59 Minutes | 113 (9.1%) | 31 (4.1%) |
| 60 to 89 Minutes | 51 (4.1%) | 7 (0.9%) |
| 90 or more Minutes | 25 (2.0%) | 31 (4.1%) |
Time of Departure to Work by Sex in Alfalfa County
The most frequent times of departure to work in Alfalfa County are 7:00 AM to 7:29 AM (202, 16.3%) for males and 7:30 AM to 7:59 AM (190, 25.1%) for females.
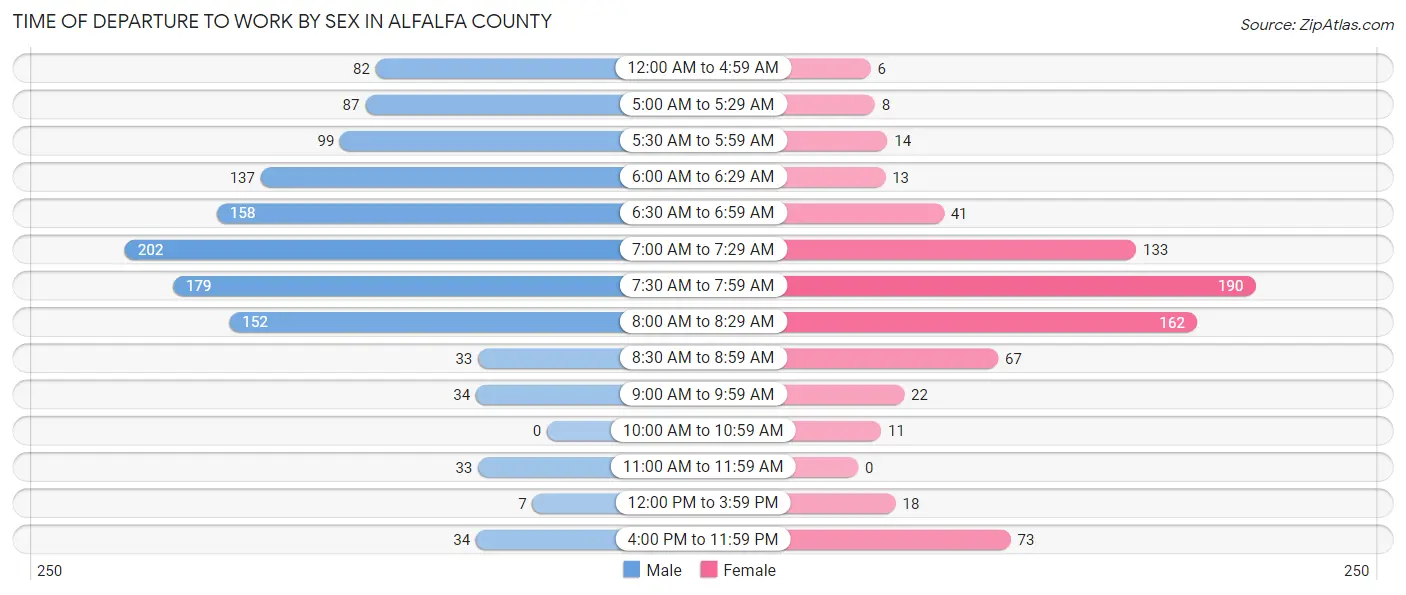
| Time of Departure | Male | Female |
| 12:00 AM to 4:59 AM | 82 (6.6%) | 6 (0.8%) |
| 5:00 AM to 5:29 AM | 87 (7.0%) | 8 (1.1%) |
| 5:30 AM to 5:59 AM | 99 (8.0%) | 14 (1.8%) |
| 6:00 AM to 6:29 AM | 137 (11.1%) | 13 (1.7%) |
| 6:30 AM to 6:59 AM | 158 (12.8%) | 41 (5.4%) |
| 7:00 AM to 7:29 AM | 202 (16.3%) | 133 (17.5%) |
| 7:30 AM to 7:59 AM | 179 (14.5%) | 190 (25.1%) |
| 8:00 AM to 8:29 AM | 152 (12.3%) | 162 (21.4%) |
| 8:30 AM to 8:59 AM | 33 (2.7%) | 67 (8.8%) |
| 9:00 AM to 9:59 AM | 34 (2.8%) | 22 (2.9%) |
| 10:00 AM to 10:59 AM | 0 (0.0%) | 11 (1.5%) |
| 11:00 AM to 11:59 AM | 33 (2.7%) | 0 (0.0%) |
| 12:00 PM to 3:59 PM | 7 (0.6%) | 18 (2.4%) |
| 4:00 PM to 11:59 PM | 34 (2.8%) | 73 (9.6%) |
| Total | 1,237 (100.0%) | 758 (100.0%) |
Housing Occupancy in Alfalfa County
Occupancy by Ownership in Alfalfa County
Of the total 1,829 dwellings in Alfalfa County, owner-occupied units account for 1,457 (79.7%), while renter-occupied units make up 372 (20.3%).
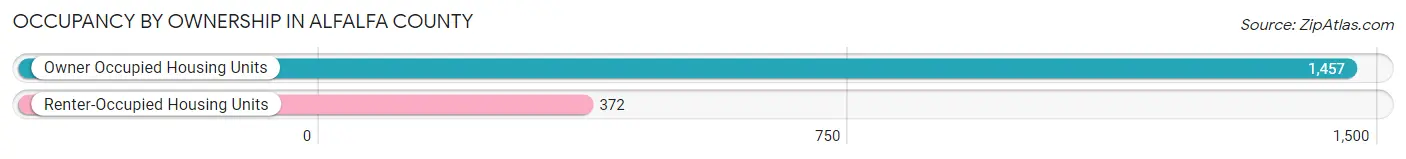
| Occupancy | # Housing Units | % Housing Units |
| Owner Occupied Housing Units | 1,457 | 79.7% |
| Renter-Occupied Housing Units | 372 | 20.3% |
| Total Occupied Housing Units | 1,829 | 100.0% |
Occupancy by Household Size in Alfalfa County
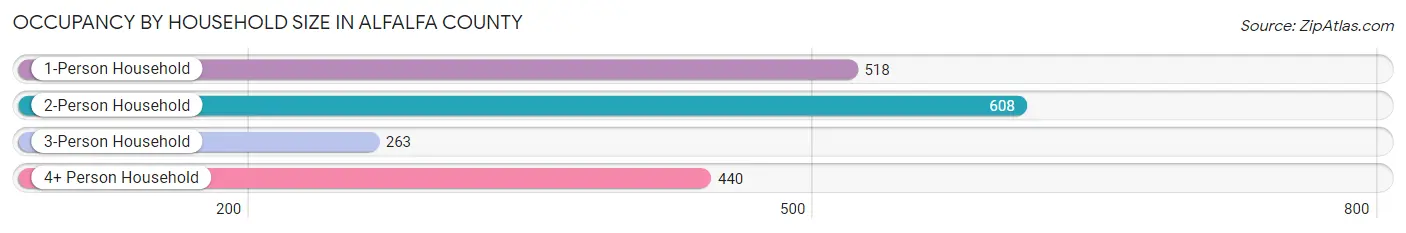
| Household Size | # Housing Units | % Housing Units |
| 1-Person Household | 518 | 28.3% |
| 2-Person Household | 608 | 33.2% |
| 3-Person Household | 263 | 14.4% |
| 4+ Person Household | 440 | 24.1% |
| Total Housing Units | 1,829 | 100.0% |
Occupancy by Ownership by Household Size in Alfalfa County
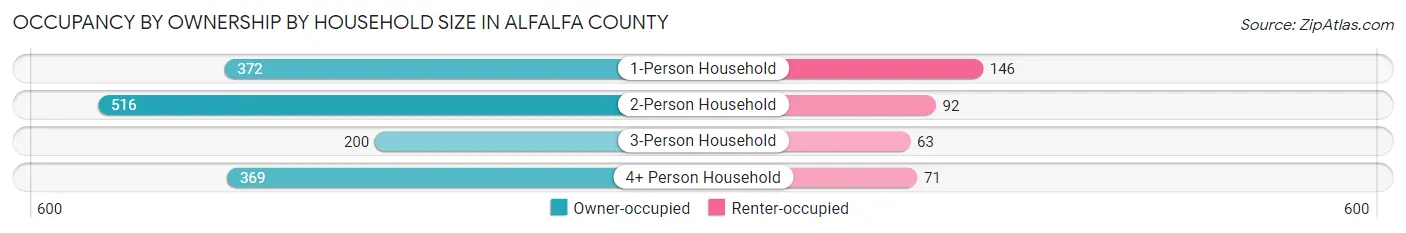
| Household Size | Owner-occupied | Renter-occupied |
| 1-Person Household | 372 (71.8%) | 146 (28.2%) |
| 2-Person Household | 516 (84.9%) | 92 (15.1%) |
| 3-Person Household | 200 (76.0%) | 63 (23.9%) |
| 4+ Person Household | 369 (83.9%) | 71 (16.1%) |
| Total Housing Units | 1,457 (79.7%) | 372 (20.3%) |
Occupancy by Educational Attainment in Alfalfa County
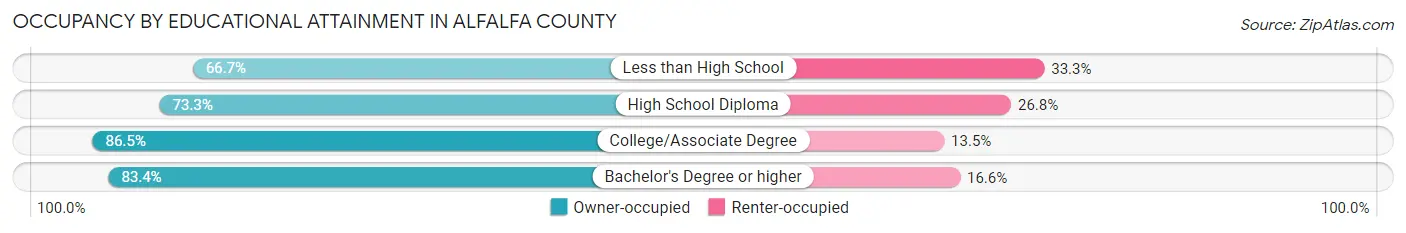
| Household Size | Owner-occupied | Renter-occupied |
| Less than High School | 86 (66.7%) | 43 (33.3%) |
| High School Diploma | 460 (73.3%) | 168 (26.8%) |
| College/Associate Degree | 475 (86.5%) | 74 (13.5%) |
| Bachelor's Degree or higher | 436 (83.4%) | 87 (16.6%) |
Occupancy by Age of Householder in Alfalfa County
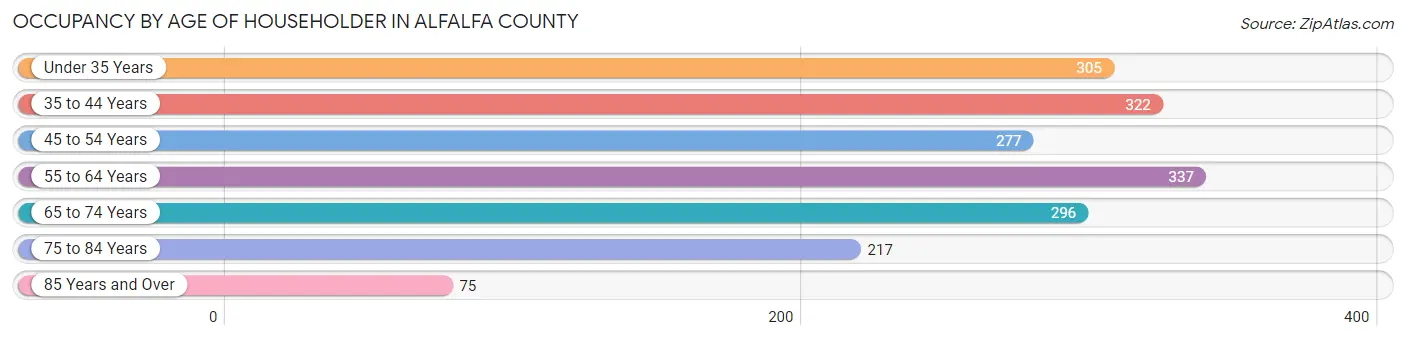
| Age Bracket | # Households | % Households |
| Under 35 Years | 305 | 16.7% |
| 35 to 44 Years | 322 | 17.6% |
| 45 to 54 Years | 277 | 15.1% |
| 55 to 64 Years | 337 | 18.4% |
| 65 to 74 Years | 296 | 16.2% |
| 75 to 84 Years | 217 | 11.9% |
| 85 Years and Over | 75 | 4.1% |
| Total | 1,829 | 100.0% |
Housing Finances in Alfalfa County
Median Income by Occupancy in Alfalfa County
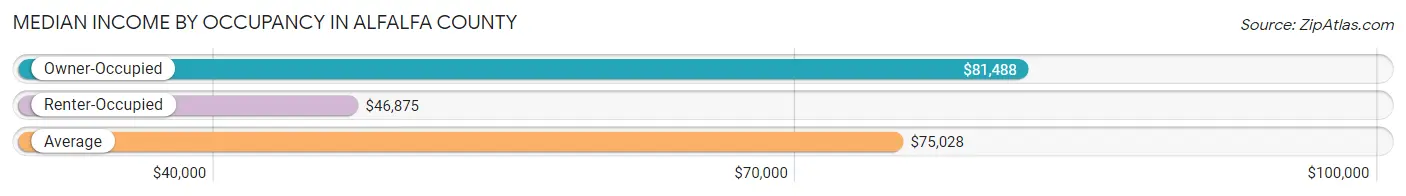
| Occupancy Type | # Households | Median Income |
| Owner-Occupied | 1,457 (79.7%) | $81,488 |
| Renter-Occupied | 372 (20.3%) | $46,875 |
| Average | 1,829 (100.0%) | $75,028 |
Occupancy by Householder Income Bracket in Alfalfa County
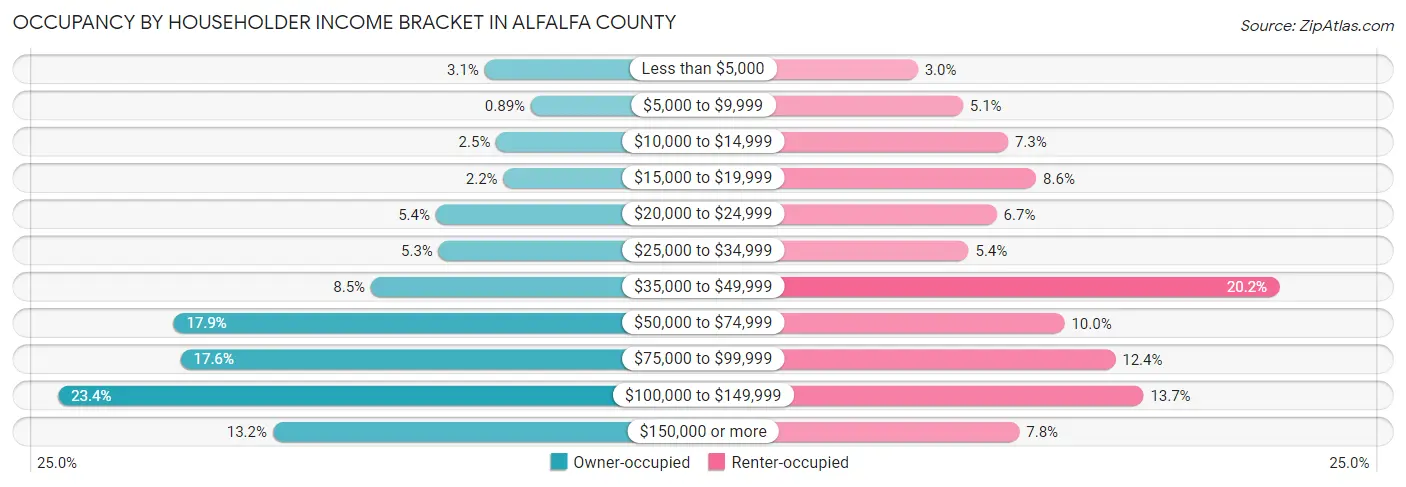
| Income Bracket | Owner-occupied | Renter-occupied |
| Less than $5,000 | 45 (3.1%) | 11 (3.0%) |
| $5,000 to $9,999 | 13 (0.9%) | 19 (5.1%) |
| $10,000 to $14,999 | 37 (2.5%) | 27 (7.3%) |
| $15,000 to $19,999 | 32 (2.2%) | 32 (8.6%) |
| $20,000 to $24,999 | 79 (5.4%) | 25 (6.7%) |
| $25,000 to $34,999 | 77 (5.3%) | 20 (5.4%) |
| $35,000 to $49,999 | 124 (8.5%) | 75 (20.2%) |
| $50,000 to $74,999 | 261 (17.9%) | 37 (10.0%) |
| $75,000 to $99,999 | 256 (17.6%) | 46 (12.4%) |
| $100,000 to $149,999 | 341 (23.4%) | 51 (13.7%) |
| $150,000 or more | 192 (13.2%) | 29 (7.8%) |
| Total | 1,457 (100.0%) | 372 (100.0%) |
Monthly Housing Cost Tiers in Alfalfa County
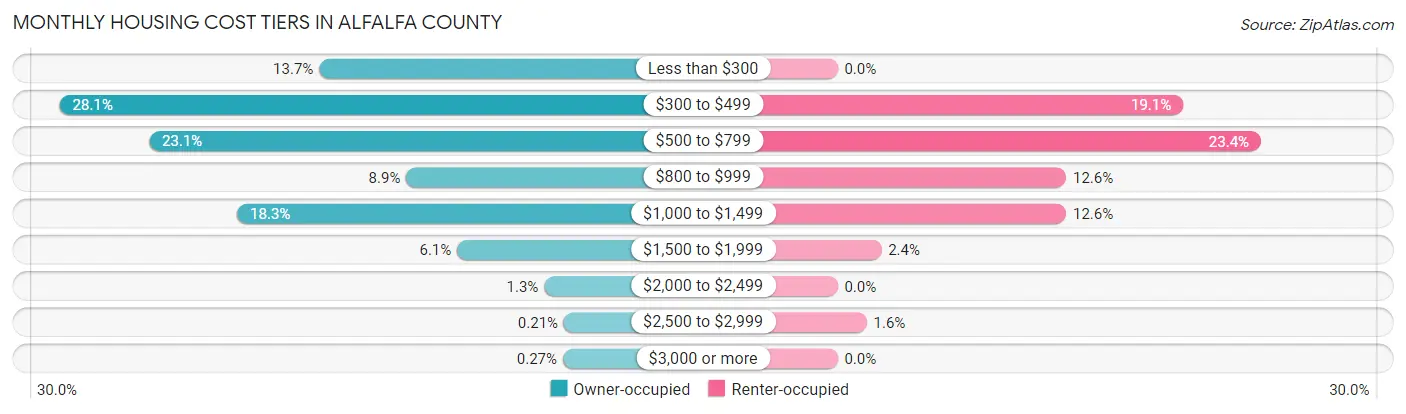
| Monthly Cost | Owner-occupied | Renter-occupied |
| Less than $300 | 200 (13.7%) | 0 (0.0%) |
| $300 to $499 | 409 (28.1%) | 71 (19.1%) |
| $500 to $799 | 337 (23.1%) | 87 (23.4%) |
| $800 to $999 | 130 (8.9%) | 47 (12.6%) |
| $1,000 to $1,499 | 266 (18.3%) | 47 (12.6%) |
| $1,500 to $1,999 | 89 (6.1%) | 9 (2.4%) |
| $2,000 to $2,499 | 19 (1.3%) | 0 (0.0%) |
| $2,500 to $2,999 | 3 (0.2%) | 6 (1.6%) |
| $3,000 or more | 4 (0.3%) | 0 (0.0%) |
| Total | 1,457 (100.0%) | 372 (100.0%) |
Physical Housing Characteristics in Alfalfa County
Housing Structures in Alfalfa County
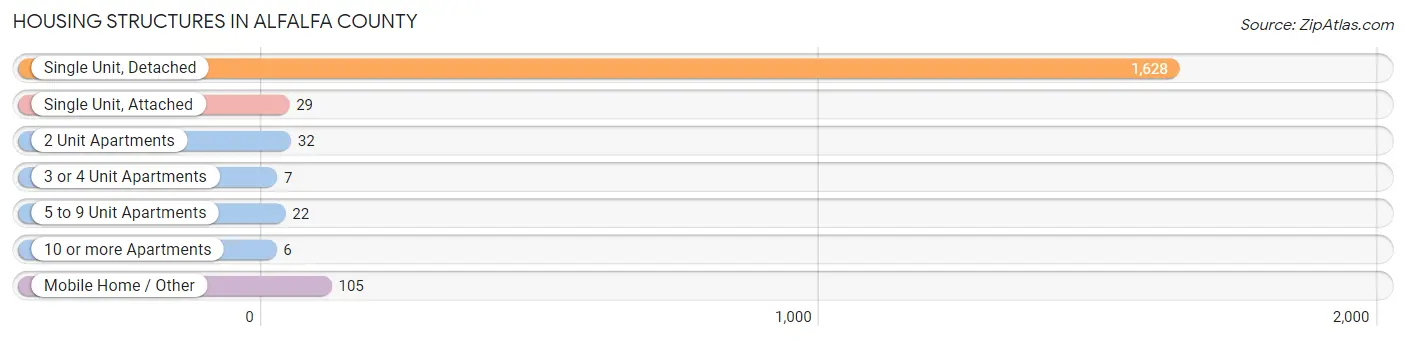
| Structure Type | # Housing Units | % Housing Units |
| Single Unit, Detached | 1,628 | 89.0% |
| Single Unit, Attached | 29 | 1.6% |
| 2 Unit Apartments | 32 | 1.8% |
| 3 or 4 Unit Apartments | 7 | 0.4% |
| 5 to 9 Unit Apartments | 22 | 1.2% |
| 10 or more Apartments | 6 | 0.3% |
| Mobile Home / Other | 105 | 5.7% |
| Total | 1,829 | 100.0% |
Housing Structures by Occupancy in Alfalfa County
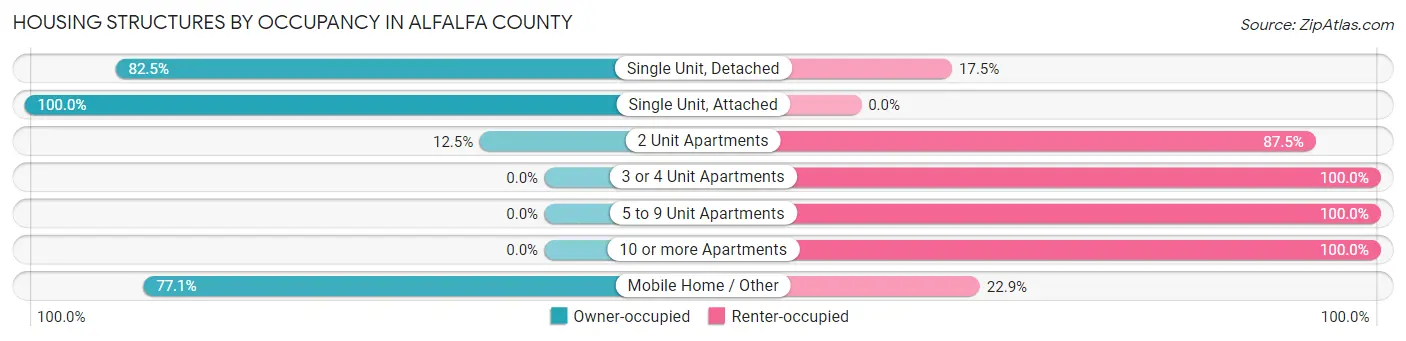
| Structure Type | Owner-occupied | Renter-occupied |
| Single Unit, Detached | 1,343 (82.5%) | 285 (17.5%) |
| Single Unit, Attached | 29 (100.0%) | 0 (0.0%) |
| 2 Unit Apartments | 4 (12.5%) | 28 (87.5%) |
| 3 or 4 Unit Apartments | 0 (0.0%) | 7 (100.0%) |
| 5 to 9 Unit Apartments | 0 (0.0%) | 22 (100.0%) |
| 10 or more Apartments | 0 (0.0%) | 6 (100.0%) |
| Mobile Home / Other | 81 (77.1%) | 24 (22.9%) |
| Total | 1,457 (79.7%) | 372 (20.3%) |
Housing Structures by Number of Rooms in Alfalfa County
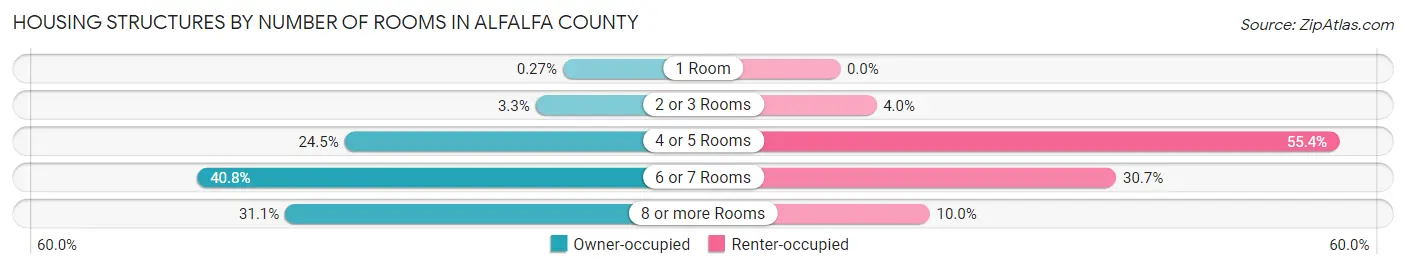
| Number of Rooms | Owner-occupied | Renter-occupied |
| 1 Room | 4 (0.3%) | 0 (0.0%) |
| 2 or 3 Rooms | 48 (3.3%) | 15 (4.0%) |
| 4 or 5 Rooms | 357 (24.5%) | 206 (55.4%) |
| 6 or 7 Rooms | 595 (40.8%) | 114 (30.6%) |
| 8 or more Rooms | 453 (31.1%) | 37 (10.0%) |
| Total | 1,457 (100.0%) | 372 (100.0%) |
Housing Structure by Heating Type in Alfalfa County
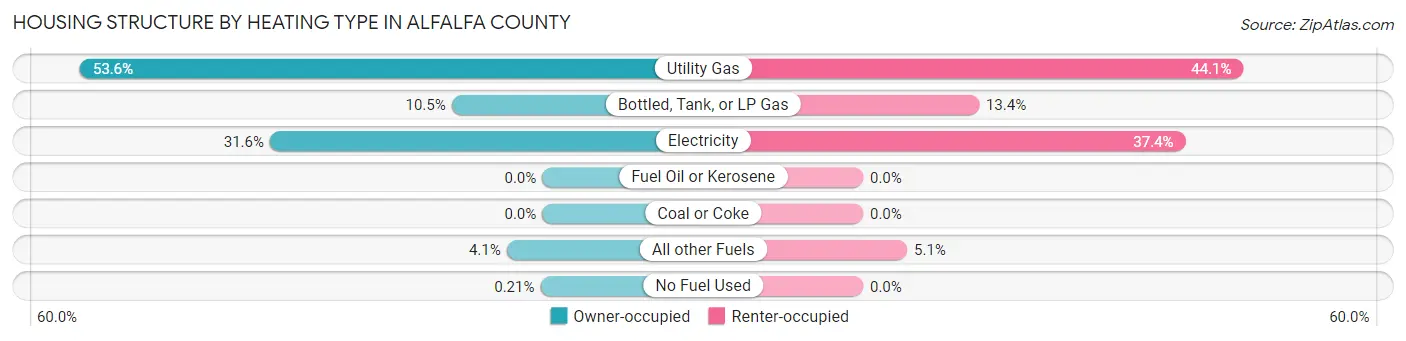
| Heating Type | Owner-occupied | Renter-occupied |
| Utility Gas | 781 (53.6%) | 164 (44.1%) |
| Bottled, Tank, or LP Gas | 153 (10.5%) | 50 (13.4%) |
| Electricity | 460 (31.6%) | 139 (37.4%) |
| Fuel Oil or Kerosene | 0 (0.0%) | 0 (0.0%) |
| Coal or Coke | 0 (0.0%) | 0 (0.0%) |
| All other Fuels | 60 (4.1%) | 19 (5.1%) |
| No Fuel Used | 3 (0.2%) | 0 (0.0%) |
| Total | 1,457 (100.0%) | 372 (100.0%) |
Household Vehicle Usage in Alfalfa County
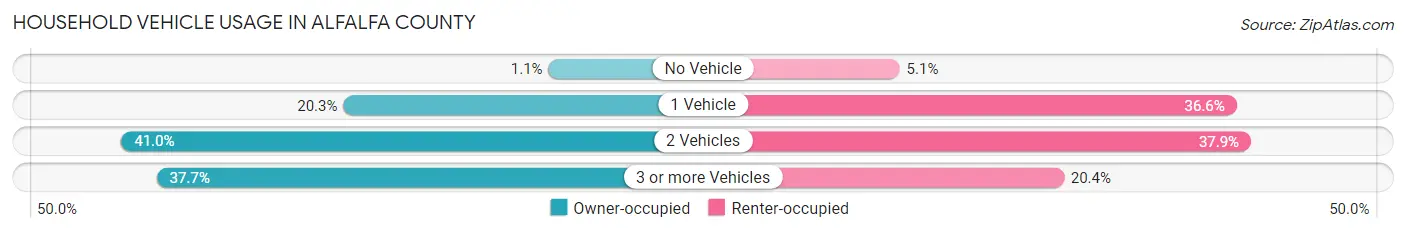
| Vehicles per Household | Owner-occupied | Renter-occupied |
| No Vehicle | 16 (1.1%) | 19 (5.1%) |
| 1 Vehicle | 295 (20.3%) | 136 (36.6%) |
| 2 Vehicles | 597 (41.0%) | 141 (37.9%) |
| 3 or more Vehicles | 549 (37.7%) | 76 (20.4%) |
| Total | 1,457 (100.0%) | 372 (100.0%) |
Real Estate & Mortgages in Alfalfa County
Real Estate and Mortgage Overview in Alfalfa County
| Characteristic | Without Mortgage | With Mortgage |
| Housing Units | 860 | 597 |
| Median Property Value | $79,600 | $124,100 |
| Median Household Income | $60,441 | $103 |
| Monthly Housing Costs | $416 | $4 |
| Real Estate Taxes | $558 | $22 |
Property Value by Mortgage Status in Alfalfa County
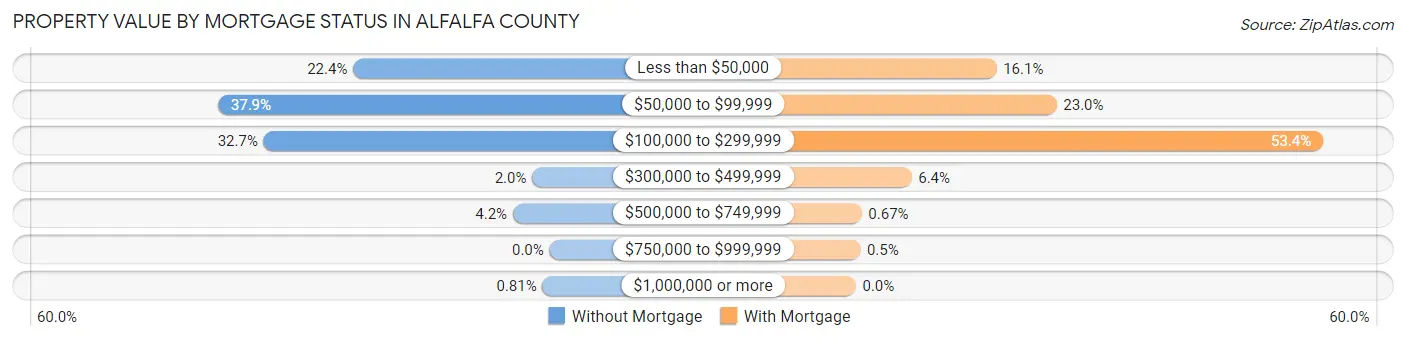
| Property Value | Without Mortgage | With Mortgage |
| Less than $50,000 | 193 (22.4%) | 96 (16.1%) |
| $50,000 to $99,999 | 326 (37.9%) | 137 (23.0%) |
| $100,000 to $299,999 | 281 (32.7%) | 319 (53.4%) |
| $300,000 to $499,999 | 17 (2.0%) | 38 (6.4%) |
| $500,000 to $749,999 | 36 (4.2%) | 4 (0.7%) |
| $750,000 to $999,999 | 0 (0.0%) | 3 (0.5%) |
| $1,000,000 or more | 7 (0.8%) | 0 (0.0%) |
| Total | 860 (100.0%) | 597 (100.0%) |
Household Income by Mortgage Status in Alfalfa County
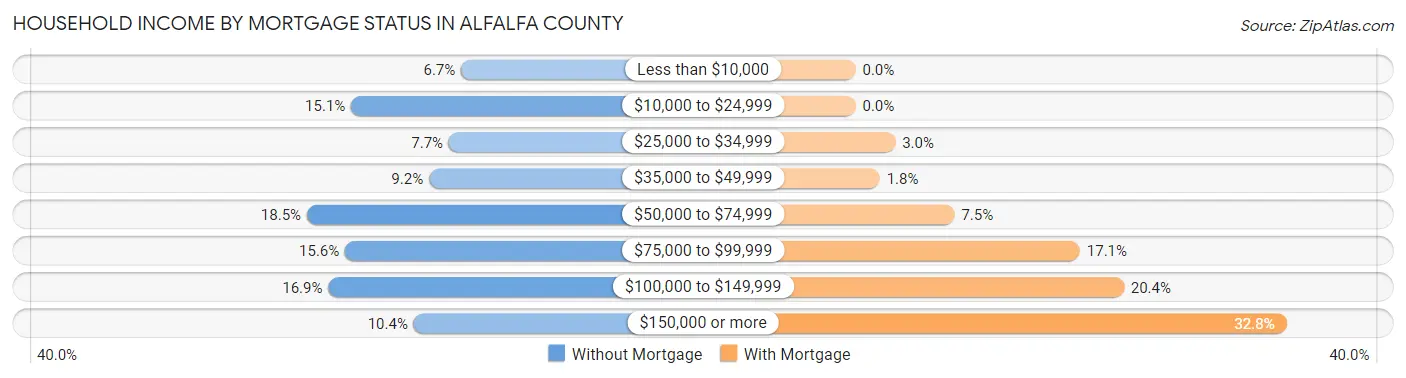
| Household Income | Without Mortgage | With Mortgage |
| Less than $10,000 | 58 (6.7%) | 0 (0.0%) |
| $10,000 to $24,999 | 130 (15.1%) | 0 (0.0%) |
| $25,000 to $34,999 | 66 (7.7%) | 18 (3.0%) |
| $35,000 to $49,999 | 79 (9.2%) | 11 (1.8%) |
| $50,000 to $74,999 | 159 (18.5%) | 45 (7.5%) |
| $75,000 to $99,999 | 134 (15.6%) | 102 (17.1%) |
| $100,000 to $149,999 | 145 (16.9%) | 122 (20.4%) |
| $150,000 or more | 89 (10.3%) | 196 (32.8%) |
| Total | 860 (100.0%) | 597 (100.0%) |
Property Value to Household Income Ratio in Alfalfa County
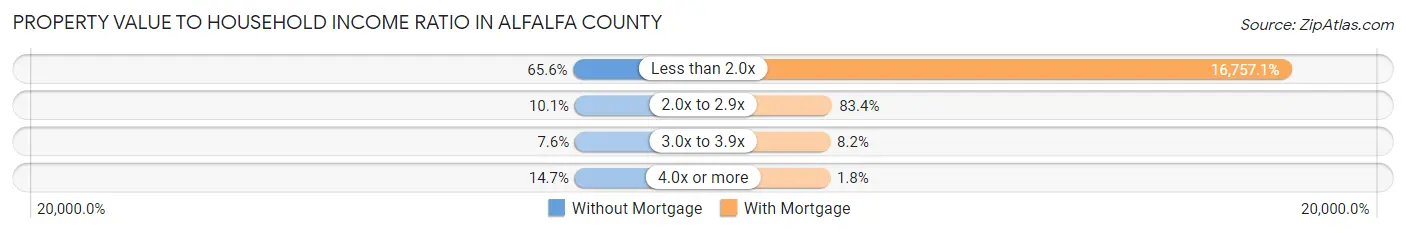
| Value-to-Income Ratio | Without Mortgage | With Mortgage |
| Less than 2.0x | 564 (65.6%) | 100,040 (16,757.1%) |
| 2.0x to 2.9x | 87 (10.1%) | 498 (83.4%) |
| 3.0x to 3.9x | 65 (7.6%) | 49 (8.2%) |
| 4.0x or more | 126 (14.6%) | 11 (1.8%) |
| Total | 860 (100.0%) | 597 (100.0%) |
Real Estate Taxes by Mortgage Status in Alfalfa County
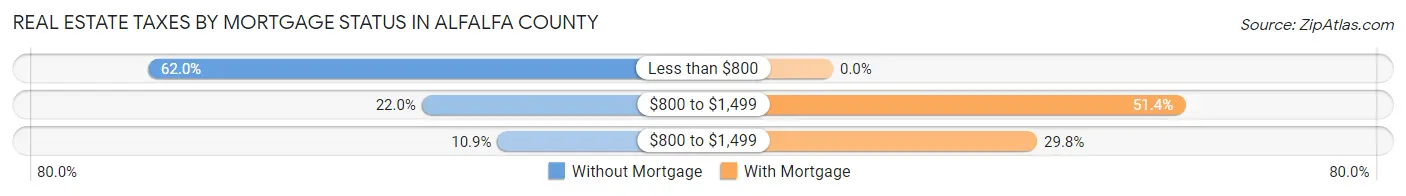
| Property Taxes | Without Mortgage | With Mortgage |
| Less than $800 | 533 (62.0%) | 0 (0.0%) |
| $800 to $1,499 | 189 (22.0%) | 307 (51.4%) |
| $800 to $1,499 | 94 (10.9%) | 178 (29.8%) |
| Total | 860 (100.0%) | 597 (100.0%) |
Health & Disability in Alfalfa County
Health Insurance Coverage by Age in Alfalfa County
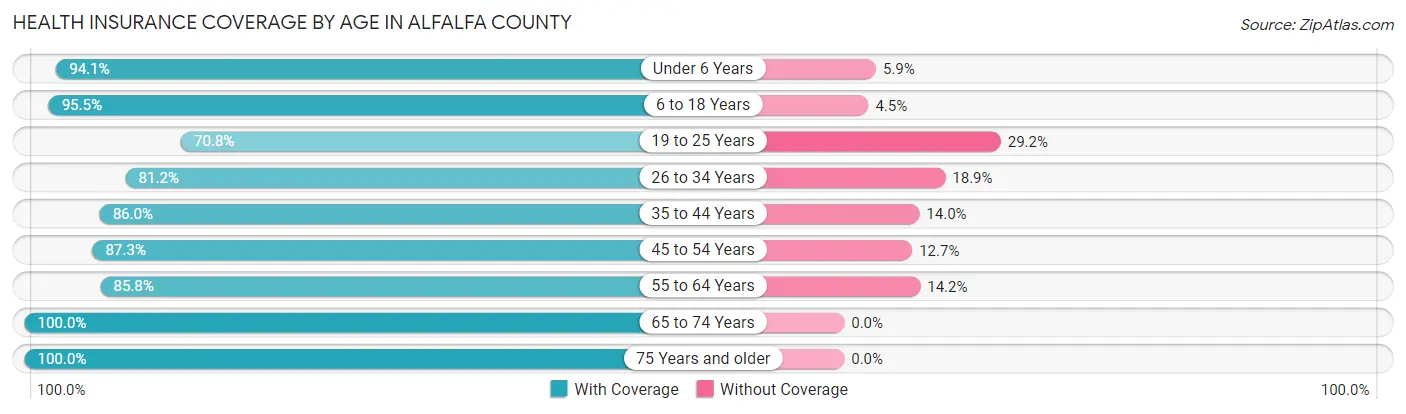
| Age Bracket | With Coverage | Without Coverage |
| Under 6 Years | 302 (94.1%) | 19 (5.9%) |
| 6 to 18 Years | 783 (95.5%) | 37 (4.5%) |
| 19 to 25 Years | 211 (70.8%) | 87 (29.2%) |
| 26 to 34 Years | 422 (81.1%) | 98 (18.9%) |
| 35 to 44 Years | 491 (86.0%) | 80 (14.0%) |
| 45 to 54 Years | 455 (87.3%) | 66 (12.7%) |
| 55 to 64 Years | 509 (85.8%) | 84 (14.2%) |
| 65 to 74 Years | 484 (100.0%) | 0 (0.0%) |
| 75 Years and older | 418 (100.0%) | 0 (0.0%) |
| Total | 4,075 (89.6%) | 471 (10.4%) |
Health Insurance Coverage by Citizenship Status in Alfalfa County
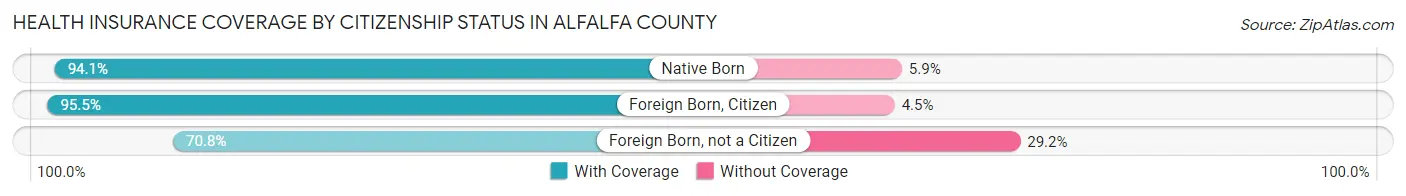
| Citizenship Status | With Coverage | Without Coverage |
| Native Born | 302 (94.1%) | 19 (5.9%) |
| Foreign Born, Citizen | 783 (95.5%) | 37 (4.5%) |
| Foreign Born, not a Citizen | 211 (70.8%) | 87 (29.2%) |
Health Insurance Coverage by Household Income in Alfalfa County
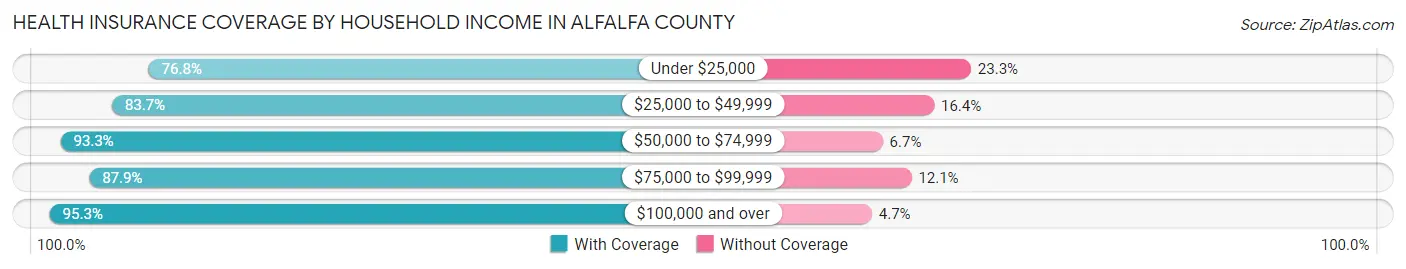
| Household Income | With Coverage | Without Coverage |
| Under $25,000 | 373 (76.7%) | 113 (23.3%) |
| $25,000 to $49,999 | 655 (83.7%) | 128 (16.4%) |
| $50,000 to $74,999 | 680 (93.3%) | 49 (6.7%) |
| $75,000 to $99,999 | 704 (87.9%) | 97 (12.1%) |
| $100,000 and over | 1,661 (95.3%) | 82 (4.7%) |
Public vs Private Health Insurance Coverage by Age in Alfalfa County
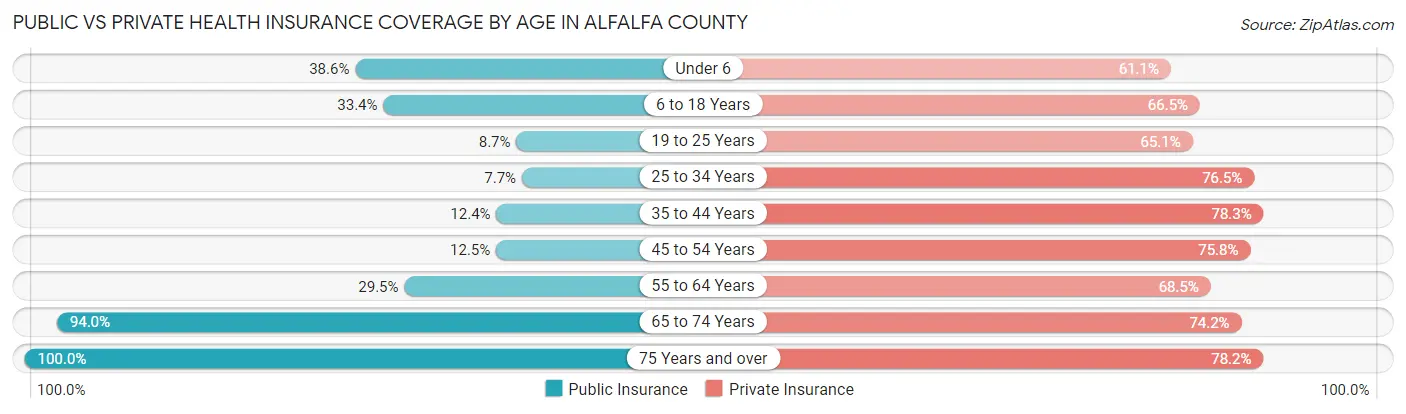
| Age Bracket | Public Insurance | Private Insurance |
| Under 6 | 124 (38.6%) | 196 (61.1%) |
| 6 to 18 Years | 274 (33.4%) | 545 (66.5%) |
| 19 to 25 Years | 26 (8.7%) | 194 (65.1%) |
| 25 to 34 Years | 40 (7.7%) | 398 (76.5%) |
| 35 to 44 Years | 71 (12.4%) | 447 (78.3%) |
| 45 to 54 Years | 65 (12.5%) | 395 (75.8%) |
| 55 to 64 Years | 175 (29.5%) | 406 (68.5%) |
| 65 to 74 Years | 455 (94.0%) | 359 (74.2%) |
| 75 Years and over | 418 (100.0%) | 327 (78.2%) |
| Total | 1,648 (36.2%) | 3,267 (71.9%) |
Disability Status by Sex by Age in Alfalfa County
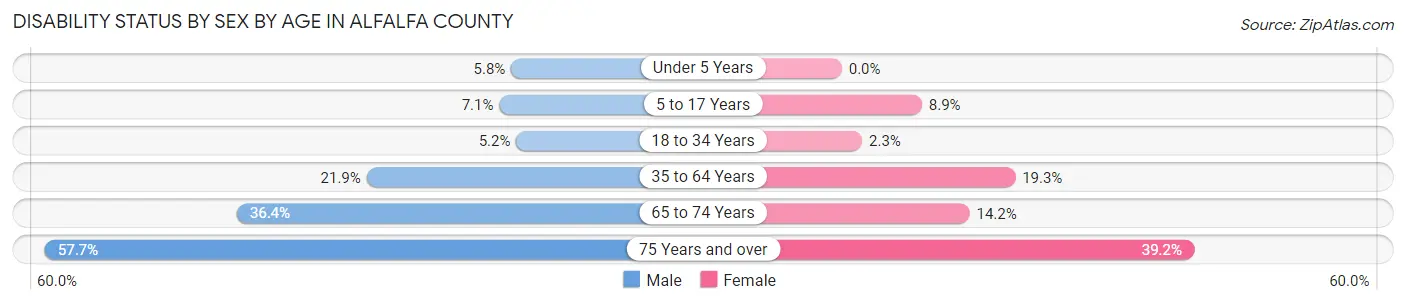
| Age Bracket | Male | Female |
| Under 5 Years | 9 (5.8%) | 0 (0.0%) |
| 5 to 17 Years | 32 (7.1%) | 37 (8.9%) |
| 18 to 34 Years | 23 (5.2%) | 9 (2.3%) |
| 35 to 64 Years | 216 (21.9%) | 135 (19.3%) |
| 65 to 74 Years | 84 (36.4%) | 36 (14.2%) |
| 75 Years and over | 97 (57.7%) | 98 (39.2%) |
Disability Class by Sex by Age in Alfalfa County
Disability Class: Hearing Difficulty
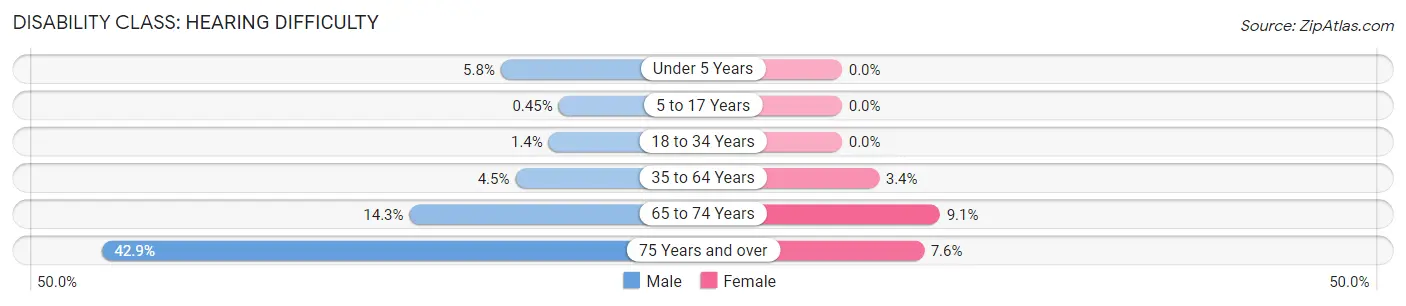
| Age Bracket | Male | Female |
| Under 5 Years | 9 (5.8%) | 0 (0.0%) |
| 5 to 17 Years | 2 (0.4%) | 0 (0.0%) |
| 18 to 34 Years | 6 (1.4%) | 0 (0.0%) |
| 35 to 64 Years | 44 (4.5%) | 24 (3.4%) |
| 65 to 74 Years | 33 (14.3%) | 23 (9.1%) |
| 75 Years and over | 72 (42.9%) | 19 (7.6%) |
Disability Class: Vision Difficulty
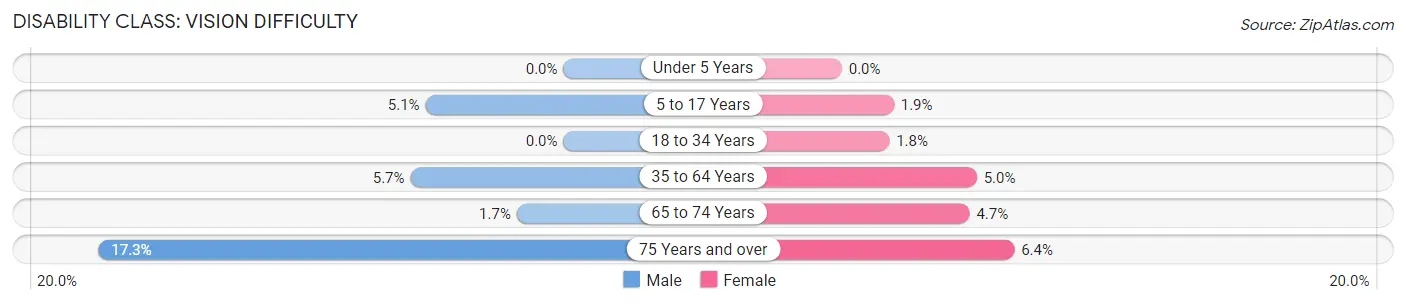
| Age Bracket | Male | Female |
| Under 5 Years | 0 (0.0%) | 0 (0.0%) |
| 5 to 17 Years | 23 (5.1%) | 8 (1.9%) |
| 18 to 34 Years | 0 (0.0%) | 7 (1.8%) |
| 35 to 64 Years | 56 (5.7%) | 35 (5.0%) |
| 65 to 74 Years | 4 (1.7%) | 12 (4.7%) |
| 75 Years and over | 29 (17.3%) | 16 (6.4%) |
Disability Class: Cognitive Difficulty
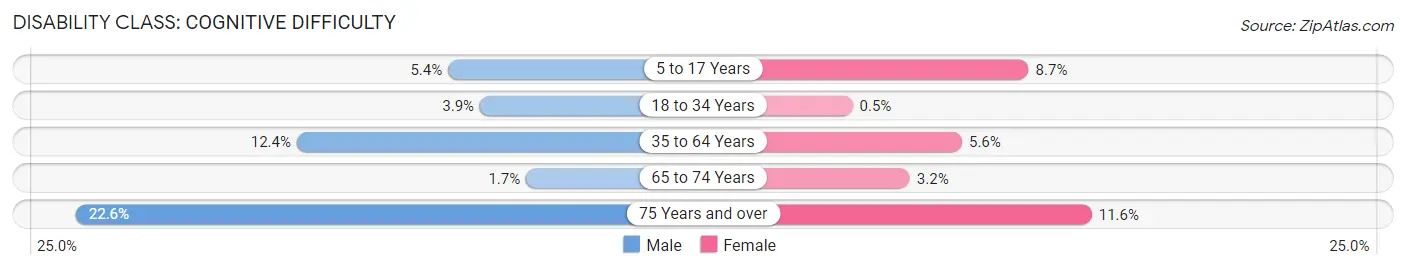
| Age Bracket | Male | Female |
| 5 to 17 Years | 24 (5.3%) | 36 (8.7%) |
| 18 to 34 Years | 17 (3.9%) | 2 (0.5%) |
| 35 to 64 Years | 122 (12.4%) | 39 (5.6%) |
| 65 to 74 Years | 4 (1.7%) | 8 (3.2%) |
| 75 Years and over | 38 (22.6%) | 29 (11.6%) |
Disability Class: Ambulatory Difficulty
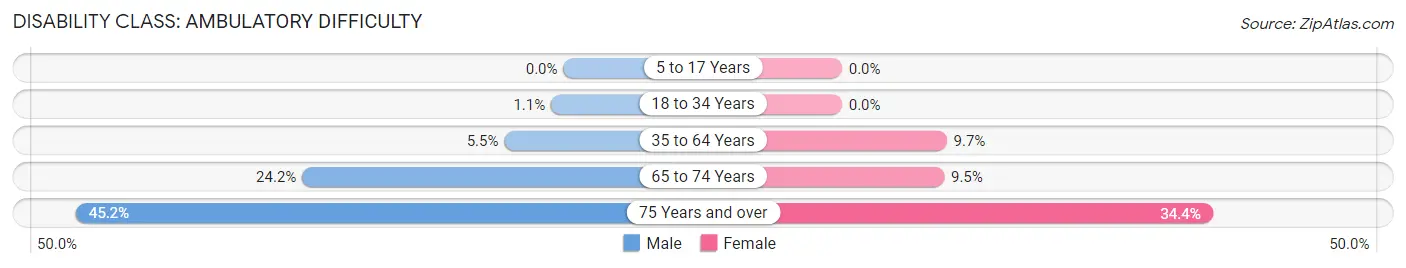
| Age Bracket | Male | Female |
| 5 to 17 Years | 0 (0.0%) | 0 (0.0%) |
| 18 to 34 Years | 5 (1.1%) | 0 (0.0%) |
| 35 to 64 Years | 54 (5.5%) | 68 (9.7%) |
| 65 to 74 Years | 56 (24.2%) | 24 (9.5%) |
| 75 Years and over | 76 (45.2%) | 86 (34.4%) |
Disability Class: Self-Care Difficulty
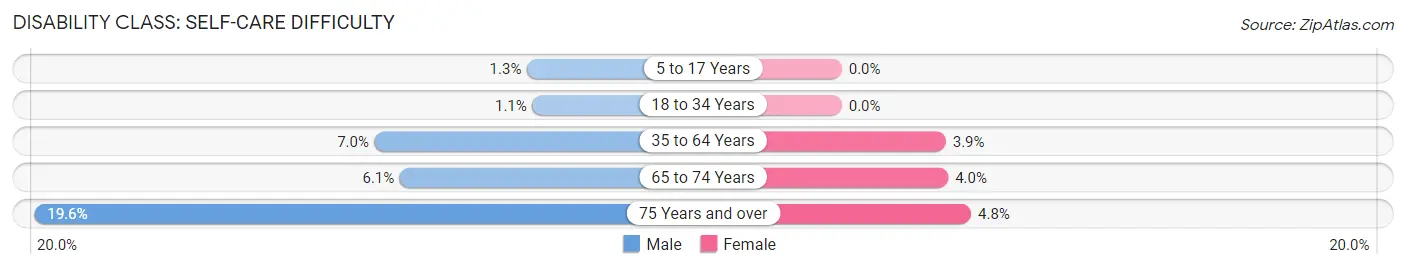
| Age Bracket | Male | Female |
| 5 to 17 Years | 6 (1.3%) | 0 (0.0%) |
| 18 to 34 Years | 5 (1.1%) | 0 (0.0%) |
| 35 to 64 Years | 69 (7.0%) | 27 (3.9%) |
| 65 to 74 Years | 14 (6.1%) | 10 (4.0%) |
| 75 Years and over | 33 (19.6%) | 12 (4.8%) |
Technology Access in Alfalfa County
Computing Device Access in Alfalfa County
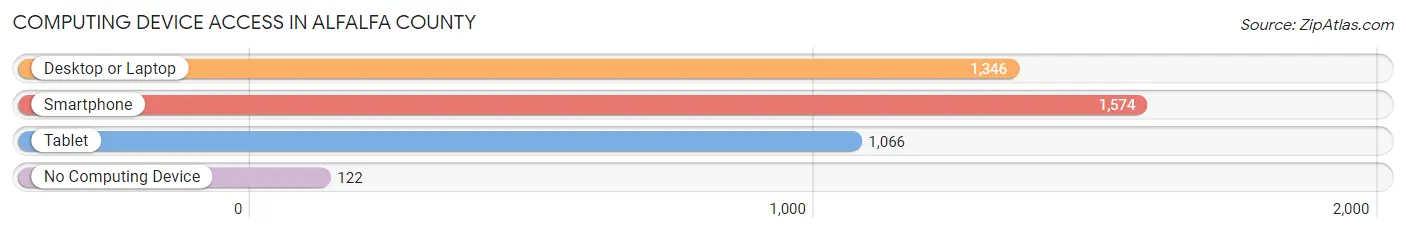
| Device Type | # Households | % Households |
| Desktop or Laptop | 1,346 | 73.6% |
| Smartphone | 1,574 | 86.1% |
| Tablet | 1,066 | 58.3% |
| No Computing Device | 122 | 6.7% |
| Total | 1,829 | 100.0% |
Internet Access in Alfalfa County
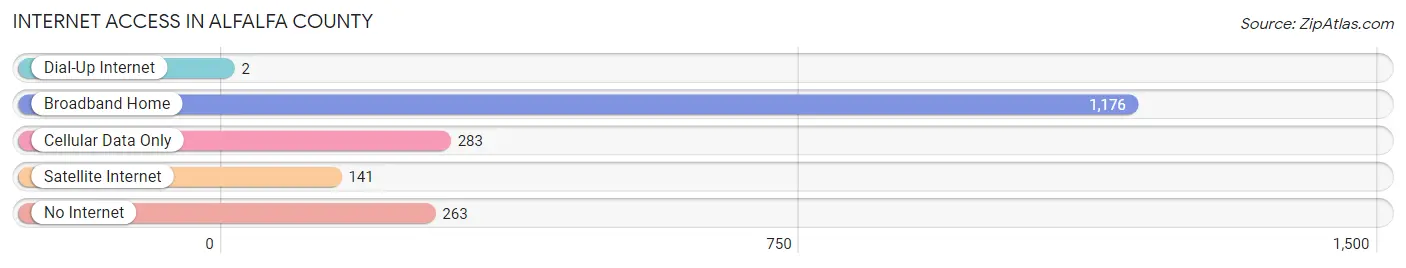
| Internet Type | # Households | % Households |
| Dial-Up Internet | 2 | 0.1% |
| Broadband Home | 1,176 | 64.3% |
| Cellular Data Only | 283 | 15.5% |
| Satellite Internet | 141 | 7.7% |
| No Internet | 263 | 14.4% |
| Total | 1,829 | 100.0% |
Alfalfa County Summary
Alfalfa County is located in the northwestern part of Oklahoma, and is bordered by Woods County to the north, Major County to the east, Grant County to the south, and Harper County to the west. The county seat is Cherokee, and the largest city is Alva. The county was named for the alfalfa that was grown in the area.
Geography
Alfalfa County covers an area of 890 square miles, and is located in the Osage Plains region of Oklahoma. The terrain is mostly flat, with some rolling hills in the northern part of the county. The county is drained by the Salt Fork of the Arkansas River, which flows through the center of the county. The county is also home to several small lakes, including Lake Alva, Lake Cherokee, and Lake Laverne.
The climate of Alfalfa County is characterized by hot, humid summers and cold, dry winters. The average annual temperature is around 60°F, and the average annual precipitation is around 30 inches.
Demographics
As of the 2010 census, there were 5,642 people, 2,093 households, and 1,521 families living in Alfalfa County. The population density was 6.3 people per square mile. The racial makeup of the county was 94.2% White, 0.7% African American, 1.2% Native American, 0.2% Asian, 0.1% Pacific Islander, 1.3% from other races, and 2.4% from two or more races. Hispanic or Latino of any race were 3.2% of the population.
The median income for a household in Alfalfa County was $35,938, and the median income for a family was $41,944. The per capita income for the county was $17,845. About 13.2% of families and 16.2% of the population were below the poverty line, including 22.2% of those under age 18 and 11.2% of those age 65 or over.
Economy
The economy of Alfalfa County is largely based on agriculture. The county is home to several large farms, and the main crops grown in the area are wheat, corn, and soybeans. The county is also home to several oil and gas wells, and the oil and gas industry is a major contributor to the local economy.
In addition to agriculture and oil and gas, Alfalfa County is home to several small businesses, including restaurants, retail stores, and service providers. The county is also home to several manufacturing companies, including a furniture factory and a plastics factory.
History
Alfalfa County was created in 1907 from parts of Woods and Major counties. The county was named for the alfalfa that was grown in the area. The county seat was originally located in the town of Cherokee, but was moved to Alva in 1911.
In the early 20th century, Alfalfa County was home to several large farms, and the main crops grown in the area were wheat, corn, and soybeans. The county was also home to several oil and gas wells, and the oil and gas industry was a major contributor to the local economy.
In the late 20th century, Alfalfa County experienced a population boom, as people moved to the area from other parts of the state. The county is now home to several small businesses, including restaurants, retail stores, and service providers. The county is also home to several manufacturing companies, including a furniture factory and a plastics factory.
Common Questions
What is Per Capita Income in Alfalfa County?
Per Capita income in Alfalfa County is $28,976.
What is the Median Family Income in Alfalfa County?
Median Family Income in Alfalfa County is $89,609.
What is the Median Household income in Alfalfa County?
Median Household Income in Alfalfa County is $75,028.
What is Income or Wage Gap in Alfalfa County?
Income or Wage Gap in Alfalfa County is 30.9%.
Women in Alfalfa County earn 69.1 cents for every dollar earned by a man.
What is Inequality or Gini Index in Alfalfa County?
Inequality or Gini Index in Alfalfa County is 0.39.
What is the Total Population of Alfalfa County?
Total Population of Alfalfa County is 5,683.
What is the Total Male Population of Alfalfa County?
Total Male Population of Alfalfa County is 3,547.
What is the Total Female Population of Alfalfa County?
Total Female Population of Alfalfa County is 2,136.
What is the Ratio of Males per 100 Females in Alfalfa County?
There are 166.06 Males per 100 Females in Alfalfa County.
What is the Ratio of Females per 100 Males in Alfalfa County?
There are 60.22 Females per 100 Males in Alfalfa County.
What is the Median Population Age in Alfalfa County?
Median Population Age in Alfalfa County is 43.6 Years.
What is the Average Family Size in Alfalfa County
Average Family Size in Alfalfa County is 3.0 People.
What is the Average Household Size in Alfalfa County
Average Household Size in Alfalfa County is 2.5 People.
How Large is the Labor Force in Alfalfa County?
There are 2,204 People in the Labor Forcein in Alfalfa County.
What is the Percentage of People in the Labor Force in Alfalfa County?
47.5% of People are in the Labor Force in Alfalfa County.
What is the Unemployment Rate in Alfalfa County?
Unemployment Rate in Alfalfa County is 4.0%.