Zip Codes with the Highest Percentage of Population with a Degree in Arts and Humanities in New York
RELATED REPORTS & OPTIONS
Arts and Humanities
New York
Compare Zip Codes
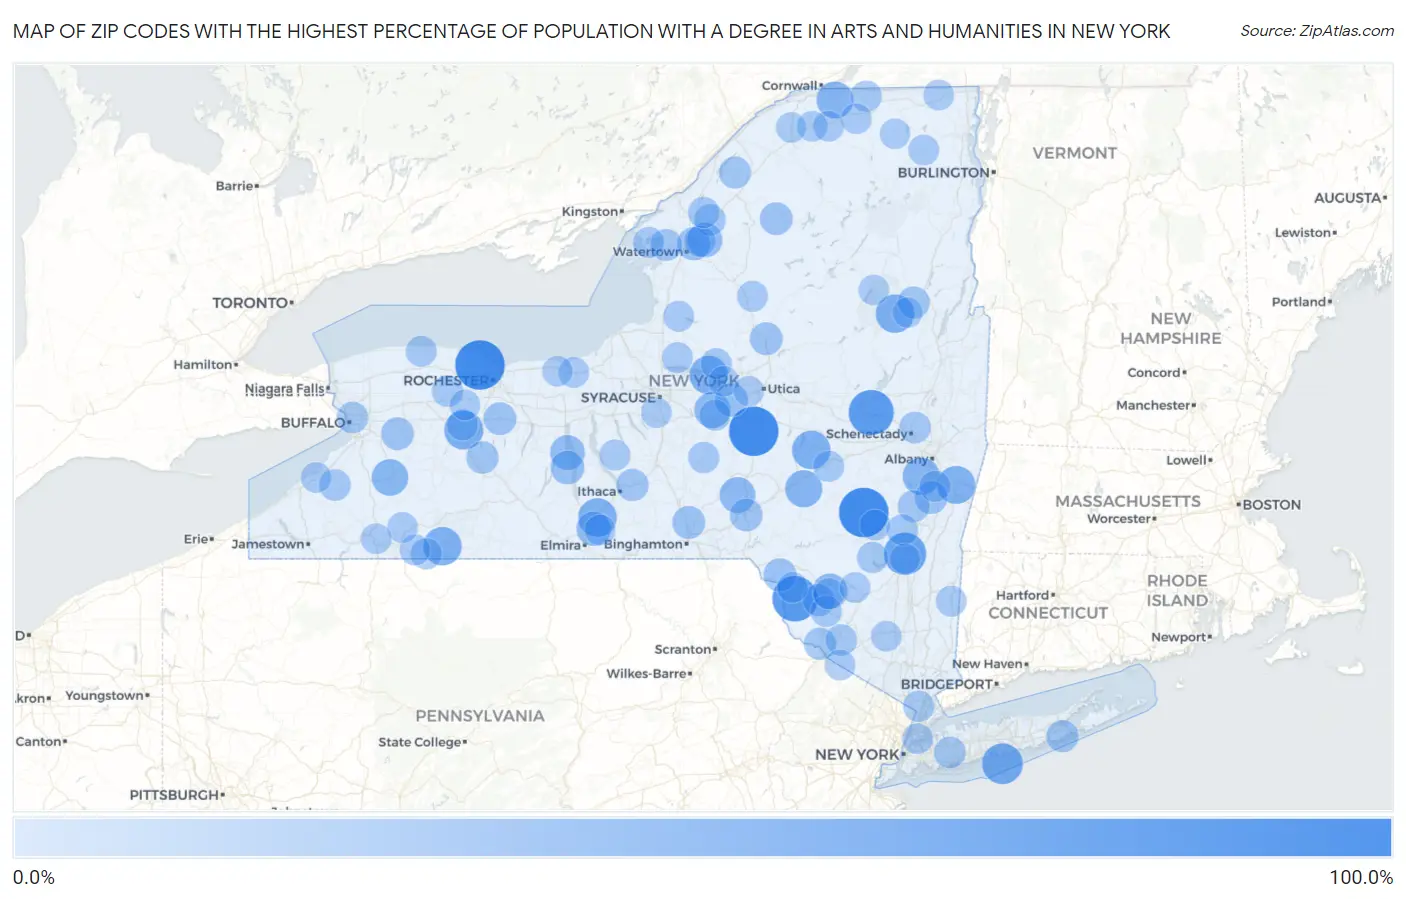
Map of Zip Codes with the Highest Percentage of Population with a Degree in Arts and Humanities in New York
0.0%
100.0%
Zip Codes with the Highest Percentage of Population with a Degree in Arts and Humanities in New York
| Zip Code | % Graduates | vs State | vs National | |
| 1. | 13314 | 100.0% | 4.8%(+95.2)#1 | 6.0%(+94.0)#50 |
| 2. | 14515 | 100.0% | 4.8%(+95.2)#2 | 6.0%(+94.0)#55 |
| 3. | 12407 | 100.0% | 4.8%(+95.2)#3 | 6.0%(+94.0)#57 |
| 4. | 12750 | 81.0% | 4.8%(+76.2)#4 | 6.0%(+75.0)#99 |
| 5. | 12177 | 80.0% | 4.8%(+75.2)#5 | 6.0%(+74.0)#100 |
| 6. | 12456 | 67.2% | 4.8%(+62.4)#6 | 6.0%(+61.2)#127 |
| 7. | 11770 | 60.0% | 4.8%(+55.2)#7 | 6.0%(+54.0)#161 |
| 8. | 14539 | 52.6% | 4.8%(+47.8)#8 | 6.0%(+46.6)#190 |
| 9. | 14824 | 50.6% | 4.8%(+45.8)#9 | 6.0%(+44.6)#199 |
| 10. | 13162 | 50.0% | 4.8%(+45.2)#10 | 6.0%(+44.0)#210 |
| 11. | 13450 | 50.0% | 4.8%(+45.2)#11 | 6.0%(+44.0)#222 |
| 12. | 12811 | 50.0% | 4.8%(+45.2)#12 | 6.0%(+44.0)#225 |
| 13. | 14707 | 50.0% | 4.8%(+45.2)#13 | 6.0%(+44.0)#233 |
| 14. | 12024 | 48.3% | 4.8%(+43.5)#14 | 6.0%(+42.3)#248 |
| 15. | 12161 | 44.4% | 4.8%(+39.6)#15 | 6.0%(+38.4)#283 |
| 16. | 13751 | 44.3% | 4.8%(+39.5)#16 | 6.0%(+38.3)#284 |
| 17. | 12914 | 42.9% | 4.8%(+38.1)#17 | 6.0%(+36.9)#300 |
| 18. | 14134 | 41.7% | 4.8%(+36.9)#18 | 6.0%(+35.7)#323 |
| 19. | 13134 | 40.0% | 4.8%(+35.2)#19 | 6.0%(+34.0)#346 |
| 20. | 13780 | 38.0% | 4.8%(+33.2)#20 | 6.0%(+32.0)#394 |
| 21. | 12759 | 36.2% | 4.8%(+31.4)#21 | 6.0%(+30.2)#443 |
| 22. | 14441 | 34.0% | 4.8%(+29.2)#22 | 6.0%(+28.0)#496 |
| 23. | 13602 | 33.3% | 4.8%(+28.5)#23 | 6.0%(+27.3)#509 |
| 24. | 14816 | 32.7% | 4.8%(+27.9)#24 | 6.0%(+26.7)#552 |
| 25. | 14842 | 29.0% | 4.8%(+24.2)#25 | 6.0%(+23.0)#708 |
| 26. | 13477 | 27.7% | 4.8%(+22.9)#26 | 6.0%(+21.7)#782 |
| 27. | 13616 | 26.7% | 4.8%(+21.9)#27 | 6.0%(+20.7)#836 |
| 28. | 12760 | 26.4% | 4.8%(+21.6)#28 | 6.0%(+20.4)#862 |
| 29. | 13744 | 25.7% | 4.8%(+20.9)#29 | 6.0%(+19.7)#905 |
| 30. | 13301 | 25.6% | 4.8%(+20.8)#30 | 6.0%(+19.6)#913 |
| 31. | 12173 | 25.3% | 4.8%(+20.5)#31 | 6.0%(+19.3)#933 |
| 32. | 14037 | 25.0% | 4.8%(+20.2)#32 | 6.0%(+19.0)#951 |
| 33. | 13670 | 25.0% | 4.8%(+20.2)#33 | 6.0%(+19.0)#963 |
| 34. | 14585 | 25.0% | 4.8%(+20.2)#34 | 6.0%(+19.0)#975 |
| 35. | 13838 | 24.9% | 4.8%(+20.1)#35 | 6.0%(+18.9)#987 |
| 36. | 12734 | 23.1% | 4.8%(+18.3)#36 | 6.0%(+17.1)#1,103 |
| 37. | 14545 | 23.1% | 4.8%(+18.3)#37 | 6.0%(+17.1)#1,109 |
| 38. | 13062 | 23.0% | 4.8%(+18.2)#38 | 6.0%(+17.0)#1,117 |
| 39. | 11959 | 22.6% | 4.8%(+17.8)#39 | 6.0%(+16.6)#1,151 |
| 40. | 12780 | 22.3% | 4.8%(+17.5)#40 | 6.0%(+16.3)#1,182 |
| 41. | 12862 | 21.8% | 4.8%(+17.0)#41 | 6.0%(+15.8)#1,259 |
| 42. | 13633 | 21.4% | 4.8%(+16.6)#42 | 6.0%(+15.4)#1,302 |
| 43. | 13634 | 20.9% | 4.8%(+16.1)#43 | 6.0%(+14.9)#1,360 |
| 44. | 12058 | 20.8% | 4.8%(+16.0)#44 | 6.0%(+14.8)#1,370 |
| 45. | 14129 | 20.2% | 4.8%(+15.4)#45 | 6.0%(+14.2)#1,455 |
| 46. | 11549 | 20.0% | 4.8%(+15.2)#46 | 6.0%(+14.0)#1,471 |
| 47. | 12008 | 19.8% | 4.8%(+15.0)#47 | 6.0%(+13.8)#1,521 |
| 48. | 14208 | 19.8% | 4.8%(+15.0)#48 | 6.0%(+13.8)#1,529 |
| 49. | 13673 | 19.5% | 4.8%(+14.7)#49 | 6.0%(+13.5)#1,562 |
| 50. | 13603 | 19.3% | 4.8%(+14.5)#50 | 6.0%(+13.3)#1,603 |
| 51. | 10963 | 19.1% | 4.8%(+14.3)#51 | 6.0%(+13.1)#1,631 |
| 52. | 14416 | 18.9% | 4.8%(+14.1)#52 | 6.0%(+12.9)#1,662 |
| 53. | 12463 | 18.9% | 4.8%(+14.1)#53 | 6.0%(+12.9)#1,669 |
| 54. | 13691 | 18.4% | 4.8%(+13.7)#54 | 6.0%(+12.5)#1,740 |
| 55. | 13155 | 18.4% | 4.8%(+13.6)#55 | 6.0%(+12.4)#1,756 |
| 56. | 10503 | 18.4% | 4.8%(+13.6)#56 | 6.0%(+12.4)#1,759 |
| 57. | 12701 | 18.3% | 4.8%(+13.5)#57 | 6.0%(+12.3)#1,778 |
| 58. | 12156 | 18.3% | 4.8%(+13.5)#58 | 6.0%(+12.3)#1,782 |
| 59. | 12926 | 18.2% | 4.8%(+13.4)#59 | 6.0%(+12.2)#1,794 |
| 60. | 13693 | 18.1% | 4.8%(+13.3)#60 | 6.0%(+12.1)#1,824 |
| 61. | 14754 | 18.1% | 4.8%(+13.3)#61 | 6.0%(+12.1)#1,836 |
| 62. | 13408 | 18.0% | 4.8%(+13.2)#62 | 6.0%(+12.0)#1,854 |
| 63. | 12747 | 17.5% | 4.8%(+12.7)#63 | 6.0%(+11.5)#1,958 |
| 64. | 13308 | 17.5% | 4.8%(+12.7)#64 | 6.0%(+11.5)#1,960 |
| 65. | 12412 | 17.4% | 4.8%(+12.6)#65 | 6.0%(+11.4)#1,988 |
| 66. | 14571 | 17.3% | 4.8%(+12.5)#66 | 6.0%(+11.3)#2,005 |
| 67. | 14592 | 17.3% | 4.8%(+12.5)#67 | 6.0%(+11.3)#2,010 |
| 68. | 12064 | 17.2% | 4.8%(+12.4)#68 | 6.0%(+11.2)#2,028 |
| 69. | 13071 | 17.0% | 4.8%(+12.2)#69 | 6.0%(+11.0)#2,079 |
| 70. | 10988 | 16.8% | 4.8%(+12.0)#70 | 6.0%(+10.8)#2,122 |
| 71. | 13345 | 16.7% | 4.8%(+11.9)#71 | 6.0%(+10.7)#2,175 |
| 72. | 12522 | 16.6% | 4.8%(+11.8)#72 | 6.0%(+10.6)#2,201 |
| 73. | 13144 | 16.4% | 4.8%(+11.6)#73 | 6.0%(+10.4)#2,239 |
| 74. | 12442 | 16.2% | 4.8%(+11.4)#74 | 6.0%(+10.2)#2,293 |
| 75. | 12766 | 16.2% | 4.8%(+11.4)#75 | 6.0%(+10.2)#2,302 |
| 76. | 14838 | 16.1% | 4.8%(+11.3)#76 | 6.0%(+10.1)#2,304 |
| 77. | 10474 | 16.1% | 4.8%(+11.3)#77 | 6.0%(+10.1)#2,317 |
| 78. | 12966 | 16.1% | 4.8%(+11.3)#78 | 6.0%(+10.1)#2,321 |
| 79. | 14770 | 16.1% | 4.8%(+11.3)#79 | 6.0%(+10.1)#2,327 |
| 80. | 13120 | 16.0% | 4.8%(+11.2)#80 | 6.0%(+9.97)#2,357 |
| 81. | 12981 | 16.0% | 4.8%(+11.2)#81 | 6.0%(+9.97)#2,358 |
| 82. | 13044 | 15.9% | 4.8%(+11.1)#82 | 6.0%(+9.88)#2,375 |
| 83. | 14743 | 15.8% | 4.8%(+11.0)#83 | 6.0%(+9.79)#2,394 |
| 84. | 12967 | 15.8% | 4.8%(+11.0)#84 | 6.0%(+9.76)#2,406 |
| 85. | 12575 | 15.8% | 4.8%(+11.0)#85 | 6.0%(+9.76)#2,407 |
| 86. | 12458 | 15.7% | 4.8%(+10.9)#86 | 6.0%(+9.71)#2,417 |
| 87. | 14136 | 15.7% | 4.8%(+10.9)#87 | 6.0%(+9.69)#2,424 |
| 88. | 14748 | 15.7% | 4.8%(+10.9)#88 | 6.0%(+9.69)#2,426 |
| 89. | 13697 | 15.7% | 4.8%(+10.9)#89 | 6.0%(+9.67)#2,436 |
| 90. | 14516 | 15.6% | 4.8%(+10.8)#90 | 6.0%(+9.58)#2,467 |
| 91. | 12959 | 15.4% | 4.8%(+10.6)#91 | 6.0%(+9.43)#2,525 |
| 92. | 14511 | 15.3% | 4.8%(+10.5)#92 | 6.0%(+9.30)#2,562 |
| 93. | 14551 | 15.2% | 4.8%(+10.4)#93 | 6.0%(+9.19)#2,603 |
| 94. | 13668 | 15.2% | 4.8%(+10.4)#94 | 6.0%(+9.17)#2,614 |
| 95. | 13478 | 15.1% | 4.8%(+10.3)#95 | 6.0%(+9.06)#2,651 |
| 96. | 12842 | 14.9% | 4.8%(+10.1)#96 | 6.0%(+8.87)#2,733 |
| 97. | 12449 | 14.8% | 4.8%(+10.0)#97 | 6.0%(+8.82)#2,746 |
| 98. | 12969 | 14.7% | 4.8%(+9.87)#98 | 6.0%(+8.67)#2,808 |
| 99. | 13321 | 14.5% | 4.8%(+9.75)#99 | 6.0%(+8.55)#2,862 |
| 100. | 12843 | 14.5% | 4.8%(+9.75)#100 | 6.0%(+8.55)#2,863 |
Common Questions
What are the Top 10 Zip Codes with the Highest Percentage of Population with a Degree in Arts and Humanities in New York?
Top 10 Zip Codes with the Highest Percentage of Population with a Degree in Arts and Humanities in New York are:
What zip code has the Highest Percentage of Population with a Degree in Arts and Humanities in New York?
13314 has the Highest Percentage of Population with a Degree in Arts and Humanities in New York with 100.0%.
What is the Percentage of Population with a Degree in Arts and Humanities in the State of New York?
Percentage of Population with a Degree in Arts and Humanities in New York is 4.8%.
What is the Percentage of Population with a Degree in Arts and Humanities in the United States?
Percentage of Population with a Degree in Arts and Humanities in the United States is 6.0%.