Zip Codes with the Highest Percentage of Population with a Degree in Psychology in New York
RELATED REPORTS & OPTIONS
Psychology
New York
Compare Zip Codes
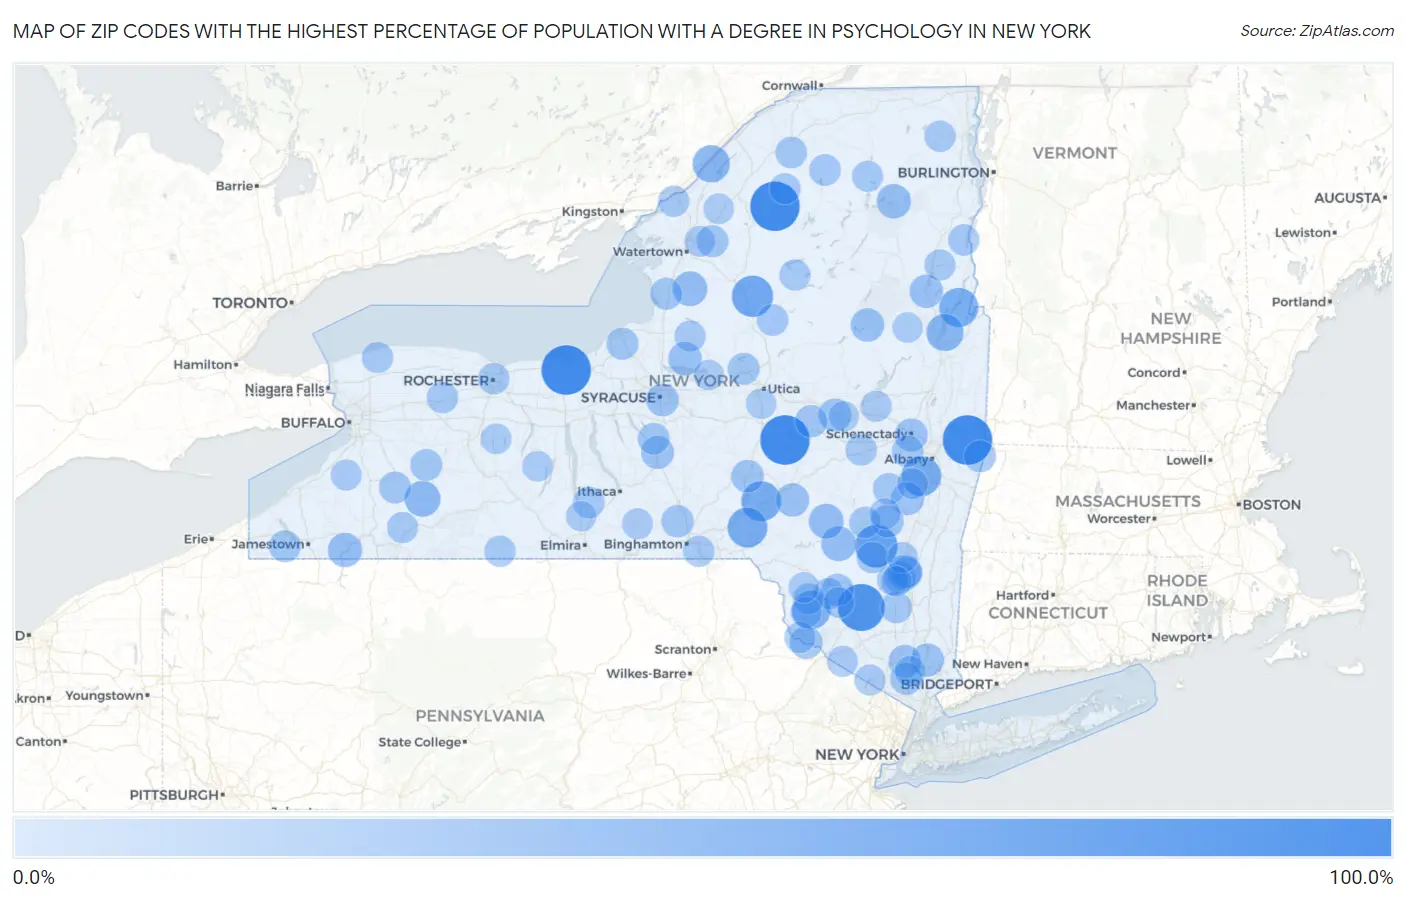
Map of Zip Codes with the Highest Percentage of Population with a Degree in Psychology in New York
0.0%
100.0%
Zip Codes with the Highest Percentage of Population with a Degree in Psychology in New York
| Zip Code | % Graduates | vs State | vs National | |
| 1. | 14413 | 100.0% | 5.9%(+94.1)#1 | 5.1%(+94.9)#18 |
| 2. | 13457 | 100.0% | 5.9%(+94.1)#2 | 5.1%(+94.9)#26 |
| 3. | 13639 | 100.0% | 5.9%(+94.1)#3 | 5.1%(+94.9)#28 |
| 4. | 12082 | 100.0% | 5.9%(+94.1)#4 | 5.1%(+94.9)#31 |
| 5. | 12420 | 87.7% | 5.9%(+81.8)#5 | 5.1%(+82.6)#36 |
| 6. | 12495 | 68.4% | 5.9%(+62.6)#6 | 5.1%(+63.4)#49 |
| 7. | 13345 | 62.5% | 5.9%(+56.6)#7 | 5.1%(+57.4)#61 |
| 8. | 13859 | 56.2% | 5.9%(+50.4)#8 | 5.1%(+51.2)#76 |
| 9. | 13804 | 55.6% | 5.9%(+49.7)#9 | 5.1%(+50.5)#80 |
| 10. | 12161 | 55.6% | 5.9%(+49.7)#10 | 5.1%(+50.5)#82 |
| 11. | 12841 | 52.7% | 5.9%(+46.9)#11 | 5.1%(+47.7)#91 |
| 12. | 12778 | 50.0% | 5.9%(+44.1)#12 | 5.1%(+44.9)#106 |
| 13. | 12820 | 43.8% | 5.9%(+37.9)#13 | 5.1%(+38.7)#152 |
| 14. | 13614 | 43.6% | 5.9%(+37.7)#14 | 5.1%(+38.5)#153 |
| 15. | 14777 | 37.7% | 5.9%(+31.8)#15 | 5.1%(+32.7)#190 |
| 16. | 12417 | 33.3% | 5.9%(+27.5)#16 | 5.1%(+28.3)#238 |
| 17. | 12406 | 33.3% | 5.9%(+27.5)#17 | 5.1%(+28.3)#239 |
| 18. | 13659 | 33.3% | 5.9%(+27.5)#18 | 5.1%(+28.3)#244 |
| 19. | 12459 | 33.3% | 5.9%(+27.5)#19 | 5.1%(+28.3)#255 |
| 20. | 12977 | 31.6% | 5.9%(+25.7)#20 | 5.1%(+26.5)#275 |
| 21. | 14783 | 30.8% | 5.9%(+24.9)#21 | 5.1%(+25.7)#288 |
| 22. | 13028 | 27.6% | 5.9%(+21.7)#22 | 5.1%(+22.6)#346 |
| 23. | 12190 | 27.4% | 5.9%(+21.6)#23 | 5.1%(+22.4)#353 |
| 24. | 13806 | 27.0% | 5.9%(+21.2)#24 | 5.1%(+22.0)#365 |
| 25. | 12860 | 26.9% | 5.9%(+21.1)#25 | 5.1%(+21.9)#367 |
| 26. | 10535 | 26.3% | 5.9%(+20.4)#26 | 5.1%(+21.3)#388 |
| 27. | 12307 | 25.8% | 5.9%(+19.9)#27 | 5.1%(+20.8)#407 |
| 28. | 12176 | 25.6% | 5.9%(+19.7)#28 | 5.1%(+20.5)#416 |
| 29. | 13087 | 25.5% | 5.9%(+19.6)#29 | 5.1%(+20.4)#420 |
| 30. | 13410 | 25.3% | 5.9%(+19.5)#30 | 5.1%(+20.3)#423 |
| 31. | 10922 | 25.0% | 5.9%(+19.1)#31 | 5.1%(+19.9)#426 |
| 32. | 12770 | 24.3% | 5.9%(+18.4)#32 | 5.1%(+19.2)#450 |
| 33. | 12424 | 24.2% | 5.9%(+18.4)#33 | 5.1%(+19.2)#451 |
| 34. | 13843 | 23.8% | 5.9%(+17.9)#34 | 5.1%(+18.8)#462 |
| 35. | 13244 | 23.7% | 5.9%(+17.8)#35 | 5.1%(+18.6)#469 |
| 36. | 13475 | 23.1% | 5.9%(+17.2)#36 | 5.1%(+18.0)#494 |
| 37. | 13777 | 22.9% | 5.9%(+17.0)#37 | 5.1%(+17.8)#501 |
| 38. | 12788 | 22.5% | 5.9%(+16.6)#38 | 5.1%(+17.4)#524 |
| 39. | 10993 | 21.5% | 5.9%(+15.6)#39 | 5.1%(+16.4)#570 |
| 40. | 13115 | 21.1% | 5.9%(+15.2)#40 | 5.1%(+16.0)#596 |
| 41. | 13661 | 20.9% | 5.9%(+15.0)#41 | 5.1%(+15.8)#603 |
| 42. | 14042 | 20.9% | 5.9%(+15.0)#42 | 5.1%(+15.8)#604 |
| 43. | 12022 | 20.9% | 5.9%(+15.0)#43 | 5.1%(+15.8)#607 |
| 44. | 13628 | 20.7% | 5.9%(+14.8)#44 | 5.1%(+15.6)#617 |
| 45. | 12411 | 20.6% | 5.9%(+14.7)#45 | 5.1%(+15.5)#622 |
| 46. | 13441 | 20.4% | 5.9%(+14.5)#46 | 5.1%(+15.3)#631 |
| 47. | 14066 | 20.3% | 5.9%(+14.5)#47 | 5.1%(+15.3)#632 |
| 48. | 14710 | 20.2% | 5.9%(+14.3)#48 | 5.1%(+15.1)#639 |
| 49. | 13141 | 20.2% | 5.9%(+14.3)#49 | 5.1%(+15.1)#641 |
| 50. | 14869 | 19.7% | 5.9%(+13.8)#50 | 5.1%(+14.7)#675 |
| 51. | 13494 | 19.6% | 5.9%(+13.7)#51 | 5.1%(+14.6)#681 |
| 52. | 12085 | 19.5% | 5.9%(+13.6)#52 | 5.1%(+14.5)#688 |
| 53. | 13672 | 19.5% | 5.9%(+13.6)#53 | 5.1%(+14.4)#690 |
| 54. | 13647 | 19.4% | 5.9%(+13.5)#54 | 5.1%(+14.3)#699 |
| 55. | 12120 | 19.2% | 5.9%(+13.3)#55 | 5.1%(+14.1)#711 |
| 56. | 12412 | 19.0% | 5.9%(+13.2)#56 | 5.1%(+14.0)#723 |
| 57. | 12747 | 19.0% | 5.9%(+13.1)#57 | 5.1%(+13.9)#730 |
| 58. | 12452 | 18.8% | 5.9%(+12.9)#58 | 5.1%(+13.7)#747 |
| 59. | 12974 | 18.4% | 5.9%(+12.5)#59 | 5.1%(+13.3)#769 |
| 60. | 12515 | 18.3% | 5.9%(+12.5)#60 | 5.1%(+13.3)#773 |
| 61. | 14557 | 18.2% | 5.9%(+12.3)#61 | 5.1%(+13.1)#789 |
| 62. | 12092 | 17.9% | 5.9%(+12.0)#62 | 5.1%(+12.8)#807 |
| 63. | 12918 | 17.8% | 5.9%(+11.9)#63 | 5.1%(+12.8)#814 |
| 64. | 12466 | 17.7% | 5.9%(+11.9)#64 | 5.1%(+12.7)#824 |
| 65. | 13748 | 17.7% | 5.9%(+11.8)#65 | 5.1%(+12.6)#832 |
| 66. | 14605 | 17.7% | 5.9%(+11.8)#66 | 5.1%(+12.6)#833 |
| 67. | 13692 | 17.5% | 5.9%(+11.6)#67 | 5.1%(+12.4)#851 |
| 68. | 14008 | 17.5% | 5.9%(+11.6)#68 | 5.1%(+12.4)#853 |
| 69. | 14885 | 17.4% | 5.9%(+11.5)#69 | 5.1%(+12.3)#860 |
| 70. | 12719 | 17.3% | 5.9%(+11.4)#70 | 5.1%(+12.2)#872 |
| 71. | 12858 | 17.2% | 5.9%(+11.3)#71 | 5.1%(+12.1)#882 |
| 72. | 13684 | 17.1% | 5.9%(+11.2)#72 | 5.1%(+12.0)#890 |
| 73. | 13493 | 17.0% | 5.9%(+11.1)#73 | 5.1%(+11.9)#902 |
| 74. | 14743 | 16.8% | 5.9%(+11.0)#74 | 5.1%(+11.8)#916 |
| 75. | 12783 | 16.7% | 5.9%(+10.8)#75 | 5.1%(+11.6)#925 |
| 76. | 12786 | 16.7% | 5.9%(+10.8)#76 | 5.1%(+11.6)#934 |
| 77. | 13331 | 16.7% | 5.9%(+10.8)#77 | 5.1%(+11.6)#950 |
| 78. | 12419 | 16.5% | 5.9%(+10.6)#78 | 5.1%(+11.5)#958 |
| 79. | 12970 | 16.5% | 5.9%(+10.6)#79 | 5.1%(+11.4)#963 |
| 80. | 14091 | 16.4% | 5.9%(+10.5)#80 | 5.1%(+11.4)#966 |
| 81. | 12007 | 16.4% | 5.9%(+10.5)#81 | 5.1%(+11.3)#972 |
| 82. | 10998 | 16.3% | 5.9%(+10.5)#82 | 5.1%(+11.3)#975 |
| 83. | 10925 | 16.3% | 5.9%(+10.4)#83 | 5.1%(+11.3)#981 |
| 84. | 12475 | 16.3% | 5.9%(+10.4)#84 | 5.1%(+11.2)#984 |
| 85. | 12439 | 16.1% | 5.9%(+10.3)#85 | 5.1%(+11.1)#1,000 |
| 86. | 12070 | 16.1% | 5.9%(+10.2)#86 | 5.1%(+11.0)#1,003 |
| 87. | 13743 | 15.9% | 5.9%(+10.0)#87 | 5.1%(+10.8)#1,021 |
| 88. | 13603 | 15.7% | 5.9%(+9.82)#88 | 5.1%(+10.6)#1,047 |
| 89. | 12789 | 15.4% | 5.9%(+9.56)#89 | 5.1%(+10.4)#1,070 |
| 90. | 14418 | 14.8% | 5.9%(+8.95)#90 | 5.1%(+9.76)#1,154 |
| 91. | 14466 | 14.8% | 5.9%(+8.91)#91 | 5.1%(+9.73)#1,161 |
| 92. | 12791 | 14.6% | 5.9%(+8.74)#92 | 5.1%(+9.56)#1,185 |
| 93. | 10511 | 14.6% | 5.9%(+8.69)#93 | 5.1%(+9.51)#1,189 |
| 94. | 13456 | 14.5% | 5.9%(+8.64)#94 | 5.1%(+9.46)#1,199 |
| 95. | 13608 | 14.5% | 5.9%(+8.61)#95 | 5.1%(+9.42)#1,202 |
| 96. | 12810 | 14.3% | 5.9%(+8.42)#96 | 5.1%(+9.23)#1,234 |
| 97. | 12472 | 14.2% | 5.9%(+8.30)#97 | 5.1%(+9.12)#1,256 |
| 98. | 13162 | 14.1% | 5.9%(+8.23)#98 | 5.1%(+9.05)#1,269 |
| 99. | 13428 | 13.9% | 5.9%(+8.01)#99 | 5.1%(+8.83)#1,300 |
| 100. | 14864 | 13.9% | 5.9%(+7.99)#100 | 5.1%(+8.81)#1,303 |
Common Questions
What are the Top 10 Zip Codes with the Highest Percentage of Population with a Degree in Psychology in New York?
Top 10 Zip Codes with the Highest Percentage of Population with a Degree in Psychology in New York are:
What zip code has the Highest Percentage of Population with a Degree in Psychology in New York?
14413 has the Highest Percentage of Population with a Degree in Psychology in New York with 100.0%.
What is the Percentage of Population with a Degree in Psychology in the State of New York?
Percentage of Population with a Degree in Psychology in New York is 5.9%.
What is the Percentage of Population with a Degree in Psychology in the United States?
Percentage of Population with a Degree in Psychology in the United States is 5.1%.