Zip Codes with the Highest Percentage of Population Employed in Farming, Fishing & Forestry in New York
RELATED REPORTS & OPTIONS
Farming, Fishing & Forestry
New York
Compare Zip Codes
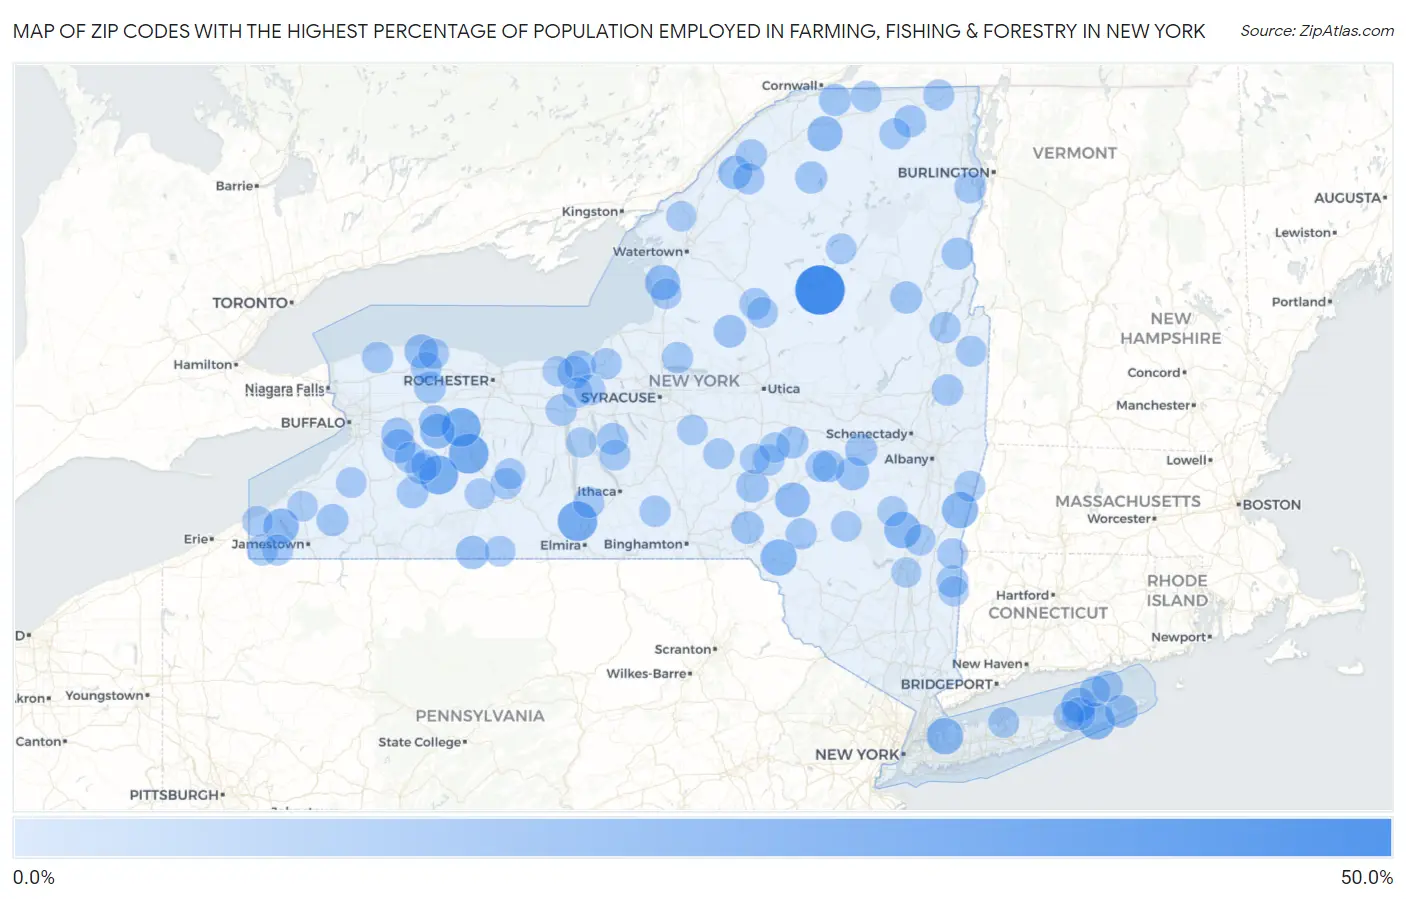
Map of Zip Codes with the Highest Percentage of Population Employed in Farming, Fishing & Forestry in New York
0.0%
50.0%
Zip Codes with the Highest Percentage of Population Employed in Farming, Fishing & Forestry in New York
| Zip Code | % Employed | vs State | vs National | |
| 1. | 13360 | 44.6% | 0.24%(+44.3)#1 | 0.61%(+43.9)#72 |
| 2. | 14556 | 23.1% | 0.24%(+22.8)#2 | 0.61%(+22.5)#313 |
| 3. | 14872 | 23.1% | 0.24%(+22.8)#3 | 0.61%(+22.5)#314 |
| 4. | 14533 | 21.3% | 0.24%(+21.0)#4 | 0.61%(+20.7)#364 |
| 5. | 14536 | 21.2% | 0.24%(+20.9)#5 | 0.61%(+20.6)#366 |
| 6. | 11932 | 16.8% | 0.24%(+16.6)#6 | 0.61%(+16.2)#542 |
| 7. | 12463 | 16.1% | 0.24%(+15.9)#7 | 0.61%(+15.5)#583 |
| 8. | 11547 | 16.0% | 0.24%(+15.7)#8 | 0.61%(+15.4)#592 |
| 9. | 12165 | 15.9% | 0.24%(+15.7)#9 | 0.61%(+15.3)#594 |
| 10. | 13756 | 15.9% | 0.24%(+15.6)#10 | 0.61%(+15.3)#596 |
| 11. | 14722 | 14.0% | 0.24%(+13.7)#11 | 0.61%(+13.3)#720 |
| 12. | 12965 | 13.5% | 0.24%(+13.2)#12 | 0.61%(+12.9)#772 |
| 13. | 13611 | 13.3% | 0.24%(+13.0)#13 | 0.61%(+12.6)#789 |
| 14. | 14591 | 12.9% | 0.24%(+12.7)#14 | 0.61%(+12.3)#821 |
| 15. | 13806 | 12.9% | 0.24%(+12.6)#15 | 0.61%(+12.3)#823 |
| 16. | 11958 | 12.8% | 0.24%(+12.5)#16 | 0.61%(+12.2)#834 |
| 17. | 14571 | 10.7% | 0.24%(+10.4)#17 | 0.61%(+10.0)#1,104 |
| 18. | 14145 | 10.6% | 0.24%(+10.4)#18 | 0.61%(+9.99)#1,112 |
| 19. | 13633 | 10.1% | 0.24%(+9.86)#19 | 0.61%(+9.50)#1,195 |
| 20. | 14897 | 9.6% | 0.24%(+9.37)#20 | 0.61%(+9.00)#1,278 |
| 21. | 12194 | 9.5% | 0.24%(+9.29)#21 | 0.61%(+8.92)#1,289 |
| 22. | 11930 | 8.8% | 0.24%(+8.61)#22 | 0.61%(+8.24)#1,439 |
| 23. | 11956 | 8.7% | 0.24%(+8.42)#23 | 0.61%(+8.06)#1,488 |
| 24. | 13804 | 8.2% | 0.24%(+8.00)#24 | 0.61%(+7.63)#1,593 |
| 25. | 14516 | 8.2% | 0.24%(+7.99)#25 | 0.61%(+7.62)#1,597 |
| 26. | 13776 | 8.2% | 0.24%(+7.98)#26 | 0.61%(+7.61)#1,602 |
| 27. | 13489 | 8.1% | 0.24%(+7.89)#27 | 0.61%(+7.52)#1,626 |
| 28. | 14037 | 7.6% | 0.24%(+7.33)#28 | 0.61%(+6.96)#1,800 |
| 29. | 12853 | 7.5% | 0.24%(+7.25)#29 | 0.61%(+6.88)#1,825 |
| 30. | 12955 | 7.5% | 0.24%(+7.23)#30 | 0.61%(+6.87)#1,829 |
| 31. | 12092 | 7.4% | 0.24%(+7.21)#31 | 0.61%(+6.84)#1,835 |
| 32. | 13687 | 7.4% | 0.24%(+7.14)#32 | 0.61%(+6.77)#1,863 |
| 33. | 14726 | 7.2% | 0.24%(+6.92)#33 | 0.61%(+6.55)#1,927 |
| 34. | 12928 | 7.1% | 0.24%(+6.89)#34 | 0.61%(+6.52)#1,936 |
| 35. | 12914 | 7.0% | 0.24%(+6.77)#35 | 0.61%(+6.40)#1,975 |
| 36. | 12064 | 6.9% | 0.24%(+6.69)#36 | 0.61%(+6.32)#2,011 |
| 37. | 14058 | 6.7% | 0.24%(+6.50)#37 | 0.61%(+6.13)#2,079 |
| 38. | 14054 | 6.7% | 0.24%(+6.48)#38 | 0.61%(+6.11)#2,088 |
| 39. | 13337 | 6.7% | 0.24%(+6.46)#39 | 0.61%(+6.10)#2,091 |
| 40. | 13147 | 6.7% | 0.24%(+6.43)#40 | 0.61%(+6.06)#2,103 |
| 41. | 12501 | 6.5% | 0.24%(+6.26)#41 | 0.61%(+5.89)#2,159 |
| 42. | 14590 | 6.3% | 0.24%(+6.02)#42 | 0.61%(+5.65)#2,261 |
| 43. | 13680 | 6.2% | 0.24%(+5.97)#43 | 0.61%(+5.60)#2,290 |
| 44. | 14060 | 6.2% | 0.24%(+5.94)#44 | 0.61%(+5.57)#2,306 |
| 45. | 13368 | 6.1% | 0.24%(+5.83)#45 | 0.61%(+5.46)#2,361 |
| 46. | 12996 | 6.0% | 0.24%(+5.79)#46 | 0.61%(+5.42)#2,381 |
| 47. | 14024 | 5.8% | 0.24%(+5.61)#47 | 0.61%(+5.24)#2,468 |
| 48. | 12197 | 5.8% | 0.24%(+5.59)#48 | 0.61%(+5.22)#2,481 |
| 49. | 13752 | 5.7% | 0.24%(+5.51)#49 | 0.61%(+5.14)#2,523 |
| 50. | 13736 | 5.7% | 0.24%(+5.44)#50 | 0.61%(+5.07)#2,563 |
| 51. | 13681 | 5.6% | 0.24%(+5.37)#51 | 0.61%(+5.01)#2,591 |
| 52. | 12871 | 5.6% | 0.24%(+5.34)#52 | 0.61%(+4.97)#2,612 |
| 53. | 14869 | 5.6% | 0.24%(+5.33)#53 | 0.61%(+4.97)#2,613 |
| 54. | 14008 | 5.6% | 0.24%(+5.33)#54 | 0.61%(+4.96)#2,619 |
| 55. | 14532 | 5.5% | 0.24%(+5.25)#55 | 0.61%(+4.88)#2,660 |
| 56. | 12844 | 5.5% | 0.24%(+5.22)#56 | 0.61%(+4.85)#2,676 |
| 57. | 12969 | 5.5% | 0.24%(+5.22)#57 | 0.61%(+4.85)#2,677 |
| 58. | 14826 | 5.4% | 0.24%(+5.14)#58 | 0.61%(+4.77)#2,706 |
| 59. | 14113 | 5.3% | 0.24%(+5.06)#59 | 0.61%(+4.69)#2,746 |
| 60. | 13044 | 5.2% | 0.24%(+4.96)#60 | 0.61%(+4.59)#2,795 |
| 61. | 11957 | 5.2% | 0.24%(+4.92)#61 | 0.61%(+4.55)#2,823 |
| 62. | 13342 | 5.1% | 0.24%(+4.89)#62 | 0.61%(+4.52)#2,849 |
| 63. | 12959 | 5.1% | 0.24%(+4.88)#63 | 0.61%(+4.51)#2,854 |
| 64. | 13111 | 5.0% | 0.24%(+4.76)#64 | 0.61%(+4.39)#2,933 |
| 65. | 14411 | 5.0% | 0.24%(+4.75)#65 | 0.61%(+4.38)#2,937 |
| 66. | 12926 | 5.0% | 0.24%(+4.73)#66 | 0.61%(+4.36)#2,950 |
| 67. | 14724 | 4.9% | 0.24%(+4.70)#67 | 0.61%(+4.33)#2,965 |
| 68. | 14767 | 4.9% | 0.24%(+4.69)#68 | 0.61%(+4.33)#2,970 |
| 69. | 12838 | 4.9% | 0.24%(+4.69)#69 | 0.61%(+4.32)#2,978 |
| 70. | 13433 | 4.9% | 0.24%(+4.66)#70 | 0.61%(+4.29)#3,002 |
| 71. | 12526 | 4.8% | 0.24%(+4.60)#71 | 0.61%(+4.23)#3,047 |
| 72. | 13071 | 4.8% | 0.24%(+4.57)#72 | 0.61%(+4.20)#3,069 |
| 73. | 12125 | 4.8% | 0.24%(+4.57)#73 | 0.61%(+4.20)#3,070 |
| 74. | 13464 | 4.8% | 0.24%(+4.57)#74 | 0.61%(+4.20)#3,073 |
| 75. | 14808 | 4.8% | 0.24%(+4.57)#75 | 0.61%(+4.20)#3,075 |
| 76. | 11939 | 4.7% | 0.24%(+4.46)#76 | 0.61%(+4.09)#3,155 |
| 77. | 11794 | 4.7% | 0.24%(+4.44)#77 | 0.61%(+4.08)#3,163 |
| 78. | 14066 | 4.7% | 0.24%(+4.42)#78 | 0.61%(+4.05)#3,185 |
| 79. | 11948 | 4.7% | 0.24%(+4.41)#79 | 0.61%(+4.05)#3,187 |
| 80. | 13146 | 4.6% | 0.24%(+4.37)#80 | 0.61%(+4.00)#3,219 |
| 81. | 14885 | 4.5% | 0.24%(+4.25)#81 | 0.61%(+3.88)#3,318 |
| 82. | 14775 | 4.4% | 0.24%(+4.21)#82 | 0.61%(+3.84)#3,349 |
| 83. | 12503 | 4.4% | 0.24%(+4.16)#83 | 0.61%(+3.79)#3,382 |
| 84. | 12847 | 4.4% | 0.24%(+4.16)#84 | 0.61%(+3.79)#3,383 |
| 85. | 13661 | 4.2% | 0.24%(+3.96)#85 | 0.61%(+3.59)#3,549 |
| 86. | 14034 | 4.1% | 0.24%(+3.86)#86 | 0.61%(+3.50)#3,632 |
| 87. | 14807 | 4.1% | 0.24%(+3.85)#87 | 0.61%(+3.48)#3,650 |
| 88. | 14477 | 4.1% | 0.24%(+3.83)#88 | 0.61%(+3.46)#3,669 |
| 89. | 12430 | 4.0% | 0.24%(+3.78)#89 | 0.61%(+3.41)#3,704 |
| 90. | 14433 | 4.0% | 0.24%(+3.75)#90 | 0.61%(+3.38)#3,723 |
| 91. | 14718 | 4.0% | 0.24%(+3.73)#91 | 0.61%(+3.37)#3,739 |
| 92. | 13122 | 3.9% | 0.24%(+3.63)#92 | 0.61%(+3.27)#3,835 |
| 93. | 13656 | 3.7% | 0.24%(+3.45)#93 | 0.61%(+3.08)#4,019 |
| 94. | 12592 | 3.6% | 0.24%(+3.36)#94 | 0.61%(+2.99)#4,102 |
| 95. | 12405 | 3.6% | 0.24%(+3.33)#95 | 0.61%(+2.97)#4,120 |
| 96. | 13315 | 3.6% | 0.24%(+3.32)#96 | 0.61%(+2.95)#4,138 |
| 97. | 14541 | 3.5% | 0.24%(+3.27)#97 | 0.61%(+2.90)#4,188 |
| 98. | 12466 | 3.5% | 0.24%(+3.25)#98 | 0.61%(+2.89)#4,209 |
| 99. | 13411 | 3.4% | 0.24%(+3.21)#99 | 0.61%(+2.84)#4,269 |
| 100. | 14551 | 3.4% | 0.24%(+3.20)#100 | 0.61%(+2.83)#4,281 |
Common Questions
What are the Top 10 Zip Codes with the Highest Percentage of Population Employed in Farming, Fishing & Forestry in New York?
Top 10 Zip Codes with the Highest Percentage of Population Employed in Farming, Fishing & Forestry in New York are:
What zip code has the Highest Percentage of Population Employed in Farming, Fishing & Forestry in New York?
13360 has the Highest Percentage of Population Employed in Farming, Fishing & Forestry in New York with 44.6%.
What is the Percentage of Population Employed in Farming, Fishing & Forestry in the State of New York?
Percentage of Population Employed in Farming, Fishing & Forestry in New York is 0.24%.
What is the Percentage of Population Employed in Farming, Fishing & Forestry in the United States?
Percentage of Population Employed in Farming, Fishing & Forestry in the United States is 0.61%.