Zip Codes with the Highest Percentage of Population Employed in Arts, Entertainment & Recreation in New York
RELATED REPORTS & OPTIONS
Arts, Entertainment & Recreation
New York
Compare Zip Codes
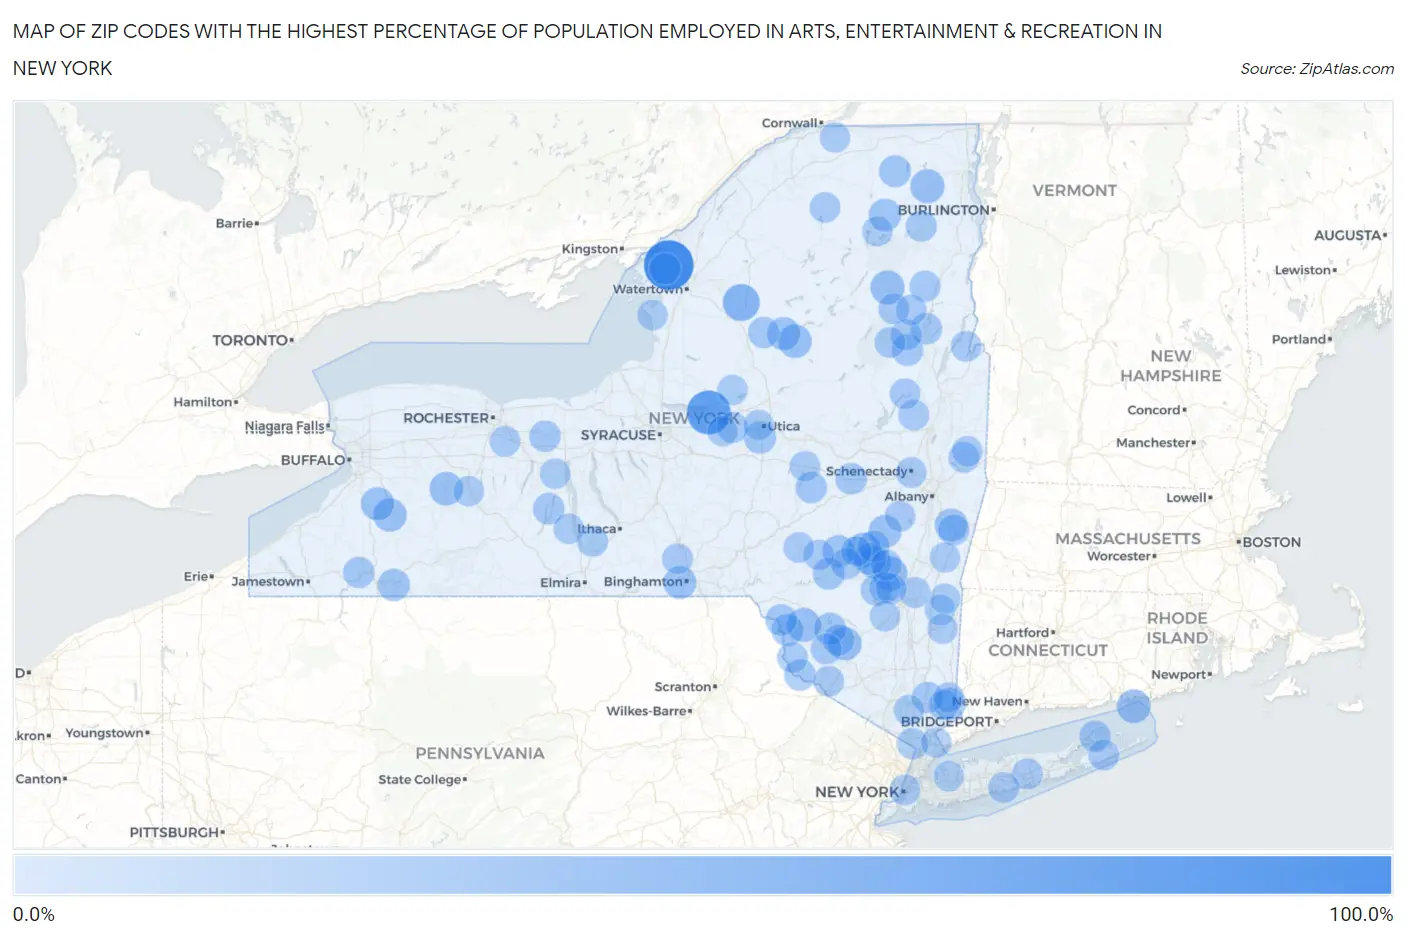
Map of Zip Codes with the Highest Percentage of Population Employed in Arts, Entertainment & Recreation in New York
0.0%
100.0%
Zip Codes with the Highest Percentage of Population Employed in Arts, Entertainment & Recreation in New York
| Zip Code | % Employed | vs State | vs National | |
| 1. | 13632 | 100.0% | 2.4%(+97.6)#1 | 2.1%(+97.9)#4 |
| 2. | 13162 | 71.6% | 2.4%(+69.2)#2 | 2.1%(+69.5)#19 |
| 3. | 13305 | 38.2% | 2.4%(+35.8)#3 | 2.1%(+36.2)#57 |
| 4. | 12407 | 27.9% | 2.4%(+25.5)#4 | 2.1%(+25.9)#94 |
| 5. | 12427 | 27.6% | 2.4%(+25.2)#5 | 2.1%(+25.5)#96 |
| 6. | 12978 | 24.7% | 2.4%(+22.2)#6 | 2.1%(+22.6)#116 |
| 7. | 12852 | 24.2% | 2.4%(+21.7)#7 | 2.1%(+22.1)#121 |
| 8. | 12791 | 23.7% | 2.4%(+21.2)#8 | 2.1%(+21.6)#128 |
| 9. | 06390 | 23.1% | 2.4%(+20.7)#9 | 2.1%(+21.0)#132 |
| 10. | 14549 | 22.4% | 2.4%(+20.0)#10 | 2.1%(+20.3)#143 |
| 11. | 14134 | 21.7% | 2.4%(+19.3)#11 | 2.1%(+19.7)#153 |
| 12. | 12763 | 21.3% | 2.4%(+18.9)#12 | 2.1%(+19.2)#159 |
| 13. | 13420 | 21.2% | 2.4%(+18.8)#13 | 2.1%(+19.2)#163 |
| 14. | 13472 | 20.4% | 2.4%(+18.0)#14 | 2.1%(+18.3)#175 |
| 15. | 14069 | 20.3% | 2.4%(+17.8)#15 | 2.1%(+18.2)#177 |
| 16. | 12115 | 19.5% | 2.4%(+17.1)#16 | 2.1%(+17.4)#193 |
| 17. | 13902 | 19.3% | 2.4%(+16.9)#17 | 2.1%(+17.2)#199 |
| 18. | 12460 | 18.5% | 2.4%(+16.1)#18 | 2.1%(+16.4)#222 |
| 19. | 12442 | 17.9% | 2.4%(+15.5)#19 | 2.1%(+15.8)#232 |
| 20. | 12474 | 17.3% | 2.4%(+14.9)#20 | 2.1%(+15.2)#244 |
| 21. | 12939 | 17.0% | 2.4%(+14.6)#21 | 2.1%(+14.9)#258 |
| 22. | 14778 | 16.6% | 2.4%(+14.2)#22 | 2.1%(+14.5)#268 |
| 23. | 13319 | 16.1% | 2.4%(+13.7)#23 | 2.1%(+14.0)#286 |
| 24. | 12444 | 15.7% | 2.4%(+13.2)#24 | 2.1%(+13.6)#309 |
| 25. | 12759 | 15.4% | 2.4%(+13.0)#25 | 2.1%(+13.3)#319 |
| 26. | 12723 | 15.3% | 2.4%(+12.8)#26 | 2.1%(+13.2)#323 |
| 27. | 10597 | 14.8% | 2.4%(+12.3)#27 | 2.1%(+12.7)#347 |
| 28. | 12969 | 14.5% | 2.4%(+12.1)#28 | 2.1%(+12.5)#358 |
| 29. | 12455 | 14.1% | 2.4%(+11.7)#29 | 2.1%(+12.0)#380 |
| 30. | 13622 | 13.7% | 2.4%(+11.3)#30 | 2.1%(+11.6)#408 |
| 31. | 14478 | 13.5% | 2.4%(+11.1)#31 | 2.1%(+11.4)#418 |
| 32. | 12843 | 13.3% | 2.4%(+10.9)#32 | 2.1%(+11.3)#427 |
| 33. | 12860 | 13.3% | 2.4%(+10.9)#33 | 2.1%(+11.2)#432 |
| 34. | 12496 | 12.8% | 2.4%(+10.4)#34 | 2.1%(+10.8)#462 |
| 35. | 12741 | 12.8% | 2.4%(+10.4)#35 | 2.1%(+10.7)#463 |
| 36. | 13450 | 12.6% | 2.4%(+10.2)#36 | 2.1%(+10.5)#477 |
| 37. | 14537 | 12.4% | 2.4%(+9.97)#37 | 2.1%(+10.3)#483 |
| 38. | 12789 | 12.3% | 2.4%(+9.91)#38 | 2.1%(+10.2)#484 |
| 39. | 12719 | 12.3% | 2.4%(+9.86)#39 | 2.1%(+10.2)#485 |
| 40. | 12031 | 11.8% | 2.4%(+9.41)#40 | 2.1%(+9.75)#524 |
| 41. | 14779 | 11.7% | 2.4%(+9.31)#41 | 2.1%(+9.64)#534 |
| 42. | 13312 | 11.7% | 2.4%(+9.31)#42 | 2.1%(+9.64)#536 |
| 43. | 11965 | 11.7% | 2.4%(+9.30)#43 | 2.1%(+9.63)#537 |
| 44. | 10535 | 11.7% | 2.4%(+9.27)#44 | 2.1%(+9.61)#540 |
| 45. | 12430 | 11.4% | 2.4%(+9.00)#45 | 2.1%(+9.33)#557 |
| 46. | 12457 | 11.4% | 2.4%(+8.96)#46 | 2.1%(+9.29)#561 |
| 47. | 12409 | 11.1% | 2.4%(+8.74)#47 | 2.1%(+9.07)#587 |
| 48. | 12853 | 11.0% | 2.4%(+8.61)#48 | 2.1%(+8.94)#602 |
| 49. | 13476 | 10.7% | 2.4%(+8.32)#49 | 2.1%(+8.65)#622 |
| 50. | 10976 | 10.7% | 2.4%(+8.26)#50 | 2.1%(+8.59)#627 |
| 51. | 14805 | 10.6% | 2.4%(+8.14)#51 | 2.1%(+8.47)#646 |
| 52. | 12997 | 10.3% | 2.4%(+7.92)#52 | 2.1%(+8.25)#662 |
| 53. | 12855 | 10.3% | 2.4%(+7.84)#53 | 2.1%(+8.17)#670 |
| 54. | 12136 | 10.2% | 2.4%(+7.80)#54 | 2.1%(+8.13)#675 |
| 55. | 12701 | 10.0% | 2.4%(+7.54)#55 | 2.1%(+7.87)#707 |
| 56. | 12859 | 9.7% | 2.4%(+7.25)#56 | 2.1%(+7.58)#753 |
| 57. | 12856 | 9.7% | 2.4%(+7.25)#57 | 2.1%(+7.58)#754 |
| 58. | 11975 | 9.6% | 2.4%(+7.23)#58 | 2.1%(+7.56)#756 |
| 59. | 11980 | 9.6% | 2.4%(+7.21)#59 | 2.1%(+7.55)#760 |
| 60. | 11769 | 9.6% | 2.4%(+7.15)#60 | 2.1%(+7.48)#770 |
| 61. | 12504 | 9.4% | 2.4%(+7.01)#61 | 2.1%(+7.34)#788 |
| 62. | 13740 | 9.4% | 2.4%(+7.00)#62 | 2.1%(+7.33)#791 |
| 63. | 12851 | 9.3% | 2.4%(+6.92)#63 | 2.1%(+7.25)#799 |
| 64. | 12094 | 9.3% | 2.4%(+6.91)#64 | 2.1%(+7.24)#800 |
| 65. | 13777 | 9.3% | 2.4%(+6.86)#65 | 2.1%(+7.19)#811 |
| 66. | 10012 | 9.2% | 2.4%(+6.79)#66 | 2.1%(+7.12)#821 |
| 67. | 12857 | 9.1% | 2.4%(+6.65)#67 | 2.1%(+6.98)#846 |
| 68. | 14506 | 8.9% | 2.4%(+6.53)#68 | 2.1%(+6.86)#864 |
| 69. | 12498 | 8.9% | 2.4%(+6.44)#69 | 2.1%(+6.77)#874 |
| 70. | 13753 | 8.8% | 2.4%(+6.36)#70 | 2.1%(+6.69)#897 |
| 71. | 12835 | 8.7% | 2.4%(+6.26)#71 | 2.1%(+6.59)#917 |
| 72. | 12746 | 8.5% | 2.4%(+6.05)#72 | 2.1%(+6.38)#948 |
| 73. | 12819 | 8.5% | 2.4%(+6.04)#73 | 2.1%(+6.37)#954 |
| 74. | 12485 | 8.4% | 2.4%(+6.02)#74 | 2.1%(+6.35)#957 |
| 75. | 10526 | 8.4% | 2.4%(+6.02)#75 | 2.1%(+6.35)#960 |
| 76. | 12764 | 8.4% | 2.4%(+5.94)#76 | 2.1%(+6.27)#973 |
| 77. | 13672 | 8.2% | 2.4%(+5.78)#77 | 2.1%(+6.11)#1,004 |
| 78. | 12028 | 8.1% | 2.4%(+5.71)#78 | 2.1%(+6.04)#1,023 |
| 79. | 13461 | 8.1% | 2.4%(+5.69)#79 | 2.1%(+6.02)#1,035 |
| 80. | 12193 | 8.0% | 2.4%(+5.63)#80 | 2.1%(+5.97)#1,049 |
| 81. | 12307 | 8.0% | 2.4%(+5.62)#81 | 2.1%(+5.95)#1,053 |
| 82. | 11548 | 8.0% | 2.4%(+5.60)#82 | 2.1%(+5.93)#1,055 |
| 83. | 14878 | 8.0% | 2.4%(+5.57)#83 | 2.1%(+5.90)#1,062 |
| 84. | 13468 | 7.8% | 2.4%(+5.39)#84 | 2.1%(+5.72)#1,107 |
| 85. | 14556 | 7.7% | 2.4%(+5.28)#85 | 2.1%(+5.61)#1,134 |
| 86. | 10596 | 7.7% | 2.4%(+5.26)#86 | 2.1%(+5.59)#1,142 |
| 87. | 14463 | 7.5% | 2.4%(+5.12)#87 | 2.1%(+5.46)#1,174 |
| 88. | 12484 | 7.5% | 2.4%(+5.06)#88 | 2.1%(+5.39)#1,184 |
| 89. | 12581 | 7.3% | 2.4%(+4.93)#89 | 2.1%(+5.26)#1,218 |
| 90. | 12945 | 7.3% | 2.4%(+4.93)#90 | 2.1%(+5.26)#1,220 |
| 91. | 13650 | 7.3% | 2.4%(+4.92)#91 | 2.1%(+5.25)#1,223 |
| 92. | 10577 | 7.3% | 2.4%(+4.91)#92 | 2.1%(+5.25)#1,225 |
| 93. | 12567 | 7.3% | 2.4%(+4.91)#93 | 2.1%(+5.24)#1,226 |
| 94. | 13363 | 7.3% | 2.4%(+4.90)#94 | 2.1%(+5.23)#1,230 |
| 95. | 13495 | 7.3% | 2.4%(+4.85)#95 | 2.1%(+5.18)#1,249 |
| 96. | 12468 | 7.1% | 2.4%(+4.73)#96 | 2.1%(+5.06)#1,284 |
| 97. | 10560 | 7.1% | 2.4%(+4.69)#97 | 2.1%(+5.02)#1,301 |
| 98. | 12565 | 7.0% | 2.4%(+4.62)#98 | 2.1%(+4.95)#1,318 |
| 99. | 12545 | 7.0% | 2.4%(+4.60)#99 | 2.1%(+4.93)#1,325 |
| 100. | 12914 | 7.0% | 2.4%(+4.59)#100 | 2.1%(+4.92)#1,329 |
Common Questions
What are the Top 10 Zip Codes with the Highest Percentage of Population Employed in Arts, Entertainment & Recreation in New York?
Top 10 Zip Codes with the Highest Percentage of Population Employed in Arts, Entertainment & Recreation in New York are:
What zip code has the Highest Percentage of Population Employed in Arts, Entertainment & Recreation in New York?
13632 has the Highest Percentage of Population Employed in Arts, Entertainment & Recreation in New York with 100.0%.
What is the Percentage of Population Employed in Arts, Entertainment & Recreation in the State of New York?
Percentage of Population Employed in Arts, Entertainment & Recreation in New York is 2.4%.
What is the Percentage of Population Employed in Arts, Entertainment & Recreation in the United States?
Percentage of Population Employed in Arts, Entertainment & Recreation in the United States is 2.1%.