Zip Codes with the Highest Percentage of Population with a Degree in Visual and Performing Arts in New York
RELATED REPORTS & OPTIONS
Visual and Performing Arts
New York
Compare Zip Codes
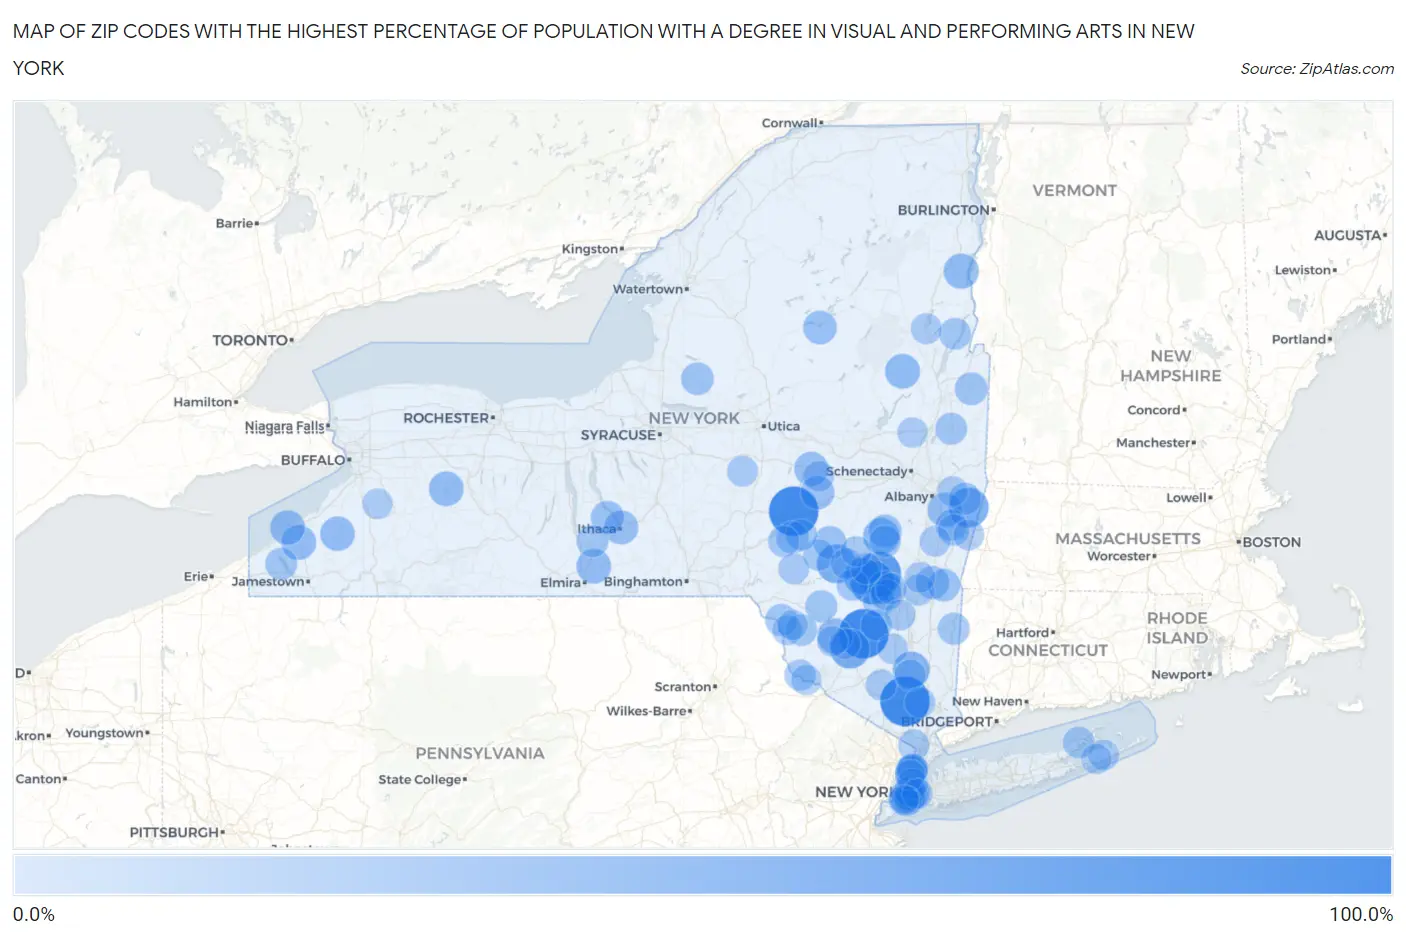
Map of Zip Codes with the Highest Percentage of Population with a Degree in Visual and Performing Arts in New York
0.0%
100.0%
Zip Codes with the Highest Percentage of Population with a Degree in Visual and Performing Arts in New York
| Zip Code | % Graduates | vs State | vs National | |
| 1. | 12489 | 100.0% | 6.8%(+93.2)#1 | 4.3%(+95.7)#12 |
| 2. | 13834 | 100.0% | 6.8%(+93.2)#2 | 4.3%(+95.7)#14 |
| 3. | 10911 | 100.0% | 6.8%(+93.2)#3 | 4.3%(+95.7)#23 |
| 4. | 12450 | 78.2% | 6.8%(+71.4)#4 | 4.3%(+73.9)#32 |
| 5. | 12416 | 75.8% | 6.8%(+69.0)#5 | 4.3%(+71.5)#33 |
| 6. | 12169 | 56.0% | 6.8%(+49.2)#6 | 4.3%(+51.7)#53 |
| 7. | 12769 | 55.4% | 6.8%(+48.6)#7 | 4.3%(+51.1)#57 |
| 8. | 12438 | 52.9% | 6.8%(+46.2)#8 | 4.3%(+48.7)#62 |
| 9. | 12480 | 44.7% | 6.8%(+37.9)#9 | 4.3%(+40.5)#99 |
| 10. | 12527 | 43.8% | 6.8%(+37.0)#10 | 4.3%(+39.5)#110 |
| 11. | 12422 | 41.2% | 6.8%(+34.4)#11 | 4.3%(+36.9)#118 |
| 12. | 12733 | 38.0% | 6.8%(+31.2)#12 | 4.3%(+33.8)#127 |
| 13. | 12956 | 36.2% | 6.8%(+29.4)#13 | 4.3%(+31.9)#145 |
| 14. | 12878 | 35.0% | 6.8%(+28.2)#14 | 4.3%(+30.7)#151 |
| 15. | 14816 | 34.6% | 6.8%(+27.8)#15 | 4.3%(+30.4)#157 |
| 16. | 14752 | 34.6% | 6.8%(+27.8)#16 | 4.3%(+30.4)#158 |
| 17. | 14549 | 34.1% | 6.8%(+27.3)#17 | 4.3%(+29.8)#163 |
| 18. | 12063 | 33.9% | 6.8%(+27.1)#18 | 4.3%(+29.6)#167 |
| 19. | 14166 | 33.8% | 6.8%(+27.1)#19 | 4.3%(+29.6)#168 |
| 20. | 14041 | 33.3% | 6.8%(+26.6)#20 | 4.3%(+29.1)#178 |
| 21. | 14853 | 30.8% | 6.8%(+24.0)#21 | 4.3%(+26.5)#212 |
| 22. | 13333 | 30.8% | 6.8%(+24.0)#22 | 4.3%(+26.5)#214 |
| 23. | 13488 | 30.0% | 6.8%(+23.2)#23 | 4.3%(+25.7)#220 |
| 24. | 13360 | 29.4% | 6.8%(+22.6)#24 | 4.3%(+25.2)#230 |
| 25. | 12460 | 28.2% | 6.8%(+21.5)#25 | 4.3%(+24.0)#252 |
| 26. | 14854 | 27.9% | 6.8%(+21.1)#26 | 4.3%(+23.7)#258 |
| 27. | 12409 | 27.8% | 6.8%(+21.1)#27 | 4.3%(+23.6)#260 |
| 28. | 12523 | 27.2% | 6.8%(+20.4)#28 | 4.3%(+23.0)#269 |
| 29. | 13788 | 26.6% | 6.8%(+19.8)#29 | 4.3%(+22.3)#280 |
| 30. | 12838 | 26.0% | 6.8%(+19.2)#30 | 4.3%(+21.7)#292 |
| 31. | 12502 | 25.6% | 6.8%(+18.8)#31 | 4.3%(+21.4)#301 |
| 32. | 13483 | 25.4% | 6.8%(+18.6)#32 | 4.3%(+21.1)#305 |
| 33. | 13806 | 24.3% | 6.8%(+17.5)#33 | 4.3%(+20.1)#331 |
| 34. | 11237 | 23.9% | 6.8%(+17.1)#34 | 4.3%(+19.6)#337 |
| 35. | 12153 | 23.1% | 6.8%(+16.3)#35 | 4.3%(+18.8)#354 |
| 36. | 12741 | 22.9% | 6.8%(+16.1)#36 | 4.3%(+18.6)#363 |
| 37. | 12758 | 22.8% | 6.8%(+16.0)#37 | 4.3%(+18.5)#368 |
| 38. | 12592 | 22.6% | 6.8%(+15.8)#38 | 4.3%(+18.3)#379 |
| 39. | 14722 | 22.5% | 6.8%(+15.7)#39 | 4.3%(+18.2)#381 |
| 40. | 12884 | 22.2% | 6.8%(+15.4)#40 | 4.3%(+18.0)#389 |
| 41. | 14805 | 22.1% | 6.8%(+15.3)#41 | 4.3%(+17.8)#395 |
| 42. | 10032 | 21.8% | 6.8%(+15.1)#42 | 4.3%(+17.6)#401 |
| 43. | 12874 | 21.6% | 6.8%(+14.9)#43 | 4.3%(+17.4)#407 |
| 44. | 12748 | 21.5% | 6.8%(+14.7)#44 | 4.3%(+17.3)#411 |
| 45. | 12481 | 21.2% | 6.8%(+14.4)#45 | 4.3%(+16.9)#423 |
| 46. | 12410 | 21.2% | 6.8%(+14.4)#46 | 4.3%(+16.9)#424 |
| 47. | 11222 | 21.2% | 6.8%(+14.4)#47 | 4.3%(+16.9)#425 |
| 48. | 12418 | 20.8% | 6.8%(+14.0)#48 | 4.3%(+16.5)#442 |
| 49. | 11958 | 20.7% | 6.8%(+13.9)#49 | 4.3%(+16.5)#444 |
| 50. | 13740 | 20.7% | 6.8%(+13.9)#50 | 4.3%(+16.4)#446 |
| 51. | 12433 | 20.6% | 6.8%(+13.9)#51 | 4.3%(+16.4)#448 |
| 52. | 13757 | 20.5% | 6.8%(+13.7)#52 | 4.3%(+16.2)#452 |
| 53. | 13846 | 20.2% | 6.8%(+13.4)#53 | 4.3%(+15.9)#464 |
| 54. | 10033 | 20.1% | 6.8%(+13.3)#54 | 4.3%(+15.8)#470 |
| 55. | 10964 | 19.6% | 6.8%(+12.8)#55 | 4.3%(+15.4)#483 |
| 56. | 12583 | 19.6% | 6.8%(+12.8)#56 | 4.3%(+15.3)#487 |
| 57. | 12115 | 19.4% | 6.8%(+12.6)#57 | 4.3%(+15.1)#496 |
| 58. | 12719 | 19.3% | 6.8%(+12.6)#58 | 4.3%(+15.1)#497 |
| 59. | 12498 | 19.1% | 6.8%(+12.3)#59 | 4.3%(+14.9)#509 |
| 60. | 12404 | 19.1% | 6.8%(+12.3)#60 | 4.3%(+14.8)#511 |
| 61. | 11206 | 19.0% | 6.8%(+12.2)#61 | 4.3%(+14.7)#518 |
| 62. | 12136 | 18.9% | 6.8%(+12.2)#62 | 4.3%(+14.7)#521 |
| 63. | 12508 | 18.9% | 6.8%(+12.1)#63 | 4.3%(+14.7)#524 |
| 64. | 10040 | 18.8% | 6.8%(+12.0)#64 | 4.3%(+14.5)#530 |
| 65. | 10034 | 18.6% | 6.8%(+11.8)#65 | 4.3%(+14.4)#540 |
| 66. | 12411 | 18.4% | 6.8%(+11.6)#66 | 4.3%(+14.1)#550 |
| 67. | 12492 | 18.3% | 6.8%(+11.6)#67 | 4.3%(+14.1)#555 |
| 68. | 12430 | 18.3% | 6.8%(+11.5)#68 | 4.3%(+14.0)#556 |
| 69. | 11225 | 18.2% | 6.8%(+11.5)#69 | 4.3%(+14.0)#559 |
| 70. | 11221 | 18.2% | 6.8%(+11.5)#70 | 4.3%(+14.0)#560 |
| 71. | 11205 | 18.2% | 6.8%(+11.4)#71 | 4.3%(+14.0)#562 |
| 72. | 11216 | 18.2% | 6.8%(+11.4)#72 | 4.3%(+13.9)#563 |
| 73. | 10914 | 18.2% | 6.8%(+11.4)#73 | 4.3%(+13.9)#566 |
| 74. | 12174 | 17.9% | 6.8%(+11.2)#74 | 4.3%(+13.7)#578 |
| 75. | 13355 | 17.9% | 6.8%(+11.1)#75 | 4.3%(+13.6)#583 |
| 76. | 11211 | 17.7% | 6.8%(+11.0)#76 | 4.3%(+13.5)#591 |
| 77. | 12029 | 17.5% | 6.8%(+10.8)#77 | 4.3%(+13.3)#601 |
| 78. | 13320 | 17.5% | 6.8%(+10.7)#78 | 4.3%(+13.2)#606 |
| 79. | 12763 | 17.4% | 6.8%(+10.7)#79 | 4.3%(+13.2)#607 |
| 80. | 13782 | 17.4% | 6.8%(+10.6)#80 | 4.3%(+13.1)#617 |
| 81. | 12860 | 17.3% | 6.8%(+10.5)#81 | 4.3%(+13.1)#620 |
| 82. | 11231 | 17.1% | 6.8%(+10.3)#82 | 4.3%(+12.8)#634 |
| 83. | 12779 | 16.9% | 6.8%(+10.1)#83 | 4.3%(+12.7)#646 |
| 84. | 11106 | 16.8% | 6.8%(+10.0)#84 | 4.3%(+12.6)#655 |
| 85. | 12526 | 16.8% | 6.8%(+10.0)#85 | 4.3%(+12.6)#656 |
| 86. | 12548 | 16.6% | 6.8%(+9.82)#86 | 4.3%(+12.3)#670 |
| 87. | 12468 | 16.5% | 6.8%(+9.75)#87 | 4.3%(+12.3)#671 |
| 88. | 11975 | 16.4% | 6.8%(+9.66)#88 | 4.3%(+12.2)#675 |
| 89. | 10517 | 16.4% | 6.8%(+9.66)#89 | 4.3%(+12.2)#676 |
| 90. | 11932 | 16.1% | 6.8%(+9.32)#90 | 4.3%(+11.8)#696 |
| 91. | 10031 | 16.1% | 6.8%(+9.28)#91 | 4.3%(+11.8)#704 |
| 92. | 12723 | 16.0% | 6.8%(+9.17)#92 | 4.3%(+11.7)#716 |
| 93. | 12140 | 15.9% | 6.8%(+9.12)#93 | 4.3%(+11.6)#724 |
| 94. | 14069 | 15.8% | 6.8%(+9.01)#94 | 4.3%(+11.5)#733 |
| 95. | 11218 | 15.8% | 6.8%(+9.00)#95 | 4.3%(+11.5)#738 |
| 96. | 11385 | 15.8% | 6.8%(+9.00)#96 | 4.3%(+11.5)#739 |
| 97. | 12770 | 15.7% | 6.8%(+8.93)#97 | 4.3%(+11.5)#743 |
| 98. | 12863 | 15.6% | 6.8%(+8.86)#98 | 4.3%(+11.4)#746 |
| 99. | 12766 | 15.5% | 6.8%(+8.68)#99 | 4.3%(+11.2)#761 |
| 100. | 11232 | 15.4% | 6.8%(+8.64)#100 | 4.3%(+11.2)#763 |
Common Questions
What are the Top 10 Zip Codes with the Highest Percentage of Population with a Degree in Visual and Performing Arts in New York?
Top 10 Zip Codes with the Highest Percentage of Population with a Degree in Visual and Performing Arts in New York are:
What zip code has the Highest Percentage of Population with a Degree in Visual and Performing Arts in New York?
12489 has the Highest Percentage of Population with a Degree in Visual and Performing Arts in New York with 100.0%.
What is the Percentage of Population with a Degree in Visual and Performing Arts in the State of New York?
Percentage of Population with a Degree in Visual and Performing Arts in New York is 6.8%.
What is the Percentage of Population with a Degree in Visual and Performing Arts in the United States?
Percentage of Population with a Degree in Visual and Performing Arts in the United States is 4.3%.