Zip Codes with the Highest Percentage of Population with a Degree in Communications in New York
RELATED REPORTS & OPTIONS
Communications
New York
Compare Zip Codes
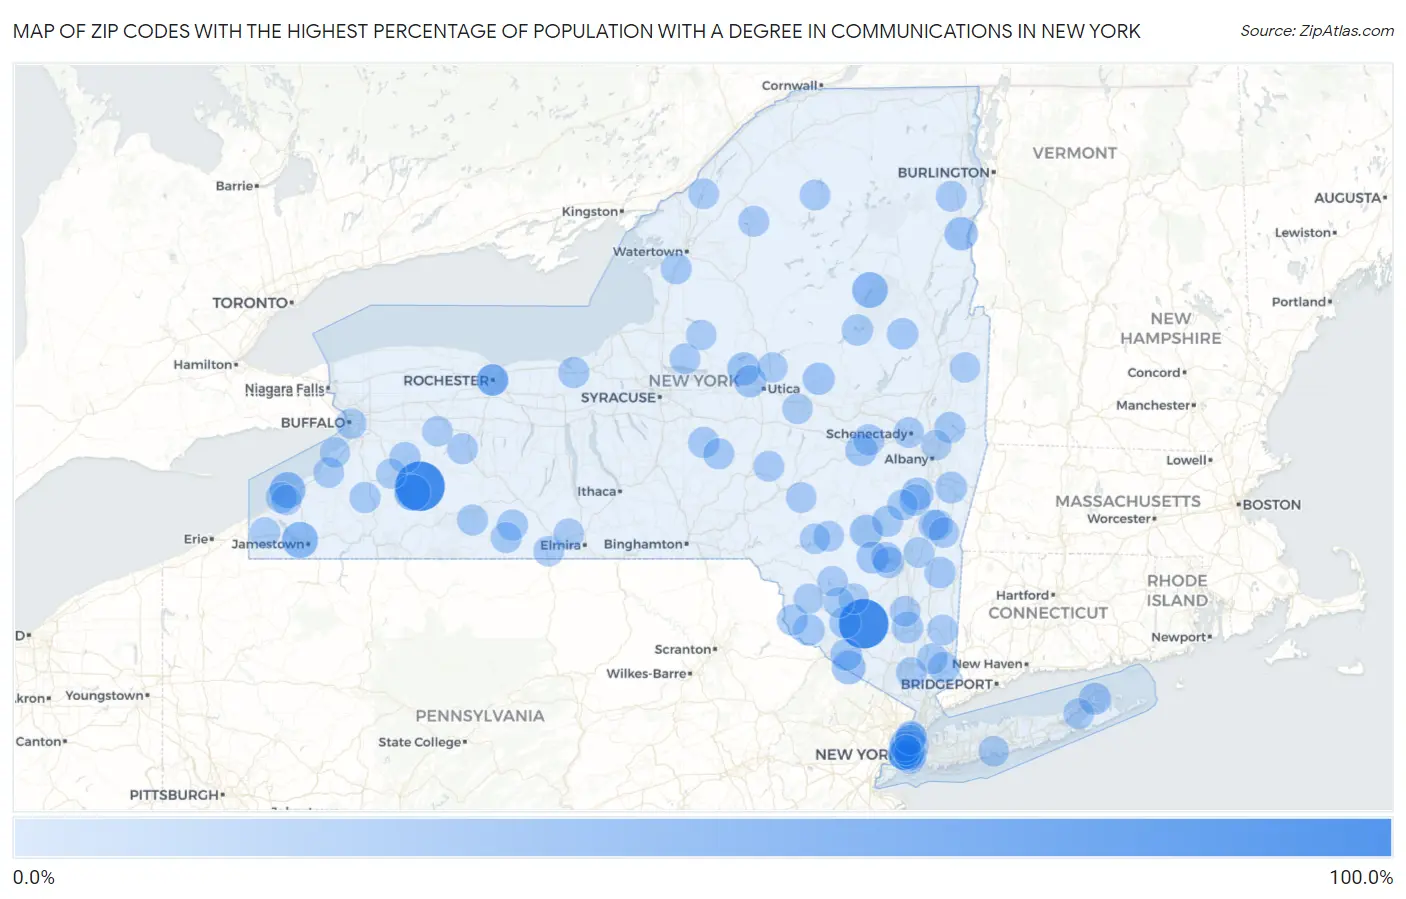
Map of Zip Codes with the Highest Percentage of Population with a Degree in Communications in New York
0.0%
100.0%
Zip Codes with the Highest Percentage of Population with a Degree in Communications in New York
| Zip Code | % Graduates | vs State | vs National | |
| 1. | 10985 | 100.0% | 4.4%(+95.6)#1 | 4.1%(+95.9)#15 |
| 2. | 14029 | 100.0% | 4.4%(+95.6)#2 | 4.1%(+95.9)#17 |
| 3. | 14060 | 35.5% | 4.4%(+31.1)#3 | 4.1%(+31.3)#104 |
| 4. | 14742 | 35.0% | 4.4%(+30.6)#4 | 4.1%(+30.9)#112 |
| 5. | 14166 | 33.8% | 4.4%(+29.4)#5 | 4.1%(+29.7)#119 |
| 6. | 12864 | 33.3% | 4.4%(+28.9)#6 | 4.1%(+29.2)#131 |
| 7. | 10969 | 23.9% | 4.4%(+19.4)#7 | 4.1%(+19.7)#237 |
| 8. | 12956 | 22.0% | 4.4%(+17.6)#8 | 4.1%(+17.9)#273 |
| 9. | 13441 | 20.4% | 4.4%(+16.0)#9 | 4.1%(+16.2)#321 |
| 10. | 12492 | 20.0% | 4.4%(+15.6)#10 | 4.1%(+15.9)#331 |
| 11. | 10279 | 18.5% | 4.4%(+14.1)#11 | 4.1%(+14.3)#387 |
| 12. | 12087 | 17.8% | 4.4%(+13.4)#12 | 4.1%(+13.6)#406 |
| 13. | 13454 | 17.0% | 4.4%(+12.6)#13 | 4.1%(+12.9)#441 |
| 14. | 13424 | 16.3% | 4.4%(+11.9)#14 | 4.1%(+12.1)#480 |
| 15. | 11965 | 16.2% | 4.4%(+11.7)#15 | 4.1%(+12.0)#486 |
| 16. | 12412 | 16.1% | 4.4%(+11.7)#16 | 4.1%(+12.0)#489 |
| 17. | 12092 | 15.7% | 4.4%(+11.3)#17 | 4.1%(+11.5)#516 |
| 18. | 10933 | 15.1% | 4.4%(+10.7)#18 | 4.1%(+11.0)#546 |
| 19. | 12115 | 14.5% | 4.4%(+10.1)#19 | 4.1%(+10.4)#582 |
| 20. | 12512 | 14.2% | 4.4%(+9.75)#20 | 4.1%(+10.0)#616 |
| 21. | 12743 | 14.0% | 4.4%(+9.54)#21 | 4.1%(+9.82)#629 |
| 22. | 12790 | 13.5% | 4.4%(+9.05)#22 | 4.1%(+9.33)#662 |
| 23. | 12878 | 13.3% | 4.4%(+8.92)#23 | 4.1%(+9.20)#672 |
| 24. | 12066 | 13.2% | 4.4%(+8.76)#24 | 4.1%(+9.04)#693 |
| 25. | 10007 | 13.1% | 4.4%(+8.68)#25 | 4.1%(+8.95)#698 |
| 26. | 12581 | 13.0% | 4.4%(+8.61)#26 | 4.1%(+8.89)#704 |
| 27. | 14608 | 13.0% | 4.4%(+8.60)#27 | 4.1%(+8.88)#705 |
| 28. | 10526 | 12.8% | 4.4%(+8.44)#28 | 4.1%(+8.71)#720 |
| 29. | 12108 | 12.7% | 4.4%(+8.29)#29 | 4.1%(+8.56)#740 |
| 30. | 12042 | 12.7% | 4.4%(+8.26)#30 | 4.1%(+8.54)#743 |
| 31. | 14614 | 12.5% | 4.4%(+8.09)#31 | 4.1%(+8.36)#760 |
| 32. | 12491 | 12.1% | 4.4%(+7.71)#32 | 4.1%(+7.99)#800 |
| 33. | 12424 | 12.1% | 4.4%(+7.71)#33 | 4.1%(+7.99)#803 |
| 34. | 13072 | 12.1% | 4.4%(+7.68)#34 | 4.1%(+7.96)#807 |
| 35. | 12121 | 11.9% | 4.4%(+7.51)#35 | 4.1%(+7.79)#834 |
| 36. | 14516 | 11.8% | 4.4%(+7.43)#36 | 4.1%(+7.70)#842 |
| 37. | 14819 | 11.8% | 4.4%(+7.35)#37 | 4.1%(+7.63)#853 |
| 38. | 10505 | 11.7% | 4.4%(+7.33)#38 | 4.1%(+7.61)#861 |
| 39. | 14729 | 11.7% | 4.4%(+7.24)#39 | 4.1%(+7.52)#870 |
| 40. | 14082 | 11.6% | 4.4%(+7.20)#40 | 4.1%(+7.48)#876 |
| 41. | 12764 | 11.5% | 4.4%(+7.09)#41 | 4.1%(+7.37)#895 |
| 42. | 14769 | 11.4% | 4.4%(+7.02)#42 | 4.1%(+7.29)#910 |
| 43. | 13464 | 11.3% | 4.4%(+6.85)#43 | 4.1%(+7.13)#931 |
| 44. | 10039 | 11.3% | 4.4%(+6.85)#44 | 4.1%(+7.12)#935 |
| 45. | 14802 | 11.1% | 4.4%(+6.70)#45 | 4.1%(+6.98)#948 |
| 46. | 14855 | 11.1% | 4.4%(+6.70)#46 | 4.1%(+6.98)#955 |
| 47. | 13606 | 11.0% | 4.4%(+6.56)#47 | 4.1%(+6.84)#986 |
| 48. | 14510 | 10.9% | 4.4%(+6.47)#48 | 4.1%(+6.74)#998 |
| 49. | 11211 | 10.7% | 4.4%(+6.31)#49 | 4.1%(+6.58)#1,020 |
| 50. | 12950 | 10.7% | 4.4%(+6.30)#50 | 4.1%(+6.58)#1,023 |
| 51. | 10069 | 10.7% | 4.4%(+6.27)#51 | 4.1%(+6.55)#1,031 |
| 52. | 13648 | 10.6% | 4.4%(+6.17)#52 | 4.1%(+6.45)#1,046 |
| 53. | 12433 | 10.6% | 4.4%(+6.17)#53 | 4.1%(+6.45)#1,047 |
| 54. | 11956 | 10.6% | 4.4%(+6.15)#54 | 4.1%(+6.42)#1,050 |
| 55. | 10030 | 10.5% | 4.4%(+6.11)#55 | 4.1%(+6.39)#1,057 |
| 56. | 12431 | 10.5% | 4.4%(+6.09)#56 | 4.1%(+6.36)#1,060 |
| 57. | 13415 | 10.3% | 4.4%(+5.93)#57 | 4.1%(+6.21)#1,080 |
| 58. | 12922 | 10.0% | 4.4%(+5.59)#58 | 4.1%(+5.86)#1,151 |
| 59. | 11216 | 10.0% | 4.4%(+5.54)#59 | 4.1%(+5.82)#1,160 |
| 60. | 14081 | 9.8% | 4.4%(+5.35)#60 | 4.1%(+5.63)#1,202 |
| 61. | 12531 | 9.8% | 4.4%(+5.34)#61 | 4.1%(+5.62)#1,205 |
| 62. | 12513 | 9.6% | 4.4%(+5.20)#62 | 4.1%(+5.48)#1,237 |
| 63. | 12305 | 9.6% | 4.4%(+5.17)#63 | 4.1%(+5.45)#1,245 |
| 64. | 11206 | 9.5% | 4.4%(+5.10)#64 | 4.1%(+5.38)#1,263 |
| 65. | 12547 | 9.5% | 4.4%(+5.07)#65 | 4.1%(+5.35)#1,274 |
| 66. | 13757 | 9.4% | 4.4%(+5.01)#66 | 4.1%(+5.28)#1,294 |
| 67. | 12534 | 9.4% | 4.4%(+5.00)#67 | 4.1%(+5.28)#1,295 |
| 68. | 12455 | 9.3% | 4.4%(+4.91)#68 | 4.1%(+5.19)#1,321 |
| 69. | 14858 | 9.3% | 4.4%(+4.89)#69 | 4.1%(+5.17)#1,328 |
| 70. | 12428 | 9.3% | 4.4%(+4.88)#70 | 4.1%(+5.16)#1,330 |
| 71. | 13028 | 9.2% | 4.4%(+4.79)#71 | 4.1%(+5.07)#1,360 |
| 72. | 14204 | 9.2% | 4.4%(+4.78)#72 | 4.1%(+5.06)#1,361 |
| 73. | 10548 | 9.2% | 4.4%(+4.77)#73 | 4.1%(+5.05)#1,364 |
| 74. | 11751 | 9.1% | 4.4%(+4.68)#74 | 4.1%(+4.96)#1,396 |
| 75. | 13679 | 9.1% | 4.4%(+4.68)#75 | 4.1%(+4.96)#1,400 |
| 76. | 11103 | 9.1% | 4.4%(+4.66)#76 | 4.1%(+4.93)#1,413 |
| 77. | 12521 | 9.1% | 4.4%(+4.65)#77 | 4.1%(+4.92)#1,415 |
| 78. | 13731 | 9.0% | 4.4%(+4.62)#78 | 4.1%(+4.90)#1,425 |
| 79. | 11222 | 9.0% | 4.4%(+4.60)#79 | 4.1%(+4.88)#1,429 |
| 80. | 13407 | 9.0% | 4.4%(+4.58)#80 | 4.1%(+4.86)#1,440 |
| 81. | 12789 | 9.0% | 4.4%(+4.54)#81 | 4.1%(+4.82)#1,453 |
| 82. | 14591 | 8.9% | 4.4%(+4.53)#82 | 4.1%(+4.81)#1,456 |
| 83. | 12583 | 8.9% | 4.4%(+4.51)#83 | 4.1%(+4.79)#1,467 |
| 84. | 14781 | 8.8% | 4.4%(+4.44)#84 | 4.1%(+4.71)#1,489 |
| 85. | 14814 | 8.8% | 4.4%(+4.39)#85 | 4.1%(+4.67)#1,510 |
| 86. | 11205 | 8.8% | 4.4%(+4.38)#86 | 4.1%(+4.66)#1,515 |
| 87. | 12765 | 8.7% | 4.4%(+4.26)#87 | 4.1%(+4.53)#1,568 |
| 88. | 14030 | 8.7% | 4.4%(+4.25)#88 | 4.1%(+4.53)#1,570 |
| 89. | 10005 | 8.5% | 4.4%(+4.11)#89 | 4.1%(+4.39)#1,623 |
| 90. | 13316 | 8.5% | 4.4%(+4.05)#90 | 4.1%(+4.32)#1,648 |
| 91. | 11249 | 8.5% | 4.4%(+4.04)#91 | 4.1%(+4.32)#1,650 |
| 92. | 10036 | 8.4% | 4.4%(+4.01)#92 | 4.1%(+4.29)#1,673 |
| 93. | 14716 | 8.4% | 4.4%(+3.99)#93 | 4.1%(+4.27)#1,678 |
| 94. | 12809 | 8.4% | 4.4%(+3.95)#94 | 4.1%(+4.23)#1,690 |
| 95. | 12783 | 8.3% | 4.4%(+3.92)#95 | 4.1%(+4.20)#1,705 |
| 96. | 12189 | 8.3% | 4.4%(+3.91)#96 | 4.1%(+4.19)#1,726 |
| 97. | 14047 | 8.3% | 4.4%(+3.84)#97 | 4.1%(+4.12)#1,745 |
| 98. | 10026 | 8.2% | 4.4%(+3.76)#98 | 4.1%(+4.04)#1,780 |
| 99. | 10010 | 8.2% | 4.4%(+3.75)#99 | 4.1%(+4.03)#1,786 |
| 100. | 13304 | 8.1% | 4.4%(+3.72)#100 | 4.1%(+3.99)#1,804 |
Common Questions
What are the Top 10 Zip Codes with the Highest Percentage of Population with a Degree in Communications in New York?
Top 10 Zip Codes with the Highest Percentage of Population with a Degree in Communications in New York are:
What zip code has the Highest Percentage of Population with a Degree in Communications in New York?
10985 has the Highest Percentage of Population with a Degree in Communications in New York with 100.0%.
What is the Percentage of Population with a Degree in Communications in the State of New York?
Percentage of Population with a Degree in Communications in New York is 4.4%.
What is the Percentage of Population with a Degree in Communications in the United States?
Percentage of Population with a Degree in Communications in the United States is 4.1%.