Zip Codes with the Highest Percentage of Population with a Degree in Literature and Languages in New York
RELATED REPORTS & OPTIONS
Literature and Languages
New York
Compare Zip Codes
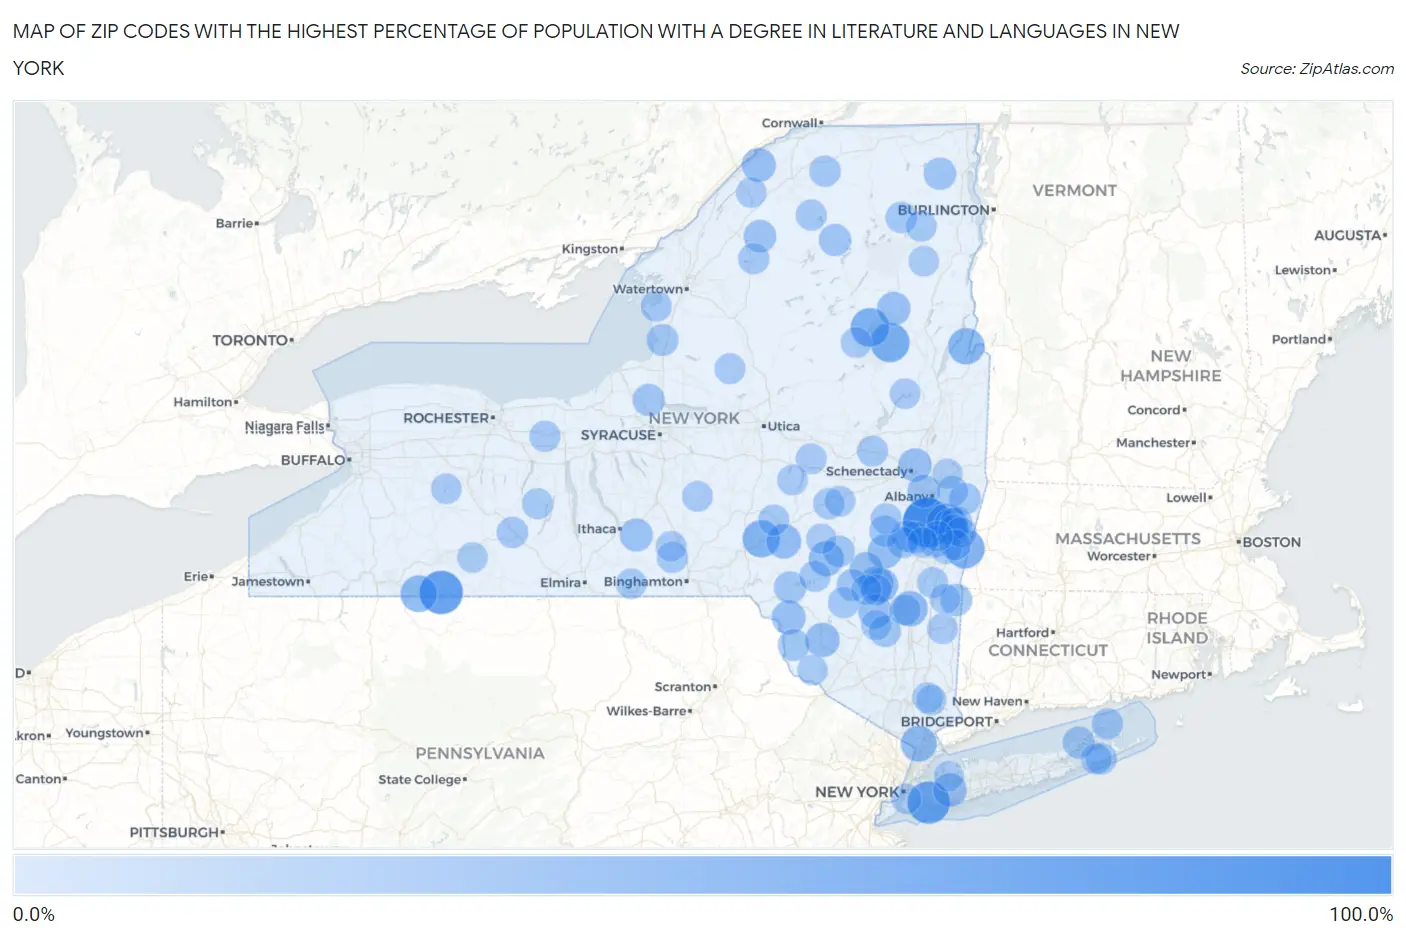
Map of Zip Codes with the Highest Percentage of Population with a Degree in Literature and Languages in New York
0.0%
100.0%
Zip Codes with the Highest Percentage of Population with a Degree in Literature and Languages in New York
| Zip Code | % Graduates | vs State | vs National | |
| 1. | 12045 | 100.0% | 5.9%(+94.1)#1 | 4.4%(+95.6)#4 |
| 2. | 14708 | 71.4% | 5.9%(+65.5)#2 | 4.4%(+67.0)#32 |
| 3. | 11430 | 66.7% | 5.9%(+60.8)#3 | 4.4%(+62.3)#36 |
| 4. | 12132 | 55.4% | 5.9%(+49.5)#4 | 4.4%(+51.0)#47 |
| 5. | 12856 | 52.8% | 5.9%(+47.0)#5 | 4.4%(+48.4)#53 |
| 6. | 12017 | 52.7% | 5.9%(+46.8)#6 | 4.4%(+48.3)#54 |
| 7. | 12864 | 50.0% | 5.9%(+44.1)#7 | 4.4%(+45.6)#81 |
| 8. | 13859 | 43.8% | 5.9%(+37.9)#8 | 4.4%(+39.3)#101 |
| 9. | 14721 | 41.2% | 5.9%(+35.3)#9 | 4.4%(+36.8)#113 |
| 10. | 12819 | 40.0% | 5.9%(+34.1)#10 | 4.4%(+35.6)#117 |
| 11. | 10503 | 37.9% | 5.9%(+32.0)#11 | 4.4%(+33.5)#132 |
| 12. | 12574 | 35.6% | 5.9%(+29.7)#12 | 4.4%(+31.2)#144 |
| 13. | 12459 | 33.3% | 5.9%(+27.4)#13 | 4.4%(+28.9)#169 |
| 14. | 13846 | 32.5% | 5.9%(+26.6)#14 | 4.4%(+28.0)#179 |
| 15. | 12495 | 31.6% | 5.9%(+25.7)#15 | 4.4%(+27.2)#188 |
| 16. | 12742 | 31.2% | 5.9%(+25.4)#16 | 4.4%(+26.8)#191 |
| 17. | 12439 | 30.6% | 5.9%(+24.7)#17 | 4.4%(+26.2)#197 |
| 18. | 12115 | 29.0% | 5.9%(+23.1)#18 | 4.4%(+24.6)#211 |
| 19. | 13658 | 29.0% | 5.9%(+23.1)#19 | 4.4%(+24.6)#212 |
| 20. | 12448 | 28.9% | 5.9%(+23.0)#20 | 4.4%(+24.5)#214 |
| 21. | 12736 | 28.8% | 5.9%(+22.9)#21 | 4.4%(+24.4)#216 |
| 22. | 12461 | 28.7% | 5.9%(+22.8)#22 | 4.4%(+24.3)#219 |
| 23. | 11549 | 28.0% | 5.9%(+22.1)#23 | 4.4%(+23.6)#229 |
| 24. | 12851 | 27.5% | 5.9%(+21.6)#24 | 4.4%(+23.0)#244 |
| 25. | 12008 | 26.7% | 5.9%(+20.8)#25 | 4.4%(+22.3)#263 |
| 26. | 12492 | 26.7% | 5.9%(+20.8)#26 | 4.4%(+22.3)#265 |
| 27. | 14881 | 25.0% | 5.9%(+19.1)#27 | 4.4%(+20.6)#310 |
| 28. | 12222 | 24.4% | 5.9%(+18.5)#28 | 4.4%(+20.0)#324 |
| 29. | 12174 | 23.1% | 5.9%(+17.2)#29 | 4.4%(+18.7)#355 |
| 30. | 13635 | 22.9% | 5.9%(+17.0)#30 | 4.4%(+18.5)#361 |
| 31. | 12918 | 22.3% | 5.9%(+16.4)#31 | 4.4%(+17.9)#384 |
| 32. | 13132 | 21.7% | 5.9%(+15.8)#32 | 4.4%(+17.3)#408 |
| 33. | 13755 | 21.6% | 5.9%(+15.8)#33 | 4.4%(+17.2)#410 |
| 34. | 11958 | 21.5% | 5.9%(+15.6)#34 | 4.4%(+17.0)#415 |
| 35. | 12973 | 21.4% | 5.9%(+15.5)#35 | 4.4%(+17.0)#421 |
| 36. | 12546 | 20.9% | 5.9%(+15.0)#36 | 4.4%(+16.5)#443 |
| 37. | 12024 | 20.7% | 5.9%(+14.8)#37 | 4.4%(+16.3)#452 |
| 38. | 13145 | 20.3% | 5.9%(+14.4)#38 | 4.4%(+15.9)#462 |
| 39. | 12410 | 20.0% | 5.9%(+14.1)#39 | 4.4%(+15.6)#472 |
| 40. | 12726 | 19.9% | 5.9%(+14.0)#40 | 4.4%(+15.5)#485 |
| 41. | 12042 | 19.7% | 5.9%(+13.8)#41 | 4.4%(+15.3)#492 |
| 42. | 12474 | 19.6% | 5.9%(+13.7)#42 | 4.4%(+15.2)#494 |
| 43. | 12440 | 19.4% | 5.9%(+13.5)#43 | 4.4%(+15.0)#507 |
| 44. | 12153 | 19.2% | 5.9%(+13.3)#44 | 4.4%(+14.8)#511 |
| 45. | 12176 | 18.6% | 5.9%(+12.7)#45 | 4.4%(+14.2)#542 |
| 46. | 12913 | 18.3% | 5.9%(+12.4)#46 | 4.4%(+13.9)#559 |
| 47. | 12725 | 18.3% | 5.9%(+12.4)#47 | 4.4%(+13.9)#560 |
| 48. | 12965 | 18.2% | 5.9%(+12.3)#48 | 4.4%(+13.8)#566 |
| 49. | 14809 | 18.1% | 5.9%(+12.2)#49 | 4.4%(+13.7)#572 |
| 50. | 11962 | 17.8% | 5.9%(+11.9)#50 | 4.4%(+13.4)#585 |
| 51. | 12460 | 17.6% | 5.9%(+11.7)#51 | 4.4%(+13.2)#593 |
| 52. | 11957 | 17.5% | 5.9%(+11.7)#52 | 4.4%(+13.1)#595 |
| 53. | 12431 | 17.5% | 5.9%(+11.6)#53 | 4.4%(+13.1)#599 |
| 54. | 12064 | 17.2% | 5.9%(+11.3)#54 | 4.4%(+12.8)#619 |
| 55. | 13731 | 17.2% | 5.9%(+11.3)#55 | 4.4%(+12.8)#624 |
| 56. | 13648 | 17.2% | 5.9%(+11.3)#56 | 4.4%(+12.7)#625 |
| 57. | 14537 | 16.7% | 5.9%(+10.8)#57 | 4.4%(+12.3)#658 |
| 58. | 13687 | 16.5% | 5.9%(+10.6)#58 | 4.4%(+12.1)#666 |
| 59. | 13802 | 16.4% | 5.9%(+10.5)#59 | 4.4%(+11.9)#683 |
| 60. | 12069 | 16.3% | 5.9%(+10.4)#60 | 4.4%(+11.9)#686 |
| 61. | 12140 | 16.1% | 5.9%(+10.2)#61 | 4.4%(+11.7)#710 |
| 62. | 11932 | 16.1% | 5.9%(+10.2)#62 | 4.4%(+11.7)#715 |
| 63. | 12147 | 16.0% | 5.9%(+10.2)#63 | 4.4%(+11.6)#717 |
| 64. | 13651 | 16.0% | 5.9%(+10.1)#64 | 4.4%(+11.6)#719 |
| 65. | 12417 | 16.0% | 5.9%(+10.1)#65 | 4.4%(+11.6)#722 |
| 66. | 13861 | 15.9% | 5.9%(+10.1)#66 | 4.4%(+11.5)#726 |
| 67. | 14418 | 15.9% | 5.9%(+10.0)#67 | 4.4%(+11.5)#729 |
| 68. | 12523 | 15.9% | 5.9%(+10.0)#68 | 4.4%(+11.5)#733 |
| 69. | 12545 | 15.6% | 5.9%(+9.71)#69 | 4.4%(+11.2)#763 |
| 70. | 12457 | 15.6% | 5.9%(+9.67)#70 | 4.4%(+11.2)#766 |
| 71. | 12164 | 15.6% | 5.9%(+9.66)#71 | 4.4%(+11.1)#768 |
| 72. | 12136 | 15.4% | 5.9%(+9.52)#72 | 4.4%(+11.0)#780 |
| 73. | 13475 | 15.4% | 5.9%(+9.49)#73 | 4.4%(+11.0)#785 |
| 74. | 12997 | 15.4% | 5.9%(+9.47)#74 | 4.4%(+11.0)#787 |
| 75. | 13489 | 15.3% | 5.9%(+9.36)#75 | 4.4%(+10.8)#796 |
| 76. | 12075 | 15.1% | 5.9%(+9.15)#76 | 4.4%(+10.6)#807 |
| 77. | 12149 | 15.0% | 5.9%(+9.13)#77 | 4.4%(+10.6)#809 |
| 78. | 13124 | 15.0% | 5.9%(+9.10)#78 | 4.4%(+10.6)#815 |
| 79. | 13337 | 14.6% | 5.9%(+8.73)#79 | 4.4%(+10.2)#860 |
| 80. | 12060 | 14.6% | 5.9%(+8.70)#80 | 4.4%(+10.2)#864 |
| 81. | 12037 | 14.5% | 5.9%(+8.63)#81 | 4.4%(+10.1)#871 |
| 82. | 13797 | 14.5% | 5.9%(+8.56)#82 | 4.4%(+10.0)#876 |
| 83. | 12835 | 14.3% | 5.9%(+8.43)#83 | 4.4%(+9.92)#888 |
| 84. | 14549 | 14.3% | 5.9%(+8.39)#84 | 4.4%(+9.88)#898 |
| 85. | 13680 | 14.2% | 5.9%(+8.29)#85 | 4.4%(+9.78)#906 |
| 86. | 12106 | 14.2% | 5.9%(+8.27)#86 | 4.4%(+9.76)#908 |
| 87. | 14802 | 14.1% | 5.9%(+8.23)#87 | 4.4%(+9.71)#914 |
| 88. | 12943 | 14.0% | 5.9%(+8.14)#88 | 4.4%(+9.63)#924 |
| 89. | 13734 | 13.9% | 5.9%(+8.04)#89 | 4.4%(+9.53)#932 |
| 90. | 12051 | 13.7% | 5.9%(+7.85)#90 | 4.4%(+9.33)#945 |
| 91. | 10535 | 13.7% | 5.9%(+7.79)#91 | 4.4%(+9.27)#950 |
| 92. | 11548 | 13.6% | 5.9%(+7.73)#92 | 4.4%(+9.22)#965 |
| 93. | 12464 | 13.6% | 5.9%(+7.67)#93 | 4.4%(+9.16)#970 |
| 94. | 10527 | 13.2% | 5.9%(+7.32)#94 | 4.4%(+8.81)#1,020 |
| 95. | 12567 | 13.1% | 5.9%(+7.23)#95 | 4.4%(+8.72)#1,032 |
| 96. | 12737 | 13.1% | 5.9%(+7.23)#96 | 4.4%(+8.72)#1,033 |
| 97. | 12404 | 13.1% | 5.9%(+7.20)#97 | 4.4%(+8.69)#1,035 |
| 98. | 13842 | 13.1% | 5.9%(+7.19)#98 | 4.4%(+8.67)#1,037 |
| 99. | 12182 | 13.0% | 5.9%(+7.12)#99 | 4.4%(+8.61)#1,045 |
| 100. | 11215 | 13.0% | 5.9%(+7.11)#100 | 4.4%(+8.60)#1,048 |
Common Questions
What are the Top 10 Zip Codes with the Highest Percentage of Population with a Degree in Literature and Languages in New York?
Top 10 Zip Codes with the Highest Percentage of Population with a Degree in Literature and Languages in New York are:
What zip code has the Highest Percentage of Population with a Degree in Literature and Languages in New York?
12045 has the Highest Percentage of Population with a Degree in Literature and Languages in New York with 100.0%.
What is the Percentage of Population with a Degree in Literature and Languages in the State of New York?
Percentage of Population with a Degree in Literature and Languages in New York is 5.9%.
What is the Percentage of Population with a Degree in Literature and Languages in the United States?
Percentage of Population with a Degree in Literature and Languages in the United States is 4.4%.