Zip Codes with the Highest Percentage of Population Enrolled in Nursery / Preschool in New York
RELATED REPORTS & OPTIONS
Nursery / Preschool
New York
Compare Zip Codes
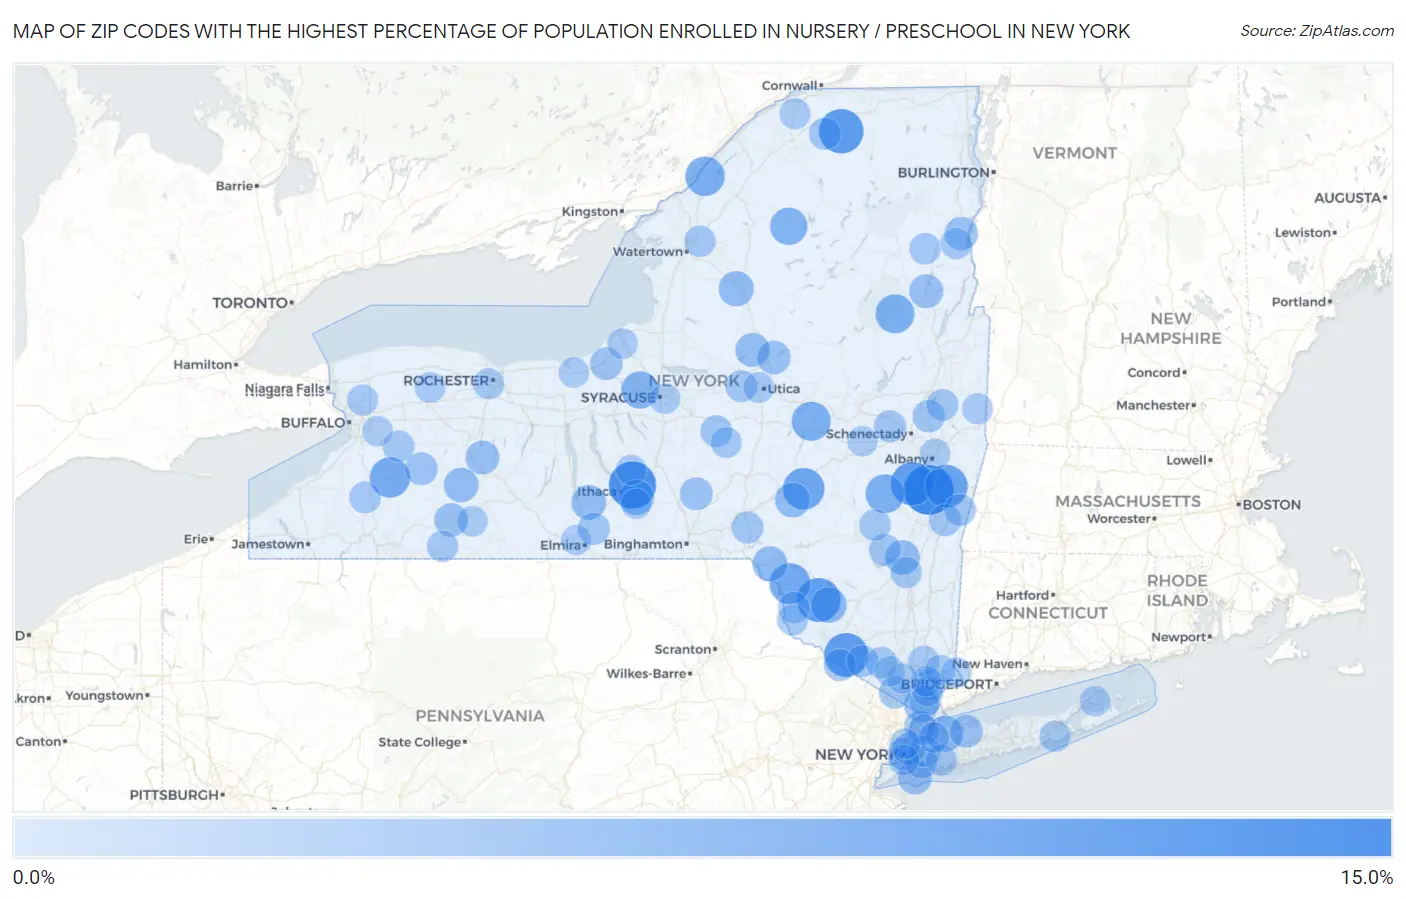
Map of Zip Codes with the Highest Percentage of Population Enrolled in Nursery / Preschool in New York
0.0%
15.0%
Zip Codes with the Highest Percentage of Population Enrolled in Nursery / Preschool in New York
| Zip Code | % in Nursery | vs State | vs National | |
| 1. | 12124 | 13.6% | 1.5%(+12.1)#1 | 1.4%(+12.1)#66 |
| 2. | 13062 | 12.3% | 1.5%(+10.8)#2 | 1.4%(+10.8)#82 |
| 3. | 12930 | 10.8% | 1.5%(+9.25)#3 | 1.4%(+9.31)#108 |
| 4. | 10933 | 10.5% | 1.5%(+8.97)#4 | 1.4%(+9.03)#117 |
| 5. | 12734 | 10.3% | 1.5%(+8.83)#5 | 1.4%(+8.89)#124 |
| 6. | 12007 | 10.2% | 1.5%(+8.65)#6 | 1.4%(+8.71)#129 |
| 7. | 12132 | 9.8% | 1.5%(+8.27)#7 | 1.4%(+8.33)#145 |
| 8. | 13751 | 9.1% | 1.5%(+7.58)#8 | 1.4%(+7.64)#180 |
| 9. | 12767 | 8.7% | 1.5%(+7.23)#9 | 1.4%(+7.29)#200 |
| 10. | 14134 | 8.3% | 1.5%(+6.83)#10 | 1.4%(+6.89)#214 |
| 11. | 13623 | 7.8% | 1.5%(+6.34)#11 | 1.4%(+6.40)#239 |
| 12. | 13475 | 7.7% | 1.5%(+6.19)#12 | 1.4%(+6.24)#249 |
| 13. | 12811 | 7.6% | 1.5%(+6.05)#13 | 1.4%(+6.11)#257 |
| 14. | 12460 | 7.5% | 1.5%(+6.02)#14 | 1.4%(+6.08)#259 |
| 15. | 13690 | 6.7% | 1.5%(+5.20)#15 | 1.4%(+5.26)#333 |
| 16. | 13164 | 6.7% | 1.5%(+5.18)#16 | 1.4%(+5.24)#337 |
| 17. | 11579 | 6.0% | 1.5%(+4.45)#17 | 1.4%(+4.51)#431 |
| 18. | 12751 | 5.9% | 1.5%(+4.38)#18 | 1.4%(+4.43)#449 |
| 19. | 14881 | 5.6% | 1.5%(+4.09)#19 | 1.4%(+4.15)#501 |
| 20. | 13404 | 5.5% | 1.5%(+4.00)#20 | 1.4%(+4.06)#516 |
| 21. | 13806 | 5.4% | 1.5%(+3.90)#21 | 1.4%(+3.96)#548 |
| 22. | 13774 | 5.4% | 1.5%(+3.90)#22 | 1.4%(+3.96)#549 |
| 23. | 14869 | 5.3% | 1.5%(+3.76)#23 | 1.4%(+3.82)#584 |
| 24. | 14884 | 5.2% | 1.5%(+3.72)#24 | 1.4%(+3.78)#595 |
| 25. | 12475 | 5.2% | 1.5%(+3.71)#25 | 1.4%(+3.77)#596 |
| 26. | 10533 | 5.1% | 1.5%(+3.64)#26 | 1.4%(+3.70)#608 |
| 27. | 13486 | 5.0% | 1.5%(+3.47)#27 | 1.4%(+3.52)#649 |
| 28. | 12860 | 4.9% | 1.5%(+3.41)#28 | 1.4%(+3.47)#665 |
| 29. | 11697 | 4.9% | 1.5%(+3.35)#29 | 1.4%(+3.41)#689 |
| 30. | 14545 | 4.8% | 1.5%(+3.30)#30 | 1.4%(+3.36)#700 |
| 31. | 13435 | 4.7% | 1.5%(+3.22)#31 | 1.4%(+3.28)#723 |
| 32. | 14813 | 4.7% | 1.5%(+3.20)#32 | 1.4%(+3.26)#733 |
| 33. | 12956 | 4.6% | 1.5%(+3.14)#33 | 1.4%(+3.20)#756 |
| 34. | 11724 | 4.5% | 1.5%(+2.98)#34 | 1.4%(+3.04)#832 |
| 35. | 13841 | 4.3% | 1.5%(+2.82)#35 | 1.4%(+2.88)#910 |
| 36. | 14024 | 4.3% | 1.5%(+2.78)#36 | 1.4%(+2.84)#935 |
| 37. | 13111 | 4.2% | 1.5%(+2.67)#37 | 1.4%(+2.73)#987 |
| 38. | 10007 | 4.1% | 1.5%(+2.57)#38 | 1.4%(+2.63)#1,039 |
| 39. | 12151 | 4.0% | 1.5%(+2.53)#39 | 1.4%(+2.59)#1,064 |
| 40. | 10952 | 3.9% | 1.5%(+2.41)#40 | 1.4%(+2.47)#1,143 |
| 41. | 12565 | 3.9% | 1.5%(+2.38)#41 | 1.4%(+2.43)#1,165 |
| 42. | 14816 | 3.9% | 1.5%(+2.36)#42 | 1.4%(+2.42)#1,174 |
| 43. | 11414 | 3.9% | 1.5%(+2.34)#43 | 1.4%(+2.40)#1,187 |
| 44. | 10988 | 3.8% | 1.5%(+2.32)#44 | 1.4%(+2.37)#1,207 |
| 45. | 12137 | 3.8% | 1.5%(+2.31)#45 | 1.4%(+2.37)#1,208 |
| 46. | 12965 | 3.8% | 1.5%(+2.31)#46 | 1.4%(+2.37)#1,211 |
| 47. | 10921 | 3.8% | 1.5%(+2.30)#47 | 1.4%(+2.36)#1,229 |
| 48. | 13804 | 3.8% | 1.5%(+2.28)#48 | 1.4%(+2.34)#1,242 |
| 49. | 13334 | 3.8% | 1.5%(+2.27)#49 | 1.4%(+2.33)#1,250 |
| 50. | 12409 | 3.7% | 1.5%(+2.23)#50 | 1.4%(+2.29)#1,282 |
| 51. | 12170 | 3.7% | 1.5%(+2.21)#51 | 1.4%(+2.27)#1,297 |
| 52. | 11109 | 3.7% | 1.5%(+2.19)#52 | 1.4%(+2.25)#1,319 |
| 53. | 13490 | 3.7% | 1.5%(+2.16)#53 | 1.4%(+2.22)#1,337 |
| 54. | 12165 | 3.7% | 1.5%(+2.16)#54 | 1.4%(+2.22)#1,343 |
| 55. | 14729 | 3.6% | 1.5%(+2.10)#55 | 1.4%(+2.16)#1,405 |
| 56. | 12442 | 3.6% | 1.5%(+2.08)#56 | 1.4%(+2.14)#1,415 |
| 57. | 10950 | 3.6% | 1.5%(+2.05)#57 | 1.4%(+2.11)#1,451 |
| 58. | 14145 | 3.5% | 1.5%(+2.03)#58 | 1.4%(+2.09)#1,465 |
| 59. | 12726 | 3.5% | 1.5%(+2.03)#59 | 1.4%(+2.09)#1,471 |
| 60. | 10470 | 3.5% | 1.5%(+2.01)#60 | 1.4%(+2.07)#1,483 |
| 61. | 11367 | 3.5% | 1.5%(+2.01)#61 | 1.4%(+2.07)#1,484 |
| 62. | 12855 | 3.5% | 1.5%(+2.01)#62 | 1.4%(+2.07)#1,488 |
| 63. | 12466 | 3.5% | 1.5%(+2.00)#63 | 1.4%(+2.06)#1,502 |
| 64. | 13603 | 3.5% | 1.5%(+1.99)#64 | 1.4%(+2.05)#1,509 |
| 65. | 10514 | 3.5% | 1.5%(+1.98)#65 | 1.4%(+2.04)#1,519 |
| 66. | 11977 | 3.4% | 1.5%(+1.87)#66 | 1.4%(+1.93)#1,649 |
| 67. | 14707 | 3.4% | 1.5%(+1.86)#67 | 1.4%(+1.92)#1,661 |
| 68. | 12960 | 3.4% | 1.5%(+1.86)#68 | 1.4%(+1.92)#1,665 |
| 69. | 11565 | 3.4% | 1.5%(+1.85)#69 | 1.4%(+1.91)#1,675 |
| 70. | 14619 | 3.3% | 1.5%(+1.80)#70 | 1.4%(+1.86)#1,726 |
| 71. | 13332 | 3.3% | 1.5%(+1.77)#71 | 1.4%(+1.83)#1,762 |
| 72. | 10588 | 3.3% | 1.5%(+1.76)#72 | 1.4%(+1.82)#1,763 |
| 73. | 10523 | 3.3% | 1.5%(+1.76)#73 | 1.4%(+1.82)#1,767 |
| 74. | 14068 | 3.3% | 1.5%(+1.76)#74 | 1.4%(+1.82)#1,768 |
| 75. | 12764 | 3.3% | 1.5%(+1.76)#75 | 1.4%(+1.81)#1,774 |
| 76. | 12057 | 3.2% | 1.5%(+1.71)#76 | 1.4%(+1.77)#1,848 |
| 77. | 13495 | 3.2% | 1.5%(+1.69)#77 | 1.4%(+1.75)#1,871 |
| 78. | 13667 | 3.2% | 1.5%(+1.67)#78 | 1.4%(+1.73)#1,897 |
| 79. | 10475 | 3.1% | 1.5%(+1.61)#79 | 1.4%(+1.67)#2,009 |
| 80. | 13115 | 3.1% | 1.5%(+1.60)#80 | 1.4%(+1.66)#2,022 |
| 81. | 11024 | 3.1% | 1.5%(+1.60)#81 | 1.4%(+1.65)#2,032 |
| 82. | 11231 | 3.1% | 1.5%(+1.58)#82 | 1.4%(+1.64)#2,064 |
| 83. | 10570 | 3.0% | 1.5%(+1.54)#83 | 1.4%(+1.60)#2,112 |
| 84. | 11964 | 3.0% | 1.5%(+1.54)#84 | 1.4%(+1.60)#2,119 |
| 85. | 13073 | 3.0% | 1.5%(+1.53)#85 | 1.4%(+1.59)#2,131 |
| 86. | 14803 | 3.0% | 1.5%(+1.53)#86 | 1.4%(+1.59)#2,134 |
| 87. | 14058 | 3.0% | 1.5%(+1.52)#87 | 1.4%(+1.58)#2,140 |
| 88. | 10069 | 3.0% | 1.5%(+1.51)#88 | 1.4%(+1.57)#2,160 |
| 89. | 10546 | 3.0% | 1.5%(+1.50)#89 | 1.4%(+1.56)#2,180 |
| 90. | 12204 | 3.0% | 1.5%(+1.50)#90 | 1.4%(+1.56)#2,191 |
| 91. | 14059 | 3.0% | 1.5%(+1.49)#91 | 1.4%(+1.54)#2,214 |
| 92. | 14817 | 3.0% | 1.5%(+1.48)#92 | 1.4%(+1.54)#2,216 |
| 93. | 13224 | 3.0% | 1.5%(+1.46)#93 | 1.4%(+1.52)#2,257 |
| 94. | 10984 | 3.0% | 1.5%(+1.45)#94 | 1.4%(+1.51)#2,282 |
| 95. | 14516 | 3.0% | 1.5%(+1.45)#95 | 1.4%(+1.51)#2,284 |
| 96. | 12160 | 3.0% | 1.5%(+1.45)#96 | 1.4%(+1.51)#2,293 |
| 97. | 10536 | 2.9% | 1.5%(+1.43)#97 | 1.4%(+1.49)#2,346 |
| 98. | 14903 | 2.9% | 1.5%(+1.42)#98 | 1.4%(+1.48)#2,361 |
| 99. | 10926 | 2.9% | 1.5%(+1.42)#99 | 1.4%(+1.48)#2,364 |
| 100. | 10590 | 2.9% | 1.5%(+1.41)#100 | 1.4%(+1.47)#2,379 |
Common Questions
What are the Top 10 Zip Codes with the Highest Percentage of Population Enrolled in Nursery / Preschool in New York?
Top 10 Zip Codes with the Highest Percentage of Population Enrolled in Nursery / Preschool in New York are:
What zip code has the Highest Percentage of Population Enrolled in Nursery / Preschool in New York?
12124 has the Highest Percentage of Population Enrolled in Nursery / Preschool in New York with 13.6%.
What is the Percentage of Population Enrolled in Nursery / Preschool in the State of New York?
Percentage of Population Enrolled in Nursery / Preschool in New York is 1.5%.
What is the Percentage of Population Enrolled in Nursery / Preschool in the United States?
Percentage of Population Enrolled in Nursery / Preschool in the United States is 1.4%.