Zip Codes with the Highest Percentage of Population Employed in Sales & Related in New York
RELATED REPORTS & OPTIONS
Sales & Related
New York
Compare Zip Codes
Map of Zip Codes with the Highest Percentage of Population Employed in Sales & Related in New York
0.0%
100.0%
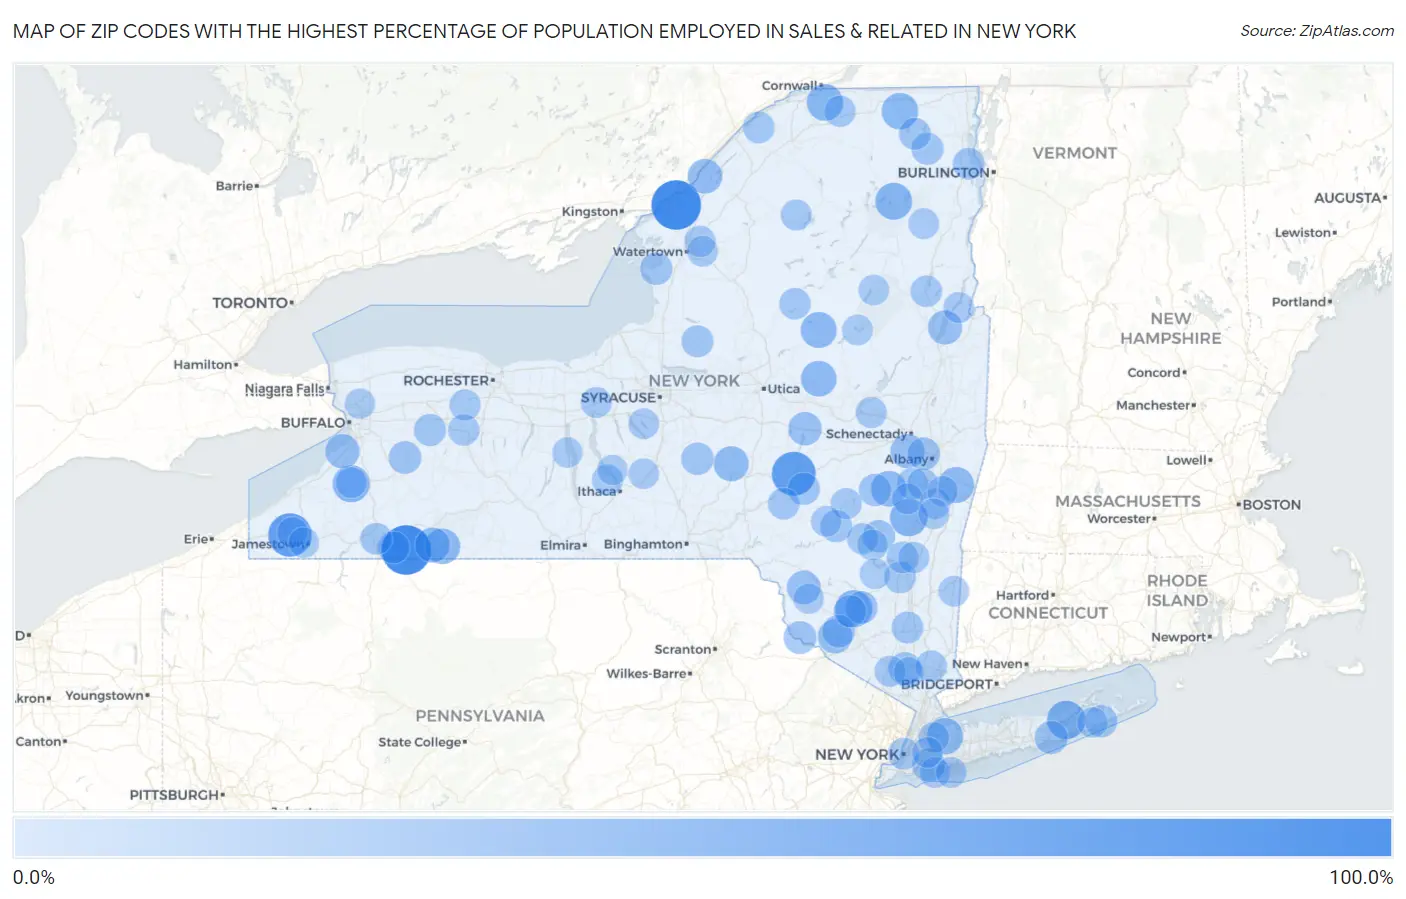
Zip Codes with the Highest Percentage of Population Employed in Sales & Related in New York
| Zip Code | % Employed | vs State | vs National | |
| 1. | 14788 | 100.0% | 9.0%(+91.0)#1 | 9.6%(+90.4)#14 |
| 2. | 13641 | 100.0% | 9.0%(+91.0)#2 | 9.6%(+90.4)#27 |
| 3. | 13834 | 75.6% | 9.0%(+66.6)#3 | 9.6%(+66.0)#48 |
| 4. | 14785 | 73.8% | 9.0%(+64.8)#4 | 9.6%(+64.3)#49 |
| 5. | 11970 | 52.6% | 9.0%(+43.6)#5 | 9.6%(+43.0)#89 |
| 6. | 12482 | 48.2% | 9.0%(+39.1)#6 | 9.6%(+38.6)#134 |
| 7. | 12483 | 46.7% | 9.0%(+37.6)#7 | 9.6%(+37.1)#147 |
| 8. | 14035 | 45.8% | 9.0%(+36.8)#8 | 9.6%(+36.2)#156 |
| 9. | 12977 | 45.5% | 9.0%(+36.4)#9 | 9.6%(+35.9)#158 |
| 10. | 13649 | 43.8% | 9.0%(+34.7)#10 | 9.6%(+34.2)#167 |
| 11. | 12915 | 43.3% | 9.0%(+34.3)#11 | 9.6%(+33.7)#169 |
| 12. | 11547 | 42.9% | 9.0%(+33.8)#12 | 9.6%(+33.3)#173 |
| 13. | 12024 | 40.9% | 9.0%(+31.9)#13 | 9.6%(+31.3)#191 |
| 14. | 13353 | 40.9% | 9.0%(+31.9)#14 | 9.6%(+31.3)#192 |
| 15. | 12120 | 39.9% | 9.0%(+30.8)#15 | 9.6%(+30.3)#208 |
| 16. | 13454 | 39.5% | 9.0%(+30.5)#16 | 9.6%(+30.0)#210 |
| 17. | 14707 | 39.3% | 9.0%(+30.3)#17 | 9.6%(+29.7)#212 |
| 18. | 13814 | 37.5% | 9.0%(+28.5)#18 | 9.6%(+27.9)#233 |
| 19. | 14774 | 37.2% | 9.0%(+28.1)#19 | 9.6%(+27.6)#235 |
| 20. | 13623 | 35.7% | 9.0%(+26.7)#20 | 9.6%(+26.1)#262 |
| 21. | 12729 | 34.5% | 9.0%(+25.5)#21 | 9.6%(+24.9)#282 |
| 22. | 14112 | 34.1% | 9.0%(+25.1)#22 | 9.6%(+24.6)#290 |
| 23. | 12844 | 33.6% | 9.0%(+24.6)#23 | 9.6%(+24.0)#300 |
| 24. | 12085 | 33.3% | 9.0%(+24.3)#24 | 9.6%(+23.7)#306 |
| 25. | 12791 | 32.1% | 9.0%(+23.1)#25 | 9.6%(+22.5)#341 |
| 26. | 13468 | 30.5% | 9.0%(+21.5)#26 | 9.6%(+20.9)#389 |
| 27. | 10986 | 29.2% | 9.0%(+20.2)#27 | 9.6%(+19.6)#428 |
| 28. | 11972 | 29.1% | 9.0%(+20.1)#28 | 9.6%(+19.5)#432 |
| 29. | 11430 | 28.9% | 9.0%(+19.9)#29 | 9.6%(+19.3)#438 |
| 30. | 12719 | 28.1% | 9.0%(+19.1)#30 | 9.6%(+18.5)#470 |
| 31. | 12785 | 27.8% | 9.0%(+18.8)#31 | 9.6%(+18.2)#483 |
| 32. | 14082 | 27.5% | 9.0%(+18.4)#32 | 9.6%(+17.9)#499 |
| 33. | 12222 | 27.4% | 9.0%(+18.4)#33 | 9.6%(+17.8)#504 |
| 34. | 12420 | 27.2% | 9.0%(+18.2)#34 | 9.6%(+17.6)#512 |
| 35. | 13124 | 27.0% | 9.0%(+18.0)#35 | 9.6%(+17.4)#520 |
| 36. | 13651 | 26.8% | 9.0%(+17.8)#36 | 9.6%(+17.2)#526 |
| 37. | 12469 | 26.7% | 9.0%(+17.6)#37 | 9.6%(+17.1)#534 |
| 38. | 12450 | 26.4% | 9.0%(+17.4)#38 | 9.6%(+16.8)#549 |
| 39. | 13751 | 26.3% | 9.0%(+17.2)#39 | 9.6%(+16.7)#554 |
| 40. | 11962 | 26.0% | 9.0%(+17.0)#40 | 9.6%(+16.4)#567 |
| 41. | 12769 | 25.9% | 9.0%(+16.9)#41 | 9.6%(+16.3)#571 |
| 42. | 12978 | 25.3% | 9.0%(+16.3)#42 | 9.6%(+15.7)#607 |
| 43. | 14039 | 25.0% | 9.0%(+16.0)#43 | 9.6%(+15.4)#638 |
| 44. | 12438 | 25.0% | 9.0%(+16.0)#44 | 9.6%(+15.4)#641 |
| 45. | 14778 | 24.5% | 9.0%(+15.5)#45 | 9.6%(+14.9)#686 |
| 46. | 12952 | 24.4% | 9.0%(+15.3)#46 | 9.6%(+14.8)#694 |
| 47. | 14748 | 24.0% | 9.0%(+15.0)#47 | 9.6%(+14.4)#712 |
| 48. | 13483 | 24.0% | 9.0%(+15.0)#48 | 9.6%(+14.4)#715 |
| 49. | 12512 | 24.0% | 9.0%(+15.0)#49 | 9.6%(+14.4)#716 |
| 50. | 12975 | 24.0% | 9.0%(+14.9)#50 | 9.6%(+14.4)#724 |
| 51. | 12411 | 23.8% | 9.0%(+14.8)#51 | 9.6%(+14.2)#736 |
| 52. | 12475 | 23.5% | 9.0%(+14.5)#52 | 9.6%(+13.9)#754 |
| 53. | 13658 | 23.5% | 9.0%(+14.4)#53 | 9.6%(+13.9)#759 |
| 54. | 10007 | 23.5% | 9.0%(+14.4)#54 | 9.6%(+13.9)#761 |
| 55. | 12860 | 23.1% | 9.0%(+14.1)#55 | 9.6%(+13.5)#781 |
| 56. | 10501 | 22.9% | 9.0%(+13.9)#56 | 9.6%(+13.3)#807 |
| 57. | 13846 | 22.9% | 9.0%(+13.9)#57 | 9.6%(+13.3)#809 |
| 58. | 12046 | 22.9% | 9.0%(+13.9)#58 | 9.6%(+13.3)#810 |
| 59. | 13420 | 22.8% | 9.0%(+13.7)#59 | 9.6%(+13.2)#823 |
| 60. | 12957 | 22.2% | 9.0%(+13.2)#60 | 9.6%(+12.6)#876 |
| 61. | 14539 | 21.6% | 9.0%(+12.6)#61 | 9.6%(+12.0)#950 |
| 62. | 13603 | 21.4% | 9.0%(+12.3)#62 | 9.6%(+11.8)#979 |
| 63. | 12177 | 21.2% | 9.0%(+12.2)#63 | 9.6%(+11.7)#987 |
| 64. | 12507 | 21.2% | 9.0%(+12.2)#64 | 9.6%(+11.6)#997 |
| 65. | 14511 | 21.2% | 9.0%(+12.1)#65 | 9.6%(+11.6)#998 |
| 66. | 14854 | 20.9% | 9.0%(+11.9)#66 | 9.6%(+11.3)#1,022 |
| 67. | 12480 | 20.8% | 9.0%(+11.8)#67 | 9.6%(+11.2)#1,040 |
| 68. | 12143 | 20.8% | 9.0%(+11.8)#68 | 9.6%(+11.2)#1,042 |
| 69. | 13666 | 20.8% | 9.0%(+11.8)#69 | 9.6%(+11.2)#1,046 |
| 70. | 10926 | 20.8% | 9.0%(+11.8)#70 | 9.6%(+11.2)#1,049 |
| 71. | 12434 | 20.7% | 9.0%(+11.7)#71 | 9.6%(+11.1)#1,054 |
| 72. | 13117 | 20.7% | 9.0%(+11.6)#72 | 9.6%(+11.1)#1,072 |
| 73. | 12176 | 20.2% | 9.0%(+11.2)#73 | 9.6%(+10.6)#1,129 |
| 74. | 12174 | 20.0% | 9.0%(+11.0)#74 | 9.6%(+10.4)#1,146 |
| 75. | 12841 | 20.0% | 9.0%(+11.0)#75 | 9.6%(+10.4)#1,161 |
| 76. | 14034 | 19.9% | 9.0%(+10.8)#76 | 9.6%(+10.3)#1,174 |
| 77. | 12943 | 19.9% | 9.0%(+10.8)#77 | 9.6%(+10.3)#1,177 |
| 78. | 12416 | 19.8% | 9.0%(+10.8)#78 | 9.6%(+10.2)#1,182 |
| 79. | 12108 | 19.8% | 9.0%(+10.7)#79 | 9.6%(+10.2)#1,186 |
| 80. | 13612 | 19.7% | 9.0%(+10.6)#80 | 9.6%(+10.1)#1,206 |
| 81. | 14712 | 19.5% | 9.0%(+10.5)#81 | 9.6%(+9.91)#1,237 |
| 82. | 11509 | 19.5% | 9.0%(+10.4)#82 | 9.6%(+9.87)#1,247 |
| 83. | 13110 | 19.4% | 9.0%(+10.4)#83 | 9.6%(+9.81)#1,261 |
| 84. | 12592 | 19.4% | 9.0%(+10.3)#84 | 9.6%(+9.77)#1,264 |
| 85. | 11569 | 19.3% | 9.0%(+10.3)#85 | 9.6%(+9.74)#1,271 |
| 86. | 12130 | 19.3% | 9.0%(+10.3)#86 | 9.6%(+9.68)#1,284 |
| 87. | 12459 | 19.2% | 9.0%(+10.2)#87 | 9.6%(+9.64)#1,295 |
| 88. | 13102 | 19.2% | 9.0%(+10.2)#88 | 9.6%(+9.64)#1,296 |
| 89. | 11024 | 19.0% | 9.0%(+10.0)#89 | 9.6%(+9.44)#1,333 |
| 90. | 12842 | 19.0% | 9.0%(+10.00)#90 | 9.6%(+9.43)#1,337 |
| 91. | 11439 | 19.0% | 9.0%(+9.98)#91 | 9.6%(+9.40)#1,342 |
| 92. | 12172 | 18.9% | 9.0%(+9.92)#92 | 9.6%(+9.35)#1,353 |
| 93. | 10596 | 18.9% | 9.0%(+9.92)#93 | 9.6%(+9.35)#1,355 |
| 94. | 11976 | 18.7% | 9.0%(+9.69)#94 | 9.6%(+9.12)#1,397 |
| 95. | 12461 | 18.7% | 9.0%(+9.65)#95 | 9.6%(+9.08)#1,405 |
| 96. | 14720 | 18.3% | 9.0%(+9.28)#96 | 9.6%(+8.71)#1,487 |
| 97. | 14441 | 18.3% | 9.0%(+9.25)#97 | 9.6%(+8.68)#1,496 |
| 98. | 14261 | 18.2% | 9.0%(+9.18)#98 | 9.6%(+8.61)#1,517 |
| 99. | 12783 | 18.2% | 9.0%(+9.17)#99 | 9.6%(+8.60)#1,518 |
| 100. | 14882 | 18.1% | 9.0%(+9.10)#100 | 9.6%(+8.53)#1,548 |
Common Questions
What are the Top 10 Zip Codes with the Highest Percentage of Population Employed in Sales & Related in New York?
Top 10 Zip Codes with the Highest Percentage of Population Employed in Sales & Related in New York are:
What zip code has the Highest Percentage of Population Employed in Sales & Related in New York?
14788 has the Highest Percentage of Population Employed in Sales & Related in New York with 100.0%.
What is the Percentage of Population Employed in Sales & Related in the State of New York?
Percentage of Population Employed in Sales & Related in New York is 9.0%.
What is the Percentage of Population Employed in Sales & Related in the United States?
Percentage of Population Employed in Sales & Related in the United States is 9.6%.