Zip Codes with the Highest Percentage of Self-Employed / Not Incorporated in New York
RELATED REPORTS & OPTIONS
Self-Employed / Not Incorporated
New York
Compare Zip Codes
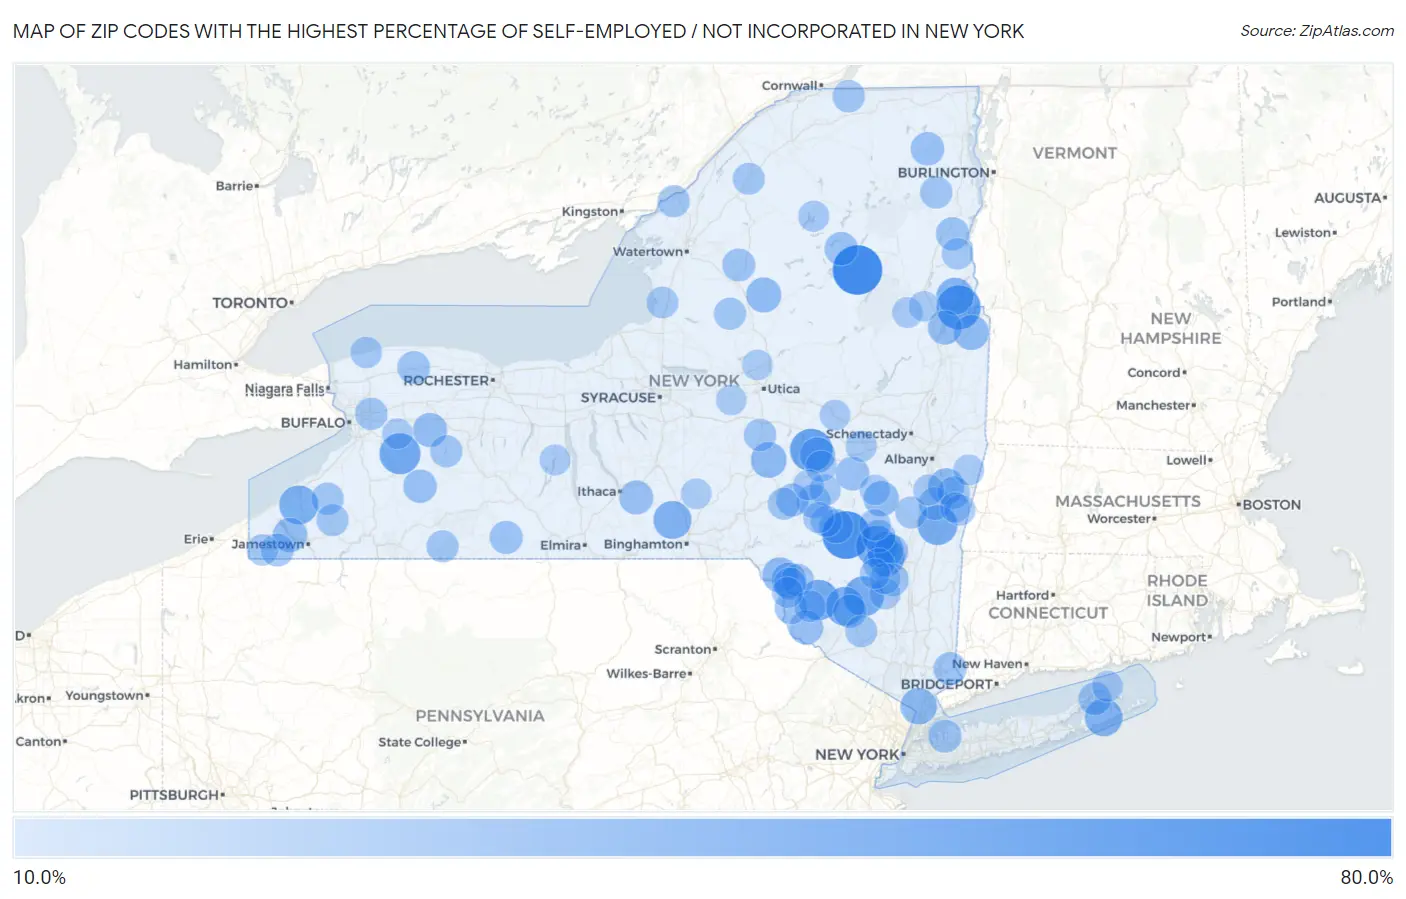
Map of Zip Codes with the Highest Percentage of Self-Employed / Not Incorporated in New York
10.0%
80.0%
Zip Codes with the Highest Percentage of Self-Employed / Not Incorporated in New York
| Zip Code | % Self-Employed / Not Incorporated | vs State | vs National | |
| 1. | 12812 | 78.0% | 5.5%(+72.5)#1 | 5.8%(+72.2)#78 |
| 2. | 12441 | 71.8% | 5.5%(+66.3)#2 | 5.8%(+66.0)#94 |
| 3. | 12841 | 60.0% | 5.5%(+54.5)#3 | 5.8%(+54.2)#142 |
| 4. | 13450 | 55.1% | 5.5%(+49.6)#4 | 5.8%(+49.3)#168 |
| 5. | 12495 | 50.0% | 5.5%(+44.5)#5 | 5.8%(+44.2)#218 |
| 6. | 14083 | 50.0% | 5.5%(+44.5)#6 | 5.8%(+44.2)#236 |
| 7. | 12734 | 48.0% | 5.5%(+42.5)#7 | 5.8%(+42.2)#254 |
| 8. | 12489 | 47.6% | 5.5%(+42.1)#8 | 5.8%(+41.8)#260 |
| 9. | 12513 | 46.7% | 5.5%(+41.2)#9 | 5.8%(+40.9)#277 |
| 10. | 14752 | 43.8% | 5.5%(+38.3)#10 | 5.8%(+37.9)#319 |
| 11. | 12763 | 43.5% | 5.5%(+38.0)#11 | 5.8%(+37.7)#325 |
| 12. | 13802 | 40.8% | 5.5%(+35.3)#12 | 5.8%(+34.9)#394 |
| 13. | 11975 | 39.6% | 5.5%(+34.1)#13 | 5.8%(+33.8)#415 |
| 14. | 12874 | 37.7% | 5.5%(+32.2)#14 | 5.8%(+31.9)#464 |
| 15. | 12433 | 37.7% | 5.5%(+32.2)#15 | 5.8%(+31.9)#465 |
| 16. | 12409 | 36.3% | 5.5%(+30.8)#16 | 5.8%(+30.5)#517 |
| 17. | 10503 | 35.6% | 5.5%(+30.1)#17 | 5.8%(+29.7)#543 |
| 18. | 12132 | 34.1% | 5.5%(+28.6)#18 | 5.8%(+28.3)#577 |
| 19. | 13342 | 33.3% | 5.5%(+27.8)#19 | 5.8%(+27.5)#602 |
| 20. | 13488 | 32.3% | 5.5%(+26.8)#20 | 5.8%(+26.5)#658 |
| 21. | 12760 | 32.2% | 5.5%(+26.7)#21 | 5.8%(+26.4)#666 |
| 22. | 12422 | 32.0% | 5.5%(+26.5)#22 | 5.8%(+26.2)#674 |
| 23. | 12821 | 31.4% | 5.5%(+25.9)#23 | 5.8%(+25.6)#699 |
| 24. | 13312 | 31.2% | 5.5%(+25.8)#24 | 5.8%(+25.4)#710 |
| 25. | 12736 | 30.6% | 5.5%(+25.1)#25 | 5.8%(+24.7)#743 |
| 26. | 14785 | 29.2% | 5.5%(+23.7)#26 | 5.8%(+23.4)#814 |
| 27. | 12844 | 28.7% | 5.5%(+23.2)#27 | 5.8%(+22.9)#840 |
| 28. | 14039 | 28.6% | 5.5%(+23.1)#28 | 5.8%(+22.8)#860 |
| 29. | 14881 | 28.1% | 5.5%(+22.6)#29 | 5.8%(+22.3)#886 |
| 30. | 12438 | 28.1% | 5.5%(+22.6)#30 | 5.8%(+22.3)#887 |
| 31. | 12732 | 27.9% | 5.5%(+22.4)#31 | 5.8%(+22.1)#900 |
| 32. | 12498 | 27.0% | 5.5%(+21.5)#32 | 5.8%(+21.2)#955 |
| 33. | 12194 | 27.0% | 5.5%(+21.5)#33 | 5.8%(+21.2)#957 |
| 34. | 13739 | 26.7% | 5.5%(+21.2)#34 | 5.8%(+20.9)#985 |
| 35. | 12978 | 26.7% | 5.5%(+21.2)#35 | 5.8%(+20.9)#989 |
| 36. | 14029 | 26.3% | 5.5%(+20.8)#36 | 5.8%(+20.5)#1,017 |
| 37. | 12847 | 26.0% | 5.5%(+20.5)#37 | 5.8%(+20.2)#1,039 |
| 38. | 12769 | 25.9% | 5.5%(+20.4)#38 | 5.8%(+20.1)#1,053 |
| 39. | 12998 | 25.5% | 5.5%(+20.0)#39 | 5.8%(+19.7)#1,108 |
| 40. | 12752 | 25.2% | 5.5%(+19.7)#40 | 5.8%(+19.4)#1,130 |
| 41. | 14855 | 25.2% | 5.5%(+19.7)#41 | 5.8%(+19.3)#1,131 |
| 42. | 11547 | 25.0% | 5.5%(+19.5)#42 | 5.8%(+19.2)#1,141 |
| 43. | 10518 | 24.9% | 5.5%(+19.4)#43 | 5.8%(+19.1)#1,161 |
| 44. | 11965 | 24.9% | 5.5%(+19.4)#44 | 5.8%(+19.1)#1,162 |
| 45. | 13806 | 24.8% | 5.5%(+19.3)#45 | 5.8%(+18.9)#1,177 |
| 46. | 12450 | 24.5% | 5.5%(+19.0)#46 | 5.8%(+18.7)#1,204 |
| 47. | 13620 | 24.5% | 5.5%(+19.0)#47 | 5.8%(+18.7)#1,208 |
| 48. | 12174 | 24.4% | 5.5%(+18.9)#48 | 5.8%(+18.5)#1,226 |
| 49. | 14767 | 24.3% | 5.5%(+18.8)#49 | 5.8%(+18.5)#1,228 |
| 50. | 14479 | 23.9% | 5.5%(+18.4)#50 | 5.8%(+18.1)#1,263 |
| 51. | 12419 | 23.9% | 5.5%(+18.4)#51 | 5.8%(+18.0)#1,268 |
| 52. | 13364 | 23.4% | 5.5%(+17.9)#52 | 5.8%(+17.5)#1,321 |
| 53. | 12724 | 23.3% | 5.5%(+17.8)#53 | 5.8%(+17.4)#1,326 |
| 54. | 12937 | 23.1% | 5.5%(+17.6)#54 | 5.8%(+17.3)#1,339 |
| 55. | 12136 | 23.0% | 5.5%(+17.5)#55 | 5.8%(+17.2)#1,351 |
| 56. | 12941 | 22.7% | 5.5%(+17.2)#56 | 5.8%(+16.9)#1,392 |
| 57. | 14138 | 22.6% | 5.5%(+17.1)#57 | 5.8%(+16.8)#1,402 |
| 58. | 14549 | 22.4% | 5.5%(+16.9)#58 | 5.8%(+16.6)#1,424 |
| 59. | 14026 | 22.4% | 5.5%(+16.9)#59 | 5.8%(+16.5)#1,429 |
| 60. | 12767 | 22.2% | 5.5%(+16.7)#60 | 5.8%(+16.4)#1,441 |
| 61. | 13325 | 22.2% | 5.5%(+16.7)#61 | 5.8%(+16.4)#1,455 |
| 62. | 14726 | 22.2% | 5.5%(+16.7)#62 | 5.8%(+16.3)#1,458 |
| 63. | 13692 | 21.8% | 5.5%(+16.3)#63 | 5.8%(+16.0)#1,512 |
| 64. | 13846 | 21.6% | 5.5%(+16.1)#64 | 5.8%(+15.8)#1,549 |
| 65. | 10919 | 21.5% | 5.5%(+16.0)#65 | 5.8%(+15.7)#1,555 |
| 66. | 13681 | 21.5% | 5.5%(+16.0)#66 | 5.8%(+15.6)#1,565 |
| 67. | 14707 | 21.4% | 5.5%(+15.9)#67 | 5.8%(+15.6)#1,576 |
| 68. | 12451 | 21.3% | 5.5%(+15.8)#68 | 5.8%(+15.5)#1,586 |
| 69. | 12749 | 20.9% | 5.5%(+15.4)#69 | 5.8%(+15.1)#1,659 |
| 70. | 13145 | 20.7% | 5.5%(+15.2)#70 | 5.8%(+14.9)#1,692 |
| 71. | 12442 | 20.0% | 5.5%(+14.5)#71 | 5.8%(+14.2)#1,806 |
| 72. | 12928 | 20.0% | 5.5%(+14.5)#72 | 5.8%(+14.2)#1,835 |
| 73. | 14126 | 19.8% | 5.5%(+14.3)#73 | 5.8%(+14.0)#1,860 |
| 74. | 12481 | 19.7% | 5.5%(+14.2)#74 | 5.8%(+13.8)#1,888 |
| 75. | 14724 | 19.6% | 5.5%(+14.1)#75 | 5.8%(+13.8)#1,891 |
| 76. | 13786 | 19.6% | 5.5%(+14.1)#76 | 5.8%(+13.8)#1,899 |
| 77. | 12197 | 19.2% | 5.5%(+13.7)#77 | 5.8%(+13.4)#1,962 |
| 78. | 12459 | 19.2% | 5.5%(+13.7)#78 | 5.8%(+13.4)#1,969 |
| 79. | 13740 | 19.2% | 5.5%(+13.7)#79 | 5.8%(+13.4)#1,981 |
| 80. | 12440 | 19.1% | 5.5%(+13.6)#80 | 5.8%(+13.2)#2,017 |
| 81. | 12484 | 19.0% | 5.5%(+13.5)#81 | 5.8%(+13.1)#2,048 |
| 82. | 12124 | 18.9% | 5.5%(+13.4)#82 | 5.8%(+13.1)#2,052 |
| 83. | 12035 | 18.9% | 5.5%(+13.4)#83 | 5.8%(+13.1)#2,066 |
| 84. | 12165 | 18.8% | 5.5%(+13.3)#84 | 5.8%(+13.0)#2,083 |
| 85. | 12723 | 18.6% | 5.5%(+13.1)#85 | 5.8%(+12.8)#2,132 |
| 86. | 12927 | 18.6% | 5.5%(+13.1)#86 | 5.8%(+12.8)#2,150 |
| 87. | 11957 | 18.4% | 5.5%(+12.9)#87 | 5.8%(+12.6)#2,189 |
| 88. | 13750 | 18.4% | 5.5%(+12.9)#88 | 5.8%(+12.6)#2,198 |
| 89. | 12169 | 18.2% | 5.5%(+12.7)#89 | 5.8%(+12.4)#2,263 |
| 90. | 14527 | 18.1% | 5.5%(+12.6)#90 | 5.8%(+12.3)#2,283 |
| 91. | 12843 | 18.1% | 5.5%(+12.6)#91 | 5.8%(+12.3)#2,295 |
| 92. | 14037 | 17.6% | 5.5%(+12.1)#92 | 5.8%(+11.8)#2,436 |
| 93. | 13354 | 17.4% | 5.5%(+11.9)#93 | 5.8%(+11.6)#2,497 |
| 94. | 13841 | 17.4% | 5.5%(+11.9)#94 | 5.8%(+11.6)#2,511 |
| 95. | 13410 | 17.4% | 5.5%(+11.9)#95 | 5.8%(+11.5)#2,518 |
| 96. | 13477 | 17.2% | 5.5%(+11.7)#96 | 5.8%(+11.4)#2,568 |
| 97. | 12817 | 16.9% | 5.5%(+11.4)#97 | 5.8%(+11.1)#2,650 |
| 98. | 12037 | 16.9% | 5.5%(+11.4)#98 | 5.8%(+11.1)#2,671 |
| 99. | 12469 | 16.8% | 5.5%(+11.3)#99 | 5.8%(+11.0)#2,695 |
| 100. | 12461 | 16.7% | 5.5%(+11.2)#100 | 5.8%(+10.9)#2,729 |
Common Questions
What are the Top 10 Zip Codes with the Highest Percentage of Self-Employed / Not Incorporated in New York?
Top 10 Zip Codes with the Highest Percentage of Self-Employed / Not Incorporated in New York are:
What zip code has the Highest Percentage of Self-Employed / Not Incorporated in New York?
12812 has the Highest Percentage of Self-Employed / Not Incorporated in New York with 78.0%.
What is the Percentage of Self-Employed / Not Incorporated in the State of New York?
Percentage of Self-Employed / Not Incorporated in New York is 5.5%.
What is the Percentage of Self-Employed / Not Incorporated in the United States?
Percentage of Self-Employed / Not Incorporated in the United States is 5.8%.