Zip Codes with the Highest Percentage of Households with Income Below $10,000 in New York
RELATED REPORTS & OPTIONS
Household Income | $0-10k
New York
Compare Zip Codes
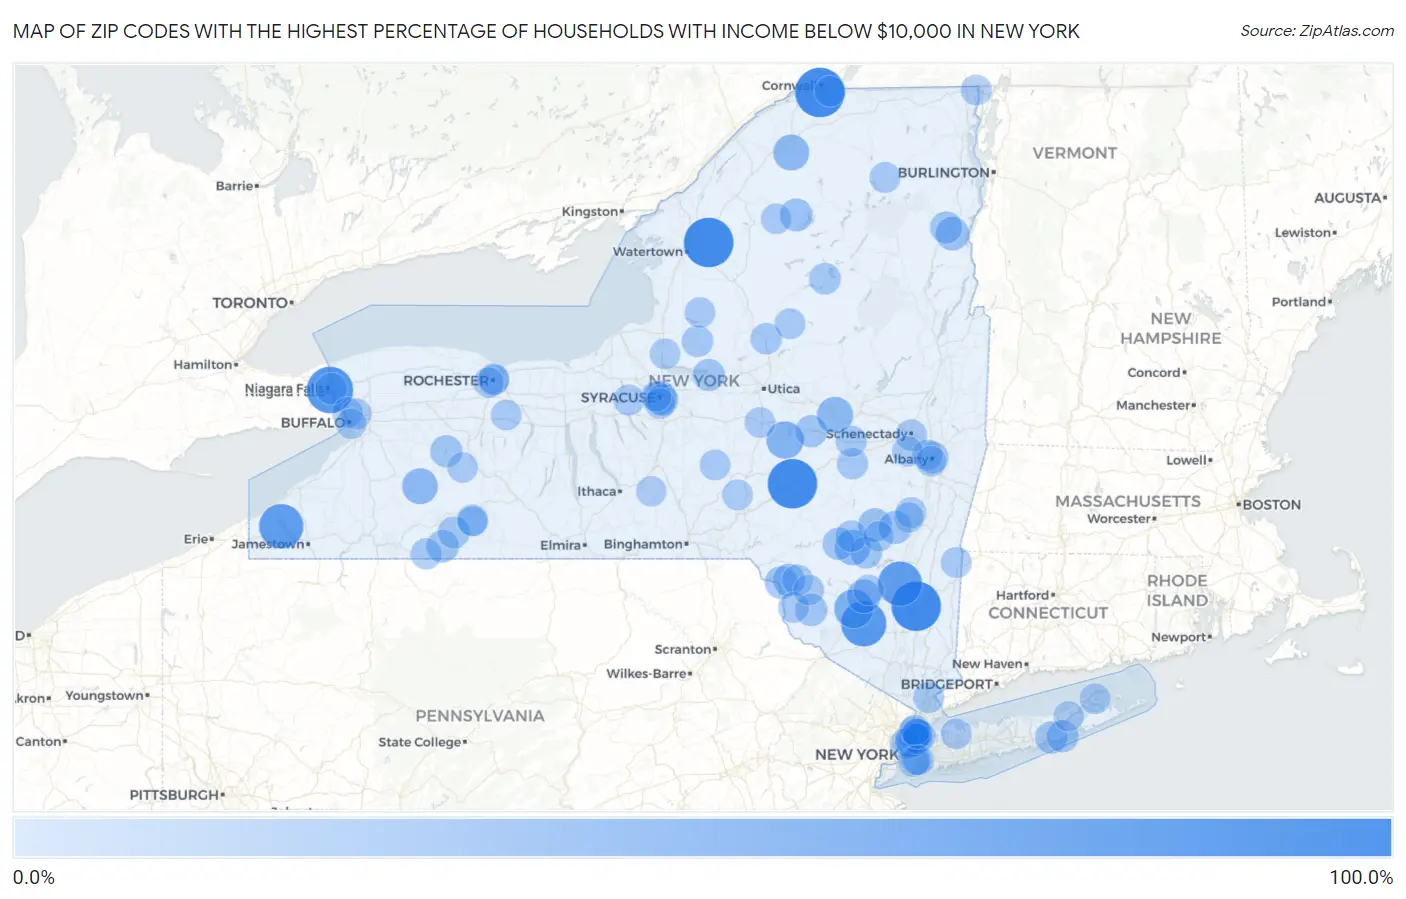
Map of Zip Codes with the Highest Percentage of Households with Income Below $10,000 in New York
0.0%
100.0%
Zip Codes with the Highest Percentage of Households with Income Below $10,000 in New York
| Zip Code | Households with Income < $10k | vs State | vs National | |
| 1. | 12604 | 100.0% | 5.6%(+94.4)#1 | 4.9%(+95.1)#7 |
| 2. | 13683 | 100.0% | 5.6%(+94.4)#2 | 4.9%(+95.1)#18 |
| 3. | 13643 | 100.0% | 5.6%(+94.4)#3 | 4.9%(+95.1)#19 |
| 4. | 13747 | 100.0% | 5.6%(+94.4)#4 | 4.9%(+95.1)#22 |
| 5. | 14302 | 85.6% | 5.6%(+80.0)#5 | 4.9%(+80.7)#41 |
| 6. | 10985 | 80.0% | 5.6%(+74.4)#6 | 4.9%(+75.1)#45 |
| 7. | 14722 | 75.8% | 5.6%(+70.2)#7 | 4.9%(+70.9)#51 |
| 8. | 12471 | 75.7% | 5.6%(+70.1)#8 | 4.9%(+70.8)#52 |
| 9. | 12483 | 51.2% | 5.6%(+45.6)#9 | 4.9%(+46.3)#108 |
| 10. | 13457 | 43.5% | 5.6%(+37.9)#10 | 4.9%(+38.6)#149 |
| 11. | 13410 | 38.2% | 5.6%(+32.6)#11 | 4.9%(+33.3)#185 |
| 12. | 13647 | 37.3% | 5.6%(+31.7)#12 | 4.9%(+32.4)#194 |
| 13. | 14029 | 36.8% | 5.6%(+31.2)#13 | 4.9%(+31.9)#198 |
| 14. | 12410 | 35.2% | 5.6%(+29.6)#14 | 4.9%(+30.3)#216 |
| 15. | 12489 | 28.3% | 5.6%(+22.7)#15 | 4.9%(+23.4)#366 |
| 16. | 12998 | 26.7% | 5.6%(+21.1)#16 | 4.9%(+21.8)#415 |
| 17. | 12442 | 26.1% | 5.6%(+20.5)#17 | 4.9%(+21.2)#435 |
| 18. | 13202 | 25.9% | 5.6%(+20.3)#18 | 4.9%(+21.0)#444 |
| 19. | 12436 | 24.9% | 5.6%(+19.3)#19 | 4.9%(+20.0)#495 |
| 20. | 13666 | 23.8% | 5.6%(+18.2)#20 | 4.9%(+18.9)#545 |
| 21. | 12741 | 23.2% | 5.6%(+17.6)#21 | 4.9%(+18.3)#585 |
| 22. | 14707 | 21.7% | 5.6%(+16.1)#22 | 4.9%(+16.8)#656 |
| 23. | 12406 | 21.5% | 5.6%(+15.9)#23 | 4.9%(+16.6)#674 |
| 24. | 11972 | 21.0% | 5.6%(+15.4)#24 | 4.9%(+16.1)#709 |
| 25. | 12964 | 20.6% | 5.6%(+15.0)#25 | 4.9%(+15.7)#740 |
| 26. | 13333 | 20.6% | 5.6%(+15.0)#26 | 4.9%(+15.7)#741 |
| 27. | 12778 | 20.5% | 5.6%(+14.9)#27 | 4.9%(+15.6)#749 |
| 28. | 12736 | 20.5% | 5.6%(+14.9)#28 | 4.9%(+15.6)#755 |
| 29. | 13162 | 20.4% | 5.6%(+14.8)#29 | 4.9%(+15.5)#765 |
| 30. | 14549 | 20.4% | 5.6%(+14.8)#30 | 4.9%(+15.5)#766 |
| 31. | 12207 | 19.7% | 5.6%(+14.1)#31 | 4.9%(+14.8)#822 |
| 32. | 14880 | 19.7% | 5.6%(+14.1)#32 | 4.9%(+14.8)#825 |
| 33. | 11959 | 19.7% | 5.6%(+14.1)#33 | 4.9%(+14.8)#827 |
| 34. | 12464 | 19.2% | 5.6%(+13.6)#34 | 4.9%(+14.3)#884 |
| 35. | 10454 | 18.6% | 5.6%(+13.0)#35 | 4.9%(+13.7)#933 |
| 36. | 13436 | 18.4% | 5.6%(+12.8)#36 | 4.9%(+13.5)#968 |
| 37. | 14301 | 17.6% | 5.6%(+12.0)#37 | 4.9%(+12.7)#1,069 |
| 38. | 13483 | 17.4% | 5.6%(+11.8)#38 | 4.9%(+12.5)#1,107 |
| 39. | 12465 | 17.4% | 5.6%(+11.8)#39 | 4.9%(+12.5)#1,108 |
| 40. | 13301 | 17.2% | 5.6%(+11.6)#40 | 4.9%(+12.3)#1,134 |
| 41. | 13210 | 16.9% | 5.6%(+11.3)#41 | 4.9%(+12.0)#1,168 |
| 42. | 10037 | 16.8% | 5.6%(+11.2)#42 | 4.9%(+11.9)#1,184 |
| 43. | 12307 | 16.4% | 5.6%(+10.8)#43 | 4.9%(+11.5)#1,260 |
| 44. | 10035 | 16.1% | 5.6%(+10.5)#44 | 4.9%(+11.2)#1,316 |
| 45. | 12187 | 16.0% | 5.6%(+10.4)#45 | 4.9%(+11.1)#1,342 |
| 46. | 14802 | 15.9% | 5.6%(+10.3)#46 | 4.9%(+11.0)#1,361 |
| 47. | 12031 | 15.7% | 5.6%(+10.1)#47 | 4.9%(+10.8)#1,404 |
| 48. | 10456 | 15.6% | 5.6%(+10.00)#48 | 4.9%(+10.7)#1,406 |
| 49. | 10453 | 15.6% | 5.6%(+10.00)#49 | 4.9%(+10.7)#1,407 |
| 50. | 10472 | 15.6% | 5.6%(+10.00)#50 | 4.9%(+10.7)#1,408 |
| 51. | 14754 | 15.6% | 5.6%(+10.00)#51 | 4.9%(+10.7)#1,418 |
| 52. | 10595 | 15.5% | 5.6%(+9.90)#52 | 4.9%(+10.6)#1,425 |
| 53. | 11212 | 15.2% | 5.6%(+9.60)#53 | 4.9%(+10.3)#1,472 |
| 54. | 12724 | 15.0% | 5.6%(+9.40)#54 | 4.9%(+10.1)#1,534 |
| 55. | 12546 | 14.7% | 5.6%(+9.10)#55 | 4.9%(+9.80)#1,595 |
| 56. | 10457 | 14.6% | 5.6%(+9.00)#56 | 4.9%(+9.70)#1,612 |
| 57. | 13060 | 14.6% | 5.6%(+9.00)#57 | 4.9%(+9.70)#1,624 |
| 58. | 12206 | 14.5% | 5.6%(+8.90)#58 | 4.9%(+9.60)#1,643 |
| 59. | 13338 | 14.5% | 5.6%(+8.90)#59 | 4.9%(+9.60)#1,653 |
| 60. | 13780 | 14.5% | 5.6%(+8.90)#60 | 4.9%(+9.60)#1,656 |
| 61. | 14605 | 14.4% | 5.6%(+8.80)#61 | 4.9%(+9.50)#1,668 |
| 62. | 10029 | 14.3% | 5.6%(+8.70)#62 | 4.9%(+9.40)#1,685 |
| 63. | 14604 | 14.3% | 5.6%(+8.70)#63 | 4.9%(+9.40)#1,693 |
| 64. | 12726 | 14.3% | 5.6%(+8.70)#64 | 4.9%(+9.40)#1,698 |
| 65. | 10455 | 14.1% | 5.6%(+8.50)#65 | 4.9%(+9.20)#1,737 |
| 66. | 13655 | 14.1% | 5.6%(+8.50)#66 | 4.9%(+9.20)#1,748 |
| 67. | 12939 | 14.1% | 5.6%(+8.50)#67 | 4.9%(+9.20)#1,760 |
| 68. | 12979 | 14.0% | 5.6%(+8.40)#68 | 4.9%(+9.10)#1,768 |
| 69. | 12451 | 14.0% | 5.6%(+8.40)#69 | 4.9%(+9.10)#1,778 |
| 70. | 13844 | 14.0% | 5.6%(+8.40)#70 | 4.9%(+9.10)#1,784 |
| 71. | 13313 | 14.0% | 5.6%(+8.40)#71 | 4.9%(+9.10)#1,785 |
| 72. | 12085 | 14.0% | 5.6%(+8.40)#72 | 4.9%(+9.10)#1,790 |
| 73. | 13670 | 13.8% | 5.6%(+8.20)#73 | 4.9%(+8.90)#1,836 |
| 74. | 10451 | 13.6% | 5.6%(+8.00)#74 | 4.9%(+8.70)#1,869 |
| 75. | 14215 | 13.6% | 5.6%(+8.00)#75 | 4.9%(+8.70)#1,872 |
| 76. | 12446 | 13.6% | 5.6%(+8.00)#76 | 4.9%(+8.70)#1,884 |
| 77. | 11732 | 13.6% | 5.6%(+8.00)#77 | 4.9%(+8.70)#1,887 |
| 78. | 13437 | 13.6% | 5.6%(+8.00)#78 | 4.9%(+8.70)#1,902 |
| 79. | 12787 | 13.6% | 5.6%(+8.00)#79 | 4.9%(+8.70)#1,903 |
| 80. | 14207 | 13.5% | 5.6%(+7.90)#80 | 4.9%(+8.60)#1,907 |
| 81. | 14204 | 13.5% | 5.6%(+7.90)#81 | 4.9%(+8.60)#1,913 |
| 82. | 10069 | 13.5% | 5.6%(+7.90)#82 | 4.9%(+8.60)#1,915 |
| 83. | 11965 | 13.5% | 5.6%(+7.90)#83 | 4.9%(+8.60)#1,935 |
| 84. | 14475 | 13.4% | 5.6%(+7.80)#84 | 4.9%(+8.50)#1,970 |
| 85. | 14611 | 13.3% | 5.6%(+7.70)#85 | 4.9%(+8.40)#1,978 |
| 86. | 14517 | 13.3% | 5.6%(+7.70)#86 | 4.9%(+8.40)#1,986 |
| 87. | 10474 | 13.2% | 5.6%(+7.60)#87 | 4.9%(+8.30)#2,002 |
| 88. | 13205 | 13.1% | 5.6%(+7.50)#88 | 4.9%(+8.20)#2,029 |
| 89. | 13103 | 13.0% | 5.6%(+7.40)#89 | 4.9%(+8.10)#2,099 |
| 90. | 13204 | 12.9% | 5.6%(+7.30)#90 | 4.9%(+8.00)#2,114 |
| 91. | 11208 | 12.8% | 5.6%(+7.20)#91 | 4.9%(+7.90)#2,150 |
| 92. | 12202 | 12.8% | 5.6%(+7.20)#92 | 4.9%(+7.90)#2,163 |
| 93. | 14803 | 12.7% | 5.6%(+7.10)#93 | 4.9%(+7.80)#2,208 |
| 94. | 12482 | 12.7% | 5.6%(+7.10)#94 | 4.9%(+7.80)#2,217 |
| 95. | 11948 | 12.7% | 5.6%(+7.10)#95 | 4.9%(+7.80)#2,218 |
| 96. | 11207 | 12.6% | 5.6%(+7.00)#96 | 4.9%(+7.70)#2,226 |
| 97. | 13784 | 12.6% | 5.6%(+7.00)#97 | 4.9%(+7.70)#2,245 |
| 98. | 12450 | 12.5% | 5.6%(+6.90)#98 | 4.9%(+7.60)#2,277 |
| 99. | 10468 | 12.4% | 5.6%(+6.80)#99 | 4.9%(+7.50)#2,289 |
| 100. | 10460 | 12.4% | 5.6%(+6.80)#100 | 4.9%(+7.50)#2,290 |
Common Questions
What are the Top 10 Zip Codes with the Highest Percentage of Households with Income Below $10,000 in New York?
Top 10 Zip Codes with the Highest Percentage of Households with Income Below $10,000 in New York are:
What zip code has the Highest Percentage of Households with Income Below $10,000 in New York?
12604 has the Highest Percentage of Households with Income Below $10,000 in New York with 100.0%.
What is the Percentage of Households with Income Below $10,000 in the State of New York?
Percentage of Households with Income Below $10,000 in New York is 5.6%.
What is the Percentage of Households with Income Below $10,000 in the United States?
Percentage of Households with Income Below $10,000 in the United States is 4.9%.