Zip Codes with the Highest Percentage of Population with a Degree in Engineering in New York
RELATED REPORTS & OPTIONS
Engineering
New York
Compare Zip Codes
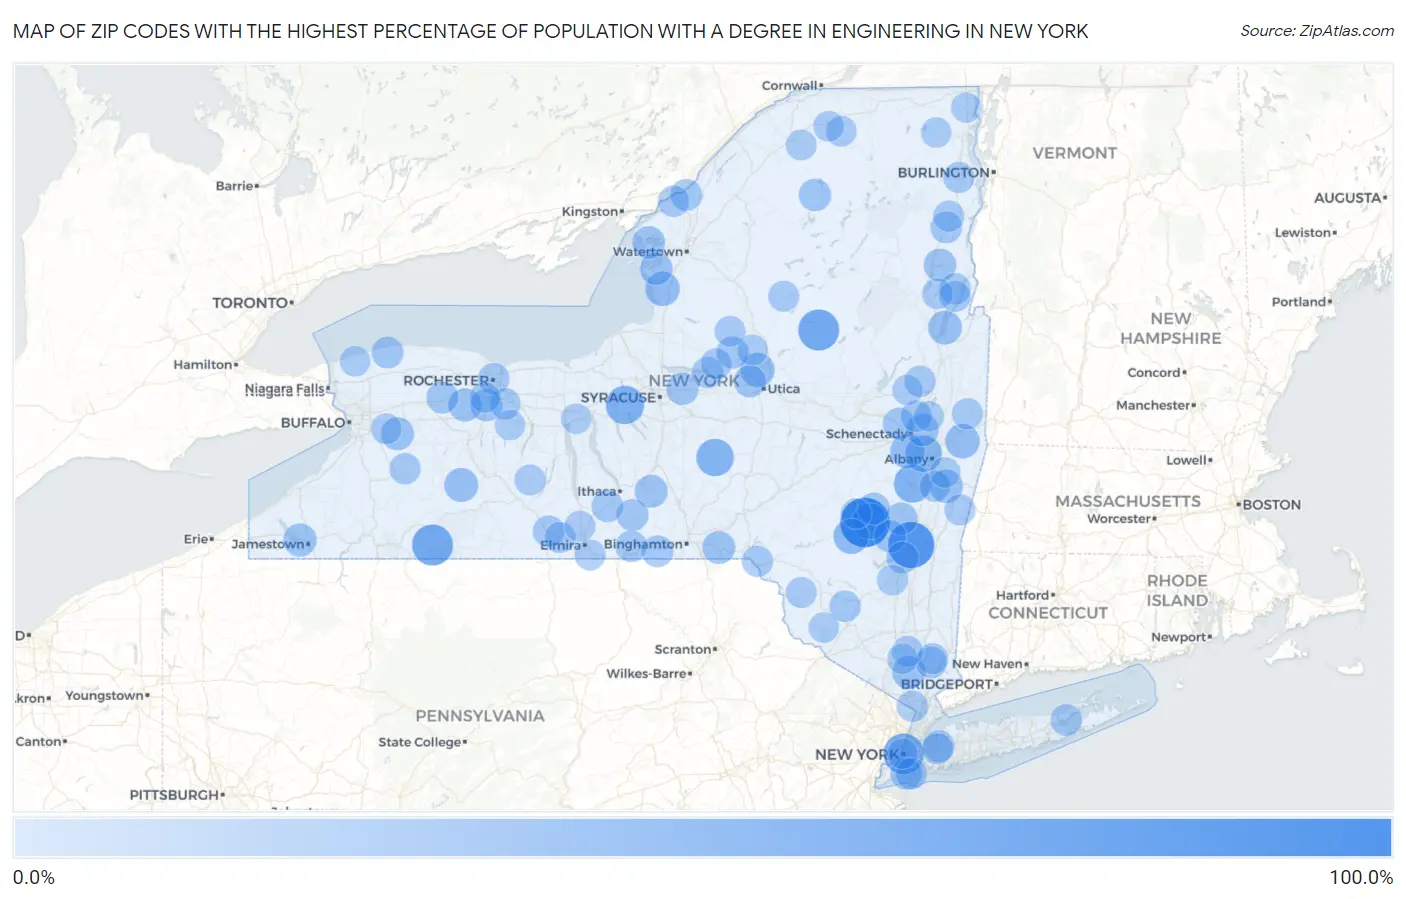
Map of Zip Codes with the Highest Percentage of Population with a Degree in Engineering in New York
0.0%
100.0%
Zip Codes with the Highest Percentage of Population with a Degree in Engineering in New York
| Zip Code | % Graduates | vs State | vs National | |
| 1. | 12452 | 81.2% | 5.6%(+75.6)#1 | 7.6%(+73.6)#55 |
| 2. | 12453 | 69.2% | 5.6%(+63.5)#2 | 7.6%(+61.5)#72 |
| 3. | 14774 | 50.0% | 5.6%(+44.4)#3 | 7.6%(+42.4)#135 |
| 4. | 13353 | 50.0% | 5.6%(+44.4)#4 | 7.6%(+42.4)#145 |
| 5. | 10279 | 48.9% | 5.6%(+43.3)#5 | 7.6%(+41.3)#147 |
| 6. | 13153 | 40.4% | 5.6%(+34.8)#6 | 7.6%(+32.8)#211 |
| 7. | 12046 | 38.3% | 5.6%(+32.6)#7 | 7.6%(+30.7)#234 |
| 8. | 13832 | 37.1% | 5.6%(+31.5)#8 | 7.6%(+29.5)#248 |
| 9. | 12222 | 34.1% | 5.6%(+28.5)#9 | 7.6%(+26.5)#283 |
| 10. | 12444 | 31.7% | 5.6%(+26.0)#10 | 7.6%(+24.0)#337 |
| 11. | 12465 | 30.0% | 5.6%(+24.4)#11 | 7.6%(+22.4)#370 |
| 12. | 13636 | 27.3% | 5.6%(+21.6)#12 | 7.6%(+19.6)#453 |
| 13. | 12052 | 26.9% | 5.6%(+21.3)#13 | 7.6%(+19.3)#467 |
| 14. | 12085 | 26.8% | 5.6%(+21.2)#14 | 7.6%(+19.2)#469 |
| 15. | 13469 | 25.9% | 5.6%(+20.3)#15 | 7.6%(+18.3)#504 |
| 16. | 14884 | 25.0% | 5.6%(+19.4)#16 | 7.6%(+17.4)#552 |
| 17. | 12844 | 24.4% | 5.6%(+18.7)#17 | 7.6%(+16.7)#585 |
| 18. | 12132 | 23.1% | 5.6%(+17.4)#18 | 7.6%(+15.4)#652 |
| 19. | 14742 | 22.5% | 5.6%(+16.9)#19 | 7.6%(+14.9)#685 |
| 20. | 10596 | 22.5% | 5.6%(+16.8)#20 | 7.6%(+14.8)#686 |
| 21. | 14511 | 22.4% | 5.6%(+16.7)#21 | 7.6%(+14.7)#694 |
| 22. | 14037 | 21.9% | 5.6%(+16.2)#22 | 7.6%(+14.2)#725 |
| 23. | 13784 | 21.4% | 5.6%(+15.8)#23 | 7.6%(+13.8)#772 |
| 24. | 13865 | 21.4% | 5.6%(+15.7)#24 | 7.6%(+13.7)#782 |
| 25. | 13651 | 20.8% | 5.6%(+15.1)#25 | 7.6%(+13.1)#830 |
| 26. | 13693 | 20.7% | 5.6%(+15.0)#26 | 7.6%(+13.0)#836 |
| 27. | 12148 | 20.5% | 5.6%(+14.8)#27 | 7.6%(+12.8)#858 |
| 28. | 12858 | 20.3% | 5.6%(+14.7)#28 | 7.6%(+12.7)#881 |
| 29. | 12473 | 20.2% | 5.6%(+14.5)#29 | 7.6%(+12.5)#888 |
| 30. | 12922 | 20.0% | 5.6%(+14.4)#30 | 7.6%(+12.4)#924 |
| 31. | 12427 | 19.6% | 5.6%(+14.0)#31 | 7.6%(+12.0)#952 |
| 32. | 14543 | 19.4% | 5.6%(+13.8)#32 | 7.6%(+11.8)#972 |
| 33. | 13082 | 19.4% | 5.6%(+13.7)#33 | 7.6%(+11.7)#983 |
| 34. | 13424 | 18.8% | 5.6%(+13.2)#34 | 7.6%(+11.2)#1,058 |
| 35. | 12496 | 18.7% | 5.6%(+13.0)#35 | 7.6%(+11.0)#1,074 |
| 36. | 12475 | 18.6% | 5.6%(+13.0)#36 | 7.6%(+11.0)#1,078 |
| 37. | 13363 | 18.5% | 5.6%(+12.9)#37 | 7.6%(+10.9)#1,088 |
| 38. | 12150 | 18.5% | 5.6%(+12.8)#38 | 7.6%(+10.8)#1,100 |
| 39. | 14557 | 18.2% | 5.6%(+12.5)#39 | 7.6%(+10.5)#1,142 |
| 40. | 14012 | 17.8% | 5.6%(+12.1)#40 | 7.6%(+10.1)#1,186 |
| 41. | 13864 | 17.7% | 5.6%(+12.1)#41 | 7.6%(+10.1)#1,194 |
| 42. | 11224 | 17.7% | 5.6%(+12.0)#42 | 7.6%(+10.0)#1,200 |
| 43. | 14870 | 17.3% | 5.6%(+11.6)#43 | 7.6%(+9.62)#1,264 |
| 44. | 13732 | 17.2% | 5.6%(+11.6)#44 | 7.6%(+9.56)#1,280 |
| 45. | 14867 | 17.1% | 5.6%(+11.4)#45 | 7.6%(+9.43)#1,303 |
| 46. | 11042 | 17.1% | 5.6%(+11.4)#46 | 7.6%(+9.43)#1,306 |
| 47. | 12964 | 17.1% | 5.6%(+11.4)#47 | 7.6%(+9.43)#1,307 |
| 48. | 13607 | 17.0% | 5.6%(+11.3)#48 | 7.6%(+9.33)#1,324 |
| 49. | 11970 | 16.8% | 5.6%(+11.1)#49 | 7.6%(+9.13)#1,348 |
| 50. | 13734 | 16.4% | 5.6%(+10.7)#50 | 7.6%(+8.72)#1,423 |
| 51. | 12763 | 16.2% | 5.6%(+10.5)#51 | 7.6%(+8.52)#1,466 |
| 52. | 14605 | 16.1% | 5.6%(+10.5)#52 | 7.6%(+8.49)#1,472 |
| 53. | 12019 | 16.1% | 5.6%(+10.5)#53 | 7.6%(+8.46)#1,478 |
| 54. | 13157 | 16.1% | 5.6%(+10.4)#54 | 7.6%(+8.44)#1,479 |
| 55. | 10527 | 16.0% | 5.6%(+10.3)#55 | 7.6%(+8.31)#1,511 |
| 56. | 13692 | 15.9% | 5.6%(+10.2)#56 | 7.6%(+8.23)#1,527 |
| 57. | 12836 | 15.9% | 5.6%(+10.2)#57 | 7.6%(+8.21)#1,529 |
| 58. | 10976 | 15.7% | 5.6%(+10.1)#58 | 7.6%(+8.06)#1,558 |
| 59. | 11235 | 15.7% | 5.6%(+10.0)#59 | 7.6%(+8.04)#1,560 |
| 60. | 14506 | 15.6% | 5.6%(+9.98)#60 | 7.6%(+7.98)#1,579 |
| 61. | 12833 | 15.5% | 5.6%(+9.90)#61 | 7.6%(+7.90)#1,597 |
| 62. | 12874 | 15.5% | 5.6%(+9.81)#62 | 7.6%(+7.82)#1,624 |
| 63. | 14009 | 15.3% | 5.6%(+9.62)#63 | 7.6%(+7.62)#1,681 |
| 64. | 11004 | 15.2% | 5.6%(+9.52)#64 | 7.6%(+7.52)#1,710 |
| 65. | 12932 | 15.2% | 5.6%(+9.51)#65 | 7.6%(+7.52)#1,711 |
| 66. | 13783 | 15.1% | 5.6%(+9.42)#66 | 7.6%(+7.42)#1,731 |
| 67. | 10505 | 14.9% | 5.6%(+9.22)#67 | 7.6%(+7.23)#1,775 |
| 68. | 14830 | 14.8% | 5.6%(+9.19)#68 | 7.6%(+7.19)#1,787 |
| 69. | 12028 | 14.8% | 5.6%(+9.14)#69 | 7.6%(+7.14)#1,804 |
| 70. | 12944 | 14.8% | 5.6%(+9.12)#70 | 7.6%(+7.12)#1,811 |
| 71. | 12156 | 14.7% | 5.6%(+9.07)#71 | 7.6%(+7.07)#1,820 |
| 72. | 13472 | 14.7% | 5.6%(+9.01)#72 | 7.6%(+7.01)#1,829 |
| 73. | 14894 | 14.6% | 5.6%(+8.96)#73 | 7.6%(+6.96)#1,840 |
| 74. | 14845 | 14.6% | 5.6%(+8.95)#74 | 7.6%(+6.95)#1,843 |
| 75. | 13308 | 14.6% | 5.6%(+8.91)#75 | 7.6%(+6.91)#1,850 |
| 76. | 14873 | 14.5% | 5.6%(+8.87)#76 | 7.6%(+6.87)#1,860 |
| 77. | 12165 | 14.4% | 5.6%(+8.77)#77 | 7.6%(+6.77)#1,892 |
| 78. | 12419 | 14.4% | 5.6%(+8.72)#78 | 7.6%(+6.73)#1,905 |
| 79. | 12748 | 14.3% | 5.6%(+8.70)#79 | 7.6%(+6.70)#1,914 |
| 80. | 10996 | 14.3% | 5.6%(+8.63)#80 | 7.6%(+6.63)#1,951 |
| 81. | 13486 | 14.0% | 5.6%(+8.36)#81 | 7.6%(+6.37)#2,007 |
| 82. | 14102 | 13.9% | 5.6%(+8.22)#82 | 7.6%(+6.22)#2,070 |
| 83. | 12930 | 13.6% | 5.6%(+7.93)#83 | 7.6%(+5.93)#2,175 |
| 84. | 12815 | 13.6% | 5.6%(+7.91)#84 | 7.6%(+5.91)#2,184 |
| 85. | 13489 | 13.6% | 5.6%(+7.91)#85 | 7.6%(+5.91)#2,185 |
| 86. | 13676 | 13.3% | 5.6%(+7.69)#86 | 7.6%(+5.69)#2,273 |
| 87. | 12967 | 13.3% | 5.6%(+7.68)#87 | 7.6%(+5.69)#2,279 |
| 88. | 12929 | 13.3% | 5.6%(+7.62)#88 | 7.6%(+5.62)#2,312 |
| 89. | 12850 | 13.3% | 5.6%(+7.61)#89 | 7.6%(+5.61)#2,322 |
| 90. | 12468 | 13.2% | 5.6%(+7.57)#90 | 7.6%(+5.58)#2,333 |
| 91. | 13165 | 13.1% | 5.6%(+7.42)#91 | 7.6%(+5.42)#2,377 |
| 92. | 14586 | 13.1% | 5.6%(+7.40)#92 | 7.6%(+5.40)#2,384 |
| 93. | 10928 | 13.0% | 5.6%(+7.40)#93 | 7.6%(+5.40)#2,386 |
| 94. | 14172 | 13.0% | 5.6%(+7.34)#94 | 7.6%(+5.34)#2,409 |
| 95. | 12777 | 13.0% | 5.6%(+7.31)#95 | 7.6%(+5.31)#2,422 |
| 96. | 12151 | 12.9% | 5.6%(+7.30)#96 | 7.6%(+5.30)#2,425 |
| 97. | 12063 | 12.9% | 5.6%(+7.25)#97 | 7.6%(+5.26)#2,448 |
| 98. | 14469 | 12.9% | 5.6%(+7.25)#98 | 7.6%(+5.25)#2,453 |
| 99. | 10282 | 12.9% | 5.6%(+7.22)#99 | 7.6%(+5.23)#2,460 |
| 100. | 12921 | 12.6% | 5.6%(+6.95)#100 | 7.6%(+4.96)#2,578 |
Common Questions
What are the Top 10 Zip Codes with the Highest Percentage of Population with a Degree in Engineering in New York?
Top 10 Zip Codes with the Highest Percentage of Population with a Degree in Engineering in New York are:
What zip code has the Highest Percentage of Population with a Degree in Engineering in New York?
12452 has the Highest Percentage of Population with a Degree in Engineering in New York with 81.2%.
What is the Percentage of Population with a Degree in Engineering in the State of New York?
Percentage of Population with a Degree in Engineering in New York is 5.6%.
What is the Percentage of Population with a Degree in Engineering in the United States?
Percentage of Population with a Degree in Engineering in the United States is 7.6%.