Zip Codes with the Highest Percentage of Households with Income Above $200,000 in Nevada
RELATED REPORTS & OPTIONS
Household Income | $200k+
Nevada
Compare Zip Codes
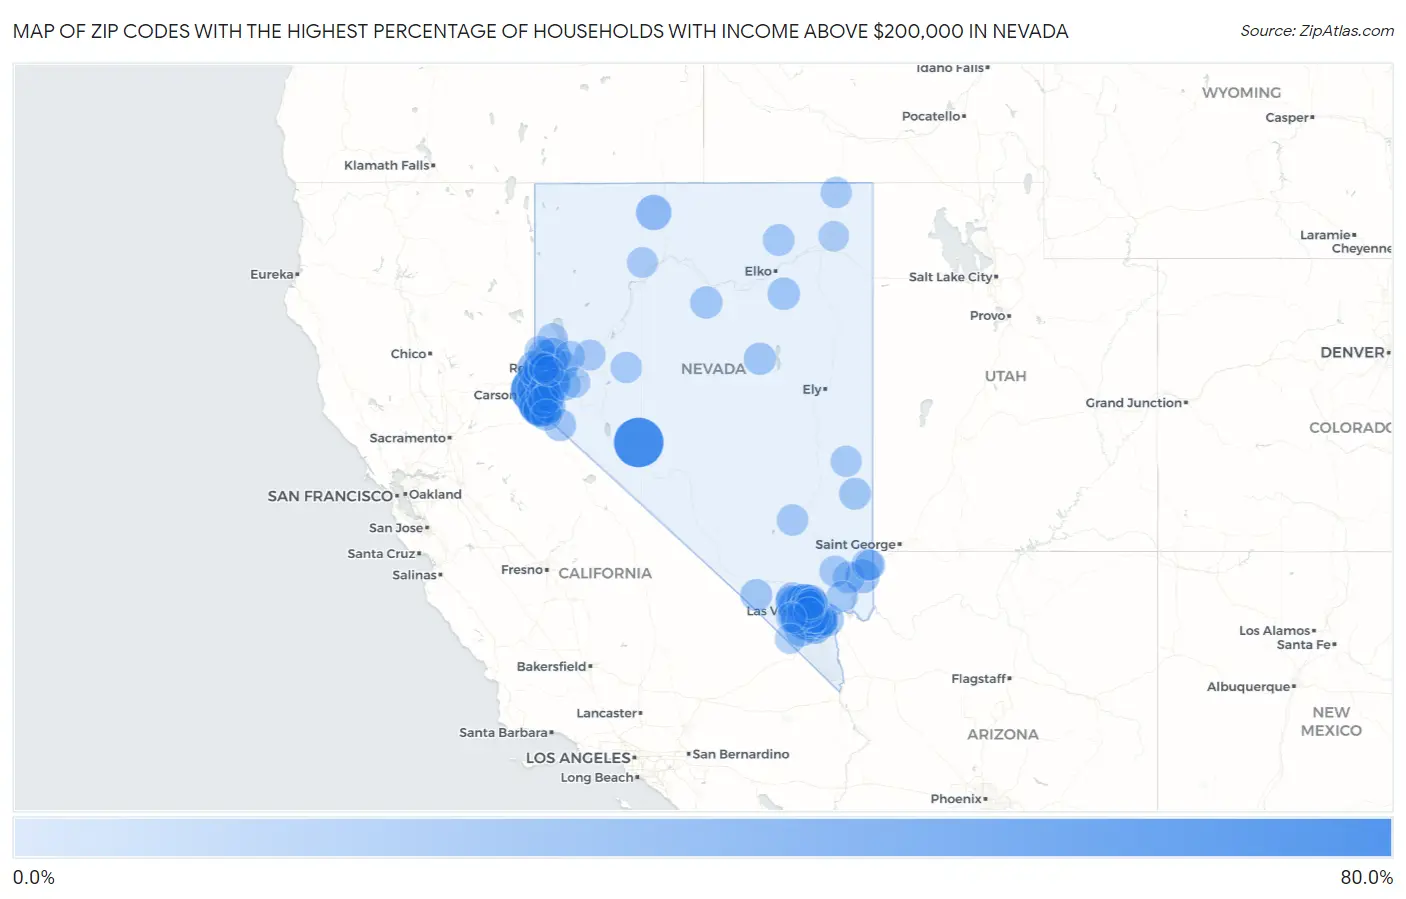
Map of Zip Codes with the Highest Percentage of Households with Income Above $200,000 in Nevada
0.0%
80.0%
Zip Codes with the Highest Percentage of Households with Income Above $200,000 in Nevada
| Zip Code | Households with Income > $200k | vs State | vs National | |
| 1. | 89420 | 66.7% | 8.7%(+58.0)#1 | 11.4%(+55.3)#69 |
| 2. | 89402 | 61.9% | 8.7%(+53.2)#2 | 11.4%(+50.5)#99 |
| 3. | 89413 | 41.6% | 8.7%(+32.9)#3 | 11.4%(+30.2)#569 |
| 4. | 89451 | 38.3% | 8.7%(+29.6)#4 | 11.4%(+26.9)#757 |
| 5. | 89519 | 38.0% | 8.7%(+29.3)#5 | 11.4%(+26.6)#769 |
| 6. | 89138 | 36.5% | 8.7%(+27.8)#6 | 11.4%(+25.1)#875 |
| 7. | 89411 | 34.2% | 8.7%(+25.5)#7 | 11.4%(+22.8)#1,045 |
| 8. | 89448 | 29.7% | 8.7%(+21.0)#8 | 11.4%(+18.3)#1,502 |
| 9. | 89158 | 28.2% | 8.7%(+19.5)#9 | 11.4%(+16.8)#1,694 |
| 10. | 89135 | 25.2% | 8.7%(+16.5)#10 | 11.4%(+13.8)#2,145 |
| 11. | 89511 | 25.1% | 8.7%(+16.4)#11 | 11.4%(+13.7)#2,170 |
| 12. | 89441 | 23.3% | 8.7%(+14.6)#12 | 11.4%(+11.9)#2,499 |
| 13. | 89439 | 21.9% | 8.7%(+13.2)#13 | 11.4%(+10.5)#2,812 |
| 14. | 89144 | 21.1% | 8.7%(+12.4)#14 | 11.4%(+9.70)#3,000 |
| 15. | 89425 | 20.1% | 8.7%(+11.4)#15 | 11.4%(+8.70)#3,270 |
| 16. | 89052 | 19.7% | 8.7%(+11.0)#16 | 11.4%(+8.30)#3,360 |
| 17. | 89044 | 19.3% | 8.7%(+10.6)#17 | 11.4%(+7.90)#3,487 |
| 18. | 89141 | 19.2% | 8.7%(+10.5)#18 | 11.4%(+7.80)#3,510 |
| 19. | 89131 | 16.5% | 8.7%(+7.80)#19 | 11.4%(+5.10)#4,362 |
| 20. | 89521 | 16.4% | 8.7%(+7.70)#20 | 11.4%(+5.00)#4,405 |
| 21. | 89007 | 15.7% | 8.7%(+7.00)#21 | 11.4%(+4.30)#4,705 |
| 22. | 89109 | 15.0% | 8.7%(+6.30)#22 | 11.4%(+3.60)#4,993 |
| 23. | 89449 | 14.8% | 8.7%(+6.10)#23 | 11.4%(+3.40)#5,098 |
| 24. | 89011 | 14.1% | 8.7%(+5.40)#24 | 11.4%(+2.70)#5,410 |
| 25. | 89509 | 13.9% | 8.7%(+5.20)#25 | 11.4%(+2.50)#5,513 |
| 26. | 89423 | 13.9% | 8.7%(+5.20)#26 | 11.4%(+2.50)#5,530 |
| 27. | 89012 | 13.8% | 8.7%(+5.10)#27 | 11.4%(+2.40)#5,562 |
| 28. | 89149 | 13.6% | 8.7%(+4.90)#28 | 11.4%(+2.20)#5,676 |
| 29. | 89703 | 13.4% | 8.7%(+4.70)#29 | 11.4%(+2.00)#5,806 |
| 30. | 89523 | 13.1% | 8.7%(+4.40)#30 | 11.4%(+1.70)#5,950 |
| 31. | 89178 | 12.7% | 8.7%(+4.00)#31 | 11.4%(+1.30)#6,195 |
| 32. | 89179 | 12.6% | 8.7%(+3.90)#32 | 11.4%(+1.20)#6,280 |
| 33. | 89436 | 12.5% | 8.7%(+3.80)#33 | 11.4%(+1.10)#6,326 |
| 34. | 89134 | 12.3% | 8.7%(+3.60)#34 | 11.4%(+0.900)#6,471 |
| 35. | 89704 | 12.2% | 8.7%(+3.50)#35 | 11.4%(+0.800)#6,549 |
| 36. | 89074 | 12.0% | 8.7%(+3.30)#36 | 11.4%(+0.600)#6,657 |
| 37. | 89166 | 12.0% | 8.7%(+3.30)#37 | 11.4%(+0.600)#6,670 |
| 38. | 89129 | 11.8% | 8.7%(+3.10)#38 | 11.4%(+0.400)#6,785 |
| 39. | 89005 | 11.8% | 8.7%(+3.10)#39 | 11.4%(+0.400)#6,807 |
| 40. | 89440 | 11.7% | 8.7%(+3.00)#40 | 11.4%(+0.300)#6,908 |
| 41. | 89113 | 11.5% | 8.7%(+2.80)#41 | 11.4%(+0.100)#7,017 |
| 42. | 89815 | 10.8% | 8.7%(+2.10)#42 | 11.4%(-0.600)#7,544 |
| 43. | 89139 | 10.7% | 8.7%(+2.00)#43 | 11.4%(-0.700)#7,606 |
| 44. | 89143 | 10.6% | 8.7%(+1.90)#44 | 11.4%(-0.800)#7,715 |
| 45. | 89084 | 10.4% | 8.7%(+1.70)#45 | 11.4%(-1.000)#7,868 |
| 46. | 89316 | 10.4% | 8.7%(+1.70)#46 | 11.4%(-1.000)#7,919 |
| 47. | 89820 | 10.3% | 8.7%(+1.60)#47 | 11.4%(-1.10)#7,989 |
| 48. | 89410 | 9.9% | 8.7%(+1.20)#48 | 11.4%(-1.50)#8,369 |
| 49. | 89148 | 9.8% | 8.7%(+1.10)#49 | 11.4%(-1.60)#8,427 |
| 50. | 89002 | 9.5% | 8.7%(+0.800)#50 | 11.4%(-1.90)#8,717 |
| 51. | 89021 | 9.2% | 8.7%(+0.500)#51 | 11.4%(-2.20)#9,083 |
| 52. | 89117 | 9.1% | 8.7%(+0.400)#52 | 11.4%(-2.30)#9,117 |
| 53. | 89701 | 9.0% | 8.7%(+0.300)#53 | 11.4%(-2.40)#9,216 |
| 54. | 89123 | 8.8% | 8.7%(+0.100)#54 | 11.4%(-2.60)#9,409 |
| 55. | 89034 | 8.8% | 8.7%(+0.100)#55 | 11.4%(-2.60)#9,466 |
| 56. | 89060 | 8.7% | 8.7%(=0.000)#56 | 11.4%(-2.70)#9,555 |
| 57. | 89042 | 8.7% | 8.7%(=0.000)#57 | 11.4%(-2.70)#9,605 |
| 58. | 89124 | 8.6% | 8.7%(-0.100)#58 | 11.4%(-2.80)#9,719 |
| 59. | 89705 | 8.4% | 8.7%(-0.300)#59 | 11.4%(-3.00)#9,914 |
| 60. | 89801 | 8.3% | 8.7%(-0.400)#60 | 11.4%(-3.10)#10,007 |
| 61. | 89118 | 8.1% | 8.7%(-0.600)#61 | 11.4%(-3.30)#10,246 |
| 62. | 89015 | 7.8% | 8.7%(-0.900)#62 | 11.4%(-3.60)#10,608 |
| 63. | 89145 | 7.5% | 8.7%(-1.20)#63 | 11.4%(-3.90)#11,055 |
| 64. | 89460 | 7.5% | 8.7%(-1.20)#64 | 11.4%(-3.90)#11,066 |
| 65. | 89001 | 7.5% | 8.7%(-1.20)#65 | 11.4%(-3.90)#11,134 |
| 66. | 89183 | 7.4% | 8.7%(-1.30)#66 | 11.4%(-4.00)#11,186 |
| 67. | 89146 | 7.4% | 8.7%(-1.30)#67 | 11.4%(-4.00)#11,203 |
| 68. | 89825 | 7.0% | 8.7%(-1.70)#68 | 11.4%(-4.40)#11,860 |
| 69. | 89025 | 7.0% | 8.7%(-1.70)#69 | 11.4%(-4.40)#11,865 |
| 70. | 89014 | 6.8% | 8.7%(-1.90)#70 | 11.4%(-4.60)#12,056 |
| 71. | 89081 | 6.8% | 8.7%(-1.90)#71 | 11.4%(-4.60)#12,058 |
| 72. | 89130 | 6.8% | 8.7%(-1.90)#72 | 11.4%(-4.60)#12,065 |
| 73. | 89406 | 6.8% | 8.7%(-1.90)#73 | 11.4%(-4.60)#12,078 |
| 74. | 89147 | 6.6% | 8.7%(-2.10)#74 | 11.4%(-4.80)#12,388 |
| 75. | 89128 | 6.5% | 8.7%(-2.20)#75 | 11.4%(-4.90)#12,560 |
| 76. | 89040 | 6.5% | 8.7%(-2.20)#76 | 11.4%(-4.90)#12,618 |
| 77. | 89085 | 6.5% | 8.7%(-2.20)#77 | 11.4%(-4.90)#12,619 |
| 78. | 89043 | 6.5% | 8.7%(-2.20)#78 | 11.4%(-4.90)#12,666 |
| 79. | 89403 | 6.4% | 8.7%(-2.30)#79 | 11.4%(-5.00)#12,750 |
| 80. | 89434 | 6.3% | 8.7%(-2.40)#80 | 11.4%(-5.10)#12,920 |
| 81. | 89506 | 6.2% | 8.7%(-2.50)#81 | 11.4%(-5.20)#13,069 |
| 82. | 89120 | 6.1% | 8.7%(-2.60)#82 | 11.4%(-5.30)#13,268 |
| 83. | 89408 | 6.0% | 8.7%(-2.70)#83 | 11.4%(-5.40)#13,459 |
| 84. | 89510 | 6.0% | 8.7%(-2.70)#84 | 11.4%(-5.40)#13,568 |
| 85. | 89445 | 5.8% | 8.7%(-2.90)#85 | 11.4%(-5.60)#13,869 |
| 86. | 89086 | 5.7% | 8.7%(-3.00)#86 | 11.4%(-5.70)#14,132 |
| 87. | 89508 | 5.4% | 8.7%(-3.30)#87 | 11.4%(-6.00)#14,698 |
| 88. | 89004 | 5.4% | 8.7%(-3.30)#88 | 11.4%(-6.00)#14,847 |
| 89. | 89501 | 5.2% | 8.7%(-3.50)#89 | 11.4%(-6.20)#15,181 |
| 90. | 89032 | 5.1% | 8.7%(-3.60)#90 | 11.4%(-6.30)#15,295 |
| 91. | 89503 | 5.1% | 8.7%(-3.60)#91 | 11.4%(-6.30)#15,315 |
| 92. | 89442 | 5.0% | 8.7%(-3.70)#92 | 11.4%(-6.40)#15,762 |
| 93. | 89031 | 4.8% | 8.7%(-3.90)#93 | 11.4%(-6.60)#16,023 |
| 94. | 89027 | 4.7% | 8.7%(-4.00)#94 | 11.4%(-6.70)#16,310 |
| 95. | 89835 | 4.7% | 8.7%(-4.00)#95 | 11.4%(-6.70)#16,439 |
| 96. | 89102 | 4.6% | 8.7%(-4.10)#96 | 11.4%(-6.80)#16,514 |
| 97. | 89161 | 4.5% | 8.7%(-4.20)#97 | 11.4%(-6.90)#16,980 |
| 98. | 89429 | 4.3% | 8.7%(-4.40)#98 | 11.4%(-7.10)#17,330 |
| 99. | 89019 | 4.3% | 8.7%(-4.40)#99 | 11.4%(-7.10)#17,411 |
| 100. | 89502 | 4.2% | 8.7%(-4.50)#100 | 11.4%(-7.20)#17,532 |
1
2Common Questions
What are the Top 10 Zip Codes with the Highest Percentage of Households with Income Above $200,000 in Nevada?
Top 10 Zip Codes with the Highest Percentage of Households with Income Above $200,000 in Nevada are:
What zip code has the Highest Percentage of Households with Income Above $200,000 in Nevada?
89420 has the Highest Percentage of Households with Income Above $200,000 in Nevada with 66.7%.
What is the Percentage of Households with Income Above $200,000 in the State of Nevada?
Percentage of Households with Income Above $200,000 in Nevada is 8.7%.
What is the Percentage of Households with Income Above $200,000 in the United States?
Percentage of Households with Income Above $200,000 in the United States is 11.4%.