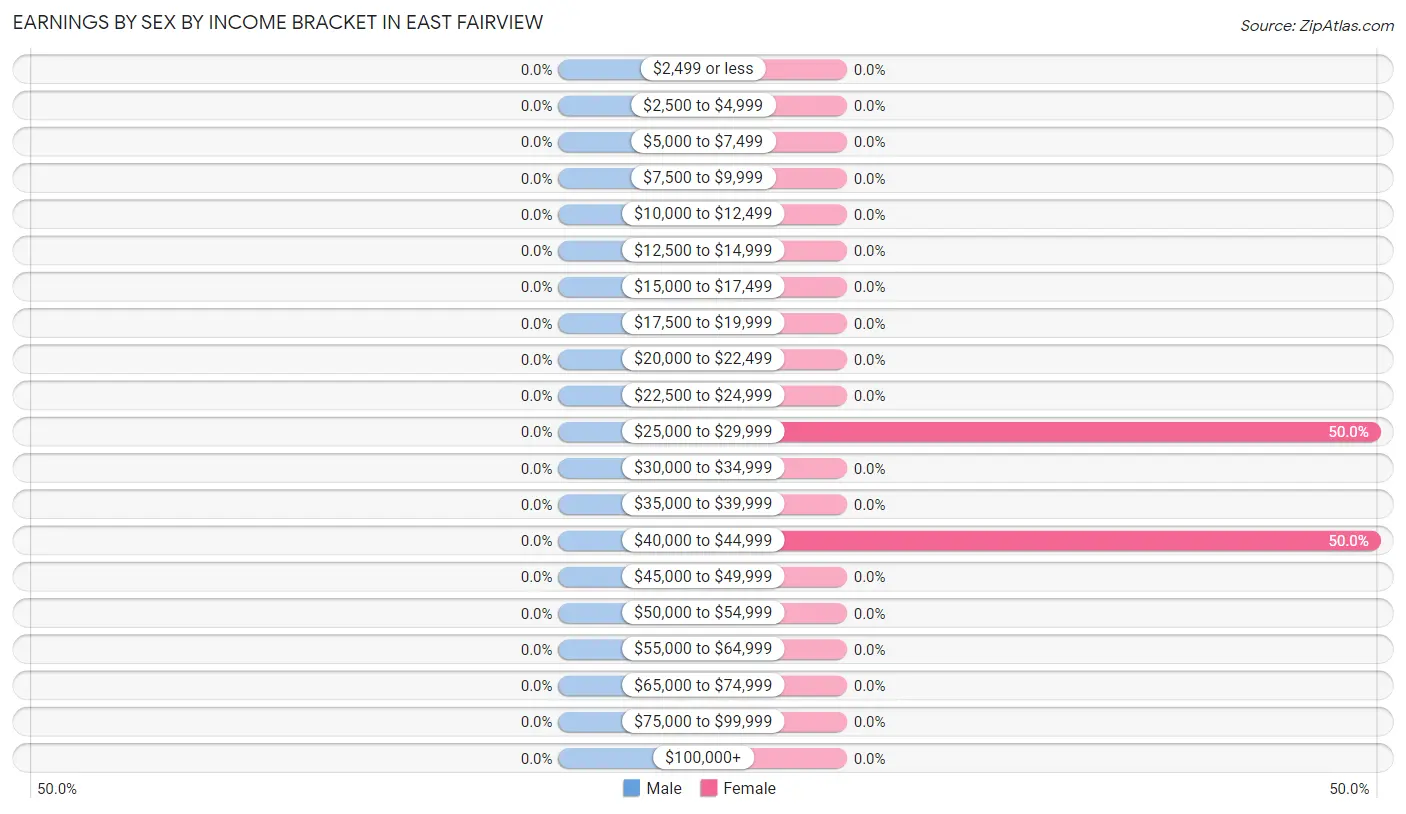
Earnings by Sex by Income Bracket in East Fairview
Income
Male
Female
$2,499 or less
0 (0.0%)
0 (0.0%)
$2,500 to $4,999
0 (0.0%)
0 (0.0%)
$5,000 to $7,499
0 (0.0%)
0 (0.0%)
$7,500 to $9,999
0 (0.0%)
0 (0.0%)
$10,000 to $12,499
0 (0.0%)
0 (0.0%)
$12,500 to $14,999
0 (0.0%)
0 (0.0%)
$15,000 to $17,499
0 (0.0%)
0 (0.0%)
$17,500 to $19,999
0 (0.0%)
0 (0.0%)
$20,000 to $22,499
0 (0.0%)
0 (0.0%)
$22,500 to $24,999
0 (0.0%)
0 (0.0%)
$25,000 to $29,999
0 (0.0%)
3 (50.0%)
$30,000 to $34,999
0 (0.0%)
0 (0.0%)
$35,000 to $39,999
0 (0.0%)
0 (0.0%)
$40,000 to $44,999
0 (0.0%)
3 (50.0%)
$45,000 to $49,999
0 (0.0%)
0 (0.0%)
$50,000 to $54,999
0 (0.0%)
0 (0.0%)
$55,000 to $64,999
0 (0.0%)
0 (0.0%)
$65,000 to $74,999
0 (0.0%)
0 (0.0%)
$75,000 to $99,999
0 (0.0%)
0 (0.0%)
$100,000+
0 (0.0%)
0 (0.0%)
Total
0 (0.0%)
6 (100.0%)
Earnings by Sex by Educational Attainment in East Fairview
Educational Attainment
Male Income
Female Income
Less than High School
-
-
High School Diploma
-
-
College or Associate's Degree
-
-
Bachelor's Degree
-
-
Graduate Degree
-
-
Total
-
-
Family Income in East Fairview
Family Income Brackets in East Fairview
Income Bracket
# Families
% Families
Less than $10,000
0
0.0%
$10,000 to $14,999
0
0.0%
$15,000 to $24,999
0
0.0%
$25,000 to $34,999
0
0.0%
$35,000 to $49,999
0
0.0%
$50,000 to $74,999
0
0.0%
$75,000 to $99,999
0
0.0%
$100,000 to $149,999
0
0.0%
$150,000 to $199,999
0
0.0%
$200,000+
0
0.0%
Family Income by Famaliy Size in East Fairview
Income Bracket
# Families
Median Income
2-Person Families
0 (0.0%)
$0
3-Person Families
0 (0.0%)
$0
4-Person Families
0 (0.0%)
$0
5-Person Families
0 (0.0%)
$0
6-Person Families
0 (0.0%)
$0
7+ Person Families
0 (0.0%)
$0
Total
0 (0.0%)
$0
Family Income by Number of Earners in East Fairview
Number of Earners
# Families
Median Income
No Earners
0 (0.0%)
$0
1 Earner
0 (0.0%)
$0
2 Earners
0 (0.0%)
$0
3+ Earners
0 (0.0%)
$0
Total
0 (0.0%)
$0
Household Income in East Fairview
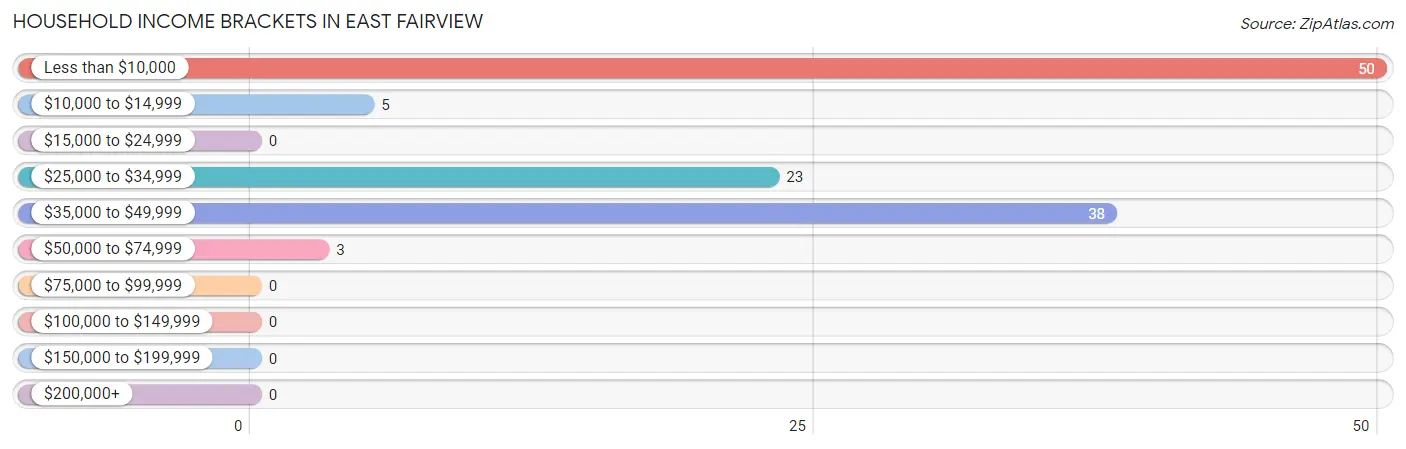
Household Income Brackets in East Fairview
With 50 households falling in the category, the less than $10,000 income range is the most frequent in East Fairview, accounting for 42.0% of all households.
Income Bracket
# Households
% Households
Less than $10,000
50
42.0%
$10,000 to $14,999
5
4.2%
$15,000 to $24,999
0
0.0%
$25,000 to $34,999
23
19.3%
$35,000 to $49,999
38
31.9%
$50,000 to $74,999
3
2.5%
$75,000 to $99,999
0
0.0%
$100,000 to $149,999
0
0.0%
$150,000 to $199,999
0
0.0%
$200,000+
0
0.0%
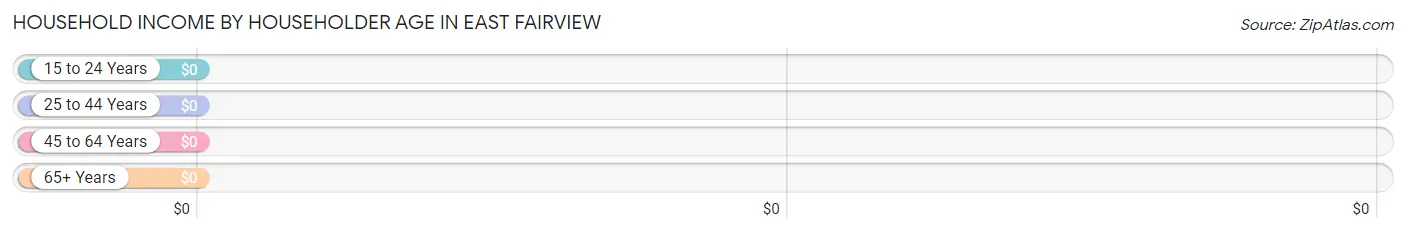
Household Income by Householder Age in East Fairview
Income Bracket
# Households
Median Income
15 to 24 Years
0 (0.0%)
$0
25 to 44 Years
3 (2.5%)
$0
45 to 64 Years
0 (0.0%)
$0
65+ Years
116 (97.5%)
$0
Total
119 (100.0%)
$0
Poverty in East Fairview
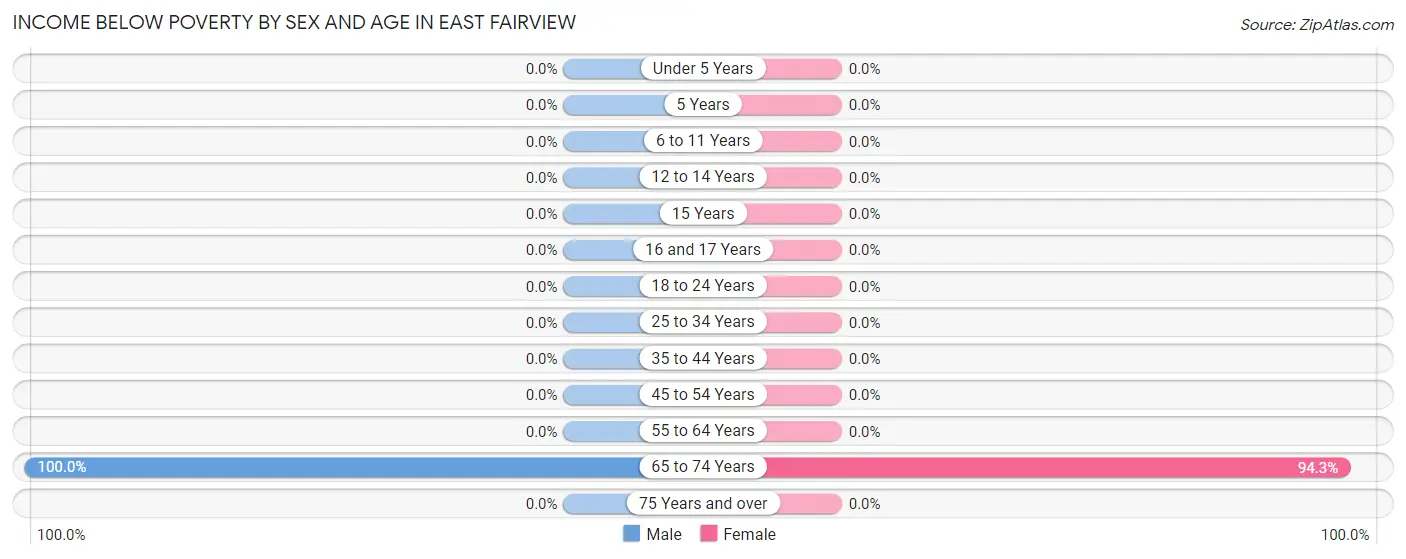
Income Below Poverty by Sex and Age in East Fairview
With 7.9% poverty level for males and 89.3% for females among the residents of East Fairview, 65 to 74 year old males and 65 to 74 year old females are the most vulnerable to poverty, with 5 males (100.0%) and 50 females (94.3%) in their respective age groups living below the poverty level.
Age Bracket
Male
Female
Under 5 Years
0 (0.0%)
0 (0.0%)
5 Years
0 (0.0%)
0 (0.0%)
6 to 11 Years
0 (0.0%)
0 (0.0%)
12 to 14 Years
0 (0.0%)
0 (0.0%)
15 Years
0 (0.0%)
0 (0.0%)
16 and 17 Years
0 (0.0%)
0 (0.0%)
18 to 24 Years
0 (0.0%)
0 (0.0%)
25 to 34 Years
0 (0.0%)
0 (0.0%)
35 to 44 Years
0 (0.0%)
0 (0.0%)
45 to 54 Years
0 (0.0%)
0 (0.0%)
55 to 64 Years
0 (0.0%)
0 (0.0%)
65 to 74 Years
5 (100.0%)
50 (94.3%)
75 Years and over
0 (0.0%)
0 (0.0%)
Total
5 (7.9%)
50 (89.3%)
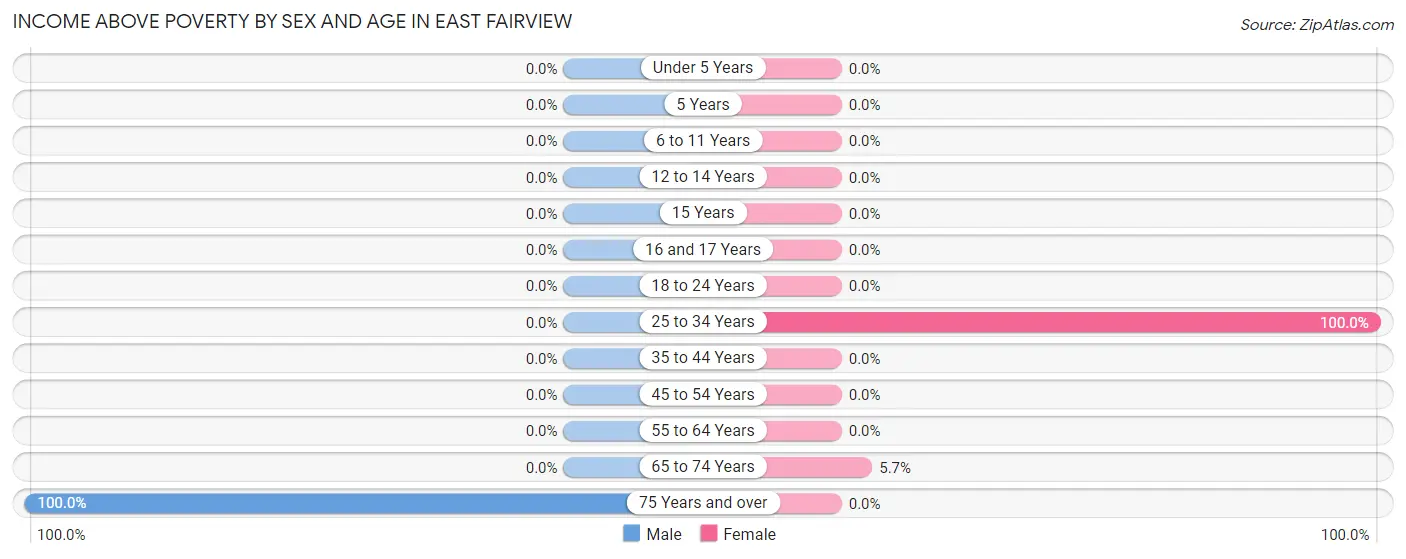
Income Above Poverty by Sex and Age in East Fairview
According to the poverty statistics in East Fairview, males aged 75 years and over and females aged 25 to 34 years are the age groups that are most secure financially, with 100.0% of males and 100.0% of females in these age groups living above the poverty line.
Age Bracket
Male
Female
Under 5 Years
0 (0.0%)
0 (0.0%)
5 Years
0 (0.0%)
0 (0.0%)
6 to 11 Years
0 (0.0%)
0 (0.0%)
12 to 14 Years
0 (0.0%)
0 (0.0%)
15 Years
0 (0.0%)
0 (0.0%)
16 and 17 Years
0 (0.0%)
0 (0.0%)
18 to 24 Years
0 (0.0%)
0 (0.0%)
25 to 34 Years
0 (0.0%)
3 (100.0%)
35 to 44 Years
0 (0.0%)
0 (0.0%)
45 to 54 Years
0 (0.0%)
0 (0.0%)
55 to 64 Years
0 (0.0%)
0 (0.0%)
65 to 74 Years
0 (0.0%)
3 (5.7%)
75 Years and over
58 (100.0%)
0 (0.0%)
Total
58 (92.1%)
6 (10.7%)
Income Below Poverty Among Married-Couple Families in East Fairview
Children
Above Poverty
Below Poverty
No Children
0 (0.0%)
0 (0.0%)
1 or 2 Children
0 (0.0%)
0 (0.0%)
3 or 4 Children
0 (0.0%)
0 (0.0%)
5 or more Children
0 (0.0%)
0 (0.0%)
Total
0 (0.0%)
0 (0.0%)
Income Below Poverty Among Single-Parent Households in East Fairview
Children
Single Father
Single Mother
No Children
0 (0.0%)
0 (0.0%)
1 or 2 Children
0 (0.0%)
0 (0.0%)
3 or 4 Children
0 (0.0%)
0 (0.0%)
5 or more Children
0 (0.0%)
0 (0.0%)
Total
0 (0.0%)
0 (0.0%)
Income Below Poverty Among Married-Couple vs Single-Parent Households in East Fairview
Children
Married-Couple Families
Single-Parent Households
No Children
0 (0.0%)
0 (0.0%)
1 or 2 Children
0 (0.0%)
0 (0.0%)
3 or 4 Children
0 (0.0%)
0 (0.0%)
5 or more Children
0 (0.0%)
0 (0.0%)
Total
0 (0.0%)
0 (0.0%)
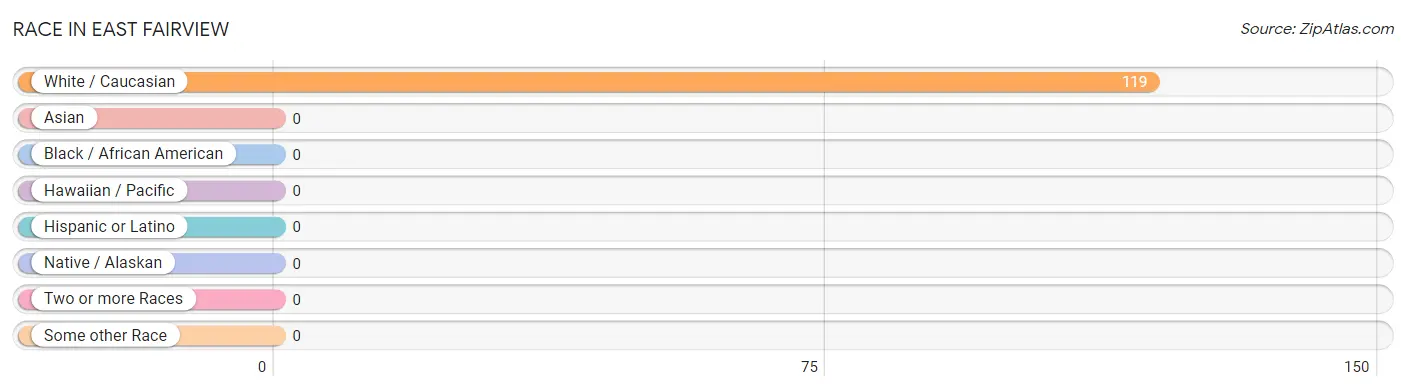
Race in East Fairview
The most populous races in East Fairview are , and White / Caucasian (119 | 100.0%).
Race
# Population
% Population
Asian
0
0.0%
Black / African American
0
0.0%
Hawaiian / Pacific
0
0.0%
Hispanic or Latino
0
0.0%
Native / Alaskan
0
0.0%
White / Caucasian
119
100.0%
Two or more Races
0
0.0%
Some other Race
0
0.0%
Total
119
100.0%
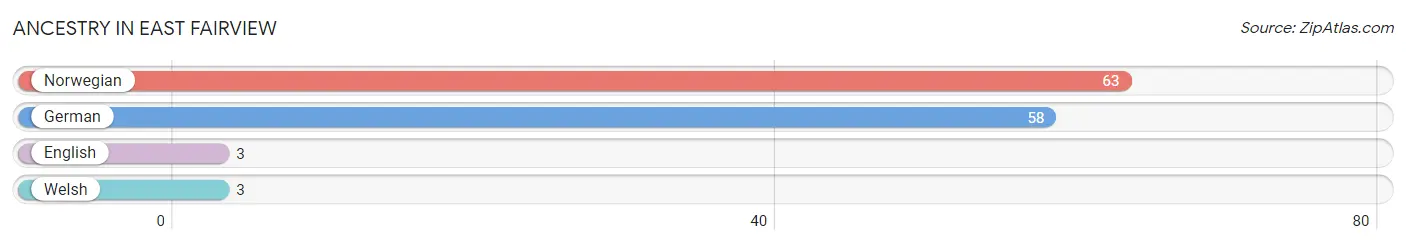
Ancestry in East Fairview
The most populous ancestries reported in East Fairview are Norwegian (63 | 52.9%), German (58 | 48.7%), English (3 | 2.5%), and Welsh (3 | 2.5%), together accounting for 106.7% of all East Fairview residents.
Ancestry
# Population
% Population
English
3
2.5%
German
58
48.7%
Norwegian
63
52.9%
Welsh
3
2.5%
View All 4 Rows
Immigrants in East Fairview
Immigration Origin
# Population
% Population
View All 0 Rows
Sex and Age in East Fairview
Sex and Age in East Fairview
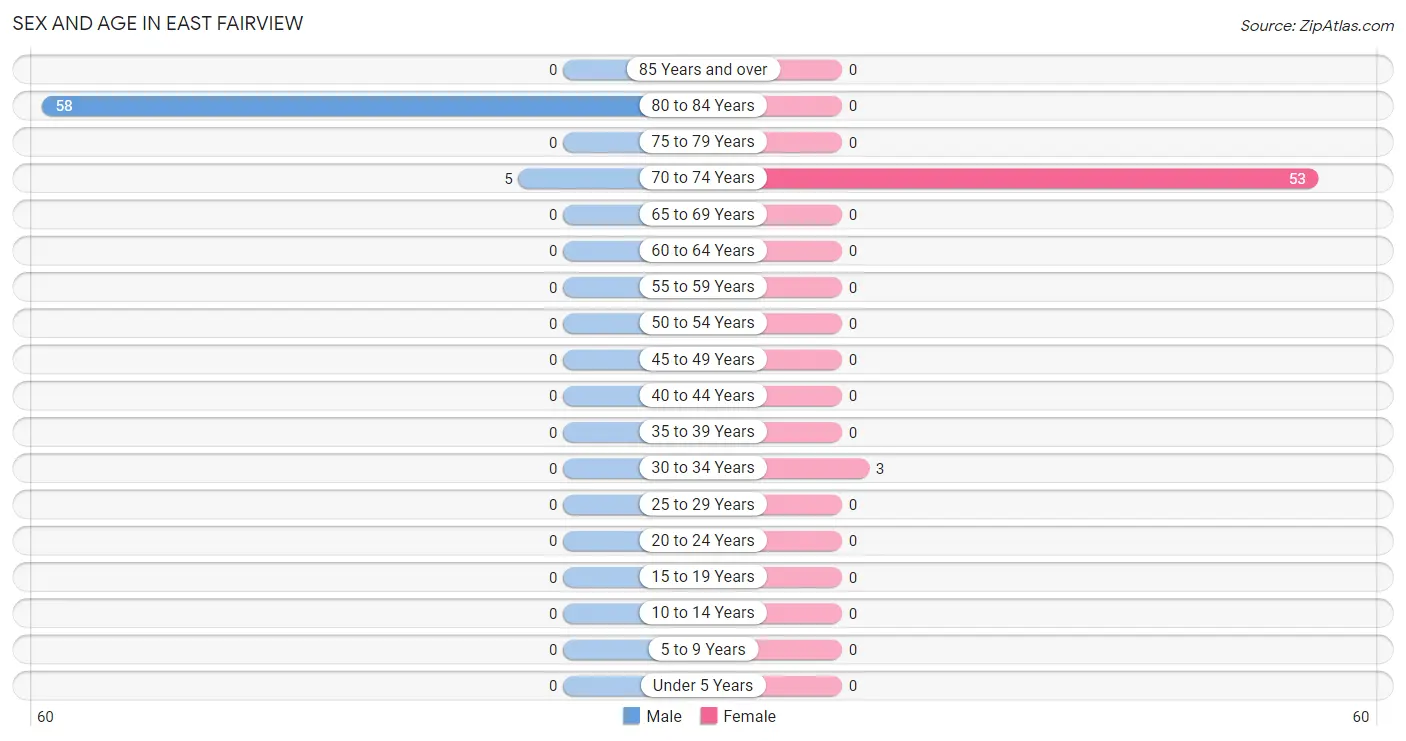
The most populous age groups in East Fairview are 80 to 84 Years (58 | 92.1%) for men and 70 to 74 Years (53 | 94.6%) for women.
Age Bracket
Male
Female
Under 5 Years
0 (0.0%)
0 (0.0%)
5 to 9 Years
0 (0.0%)
0 (0.0%)
10 to 14 Years
0 (0.0%)
0 (0.0%)
15 to 19 Years
0 (0.0%)
0 (0.0%)
20 to 24 Years
0 (0.0%)
0 (0.0%)
25 to 29 Years
0 (0.0%)
0 (0.0%)
30 to 34 Years
0 (0.0%)
3 (5.4%)
35 to 39 Years
0 (0.0%)
0 (0.0%)
40 to 44 Years
0 (0.0%)
0 (0.0%)
45 to 49 Years
0 (0.0%)
0 (0.0%)
50 to 54 Years
0 (0.0%)
0 (0.0%)
55 to 59 Years
0 (0.0%)
0 (0.0%)
60 to 64 Years
0 (0.0%)
0 (0.0%)
65 to 69 Years
0 (0.0%)
0 (0.0%)
70 to 74 Years
5 (7.9%)
53 (94.6%)
75 to 79 Years
0 (0.0%)
0 (0.0%)
80 to 84 Years
58 (92.1%)
0 (0.0%)
85 Years and over
0 (0.0%)
0 (0.0%)
Total
63 (100.0%)
56 (100.0%)
Families and Households in East Fairview
Median Family Size in East Fairview
Family Type
# Families
Family Size
Married-Couple
0 (0.0%)
-
Single Male/Father
0 (0.0%)
-
Single Female/Mother
0 (0.0%)
-
Total Families
0 (0.0%)
-
Median Household Size in East Fairview
Household Type
# Households
Household Size
Married-Couple
0 (0.0%)
-
Single Male/Father
0 (0.0%)
-
Single Female/Mother
0 (0.0%)
-
Non-family
119 (100.0%)
-
Total Households
119 (100.0%)
-
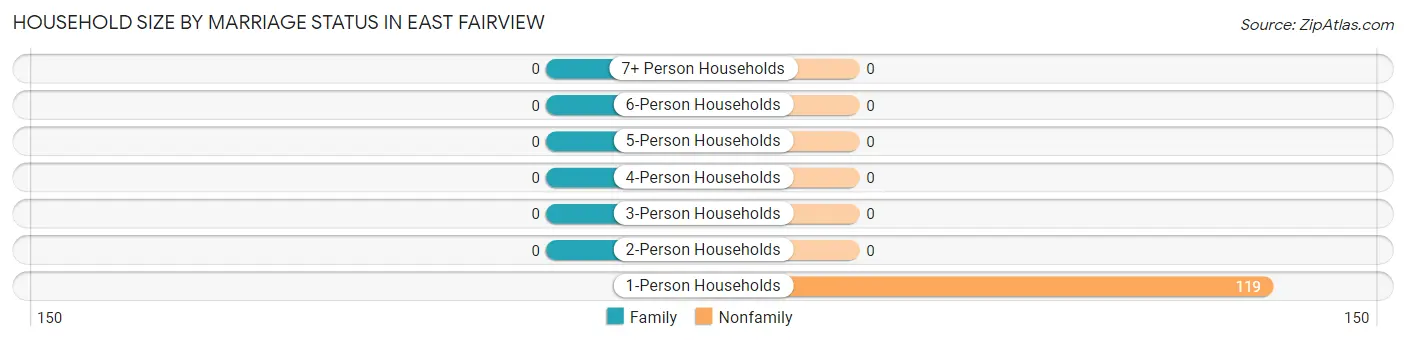
Household Size by Marriage Status in East Fairview
Household Size
Family Households
Nonfamily Households
1-Person Households
-
119 (100.0%)
2-Person Households
0 (0.0%)
0 (0.0%)
3-Person Households
0 (0.0%)
0 (0.0%)
4-Person Households
0 (0.0%)
0 (0.0%)
5-Person Households
0 (0.0%)
0 (0.0%)
6-Person Households
0 (0.0%)
0 (0.0%)
7+ Person Households
0 (0.0%)
0 (0.0%)
Total
0 (0.0%)
119 (100.0%)
Female Fertility in East Fairview
Fertility by Age in East Fairview
Age Bracket
Women with Births
Births / 1,000 Women
15 to 19 years
0 (0.0%)
0.0
20 to 34 years
0 (0.0%)
0.0
35 to 50 years
0 (0.0%)
0.0
Total
0 (0.0%)
0.0
Fertility by Age by Marriage Status in East Fairview
Age Bracket
Married
Unmarried
15 to 19 years
0 (0.0%)
0 (0.0%)
20 to 34 years
0 (0.0%)
0 (0.0%)
35 to 50 years
0 (0.0%)
0 (0.0%)
Total
0 (0.0%)
0 (0.0%)
Fertility by Education in East Fairview
Educational Attainment
Women with Births
Births / 1,000 Women
Less than High School
0 (0.0%)
0.0
High School Diploma
0 (0.0%)
0.0
College or Associate's Degree
0 (0.0%)
0.0
Bachelor's Degree
0 (0.0%)
0.0
Graduate Degree
0 (0.0%)
0.0
Total
0 (0.0%)
0.0
Fertility by Education by Marriage Status in East Fairview
Educational Attainment
Married
Unmarried
Less than High School
0 (0.0%)
0 (0.0%)
High School Diploma
0 (0.0%)
0 (0.0%)
College or Associate's Degree
0 (0.0%)
0 (0.0%)
Bachelor's Degree
0 (0.0%)
0 (0.0%)
Graduate Degree
0 (0.0%)
0 (0.0%)
Total
0 (0.0%)
0 (0.0%)
Employment Characteristics in East Fairview
Employment by Class of Employer in East Fairview
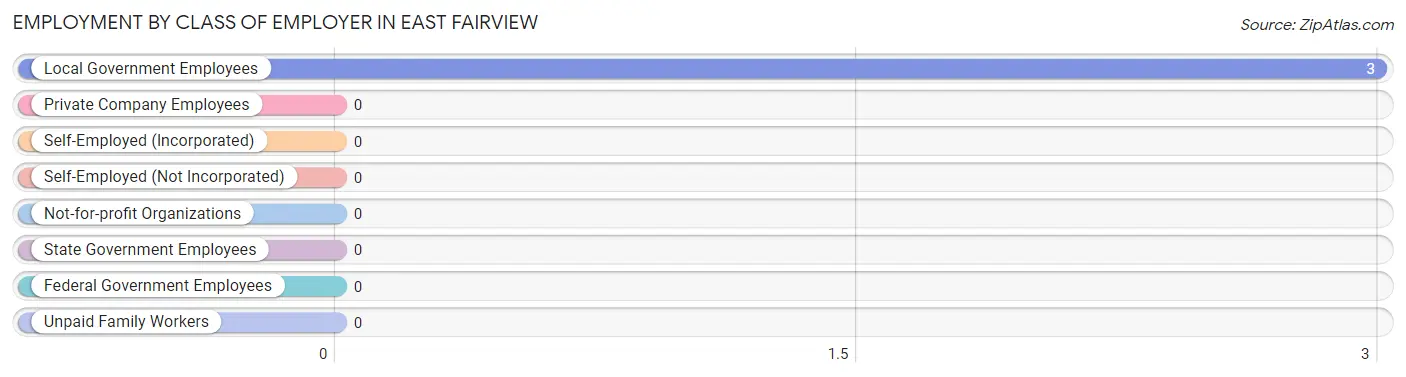
Among the 3 employed individuals in East Fairview, , and local government employees (3 | 100.0%) make up the most common classes of employment.
Employer Class
# Employees
% Employees
Private Company Employees
0
0.0%
Self-Employed (Incorporated)
0
0.0%
Self-Employed (Not Incorporated)
0
0.0%
Not-for-profit Organizations
0
0.0%
Local Government Employees
3
100.0%
State Government Employees
0
0.0%
Federal Government Employees
0
0.0%
Unpaid Family Workers
0
0.0%
Total
3
100.0%
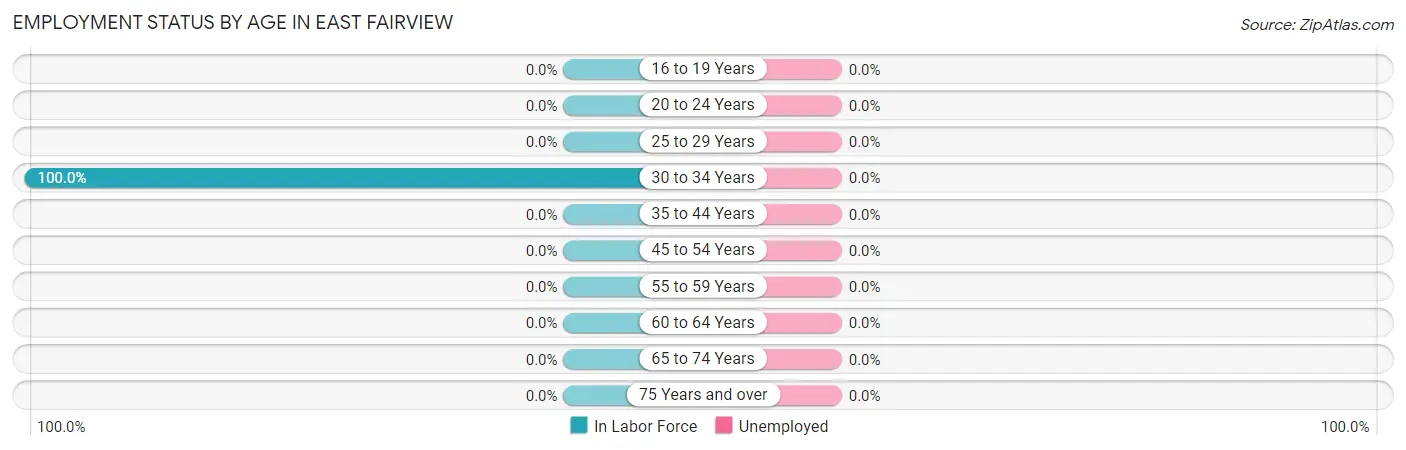
Employment Status by Age in East Fairview
Age Bracket
In Labor Force
Unemployed
16 to 19 Years
0 (0.0%)
0 (0.0%)
20 to 24 Years
0 (0.0%)
0 (0.0%)
25 to 29 Years
0 (0.0%)
0 (0.0%)
30 to 34 Years
3 (100.0%)
0 (0.0%)
35 to 44 Years
0 (0.0%)
0 (0.0%)
45 to 54 Years
0 (0.0%)
0 (0.0%)
55 to 59 Years
0 (0.0%)
0 (0.0%)
60 to 64 Years
0 (0.0%)
0 (0.0%)
65 to 74 Years
0 (0.0%)
0 (0.0%)
75 Years and over
0 (0.0%)
0 (0.0%)
Total
3 (2.5%)
0 (0.0%)
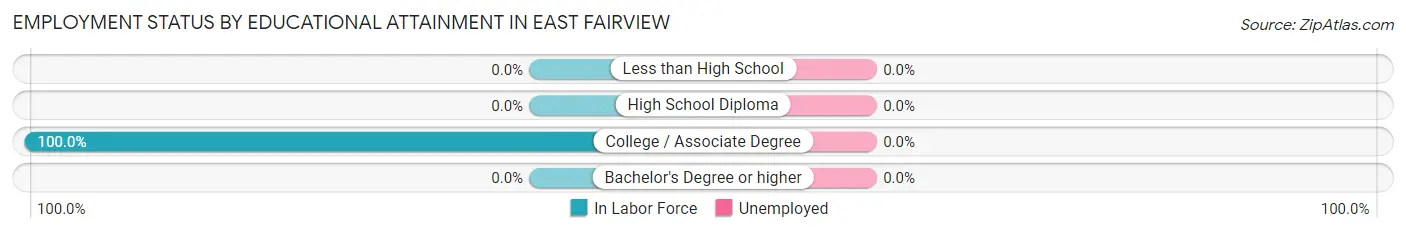
Employment Status by Educational Attainment in East Fairview
Educational Attainment
In Labor Force
Unemployed
Less than High School
0 (0.0%)
0 (0.0%)
High School Diploma
0 (0.0%)
0 (0.0%)
College / Associate Degree
3 (100.0%)
0 (0.0%)
Bachelor's Degree or higher
0 (0.0%)
0 (0.0%)
Total
3 (100.0%)
0 (0.0%)
Employment Occupations by Sex in East Fairview
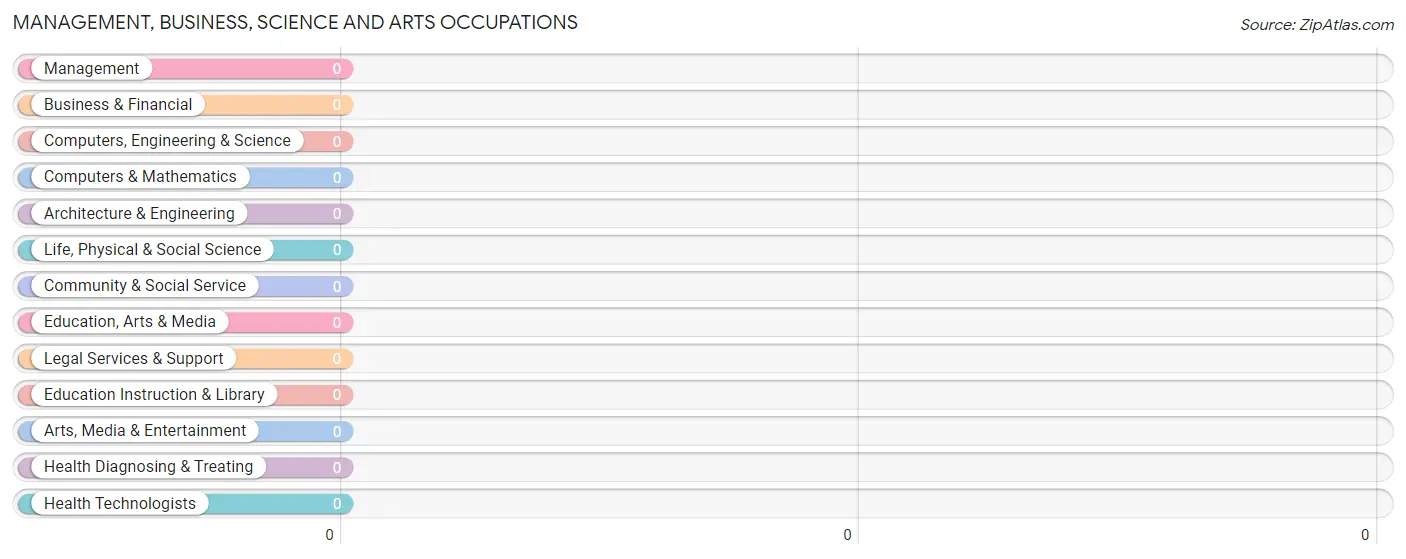
Management, Business, Science and Arts Occupations
Management, Business, Science and Arts Occupations by Sex
Occupation
Male
Female
Management
0 (0.0%)
0 (0.0%)
Business & Financial
0 (0.0%)
0 (0.0%)
Computers, Engineering & Science
0 (0.0%)
0 (0.0%)
Computers & Mathematics
0 (0.0%)
0 (0.0%)
Architecture & Engineering
0 (0.0%)
0 (0.0%)
Life, Physical & Social Science
0 (0.0%)
0 (0.0%)
Community & Social Service
0 (0.0%)
0 (0.0%)
Education, Arts & Media
0 (0.0%)
0 (0.0%)
Legal Services & Support
0 (0.0%)
0 (0.0%)
Education Instruction & Library
0 (0.0%)
0 (0.0%)
Arts, Media & Entertainment
0 (0.0%)
0 (0.0%)
Health Diagnosing & Treating
0 (0.0%)
0 (0.0%)
Health Technologists
0 (0.0%)
0 (0.0%)
Total (Category)
0 (0.0%)
0 (0.0%)
Total (Overall)
0 (0.0%)
3 (100.0%)
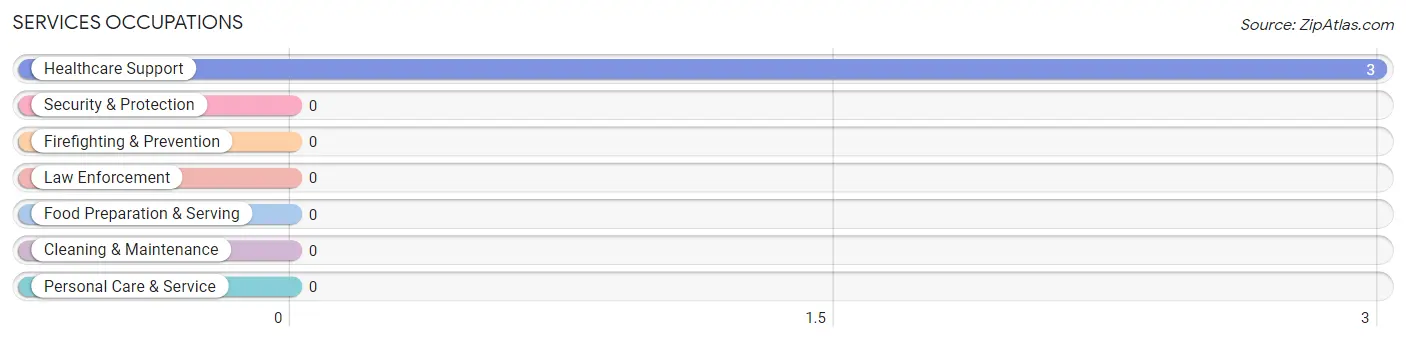
Services Occupations
The most common Services occupations in East Fairview are , and Healthcare Support (3 | 100.0%).
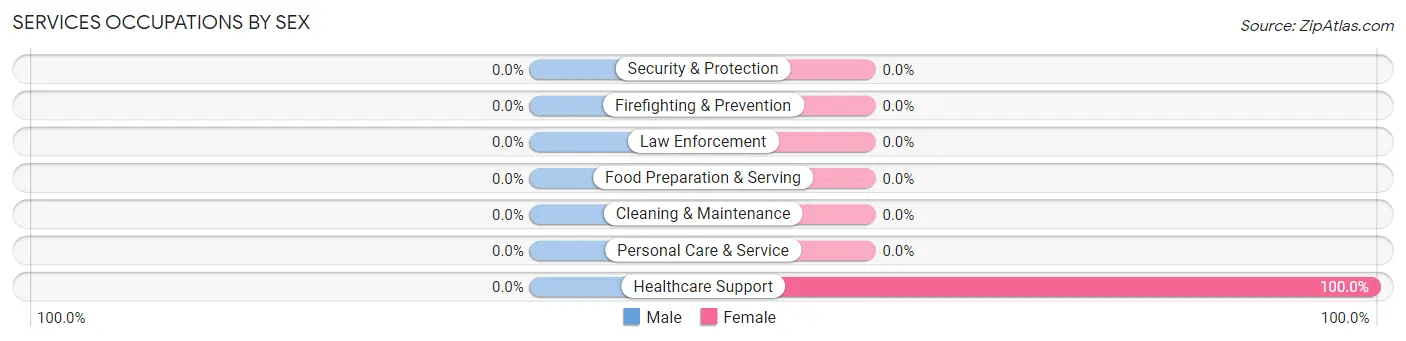
Services Occupations by Sex
Occupation
Male
Female
Healthcare Support
0 (0.0%)
3 (100.0%)
Security & Protection
0 (0.0%)
0 (0.0%)
Firefighting & Prevention
0 (0.0%)
0 (0.0%)
Law Enforcement
0 (0.0%)
0 (0.0%)
Food Preparation & Serving
0 (0.0%)
0 (0.0%)
Cleaning & Maintenance
0 (0.0%)
0 (0.0%)
Personal Care & Service
0 (0.0%)
0 (0.0%)
Total (Category)
0 (0.0%)
3 (100.0%)
Total (Overall)
0 (0.0%)
3 (100.0%)
Sales and Office Occupations
Sales and Office Occupations by Sex
Occupation
Male
Female
Sales & Related
0 (0.0%)
0 (0.0%)
Office & Administration
0 (0.0%)
0 (0.0%)
Total (Category)
0 (0.0%)
0 (0.0%)
Total (Overall)
0 (0.0%)
3 (100.0%)
Natural Resources, Construction and Maintenance Occupations
Natural Resources, Construction and Maintenance Occupations by Sex
Occupation
Male
Female
Farming, Fishing & Forestry
0 (0.0%)
0 (0.0%)
Construction & Extraction
0 (0.0%)
0 (0.0%)
Installation, Maintenance & Repair
0 (0.0%)
0 (0.0%)
Total (Category)
0 (0.0%)
0 (0.0%)
Total (Overall)
0 (0.0%)
3 (100.0%)
Production, Transportation and Moving Occupations
Production, Transportation and Moving Occupations by Sex
Occupation
Male
Female
Production
0 (0.0%)
0 (0.0%)
Transportation
0 (0.0%)
0 (0.0%)
Material Moving
0 (0.0%)
0 (0.0%)
Total (Category)
0 (0.0%)
0 (0.0%)
Total (Overall)
0 (0.0%)
3 (100.0%)
Employment Industries by Sex in East Fairview
Employment Industries in East Fairview
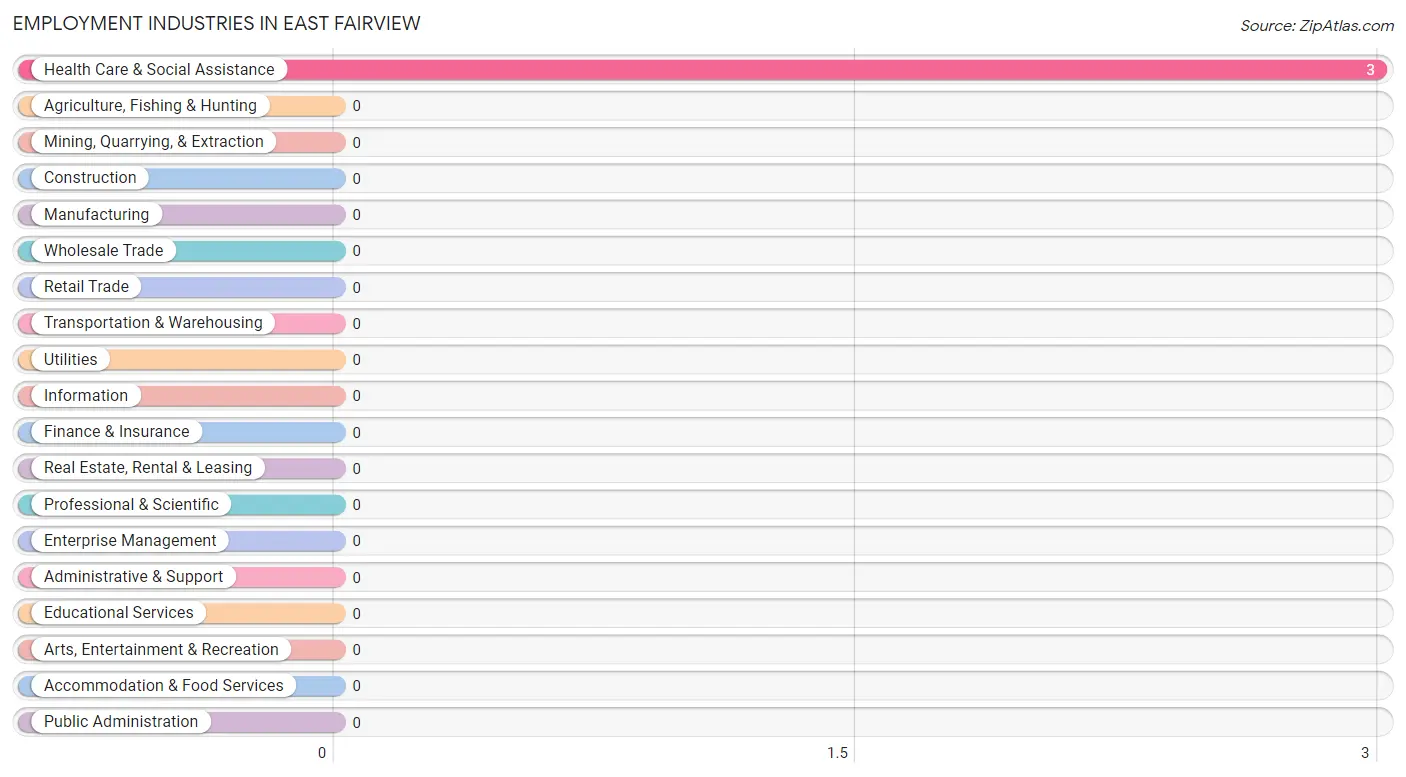
The major employment industries in East Fairview include , and Health Care & Social Assistance (3 | 100.0%).
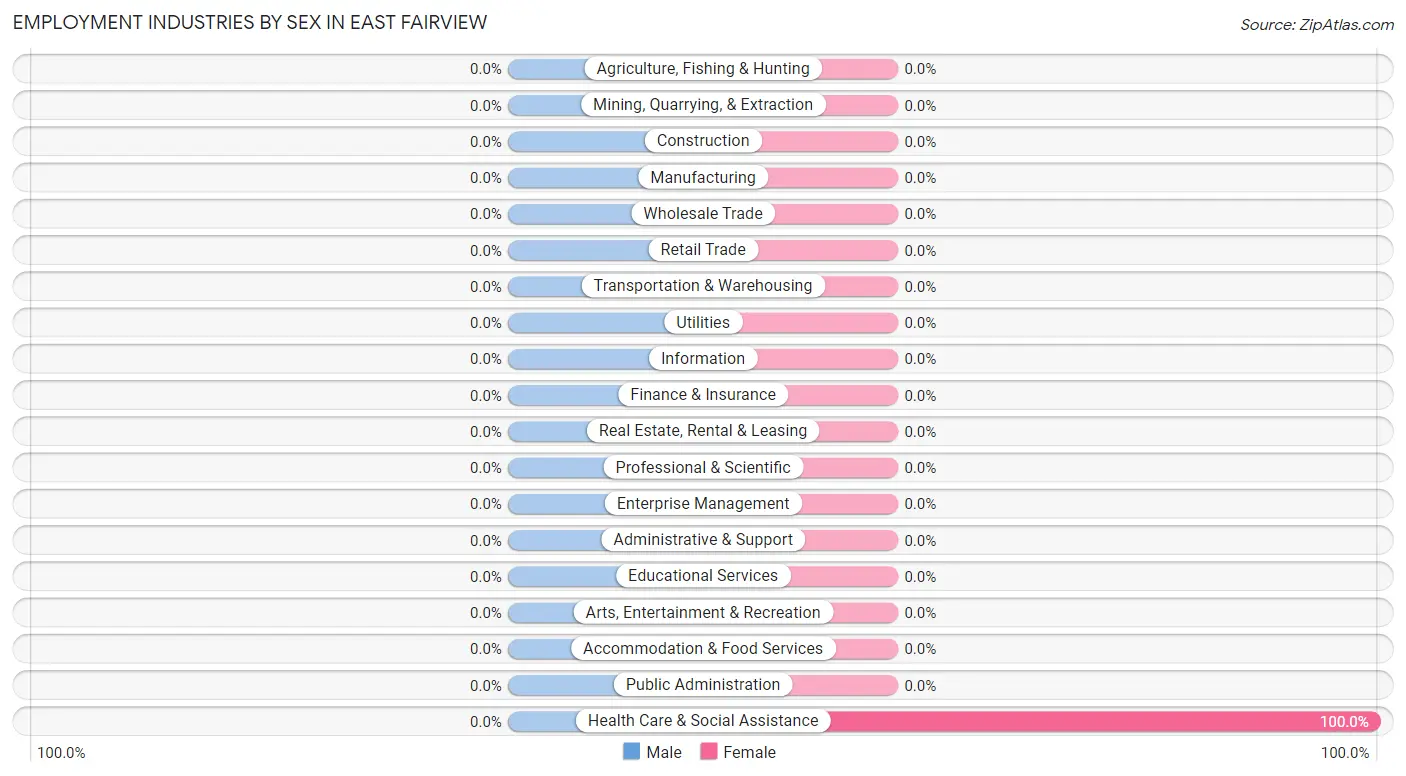
Employment Industries by Sex in East Fairview
Industry
Male
Female
Agriculture, Fishing & Hunting
0 (0.0%)
0 (0.0%)
Mining, Quarrying, & Extraction
0 (0.0%)
0 (0.0%)
Construction
0 (0.0%)
0 (0.0%)
Manufacturing
0 (0.0%)
0 (0.0%)
Wholesale Trade
0 (0.0%)
0 (0.0%)
Retail Trade
0 (0.0%)
0 (0.0%)
Transportation & Warehousing
0 (0.0%)
0 (0.0%)
Utilities
0 (0.0%)
0 (0.0%)
Information
0 (0.0%)
0 (0.0%)
Finance & Insurance
0 (0.0%)
0 (0.0%)
Real Estate, Rental & Leasing
0 (0.0%)
0 (0.0%)
Professional & Scientific
0 (0.0%)
0 (0.0%)
Enterprise Management
0 (0.0%)
0 (0.0%)
Administrative & Support
0 (0.0%)
0 (0.0%)
Educational Services
0 (0.0%)
0 (0.0%)
Health Care & Social Assistance
0 (0.0%)
3 (100.0%)
Arts, Entertainment & Recreation
0 (0.0%)
0 (0.0%)
Accommodation & Food Services
0 (0.0%)
0 (0.0%)
Public Administration
0 (0.0%)
0 (0.0%)
Total
0 (0.0%)
3 (100.0%)
Education in East Fairview
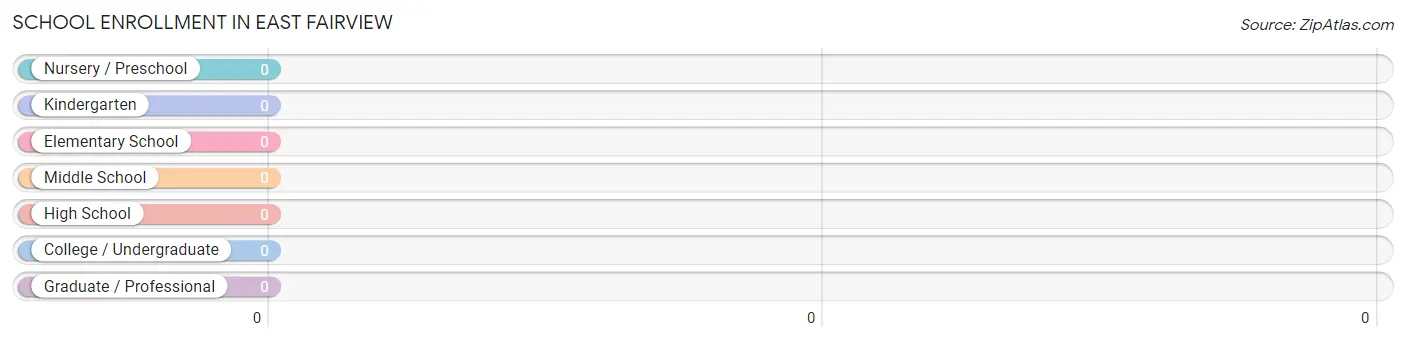
School Enrollment in East Fairview
School Level
# Students
% Students
Nursery / Preschool
0
0.0%
Kindergarten
0
0.0%
Elementary School
0
0.0%
Middle School
0
0.0%
High School
0
0.0%
College / Undergraduate
0
0.0%
Graduate / Professional
0
0.0%
Total
0
0.0%
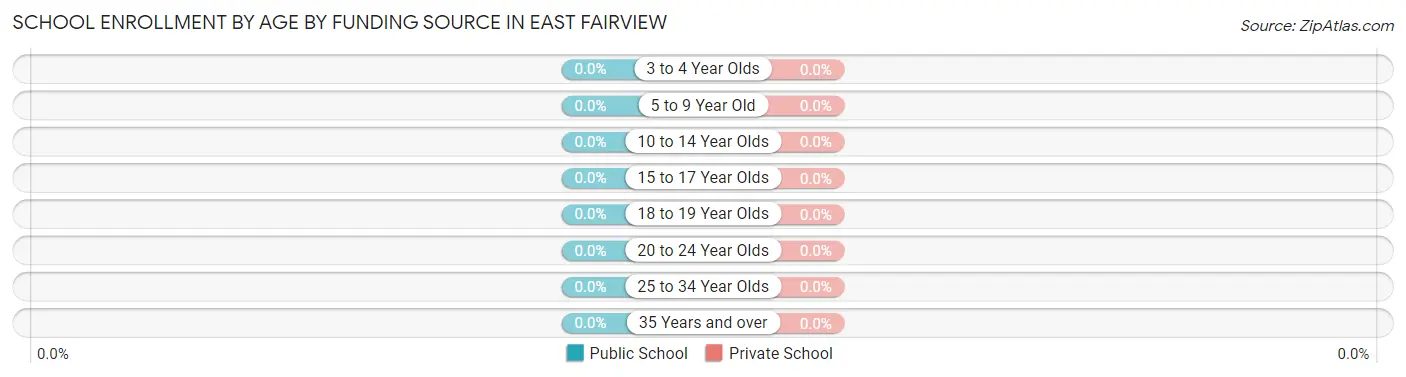
School Enrollment by Age by Funding Source in East Fairview
Age Bracket
Public School
Private School
3 to 4 Year Olds
0 (0.0%)
0 (0.0%)
5 to 9 Year Old
0 (0.0%)
0 (0.0%)
10 to 14 Year Olds
0 (0.0%)
0 (0.0%)
15 to 17 Year Olds
0 (0.0%)
0 (0.0%)
18 to 19 Year Olds
0 (0.0%)
0 (0.0%)
20 to 24 Year Olds
0 (0.0%)
0 (0.0%)
25 to 34 Year Olds
0 (0.0%)
0 (0.0%)
35 Years and over
0 (0.0%)
0 (0.0%)
Total
0 (0.0%)
0 (0.0%)
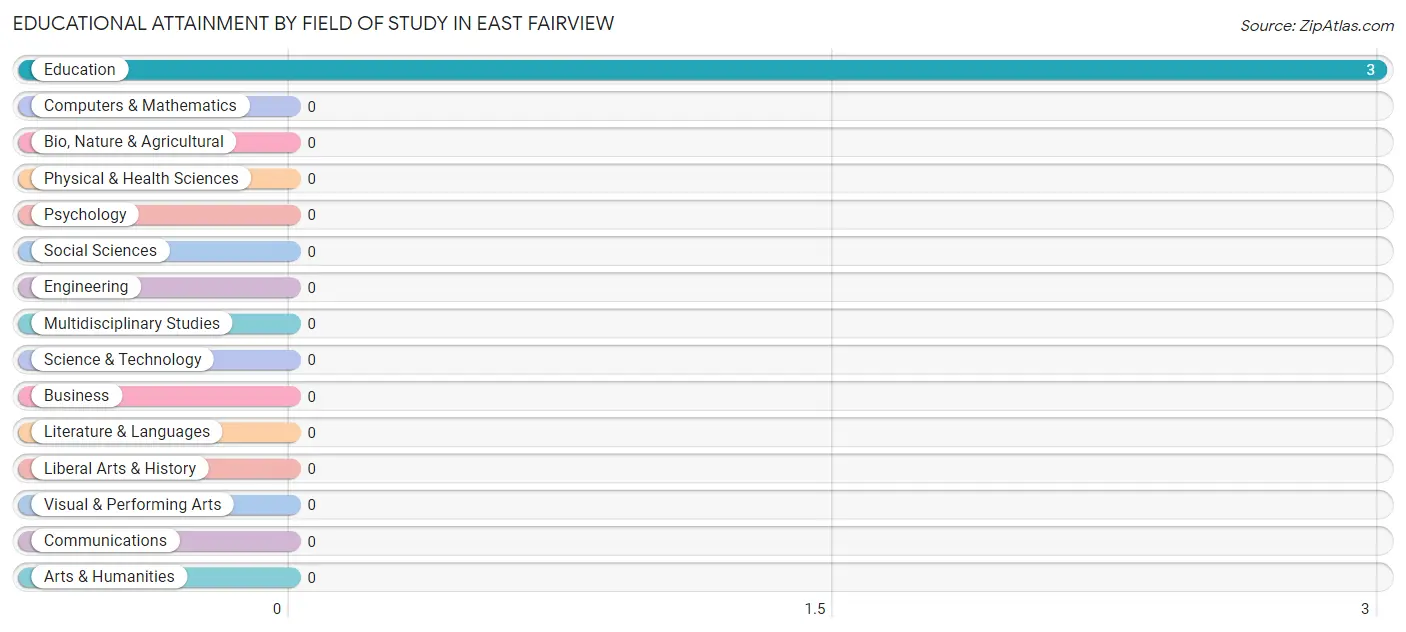
Educational Attainment by Field of Study in East Fairview
, and education (3 | 100.0%) are the most common fields of study among 3 individuals in East Fairview who have obtained a bachelor's degree or higher.
Field of Study
# Graduates
% Graduates
Computers & Mathematics
0
0.0%
Bio, Nature & Agricultural
0
0.0%
Physical & Health Sciences
0
0.0%
Psychology
0
0.0%
Social Sciences
0
0.0%
Engineering
0
0.0%
Multidisciplinary Studies
0
0.0%
Science & Technology
0
0.0%
Business
0
0.0%
Education
3
100.0%
Literature & Languages
0
0.0%
Liberal Arts & History
0
0.0%
Visual & Performing Arts
0
0.0%
Communications
0
0.0%
Arts & Humanities
0
0.0%
Total
3
100.0%
Transportation & Commute in East Fairview
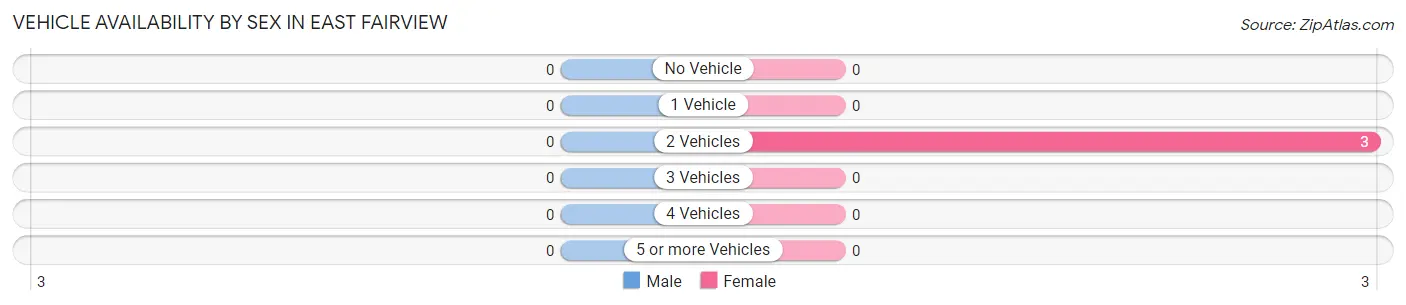
Vehicle Availability by Sex in East Fairview
Vehicles Available
Male
Female
No Vehicle
0 (0.0%)
0 (0.0%)
1 Vehicle
0 (0.0%)
0 (0.0%)
2 Vehicles
0 (0.0%)
3 (100.0%)
3 Vehicles
0 (0.0%)
0 (0.0%)
4 Vehicles
0 (0.0%)
0 (0.0%)
5 or more Vehicles
0 (0.0%)
0 (0.0%)
Total
0 (0.0%)
3 (100.0%)
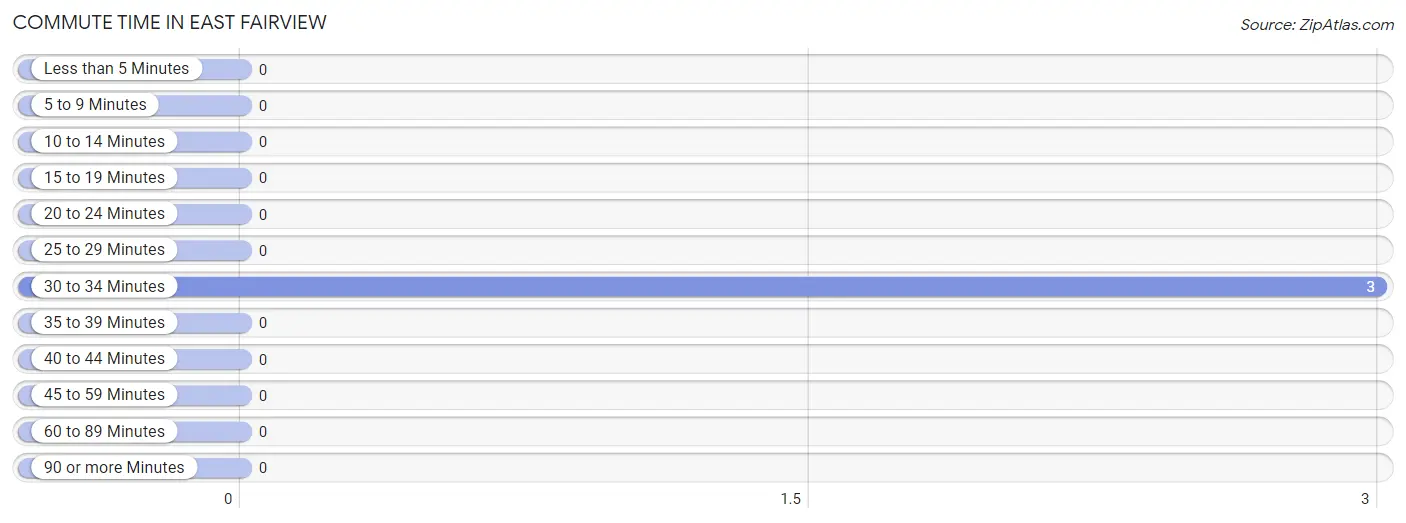
Commute Time in East Fairview
The most frequently occuring commute durations in East Fairview are 30 to 34 minutes (3 commuters, 100.0%), less than 5 minutes (0 commuters, 0.0%), and 5 to 9 minutes (0 commuters, 0.0%).
Commute Time
# Commuters
% Commuters
Less than 5 Minutes
0
0.0%
5 to 9 Minutes
0
0.0%
10 to 14 Minutes
0
0.0%
15 to 19 Minutes
0
0.0%
20 to 24 Minutes
0
0.0%
25 to 29 Minutes
0
0.0%
30 to 34 Minutes
3
100.0%
35 to 39 Minutes
0
0.0%
40 to 44 Minutes
0
0.0%
45 to 59 Minutes
0
0.0%
60 to 89 Minutes
0
0.0%
90 or more Minutes
0
0.0%
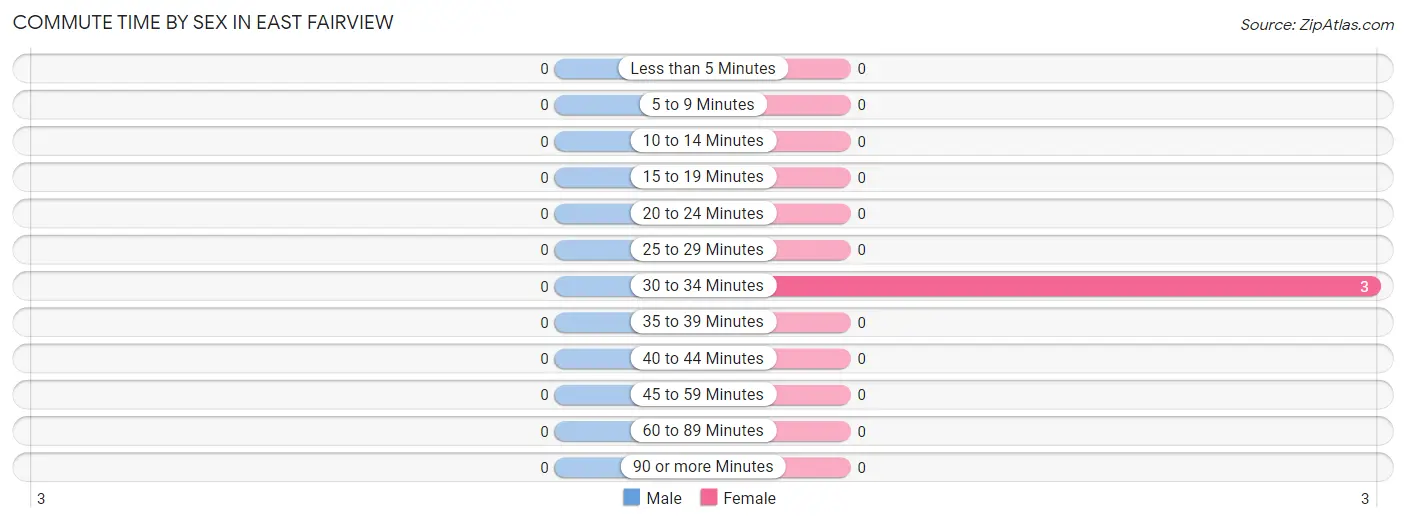
Commute Time by Sex in East Fairview
Commute Time
Male
Female
Less than 5 Minutes
0 (0.0%)
0 (0.0%)
5 to 9 Minutes
0 (0.0%)
0 (0.0%)
10 to 14 Minutes
0 (0.0%)
0 (0.0%)
15 to 19 Minutes
0 (0.0%)
0 (0.0%)
20 to 24 Minutes
0 (0.0%)
0 (0.0%)
25 to 29 Minutes
0 (0.0%)
0 (0.0%)
30 to 34 Minutes
0 (0.0%)
3 (100.0%)
35 to 39 Minutes
0 (0.0%)
0 (0.0%)
40 to 44 Minutes
0 (0.0%)
0 (0.0%)
45 to 59 Minutes
0 (0.0%)
0 (0.0%)
60 to 89 Minutes
0 (0.0%)
0 (0.0%)
90 or more Minutes
0 (0.0%)
0 (0.0%)
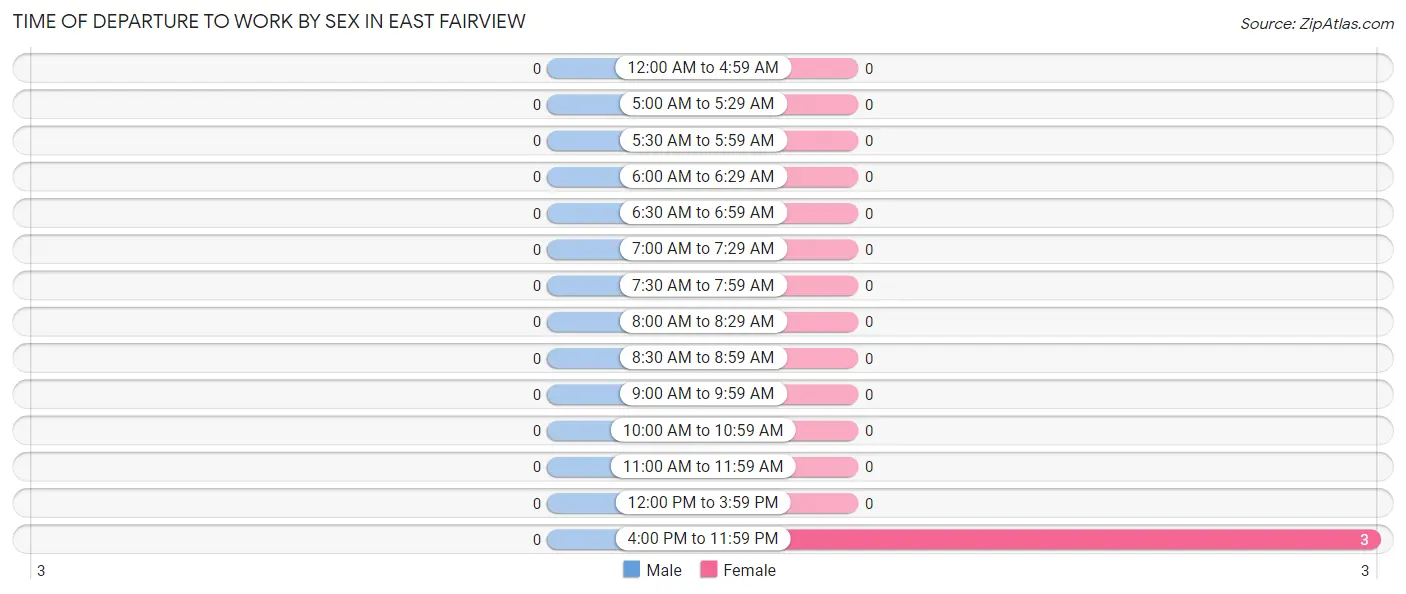
Time of Departure to Work by Sex in East Fairview
Time of Departure
Male
Female
12:00 AM to 4:59 AM
0 (0.0%)
0 (0.0%)
5:00 AM to 5:29 AM
0 (0.0%)
0 (0.0%)
5:30 AM to 5:59 AM
0 (0.0%)
0 (0.0%)
6:00 AM to 6:29 AM
0 (0.0%)
0 (0.0%)
6:30 AM to 6:59 AM
0 (0.0%)
0 (0.0%)
7:00 AM to 7:29 AM
0 (0.0%)
0 (0.0%)
7:30 AM to 7:59 AM
0 (0.0%)
0 (0.0%)
8:00 AM to 8:29 AM
0 (0.0%)
0 (0.0%)
8:30 AM to 8:59 AM
0 (0.0%)
0 (0.0%)
9:00 AM to 9:59 AM
0 (0.0%)
0 (0.0%)
10:00 AM to 10:59 AM
0 (0.0%)
0 (0.0%)
11:00 AM to 11:59 AM
0 (0.0%)
0 (0.0%)
12:00 PM to 3:59 PM
0 (0.0%)
0 (0.0%)
4:00 PM to 11:59 PM
0 (0.0%)
3 (100.0%)
Total
0 (0.0%)
3 (100.0%)
Housing Occupancy in East Fairview
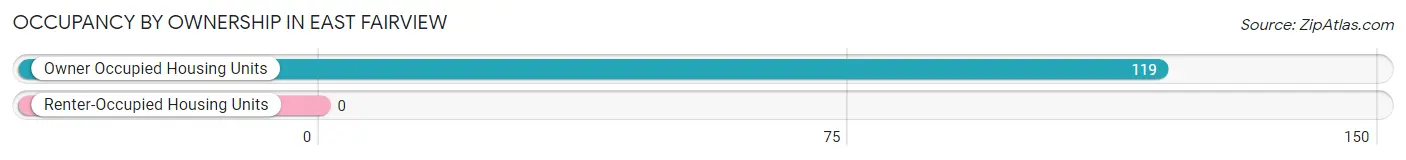
Occupancy by Ownership in East Fairview
Of the total 119 dwellings in East Fairview, owner-occupied units account for 119 (100.0%), while renter-occupied units make up 0 (0.0%).
Occupancy
# Housing Units
% Housing Units
Owner Occupied Housing Units
119
100.0%
Renter-Occupied Housing Units
0
0.0%
Total Occupied Housing Units
119
100.0%
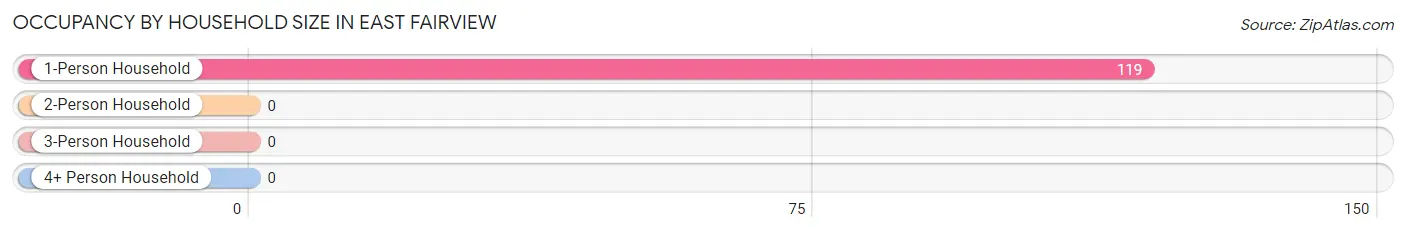
Occupancy by Household Size in East Fairview
Household Size
# Housing Units
% Housing Units
1-Person Household
119
100.0%
2-Person Household
0
0.0%
3-Person Household
0
0.0%
4+ Person Household
0
0.0%
Total Housing Units
119
100.0%
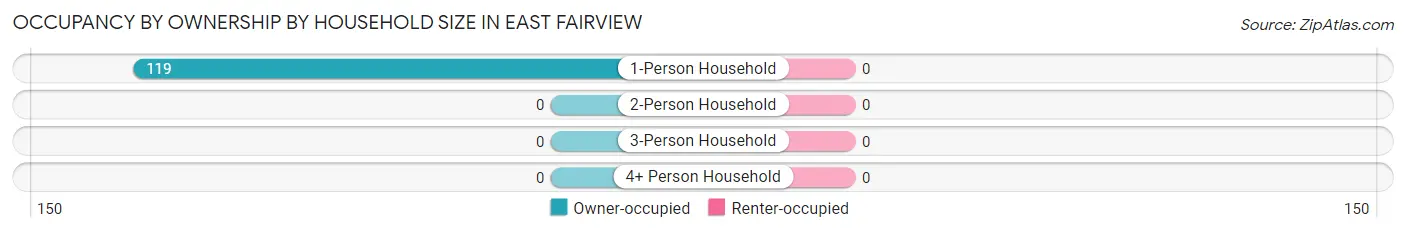
Occupancy by Ownership by Household Size in East Fairview
Household Size
Owner-occupied
Renter-occupied
1-Person Household
119 (100.0%)
0 (0.0%)
2-Person Household
0 (0.0%)
0 (0.0%)
3-Person Household
0 (0.0%)
0 (0.0%)
4+ Person Household
0 (0.0%)
0 (0.0%)
Total Housing Units
119 (100.0%)
0 (0.0%)
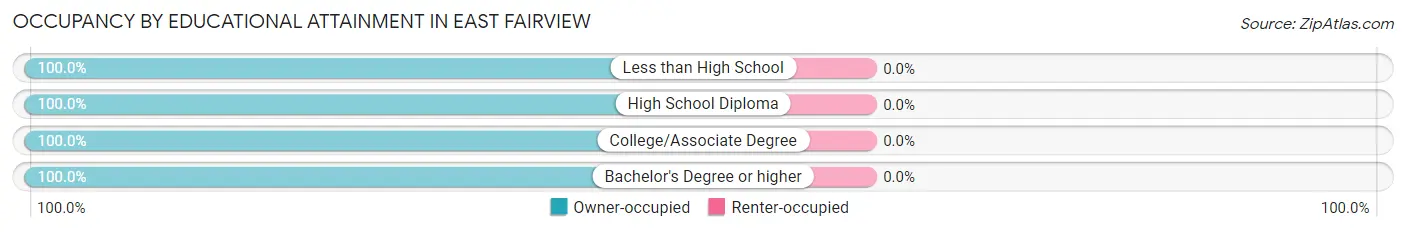
Occupancy by Educational Attainment in East Fairview
Household Size
Owner-occupied
Renter-occupied
Less than High School
5 (100.0%)
0 (0.0%)
High School Diploma
50 (100.0%)
0 (0.0%)
College/Associate Degree
61 (100.0%)
0 (0.0%)
Bachelor's Degree or higher
3 (100.0%)
0 (0.0%)
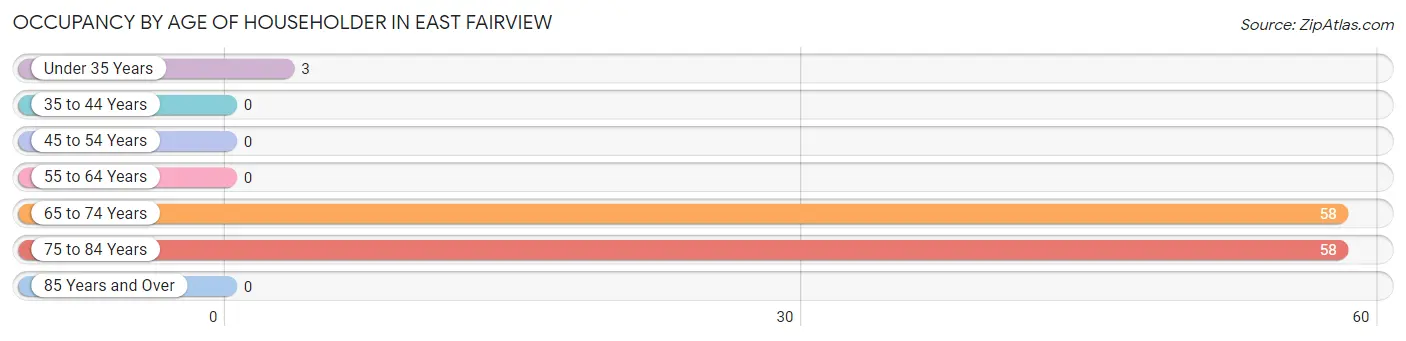
Occupancy by Age of Householder in East Fairview
Age Bracket
# Households
% Households
Under 35 Years
3
2.5%
35 to 44 Years
0
0.0%
45 to 54 Years
0
0.0%
55 to 64 Years
0
0.0%
65 to 74 Years
58
48.7%
75 to 84 Years
58
48.7%
85 Years and Over
0
0.0%
Total
119
100.0%
Housing Finances in East Fairview
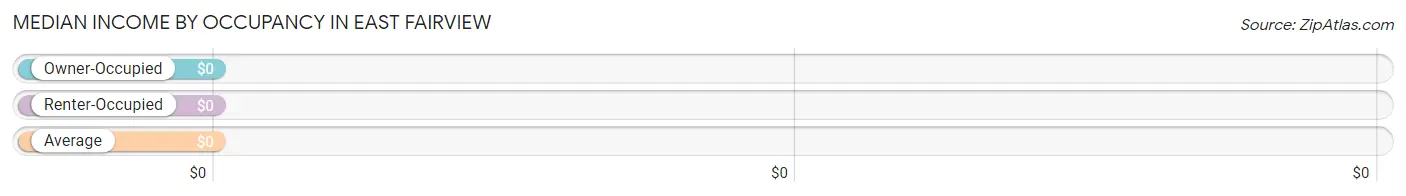
Median Income by Occupancy in East Fairview
Occupancy Type
# Households
Median Income
Owner-Occupied
119 (100.0%)
$0
Renter-Occupied
0 (0.0%)
$0
Average
119 (100.0%)
$0
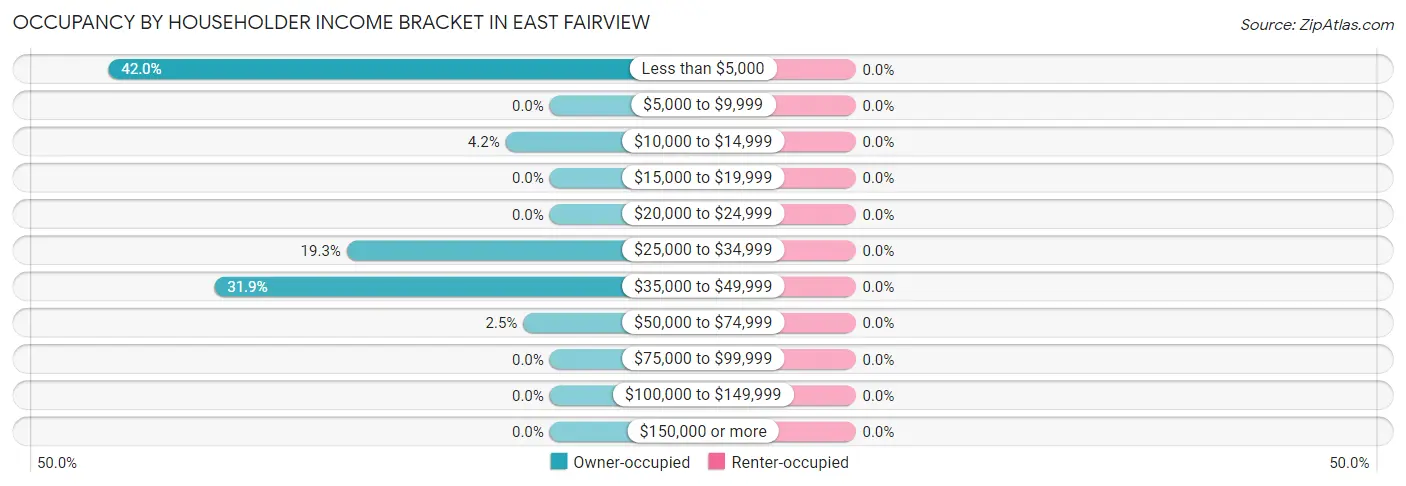
Occupancy by Householder Income Bracket in East Fairview
Income Bracket
Owner-occupied
Renter-occupied
Less than $5,000
50 (42.0%)
0 (0.0%)
$5,000 to $9,999
0 (0.0%)
0 (0.0%)
$10,000 to $14,999
5 (4.2%)
0 (0.0%)
$15,000 to $19,999
0 (0.0%)
0 (0.0%)
$20,000 to $24,999
0 (0.0%)
0 (0.0%)
$25,000 to $34,999
23 (19.3%)
0 (0.0%)
$35,000 to $49,999
38 (31.9%)
0 (0.0%)
$50,000 to $74,999
3 (2.5%)
0 (0.0%)
$75,000 to $99,999
0 (0.0%)
0 (0.0%)
$100,000 to $149,999
0 (0.0%)
0 (0.0%)
$150,000 or more
0 (0.0%)
0 (0.0%)
Total
119 (100.0%)
0 (0.0%)
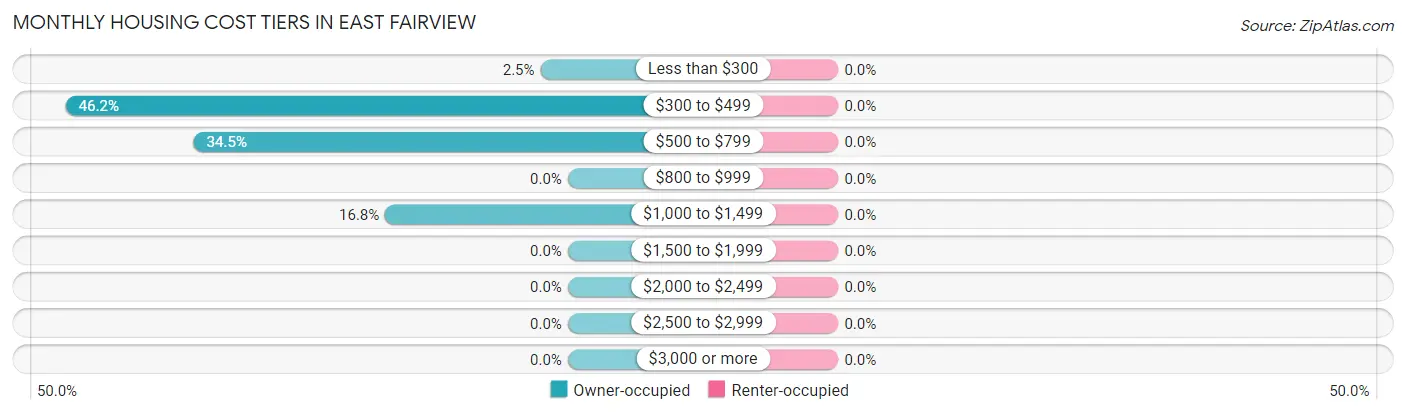
Monthly Housing Cost Tiers in East Fairview
Monthly Cost
Owner-occupied
Renter-occupied
Less than $300
3 (2.5%)
0 (0.0%)
$300 to $499
55 (46.2%)
0 (0.0%)
$500 to $799
41 (34.4%)
0 (0.0%)
$800 to $999
0 (0.0%)
0 (0.0%)
$1,000 to $1,499
20 (16.8%)
0 (0.0%)
$1,500 to $1,999
0 (0.0%)
0 (0.0%)
$2,000 to $2,499
0 (0.0%)
0 (0.0%)
$2,500 to $2,999
0 (0.0%)
0 (0.0%)
$3,000 or more
0 (0.0%)
0 (0.0%)
Total
119 (100.0%)
0 (0.0%)
Physical Housing Characteristics in East Fairview
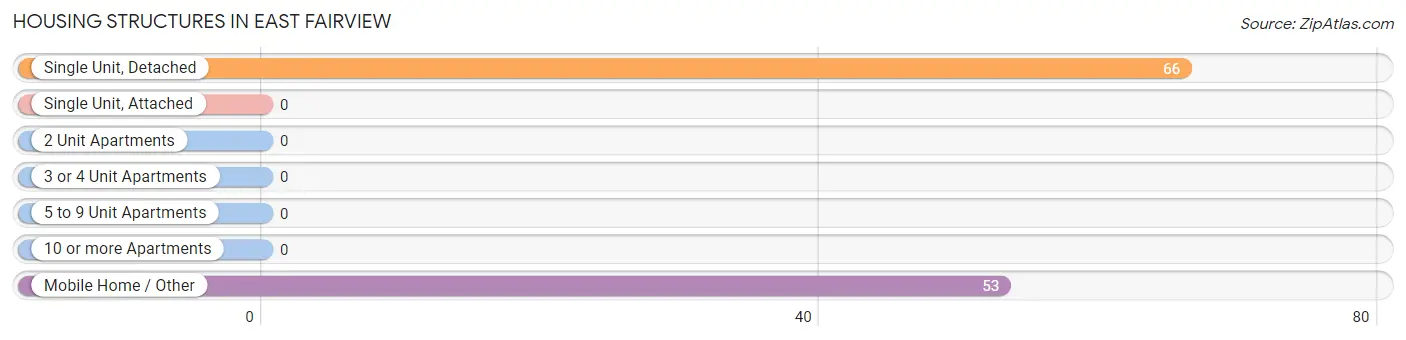
Housing Structures in East Fairview
Structure Type
# Housing Units
% Housing Units
Single Unit, Detached
66
55.5%
Single Unit, Attached
0
0.0%
2 Unit Apartments
0
0.0%
3 or 4 Unit Apartments
0
0.0%
5 to 9 Unit Apartments
0
0.0%
10 or more Apartments
0
0.0%
Mobile Home / Other
53
44.5%
Total
119
100.0%
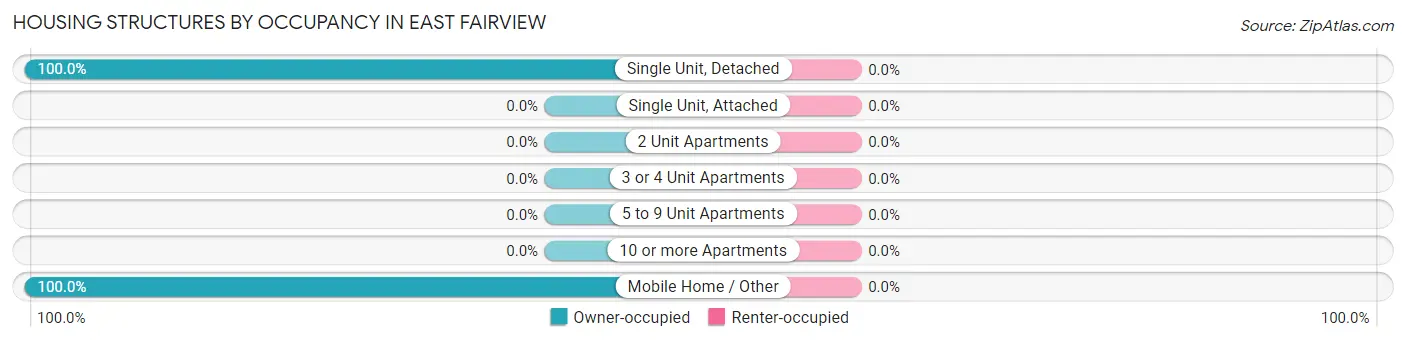
Housing Structures by Occupancy in East Fairview
Structure Type
Owner-occupied
Renter-occupied
Single Unit, Detached
66 (100.0%)
0 (0.0%)
Single Unit, Attached
0 (0.0%)
0 (0.0%)
2 Unit Apartments
0 (0.0%)
0 (0.0%)
3 or 4 Unit Apartments
0 (0.0%)
0 (0.0%)
5 to 9 Unit Apartments
0 (0.0%)
0 (0.0%)
10 or more Apartments
0 (0.0%)
0 (0.0%)
Mobile Home / Other
53 (100.0%)
0 (0.0%)
Total
119 (100.0%)
0 (0.0%)
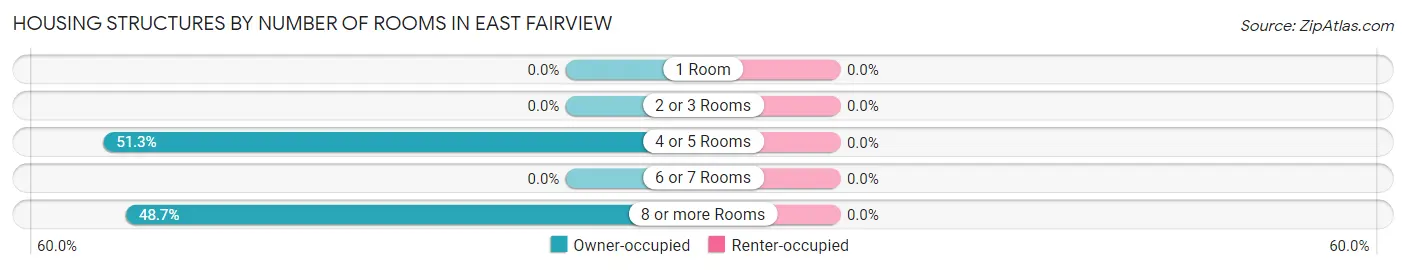
Housing Structures by Number of Rooms in East Fairview
Number of Rooms
Owner-occupied
Renter-occupied
1 Room
0 (0.0%)
0 (0.0%)
2 or 3 Rooms
0 (0.0%)
0 (0.0%)
4 or 5 Rooms
61 (51.3%)
0 (0.0%)
6 or 7 Rooms
0 (0.0%)
0 (0.0%)
8 or more Rooms
58 (48.7%)
0 (0.0%)
Total
119 (100.0%)
0 (0.0%)
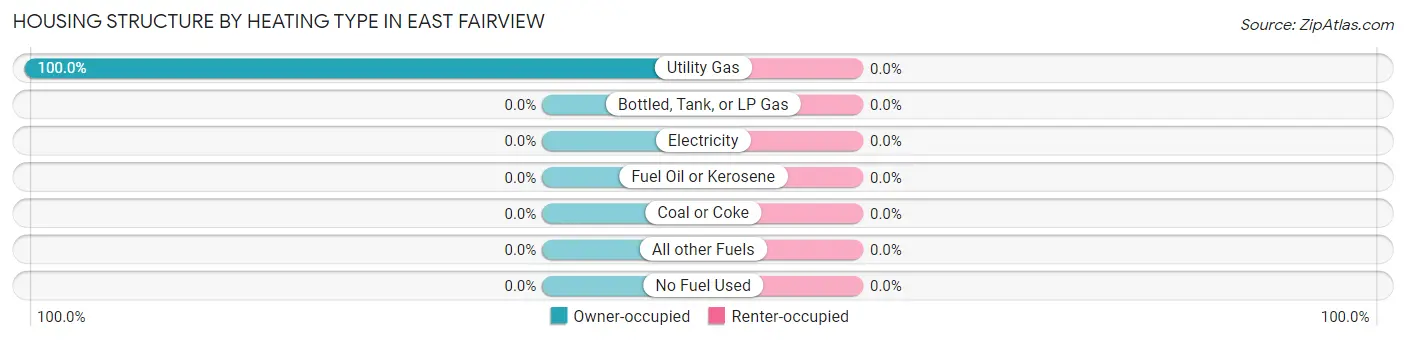
Housing Structure by Heating Type in East Fairview
Heating Type
Owner-occupied
Renter-occupied
Utility Gas
119 (100.0%)
0 (0.0%)
Bottled, Tank, or LP Gas
0 (0.0%)
0 (0.0%)
Electricity
0 (0.0%)
0 (0.0%)
Fuel Oil or Kerosene
0 (0.0%)
0 (0.0%)
Coal or Coke
0 (0.0%)
0 (0.0%)
All other Fuels
0 (0.0%)
0 (0.0%)
No Fuel Used
0 (0.0%)
0 (0.0%)
Total
119 (100.0%)
0 (0.0%)
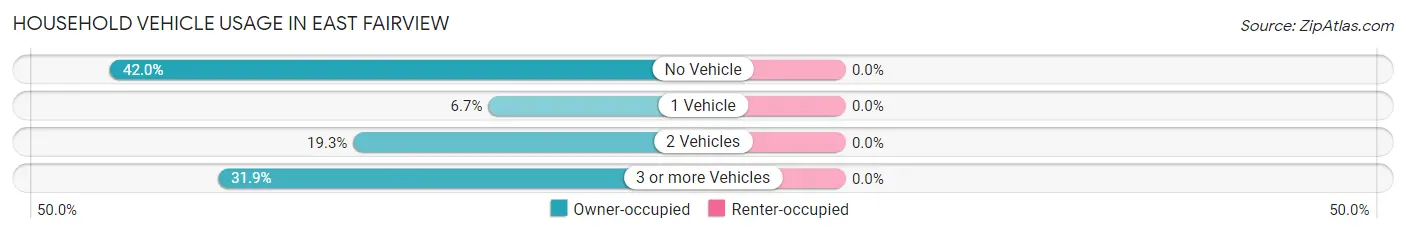
Household Vehicle Usage in East Fairview
Vehicles per Household
Owner-occupied
Renter-occupied
No Vehicle
50 (42.0%)
0 (0.0%)
1 Vehicle
8 (6.7%)
0 (0.0%)
2 Vehicles
23 (19.3%)
0 (0.0%)
3 or more Vehicles
38 (31.9%)
0 (0.0%)
Total
119 (100.0%)
0 (0.0%)
Real Estate & Mortgages in East Fairview
Real Estate and Mortgage Overview in East Fairview
Characteristic
Without Mortgage
With Mortgage
Housing Units
119
0
Median Property Value
-
-
Median Household Income
-
-
Monthly Housing Costs
$604
$0
Real Estate Taxes
-
-
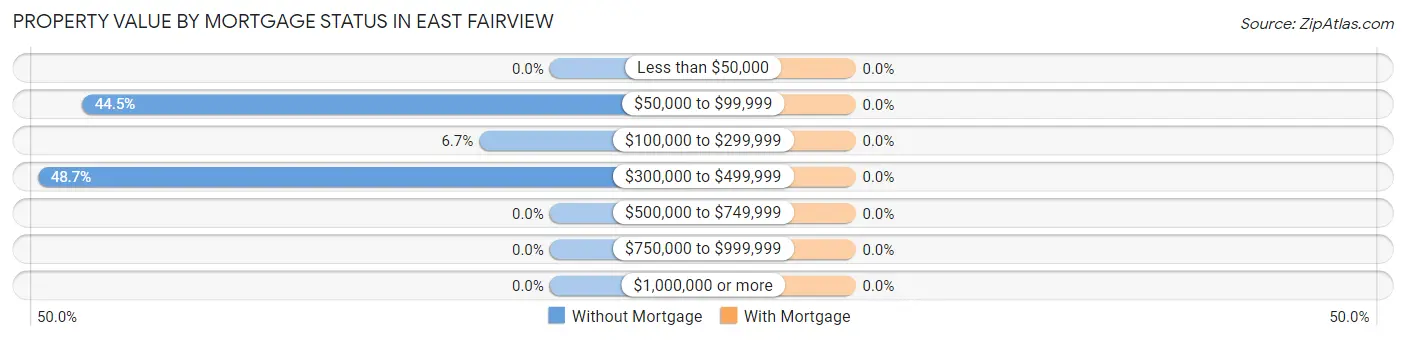
Property Value by Mortgage Status in East Fairview
Property Value
Without Mortgage
With Mortgage
Less than $50,000
0 (0.0%)
0 (0.0%)
$50,000 to $99,999
53 (44.5%)
0 (0.0%)
$100,000 to $299,999
8 (6.7%)
0 (0.0%)
$300,000 to $499,999
58 (48.7%)
0 (0.0%)
$500,000 to $749,999
0 (0.0%)
0 (0.0%)
$750,000 to $999,999
0 (0.0%)
0 (0.0%)
$1,000,000 or more
0 (0.0%)
0 (0.0%)
Total
119 (100.0%)
0 (0.0%)
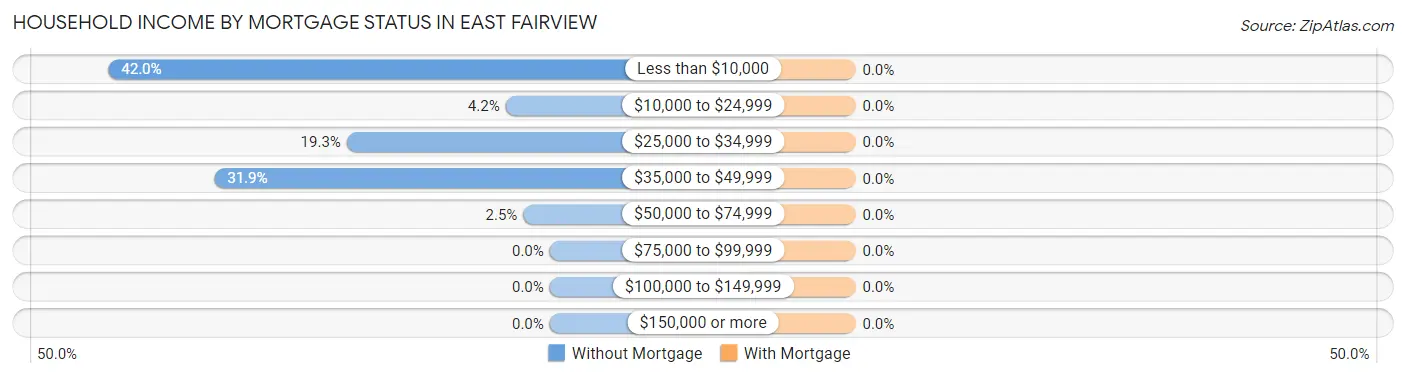
Household Income by Mortgage Status in East Fairview
Household Income
Without Mortgage
With Mortgage
Less than $10,000
50 (42.0%)
0 (0.0%)
$10,000 to $24,999
5 (4.2%)
0 (0.0%)
$25,000 to $34,999
23 (19.3%)
0 (0.0%)
$35,000 to $49,999
38 (31.9%)
0 (0.0%)
$50,000 to $74,999
3 (2.5%)
0 (0.0%)
$75,000 to $99,999
0 (0.0%)
0 (0.0%)
$100,000 to $149,999
0 (0.0%)
0 (0.0%)
$150,000 or more
0 (0.0%)
0 (0.0%)
Total
119 (100.0%)
0 (0.0%)
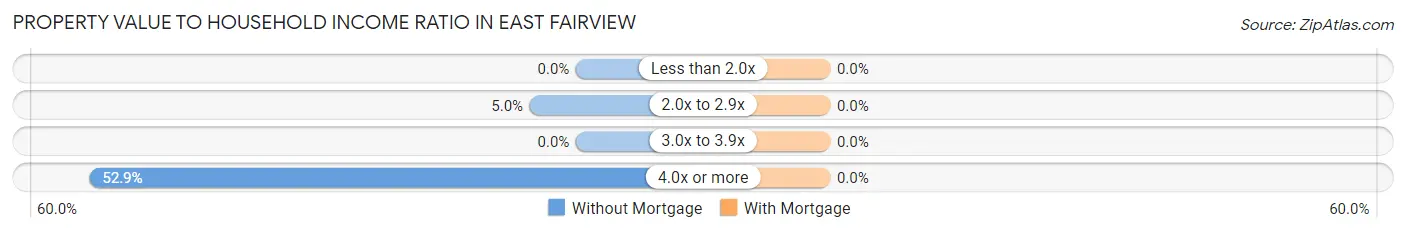
Property Value to Household Income Ratio in East Fairview
Value-to-Income Ratio
Without Mortgage
With Mortgage
Less than 2.0x
0 (0.0%)
0 (0.0%)
2.0x to 2.9x
6 (5.0%)
0 (0.0%)
3.0x to 3.9x
0 (0.0%)
0 (0.0%)
4.0x or more
63 (52.9%)
0 (0.0%)
Total
119 (100.0%)
0 (0.0%)
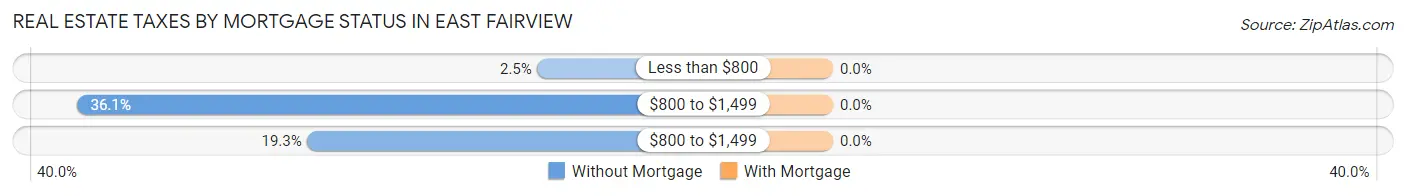
Real Estate Taxes by Mortgage Status in East Fairview
Property Taxes
Without Mortgage
With Mortgage
Less than $800
3 (2.5%)
0 (0.0%)
$800 to $1,499
43 (36.1%)
0 (0.0%)
$800 to $1,499
23 (19.3%)
0 (0.0%)
Total
119 (100.0%)
0 (0.0%)
Health & Disability in East Fairview
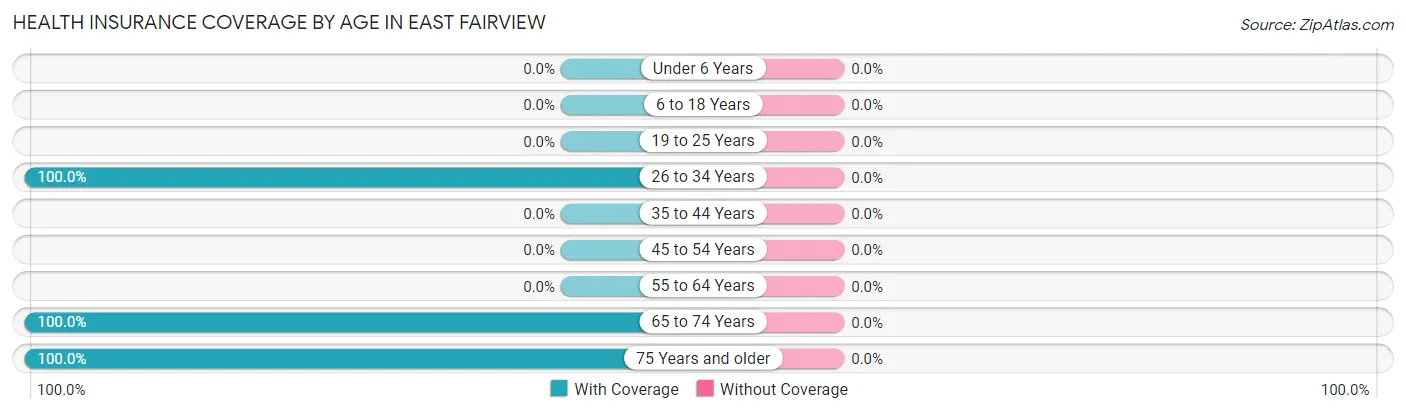
Health Insurance Coverage by Age in East Fairview
Age Bracket
With Coverage
Without Coverage
Under 6 Years
0 (0.0%)
0 (0.0%)
6 to 18 Years
0 (0.0%)
0 (0.0%)
19 to 25 Years
0 (0.0%)
0 (0.0%)
26 to 34 Years
3 (100.0%)
0 (0.0%)
35 to 44 Years
0 (0.0%)
0 (0.0%)
45 to 54 Years
0 (0.0%)
0 (0.0%)
55 to 64 Years
0 (0.0%)
0 (0.0%)
65 to 74 Years
58 (100.0%)
0 (0.0%)
75 Years and older
58 (100.0%)
0 (0.0%)
Total
119 (100.0%)
0 (0.0%)
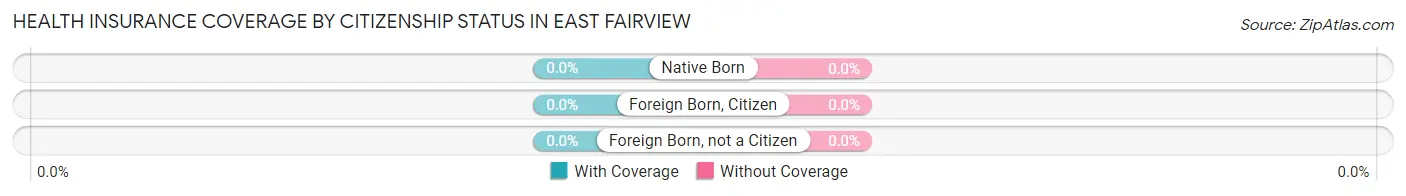
Health Insurance Coverage by Citizenship Status in East Fairview
Citizenship Status
With Coverage
Without Coverage
Native Born
0 (0.0%)
0 (0.0%)
Foreign Born, Citizen
0 (0.0%)
0 (0.0%)
Foreign Born, not a Citizen
0 (0.0%)
0 (0.0%)
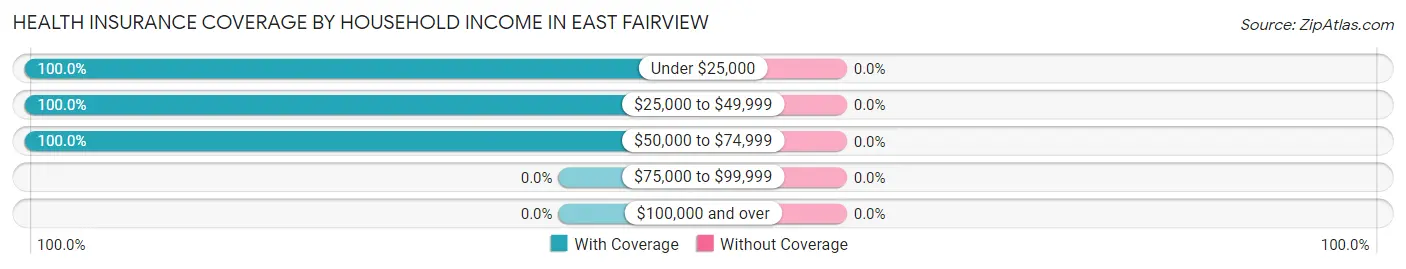
Health Insurance Coverage by Household Income in East Fairview
Household Income
With Coverage
Without Coverage
Under $25,000
55 (100.0%)
0 (0.0%)
$25,000 to $49,999
61 (100.0%)
0 (0.0%)
$50,000 to $74,999
3 (100.0%)
0 (0.0%)
$75,000 to $99,999
0 (0.0%)
0 (0.0%)
$100,000 and over
0 (0.0%)
0 (0.0%)
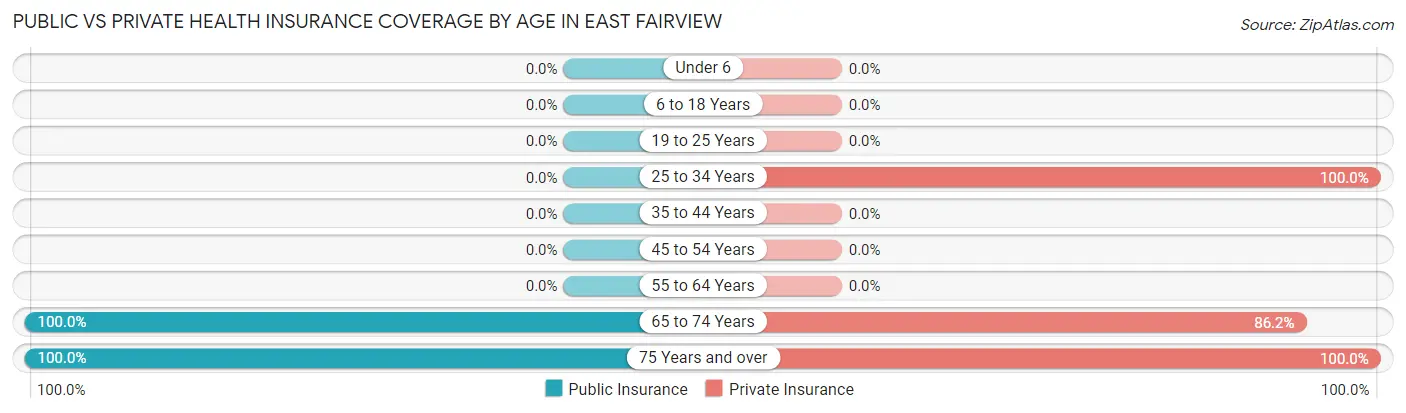
Public vs Private Health Insurance Coverage by Age in East Fairview
Age Bracket
Public Insurance
Private Insurance
Under 6
0 (0.0%)
0 (0.0%)
6 to 18 Years
0 (0.0%)
0 (0.0%)
19 to 25 Years
0 (0.0%)
0 (0.0%)
25 to 34 Years
0 (0.0%)
3 (100.0%)
35 to 44 Years
0 (0.0%)
0 (0.0%)
45 to 54 Years
0 (0.0%)
0 (0.0%)
55 to 64 Years
0 (0.0%)
0 (0.0%)
65 to 74 Years
58 (100.0%)
50 (86.2%)
75 Years and over
58 (100.0%)
58 (100.0%)
Total
116 (97.5%)
111 (93.3%)
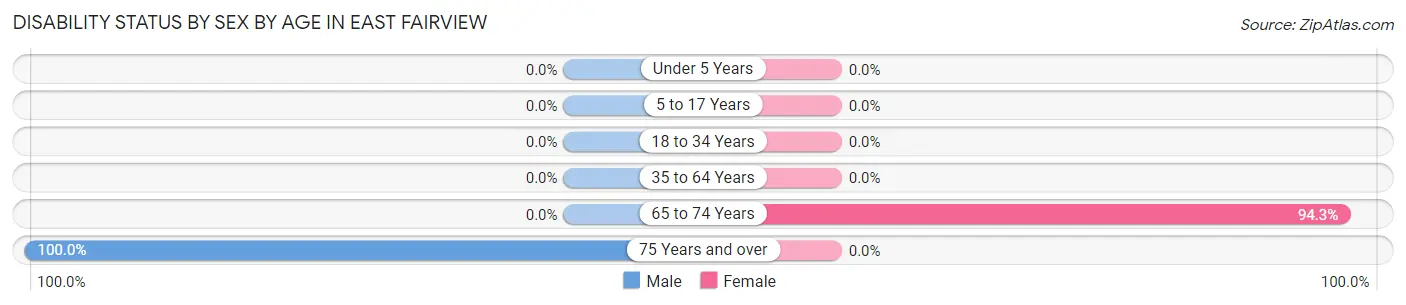
Disability Status by Sex by Age in East Fairview
Age Bracket
Male
Female
Under 5 Years
0 (0.0%)
0 (0.0%)
5 to 17 Years
0 (0.0%)
0 (0.0%)
18 to 34 Years
0 (0.0%)
0 (0.0%)
35 to 64 Years
0 (0.0%)
0 (0.0%)
65 to 74 Years
0 (0.0%)
50 (94.3%)
75 Years and over
58 (100.0%)
0 (0.0%)
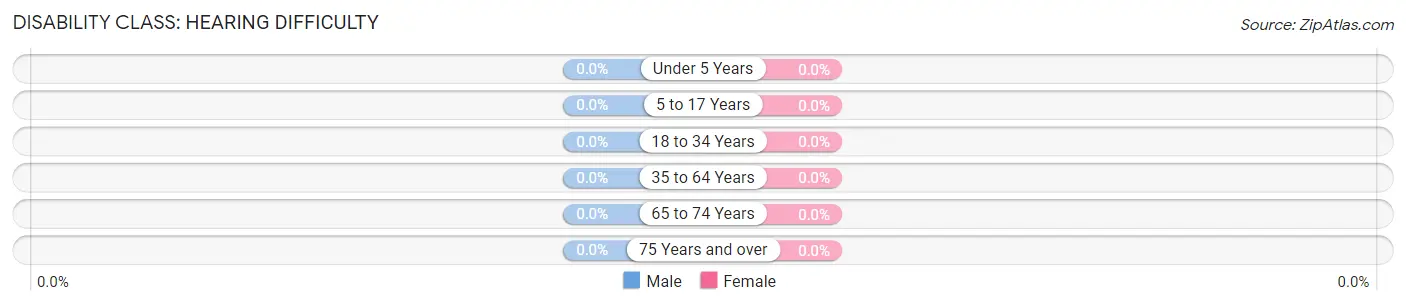
Disability Class by Sex by Age in East Fairview
Disability Class: Hearing Difficulty
Age Bracket
Male
Female
Under 5 Years
0 (0.0%)
0 (0.0%)
5 to 17 Years
0 (0.0%)
0 (0.0%)
18 to 34 Years
0 (0.0%)
0 (0.0%)
35 to 64 Years
0 (0.0%)
0 (0.0%)
65 to 74 Years
0 (0.0%)
0 (0.0%)
75 Years and over
0 (0.0%)
0 (0.0%)
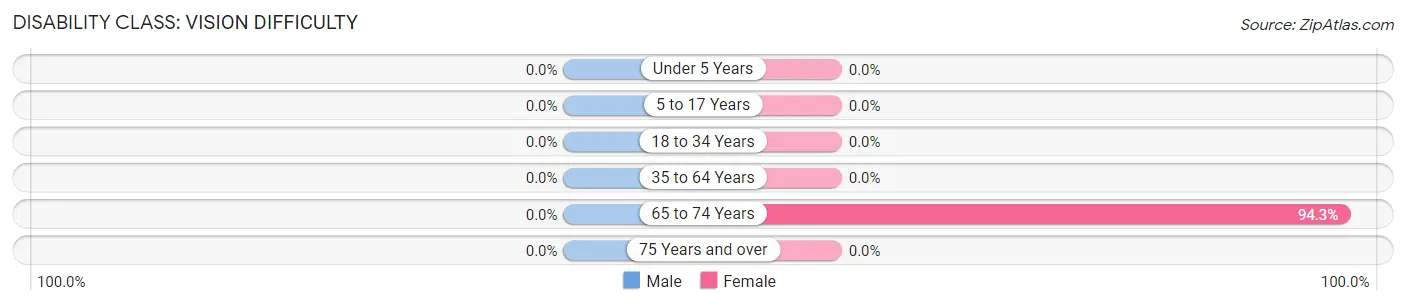
Disability Class: Vision Difficulty
Age Bracket
Male
Female
Under 5 Years
0 (0.0%)
0 (0.0%)
5 to 17 Years
0 (0.0%)
0 (0.0%)
18 to 34 Years
0 (0.0%)
0 (0.0%)
35 to 64 Years
0 (0.0%)
0 (0.0%)
65 to 74 Years
0 (0.0%)
50 (94.3%)
75 Years and over
0 (0.0%)
0 (0.0%)
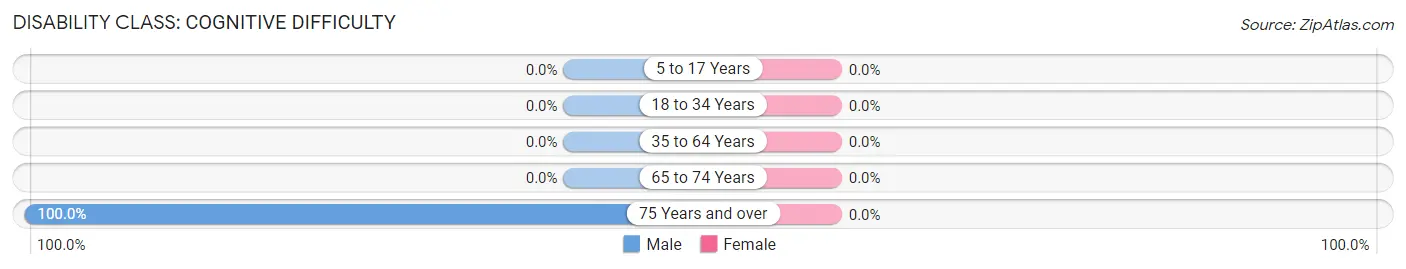
Disability Class: Cognitive Difficulty
Age Bracket
Male
Female
5 to 17 Years
0 (0.0%)
0 (0.0%)
18 to 34 Years
0 (0.0%)
0 (0.0%)
35 to 64 Years
0 (0.0%)
0 (0.0%)
65 to 74 Years
0 (0.0%)
0 (0.0%)
75 Years and over
58 (100.0%)
0 (0.0%)
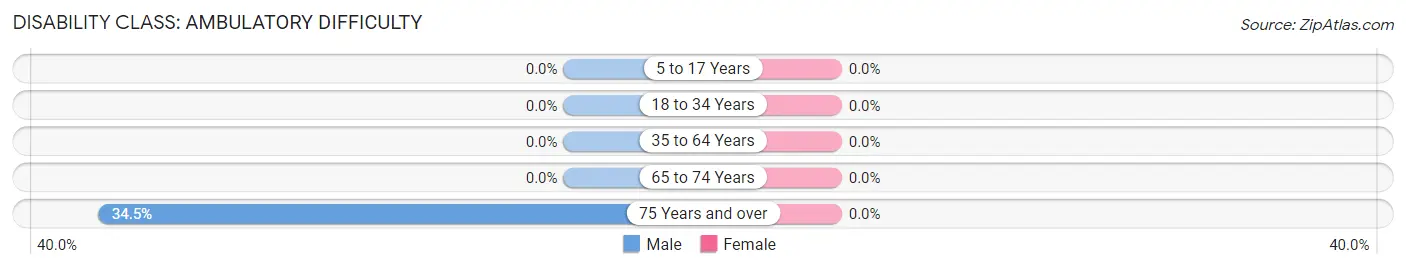
Disability Class: Ambulatory Difficulty
Age Bracket
Male
Female
5 to 17 Years
0 (0.0%)
0 (0.0%)
18 to 34 Years
0 (0.0%)
0 (0.0%)
35 to 64 Years
0 (0.0%)
0 (0.0%)
65 to 74 Years
0 (0.0%)
0 (0.0%)
75 Years and over
20 (34.5%)
0 (0.0%)
Disability Class: Self-Care Difficulty
Age Bracket
Male
Female
5 to 17 Years
0 (0.0%)
0 (0.0%)
18 to 34 Years
0 (0.0%)
0 (0.0%)
35 to 64 Years
0 (0.0%)
0 (0.0%)
65 to 74 Years
0 (0.0%)
0 (0.0%)
75 Years and over
20 (34.5%)
0 (0.0%)
Technology Access in East Fairview
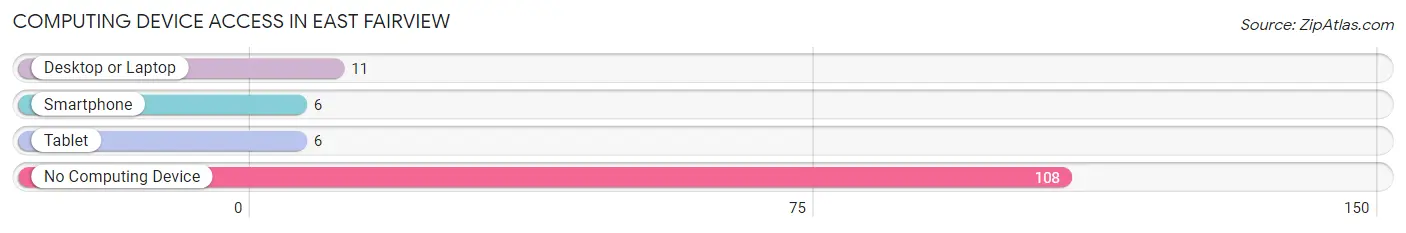
Computing Device Access in East Fairview
Device Type
# Households
% Households
Desktop or Laptop
11
9.2%
Smartphone
6
5.0%
Tablet
6
5.0%
No Computing Device
108
90.8%
Total
119
100.0%
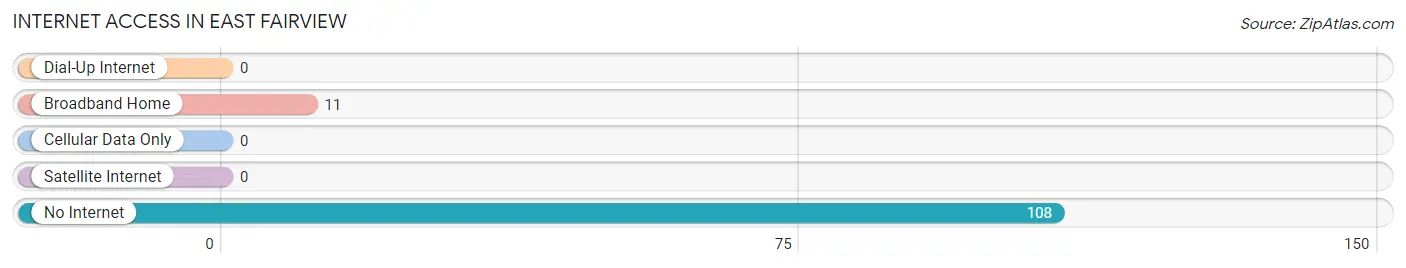
Internet Access in East Fairview
Internet Type
# Households
% Households
Dial-Up Internet
0
0.0%
Broadband Home
11
9.2%
Cellular Data Only
0
0.0%
Satellite Internet
0
0.0%
No Internet
108
90.8%
Total
119
100.0%
East Fairview Summary
History
East Fairview is a small unincorporated community located in Williams County, North Dakota. It is situated on the eastern edge of the city of Williston, the county seat. The community was founded in the late 19th century and has a long and rich history.
The first settlers in the area were homesteaders who arrived in the late 1880s. The first post office was established in 1891 and the town was officially incorporated in 1895. The town was named after the nearby Fairview School, which was built in 1891.
The town grew slowly but steadily over the years, and by the early 20th century, it had become a thriving agricultural community. The town was home to several businesses, including a general store, a blacksmith shop, a livery stable, and a hotel.
In the 1920s, the town experienced a period of rapid growth as oil was discovered in the area. This led to the construction of several oil refineries and other related businesses. The town also became a hub for the local agricultural industry, with several grain elevators and other related businesses.
By the 1950s, the town had become a popular tourist destination, with several motels and restaurants. The town also had a movie theater and a bowling alley.
Geography
East Fairview is located in the northwestern corner of North Dakota, in Williams County. It is situated on the eastern edge of the city of Williston, the county seat. The town is located on the banks of the Missouri River, and is surrounded by rolling hills and prairies.
The town has a total area of 0.6 square miles, all of which is land. The town is located at an elevation of 2,072 feet above sea level.
Economy
The economy of East Fairview is largely based on agriculture and oil production. The town is home to several grain elevators and other related businesses. The town is also home to several oil refineries and other related businesses.
The town is also home to several small businesses, including restaurants, motels, and retail stores. The town also has a movie theater and a bowling alley.
Demographics
As of the 2010 census, the population of East Fairview was 545. The racial makeup of the town was 97.3% White, 0.2% African American, 0.4% Native American, 0.2% Asian, 0.2% from other races, and 1.9% from two or more races. Hispanic or Latino of any race were 0.7% of the population.
The median income for a household in the town was $41,250, and the median income for a family was $50,000. The per capita income for the town was $20,945. About 8.3% of families and 10.2% of the population were below the poverty line, including 11.3% of those under age 18 and 8.3% of those age 65 or over.
Common Questions
What is Per Capita Income in East Fairview?
Per Capita income in East Fairview is $20,119.
What is Inequality or Gini Index in East Fairview?
Inequality or Gini Index in East Fairview is 0.50.
What is the Total Population of East Fairview?
Total Population of East Fairview is 119.
What is the Total Male Population of East Fairview?
Total Male Population of East Fairview is 63.
What is the Total Female Population of East Fairview?
Total Female Population of East Fairview is 56.
What is the Ratio of Males per 100 Females in East Fairview?
There are 112.50 Males per 100 Females in East Fairview.
What is the Ratio of Females per 100 Males in East Fairview?
There are 88.89 Females per 100 Males in East Fairview.
What is the Median Population Age in East Fairview?
Median Population Age in East Fairview is 74.7 Years.
How Large is the Labor Force in East Fairview?
There are 3 People in the Labor Forcein in East Fairview.
What is the Percentage of People in the Labor Force in East Fairview?
2.5% of People are in the Labor Force in East Fairview.
Report Title
Report Link
HTML Copy & Paste Link
Social Media
Copy and paste the folowing code into any webpage where you would like this interactive chart to display