Kathryn, ND Map & Demographics
Kathryn Map
Kathryn Overview
$28,349
PER CAPITA INCOME
$96,071
AVG FAMILY INCOME
$50,833
AVG HOUSEHOLD INCOME
75.1%
WAGE / INCOME GAP [ % ]
24.9¢/ $1
WAGE / INCOME GAP [ $ ]
0.47
INEQUALITY / GINI INDEX
82
TOTAL POPULATION
32
MALE POPULATION
50
FEMALE POPULATION
64.00
MALES / 100 FEMALES
156.25
FEMALES / 100 MALES
43.0
MEDIAN AGE
4.2
AVG FAMILY SIZE
2.3
AVG HOUSEHOLD SIZE
23
LABOR FORCE [ PEOPLE ]
35.9%
PERCENT IN LABOR FORCE
Kathryn Zip Codes
Kathryn Area Codes
Income in Kathryn
Income Overview in Kathryn
Per Capita Income in Kathryn is $28,349, while median incomes of families and households are $96,071 and $50,833 respectively.
| Characteristic | Number | Measure |
| Per Capita Income | 82 | $28,349 |
| Median Family Income | 12 | $96,071 |
| Mean Family Income | 12 | $86,275 |
| Median Household Income | 36 | $50,833 |
| Mean Household Income | 36 | $63,411 |
| Income Deficit | 12 | $0 |
| Wage / Income Gap (%) | 82 | 75.11% |
| Wage / Income Gap ($) | 82 | 24.89¢ per $1 |
| Gini / Inequality Index | 82 | 0.47 |
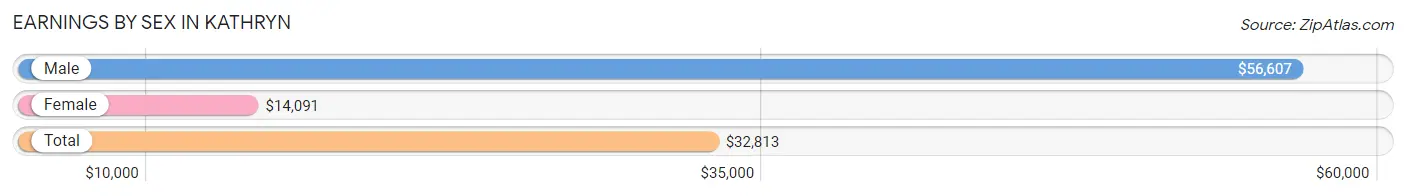
Earnings by Sex in Kathryn
Average Earnings in Kathryn are $32,813, $56,607 for men and $14,091 for women, a difference of 75.1%.
| Sex | Number | Average Earnings |
| Male | 17 (46.0%) | $56,607 |
| Female | 20 (54.0%) | $14,091 |
| Total | 37 (100.0%) | $32,813 |
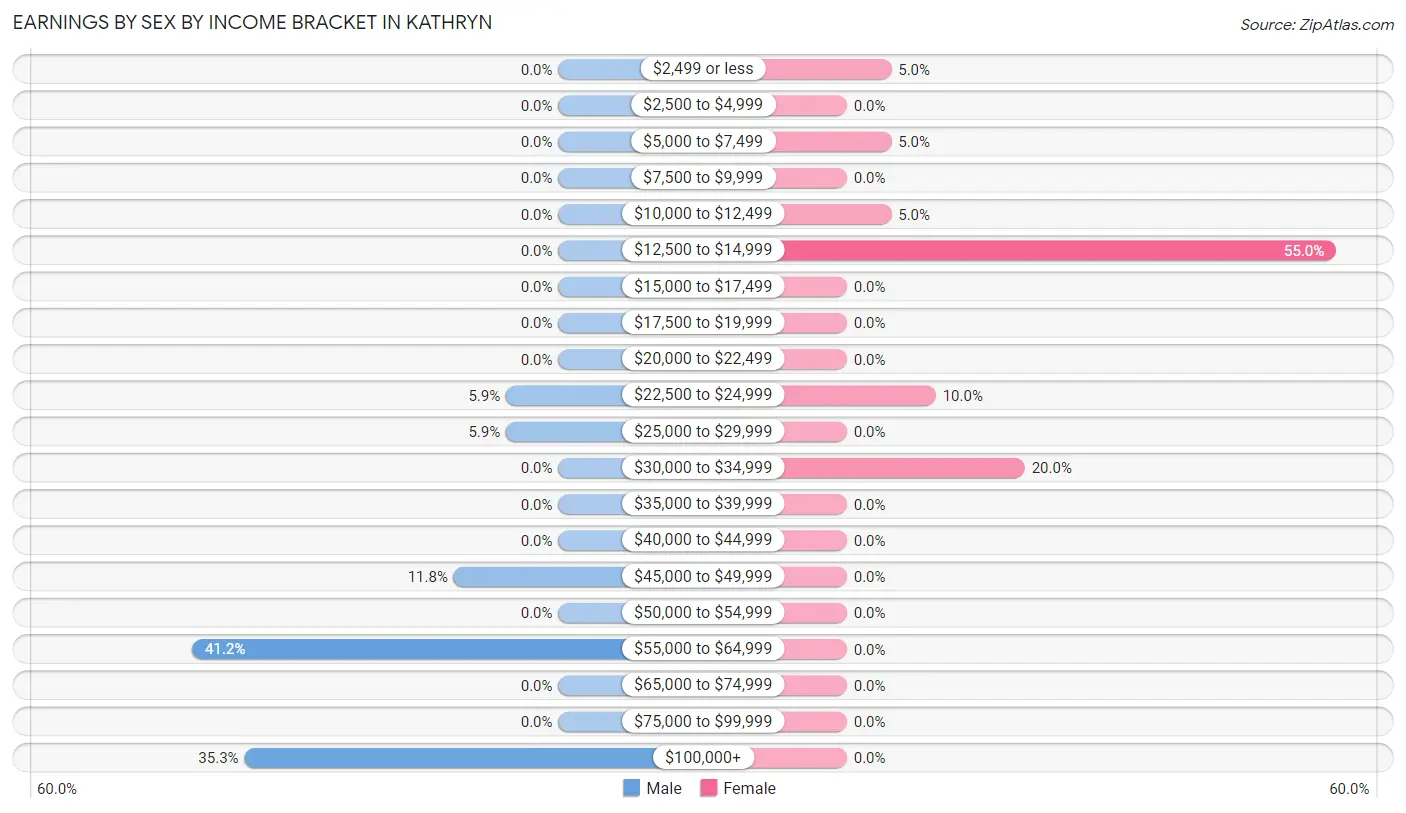
Earnings by Sex by Income Bracket in Kathryn
The most common earnings brackets in Kathryn are $55,000 to $64,999 for men (7 | 41.2%) and $12,500 to $14,999 for women (11 | 55.0%).
| Income | Male | Female |
| $2,499 or less | 0 (0.0%) | 1 (5.0%) |
| $2,500 to $4,999 | 0 (0.0%) | 0 (0.0%) |
| $5,000 to $7,499 | 0 (0.0%) | 1 (5.0%) |
| $7,500 to $9,999 | 0 (0.0%) | 0 (0.0%) |
| $10,000 to $12,499 | 0 (0.0%) | 1 (5.0%) |
| $12,500 to $14,999 | 0 (0.0%) | 11 (55.0%) |
| $15,000 to $17,499 | 0 (0.0%) | 0 (0.0%) |
| $17,500 to $19,999 | 0 (0.0%) | 0 (0.0%) |
| $20,000 to $22,499 | 0 (0.0%) | 0 (0.0%) |
| $22,500 to $24,999 | 1 (5.9%) | 2 (10.0%) |
| $25,000 to $29,999 | 1 (5.9%) | 0 (0.0%) |
| $30,000 to $34,999 | 0 (0.0%) | 4 (20.0%) |
| $35,000 to $39,999 | 0 (0.0%) | 0 (0.0%) |
| $40,000 to $44,999 | 0 (0.0%) | 0 (0.0%) |
| $45,000 to $49,999 | 2 (11.8%) | 0 (0.0%) |
| $50,000 to $54,999 | 0 (0.0%) | 0 (0.0%) |
| $55,000 to $64,999 | 7 (41.2%) | 0 (0.0%) |
| $65,000 to $74,999 | 0 (0.0%) | 0 (0.0%) |
| $75,000 to $99,999 | 0 (0.0%) | 0 (0.0%) |
| $100,000+ | 6 (35.3%) | 0 (0.0%) |
| Total | 17 (100.0%) | 20 (100.0%) |
Earnings by Sex by Educational Attainment in Kathryn
| Educational Attainment | Male Income | Female Income |
| Less than High School | - | - |
| High School Diploma | - | - |
| College or Associate's Degree | - | - |
| Bachelor's Degree | - | - |
| Graduate Degree | - | - |
| Total | $56,607 | $14,091 |
Family Income in Kathryn
Family Income Brackets in Kathryn
According to the Kathryn family income data, there are 7 families falling into the $75,000 to $99,999 income range, which is the most common income bracket and makes up 58.3% of all families.
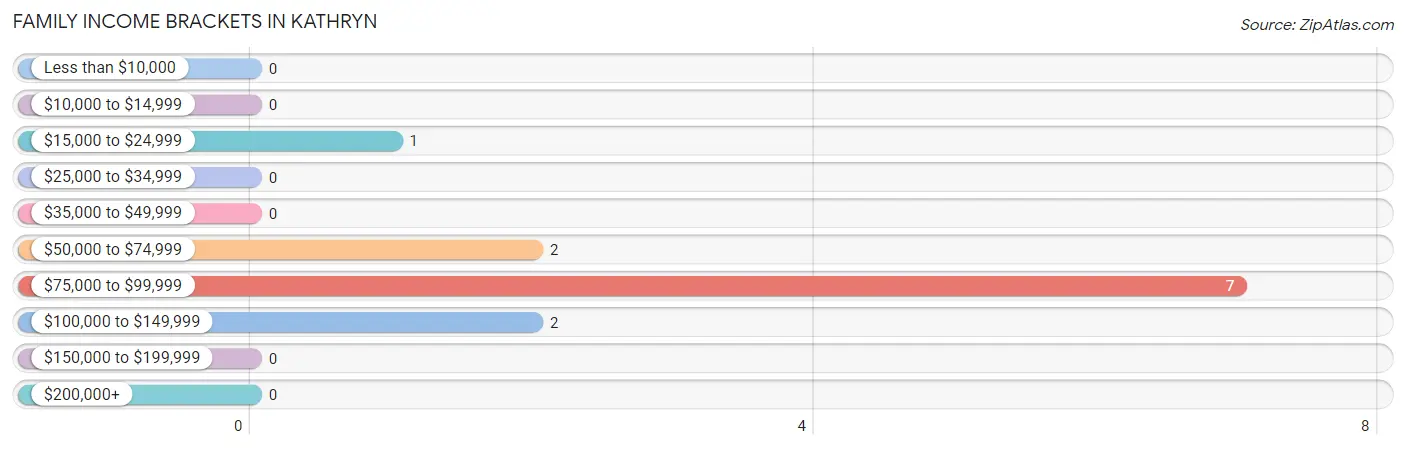
| Income Bracket | # Families | % Families |
| Less than $10,000 | 0 | 0.0% |
| $10,000 to $14,999 | 0 | 0.0% |
| $15,000 to $24,999 | 1 | 8.3% |
| $25,000 to $34,999 | 0 | 0.0% |
| $35,000 to $49,999 | 0 | 0.0% |
| $50,000 to $74,999 | 2 | 16.7% |
| $75,000 to $99,999 | 7 | 58.3% |
| $100,000 to $149,999 | 2 | 16.7% |
| $150,000 to $199,999 | 0 | 0.0% |
| $200,000+ | 0 | 0.0% |
Family Income by Famaliy Size in Kathryn
2-person families (3 | 25.0%) account for the highest median family income in Kathryn with $51,250 per family, while 2-person families (3 | 25.0%) have the highest median income of $25,625 per family member.
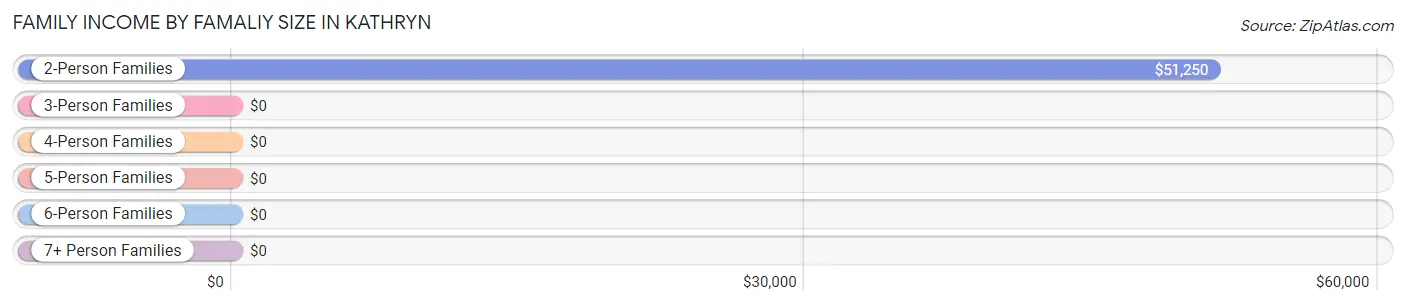
| Income Bracket | # Families | Median Income |
| 2-Person Families | 3 (25.0%) | $51,250 |
| 3-Person Families | 2 (16.7%) | $0 |
| 4-Person Families | 0 (0.0%) | $0 |
| 5-Person Families | 7 (58.3%) | $0 |
| 6-Person Families | 0 (0.0%) | $0 |
| 7+ Person Families | 0 (0.0%) | $0 |
| Total | 12 (100.0%) | $96,071 |
Family Income by Number of Earners in Kathryn
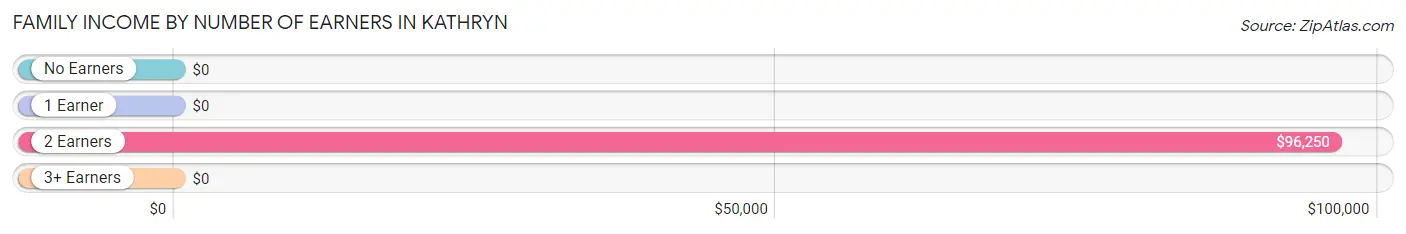
| Number of Earners | # Families | Median Income |
| No Earners | 1 (8.3%) | $0 |
| 1 Earner | 0 (0.0%) | $0 |
| 2 Earners | 11 (91.7%) | $96,250 |
| 3+ Earners | 0 (0.0%) | $0 |
| Total | 12 (100.0%) | $96,071 |
Household Income in Kathryn
Household Income Brackets in Kathryn
With 7 households falling in the category, the $75,000 to $99,999 income range is the most frequent in Kathryn, accounting for 19.4% of all households.
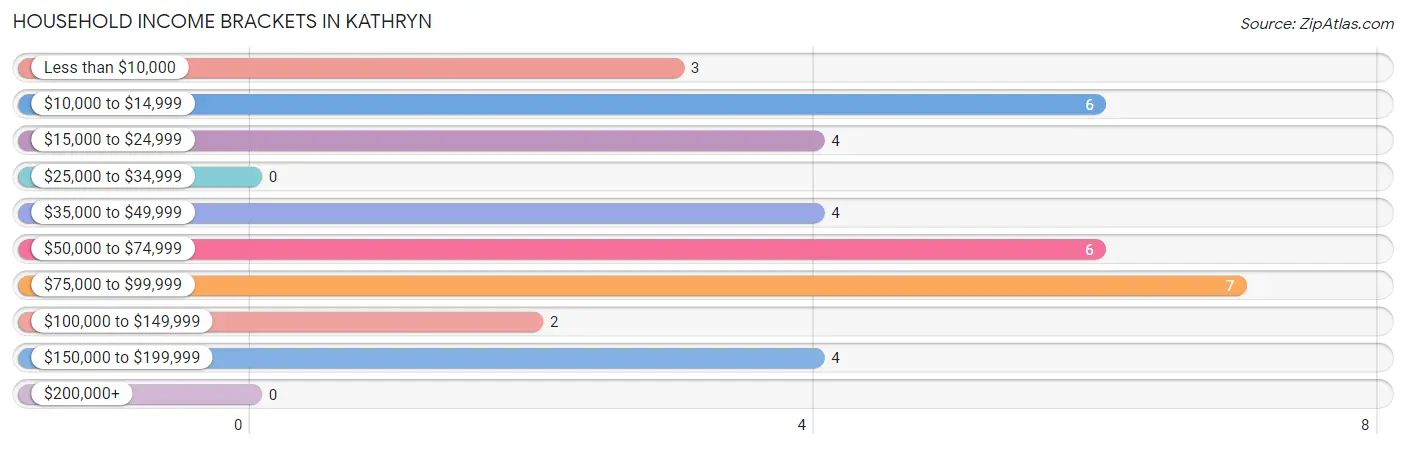
| Income Bracket | # Households | % Households |
| Less than $10,000 | 3 | 8.3% |
| $10,000 to $14,999 | 6 | 16.7% |
| $15,000 to $24,999 | 4 | 11.1% |
| $25,000 to $34,999 | 0 | 0.0% |
| $35,000 to $49,999 | 4 | 11.1% |
| $50,000 to $74,999 | 6 | 16.7% |
| $75,000 to $99,999 | 7 | 19.4% |
| $100,000 to $149,999 | 2 | 5.6% |
| $150,000 to $199,999 | 4 | 11.1% |
| $200,000+ | 0 | 0.0% |
Household Income by Householder Age in Kathryn
The median household income in Kathryn is $50,833, with the highest median household income of $51,250 found in the 45 to 64 years age bracket for the primary householder. A total of 9 households (25.0%) fall into this category.
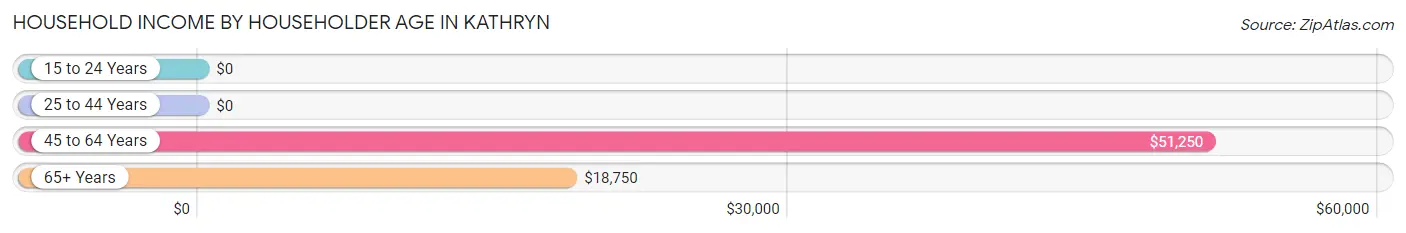
| Income Bracket | # Households | Median Income |
| 15 to 24 Years | 0 (0.0%) | $0 |
| 25 to 44 Years | 15 (41.7%) | $0 |
| 45 to 64 Years | 9 (25.0%) | $51,250 |
| 65+ Years | 12 (33.3%) | $18,750 |
| Total | 36 (100.0%) | $50,833 |
Poverty in Kathryn
Income Below Poverty by Sex and Age in Kathryn
With 3.1% poverty level for males and 30.0% for females among the residents of Kathryn, 75 year old and over males and 45 to 54 year old females are the most vulnerable to poverty, with 1 males (100.0%) and 5 females (100.0%) in their respective age groups living below the poverty level.
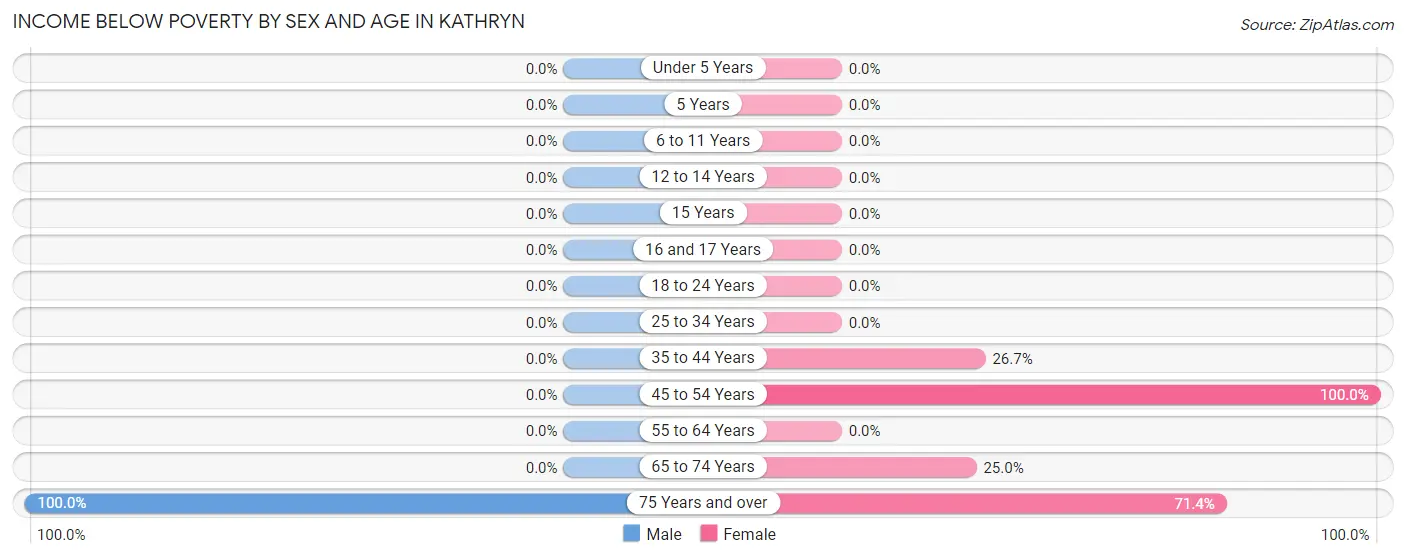
| Age Bracket | Male | Female |
| Under 5 Years | 0 (0.0%) | 0 (0.0%) |
| 5 Years | 0 (0.0%) | 0 (0.0%) |
| 6 to 11 Years | 0 (0.0%) | 0 (0.0%) |
| 12 to 14 Years | 0 (0.0%) | 0 (0.0%) |
| 15 Years | 0 (0.0%) | 0 (0.0%) |
| 16 and 17 Years | 0 (0.0%) | 0 (0.0%) |
| 18 to 24 Years | 0 (0.0%) | 0 (0.0%) |
| 25 to 34 Years | 0 (0.0%) | 0 (0.0%) |
| 35 to 44 Years | 0 (0.0%) | 4 (26.7%) |
| 45 to 54 Years | 0 (0.0%) | 5 (100.0%) |
| 55 to 64 Years | 0 (0.0%) | 0 (0.0%) |
| 65 to 74 Years | 0 (0.0%) | 1 (25.0%) |
| 75 Years and over | 1 (100.0%) | 5 (71.4%) |
| Total | 1 (3.1%) | 15 (30.0%) |
Income Above Poverty by Sex and Age in Kathryn
According to the poverty statistics in Kathryn, males aged 6 to 11 years and females aged 6 to 11 years are the age groups that are most secure financially, with 100.0% of males and 100.0% of females in these age groups living above the poverty line.
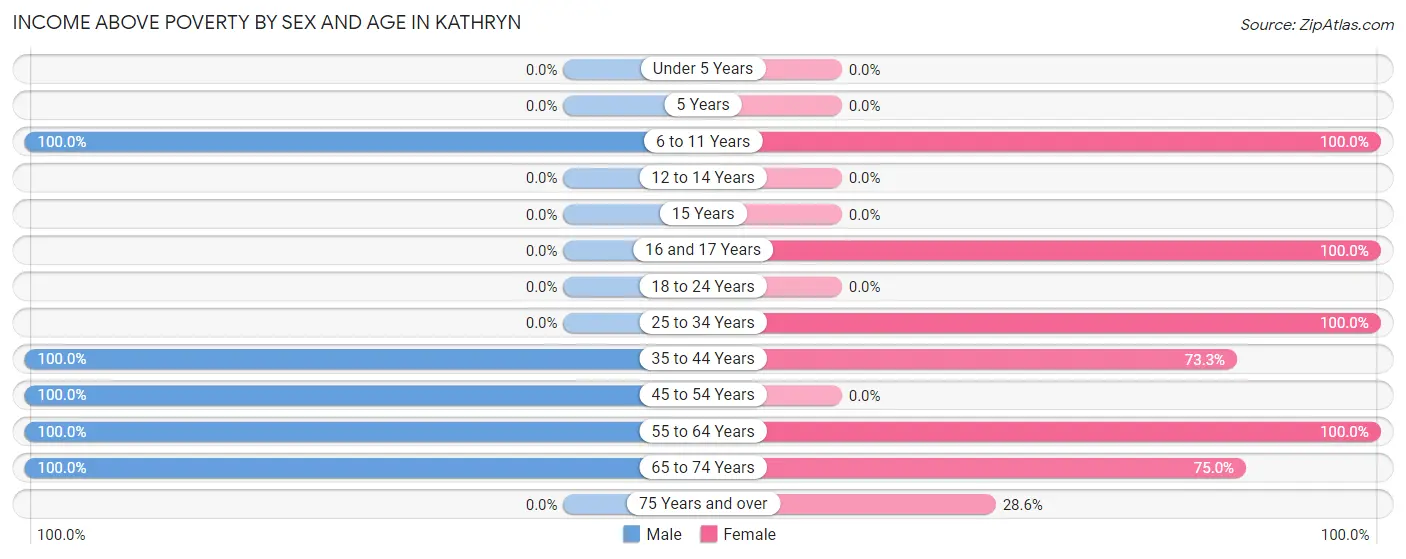
| Age Bracket | Male | Female |
| Under 5 Years | 0 (0.0%) | 0 (0.0%) |
| 5 Years | 0 (0.0%) | 0 (0.0%) |
| 6 to 11 Years | 12 (100.0%) | 6 (100.0%) |
| 12 to 14 Years | 0 (0.0%) | 0 (0.0%) |
| 15 Years | 0 (0.0%) | 0 (0.0%) |
| 16 and 17 Years | 0 (0.0%) | 4 (100.0%) |
| 18 to 24 Years | 0 (0.0%) | 0 (0.0%) |
| 25 to 34 Years | 0 (0.0%) | 1 (100.0%) |
| 35 to 44 Years | 11 (100.0%) | 11 (73.3%) |
| 45 to 54 Years | 2 (100.0%) | 0 (0.0%) |
| 55 to 64 Years | 3 (100.0%) | 8 (100.0%) |
| 65 to 74 Years | 3 (100.0%) | 3 (75.0%) |
| 75 Years and over | 0 (0.0%) | 2 (28.6%) |
| Total | 31 (96.9%) | 35 (70.0%) |
Income Below Poverty Among Married-Couple Families in Kathryn
The poverty statistics for married-couple families in Kathryn show that 8.3% or 1 of the total 12 families live below the poverty line. Families with no children have the highest poverty rate of 20.0%, comprising of 1 families. On the other hand, families with 3 or 4 children have the lowest poverty rate of 0.0%, which includes 0 families.
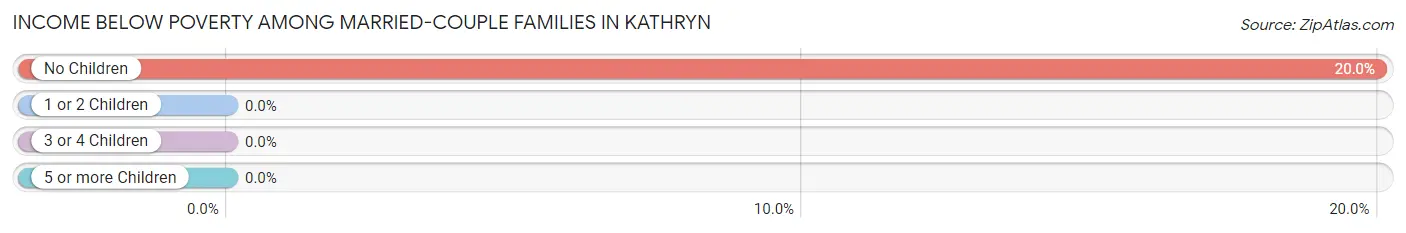
| Children | Above Poverty | Below Poverty |
| No Children | 4 (80.0%) | 1 (20.0%) |
| 1 or 2 Children | 0 (0.0%) | 0 (0.0%) |
| 3 or 4 Children | 7 (100.0%) | 0 (0.0%) |
| 5 or more Children | 0 (0.0%) | 0 (0.0%) |
| Total | 11 (91.7%) | 1 (8.3%) |
Income Below Poverty Among Single-Parent Households in Kathryn
| Children | Single Father | Single Mother |
| No Children | 0 (0.0%) | 0 (0.0%) |
| 1 or 2 Children | 0 (0.0%) | 0 (0.0%) |
| 3 or 4 Children | 0 (0.0%) | 0 (0.0%) |
| 5 or more Children | 0 (0.0%) | 0 (0.0%) |
| Total | 0 (0.0%) | 0 (0.0%) |
Income Below Poverty Among Married-Couple vs Single-Parent Households in Kathryn
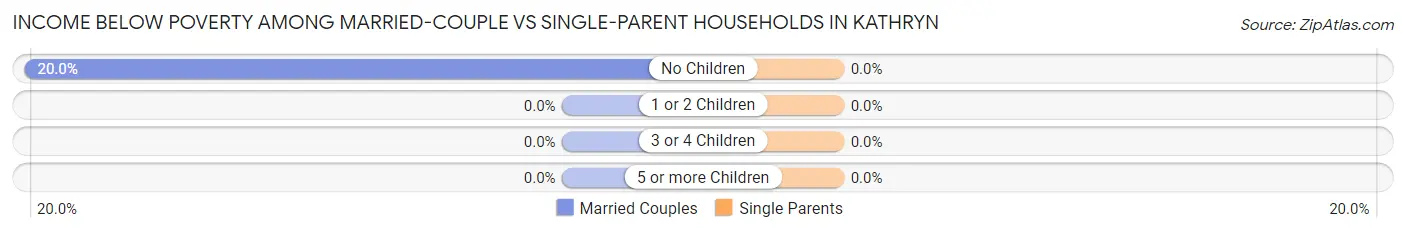
| Children | Married-Couple Families | Single-Parent Households |
| No Children | 1 (20.0%) | 0 (0.0%) |
| 1 or 2 Children | 0 (0.0%) | 0 (0.0%) |
| 3 or 4 Children | 0 (0.0%) | 0 (0.0%) |
| 5 or more Children | 0 (0.0%) | 0 (0.0%) |
| Total | 1 (8.3%) | 0 (0.0%) |
Race in Kathryn
The most populous races in Kathryn are White / Caucasian (81 | 98.8%), Hispanic or Latino (2 | 2.4%), and Native / Alaskan (1 | 1.2%).
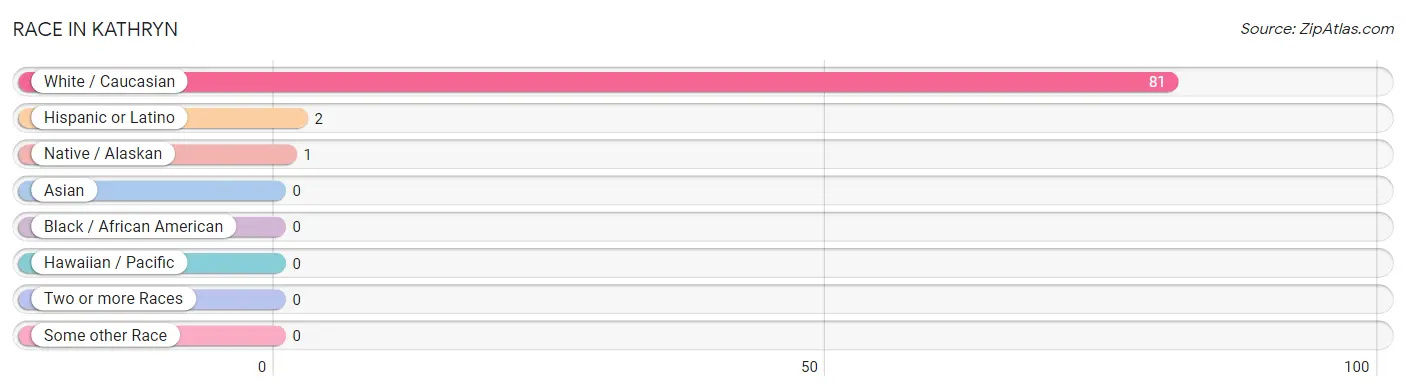
| Race | # Population | % Population |
| Asian | 0 | 0.0% |
| Black / African American | 0 | 0.0% |
| Hawaiian / Pacific | 0 | 0.0% |
| Hispanic or Latino | 2 | 2.4% |
| Native / Alaskan | 1 | 1.2% |
| White / Caucasian | 81 | 98.8% |
| Two or more Races | 0 | 0.0% |
| Some other Race | 0 | 0.0% |
| Total | 82 | 100.0% |
Ancestry in Kathryn
The most populous ancestries reported in Kathryn are Norwegian (41 | 50.0%), French Canadian (32 | 39.0%), German (27 | 32.9%), English (7 | 8.5%), and Czech (4 | 4.9%), together accounting for 135.4% of all Kathryn residents.
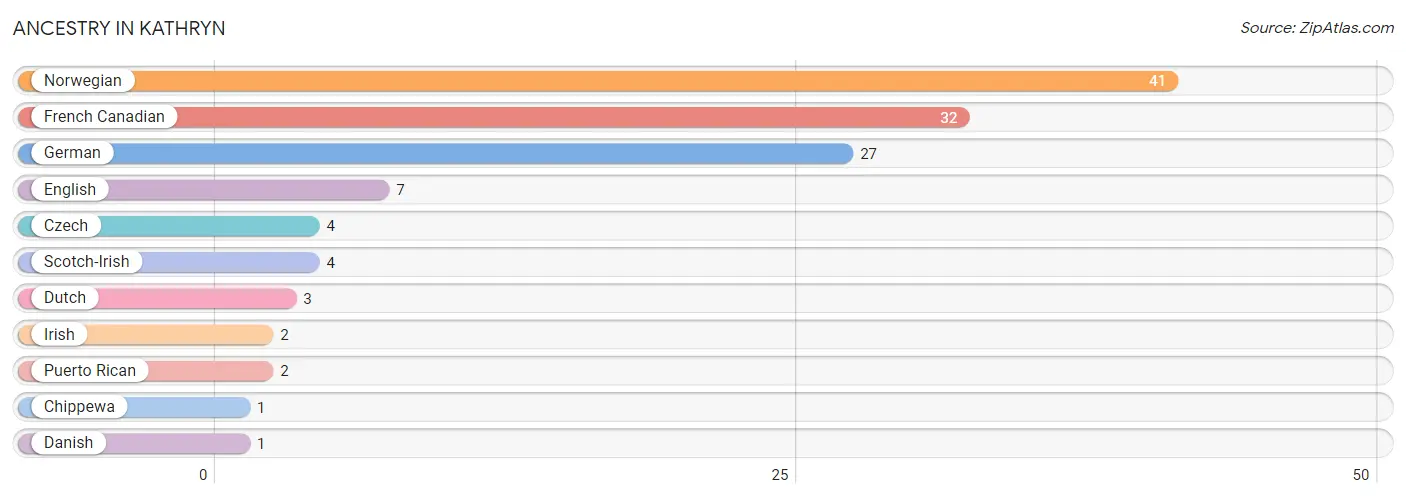
| Ancestry | # Population | % Population |
| Chippewa | 1 | 1.2% |
| Czech | 4 | 4.9% |
| Danish | 1 | 1.2% |
| Dutch | 3 | 3.7% |
| English | 7 | 8.5% |
| French Canadian | 32 | 39.0% |
| German | 27 | 32.9% |
| Irish | 2 | 2.4% |
| Norwegian | 41 | 50.0% |
| Puerto Rican | 2 | 2.4% |
| Scotch-Irish | 4 | 4.9% | View All 11 Rows |
Immigrants in Kathryn
The most numerous immigrant groups reported in Kathryn came from , and Canada (2 | 2.4%), together accounting for 2.4% of all Kathryn residents.

| Immigration Origin | # Population | % Population |
| Canada | 2 | 2.4% | View All 1 Rows |
Sex and Age in Kathryn
Sex and Age in Kathryn
The most populous age groups in Kathryn are 5 to 9 Years (12 | 37.5%) for men and 40 to 44 Years (15 | 30.0%) for women.
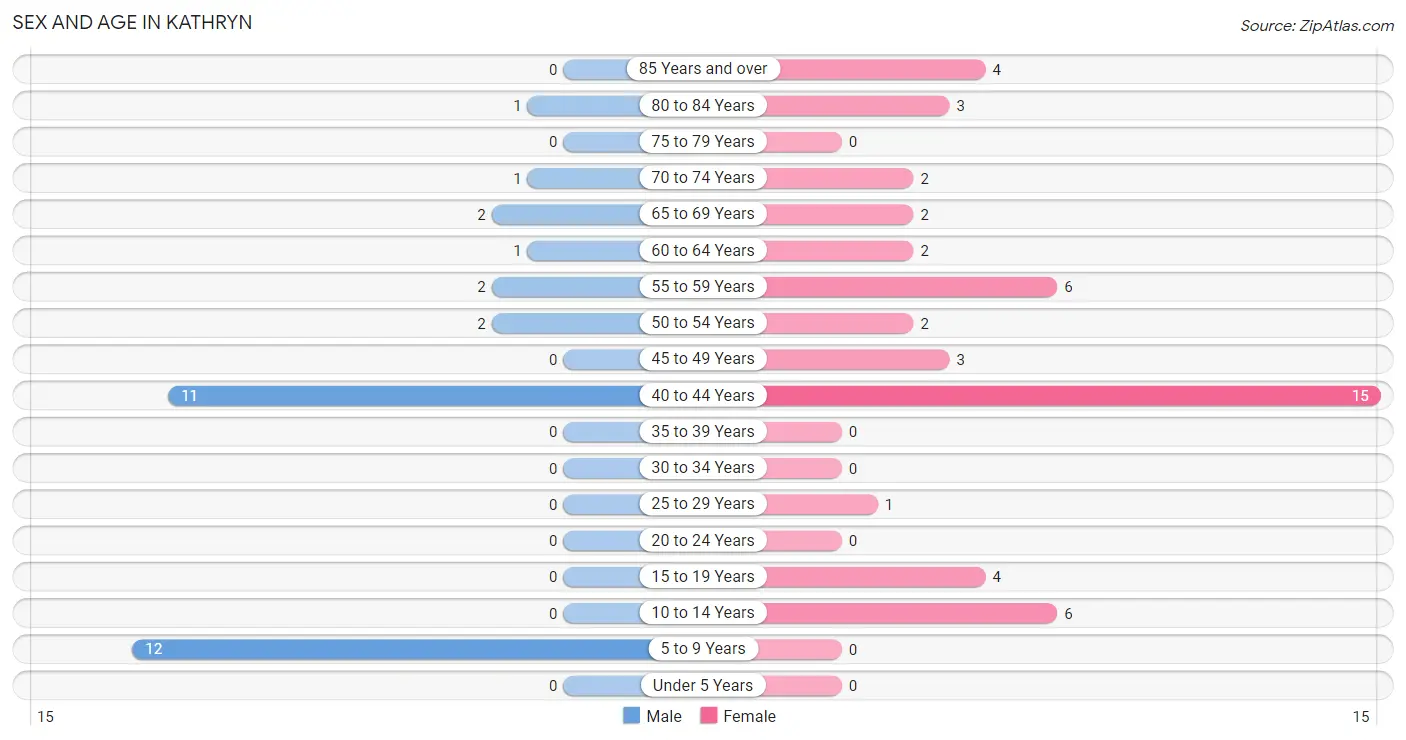
| Age Bracket | Male | Female |
| Under 5 Years | 0 (0.0%) | 0 (0.0%) |
| 5 to 9 Years | 12 (37.5%) | 0 (0.0%) |
| 10 to 14 Years | 0 (0.0%) | 6 (12.0%) |
| 15 to 19 Years | 0 (0.0%) | 4 (8.0%) |
| 20 to 24 Years | 0 (0.0%) | 0 (0.0%) |
| 25 to 29 Years | 0 (0.0%) | 1 (2.0%) |
| 30 to 34 Years | 0 (0.0%) | 0 (0.0%) |
| 35 to 39 Years | 0 (0.0%) | 0 (0.0%) |
| 40 to 44 Years | 11 (34.4%) | 15 (30.0%) |
| 45 to 49 Years | 0 (0.0%) | 3 (6.0%) |
| 50 to 54 Years | 2 (6.2%) | 2 (4.0%) |
| 55 to 59 Years | 2 (6.2%) | 6 (12.0%) |
| 60 to 64 Years | 1 (3.1%) | 2 (4.0%) |
| 65 to 69 Years | 2 (6.2%) | 2 (4.0%) |
| 70 to 74 Years | 1 (3.1%) | 2 (4.0%) |
| 75 to 79 Years | 0 (0.0%) | 0 (0.0%) |
| 80 to 84 Years | 1 (3.1%) | 3 (6.0%) |
| 85 Years and over | 0 (0.0%) | 4 (8.0%) |
| Total | 32 (100.0%) | 50 (100.0%) |
Families and Households in Kathryn
Median Family Size in Kathryn
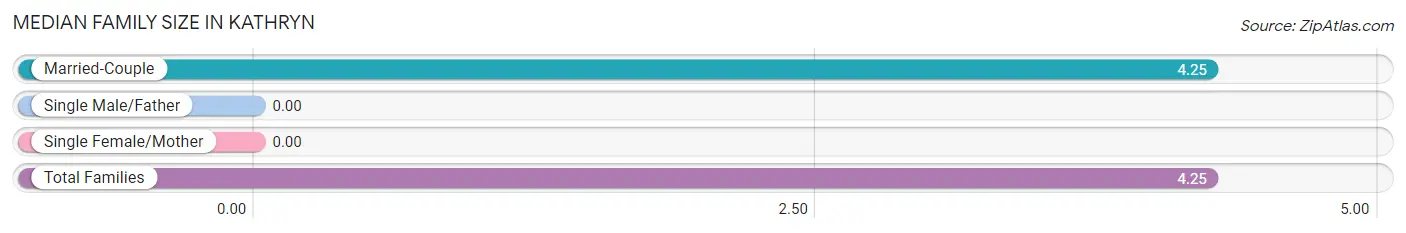
| Family Type | # Families | Family Size |
| Married-Couple | 12 (100.0%) | 4.25 |
| Single Male/Father | 0 (0.0%) | - |
| Single Female/Mother | 0 (0.0%) | - |
| Total Families | 12 (100.0%) | 4.25 |
Median Household Size in Kathryn
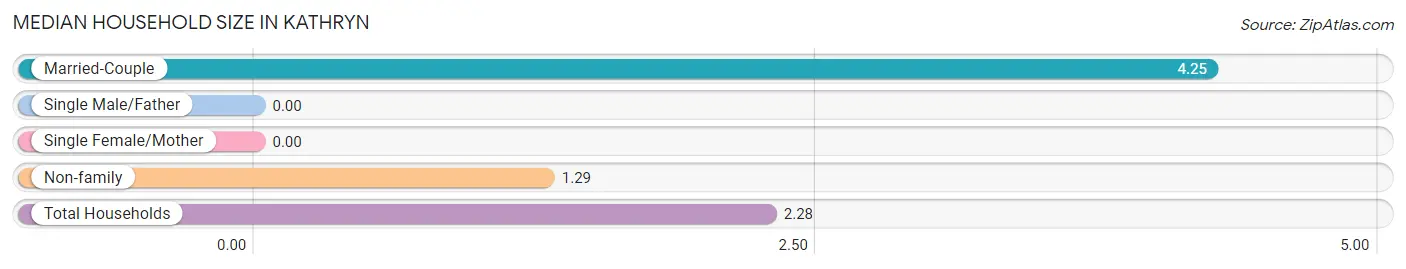
| Household Type | # Households | Household Size |
| Married-Couple | 12 (33.3%) | 4.25 |
| Single Male/Father | 0 (0.0%) | - |
| Single Female/Mother | 0 (0.0%) | - |
| Non-family | 24 (66.7%) | 1.29 |
| Total Households | 36 (100.0%) | 2.28 |
Household Size by Marriage Status in Kathryn
Out of a total of 36 households in Kathryn, 12 (33.3%) are family households, while 24 (66.7%) are nonfamily households. The most numerous type of family households are 5-person households, comprising 7, and the most common type of nonfamily households are 1-person households, comprising 16.
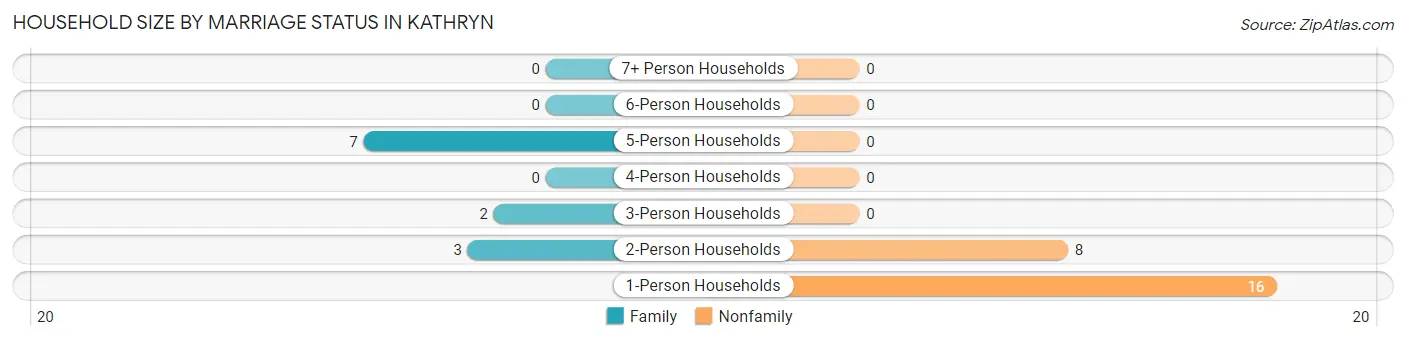
| Household Size | Family Households | Nonfamily Households |
| 1-Person Households | - | 16 (44.4%) |
| 2-Person Households | 3 (8.3%) | 8 (22.2%) |
| 3-Person Households | 2 (5.6%) | 0 (0.0%) |
| 4-Person Households | 0 (0.0%) | 0 (0.0%) |
| 5-Person Households | 7 (19.4%) | 0 (0.0%) |
| 6-Person Households | 0 (0.0%) | 0 (0.0%) |
| 7+ Person Households | 0 (0.0%) | 0 (0.0%) |
| Total | 12 (33.3%) | 24 (66.7%) |
Female Fertility in Kathryn
Fertility by Age in Kathryn
| Age Bracket | Women with Births | Births / 1,000 Women |
| 15 to 19 years | 0 (0.0%) | 0.0 |
| 20 to 34 years | 0 (0.0%) | 0.0 |
| 35 to 50 years | 0 (0.0%) | 0.0 |
| Total | 0 (0.0%) | 0.0 |
Fertility by Age by Marriage Status in Kathryn
| Age Bracket | Married | Unmarried |
| 15 to 19 years | 0 (0.0%) | 0 (0.0%) |
| 20 to 34 years | 0 (0.0%) | 0 (0.0%) |
| 35 to 50 years | 0 (0.0%) | 0 (0.0%) |
| Total | 0 (0.0%) | 0 (0.0%) |
Fertility by Education in Kathryn
| Educational Attainment | Women with Births | Births / 1,000 Women |
| Less than High School | 0 (0.0%) | 0.0 |
| High School Diploma | 0 (0.0%) | 0.0 |
| College or Associate's Degree | 0 (0.0%) | 0.0 |
| Bachelor's Degree | 0 (0.0%) | 0.0 |
| Graduate Degree | 0 (0.0%) | 0.0 |
| Total | 0 (0.0%) | 0.0 |
Fertility by Education by Marriage Status in Kathryn
| Educational Attainment | Married | Unmarried |
| Less than High School | 0 (0.0%) | 0 (0.0%) |
| High School Diploma | 0 (0.0%) | 0 (0.0%) |
| College or Associate's Degree | 0 (0.0%) | 0 (0.0%) |
| Bachelor's Degree | 0 (0.0%) | 0 (0.0%) |
| Graduate Degree | 0 (0.0%) | 0 (0.0%) |
| Total | 0 (0.0%) | 0 (0.0%) |
Employment Characteristics in Kathryn
Employment by Class of Employer in Kathryn
Among the 23 employed individuals in Kathryn, private company employees (18 | 78.3%), self-employed (not incorporated) (2 | 8.7%), and not-for-profit organizations (2 | 8.7%) make up the most common classes of employment.
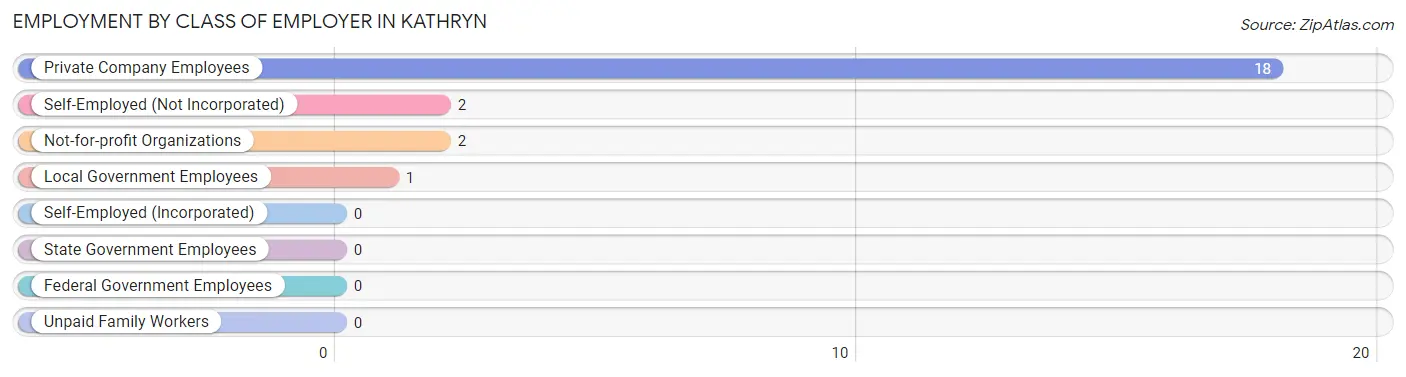
| Employer Class | # Employees | % Employees |
| Private Company Employees | 18 | 78.3% |
| Self-Employed (Incorporated) | 0 | 0.0% |
| Self-Employed (Not Incorporated) | 2 | 8.7% |
| Not-for-profit Organizations | 2 | 8.7% |
| Local Government Employees | 1 | 4.3% |
| State Government Employees | 0 | 0.0% |
| Federal Government Employees | 0 | 0.0% |
| Unpaid Family Workers | 0 | 0.0% |
| Total | 23 | 100.0% |
Employment Status by Age in Kathryn
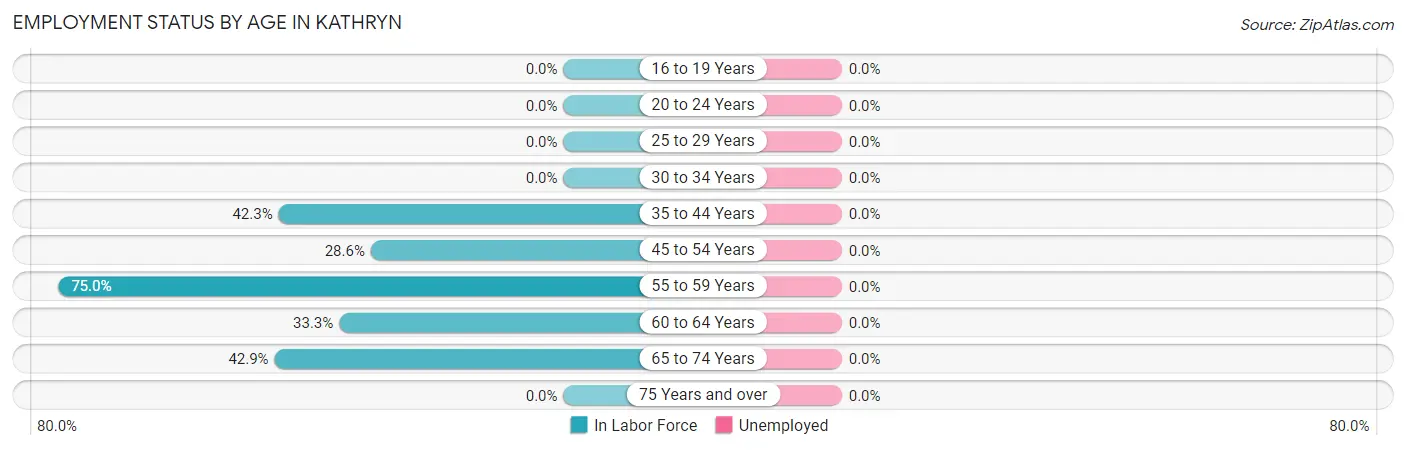
| Age Bracket | In Labor Force | Unemployed |
| 16 to 19 Years | 0 (0.0%) | 0 (0.0%) |
| 20 to 24 Years | 0 (0.0%) | 0 (0.0%) |
| 25 to 29 Years | 0 (0.0%) | 0 (0.0%) |
| 30 to 34 Years | 0 (0.0%) | 0 (0.0%) |
| 35 to 44 Years | 11 (42.3%) | 0 (0.0%) |
| 45 to 54 Years | 2 (28.6%) | 0 (0.0%) |
| 55 to 59 Years | 6 (75.0%) | 0 (0.0%) |
| 60 to 64 Years | 1 (33.3%) | 0 (0.0%) |
| 65 to 74 Years | 3 (42.9%) | 0 (0.0%) |
| 75 Years and over | 0 (0.0%) | 0 (0.0%) |
| Total | 23 (35.9%) | 0 (0.0%) |
Employment Status by Educational Attainment in Kathryn
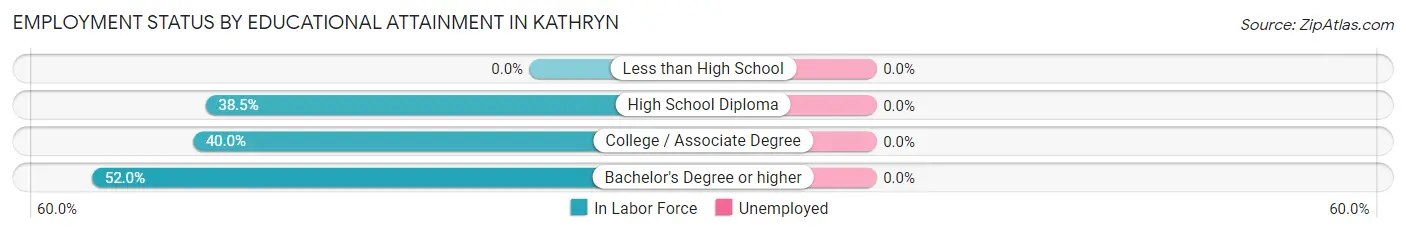
| Educational Attainment | In Labor Force | Unemployed |
| Less than High School | 0 (0.0%) | 0 (0.0%) |
| High School Diploma | 5 (38.5%) | 0 (0.0%) |
| College / Associate Degree | 2 (40.0%) | 0 (0.0%) |
| Bachelor's Degree or higher | 13 (52.0%) | 0 (0.0%) |
| Total | 20 (44.4%) | 0 (0.0%) |
Employment Occupations by Sex in Kathryn
Management, Business, Science and Arts Occupations
The most common Management, Business, Science and Arts occupations in Kathryn are Management (8 | 34.8%), Community & Social Service (2 | 8.7%), and Education, Arts & Media (2 | 8.7%).
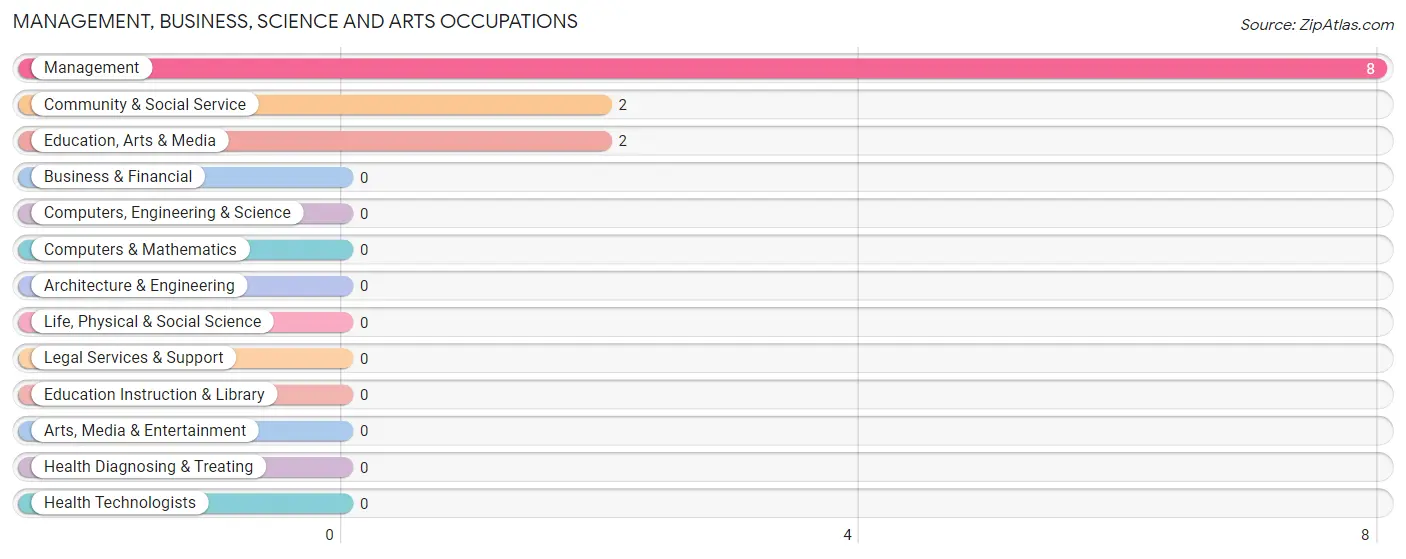
Management, Business, Science and Arts Occupations by Sex
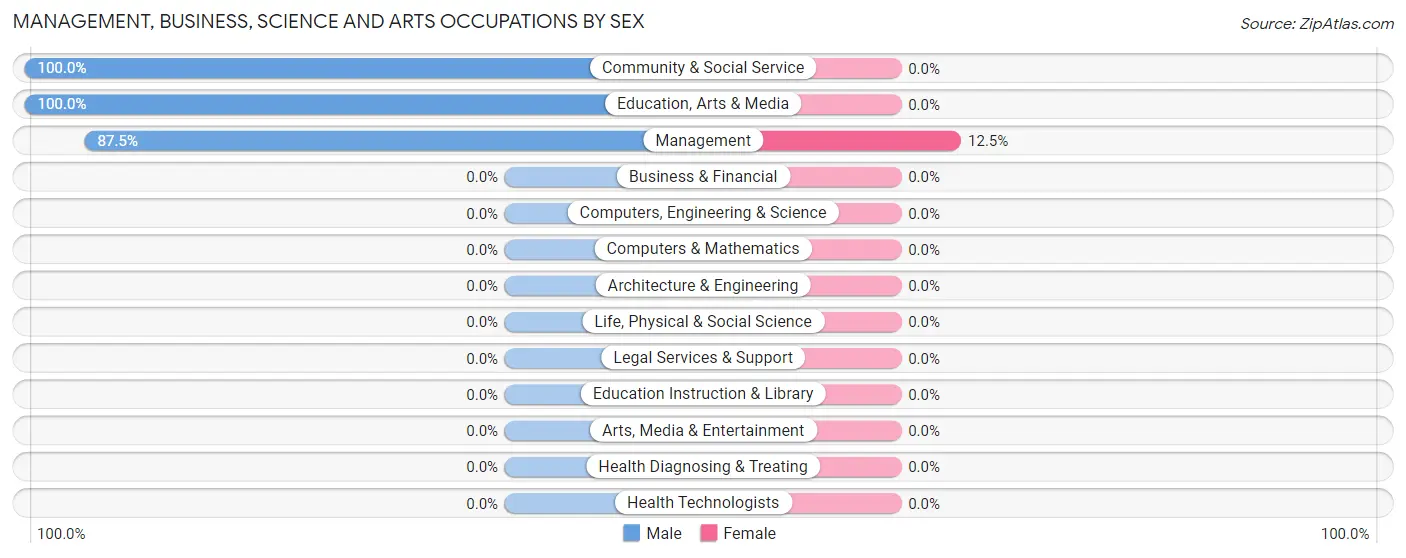
| Occupation | Male | Female |
| Management | 7 (87.5%) | 1 (12.5%) |
| Business & Financial | 0 (0.0%) | 0 (0.0%) |
| Computers, Engineering & Science | 0 (0.0%) | 0 (0.0%) |
| Computers & Mathematics | 0 (0.0%) | 0 (0.0%) |
| Architecture & Engineering | 0 (0.0%) | 0 (0.0%) |
| Life, Physical & Social Science | 0 (0.0%) | 0 (0.0%) |
| Community & Social Service | 2 (100.0%) | 0 (0.0%) |
| Education, Arts & Media | 2 (100.0%) | 0 (0.0%) |
| Legal Services & Support | 0 (0.0%) | 0 (0.0%) |
| Education Instruction & Library | 0 (0.0%) | 0 (0.0%) |
| Arts, Media & Entertainment | 0 (0.0%) | 0 (0.0%) |
| Health Diagnosing & Treating | 0 (0.0%) | 0 (0.0%) |
| Health Technologists | 0 (0.0%) | 0 (0.0%) |
| Total (Category) | 9 (90.0%) | 1 (10.0%) |
| Total (Overall) | 17 (73.9%) | 6 (26.1%) |
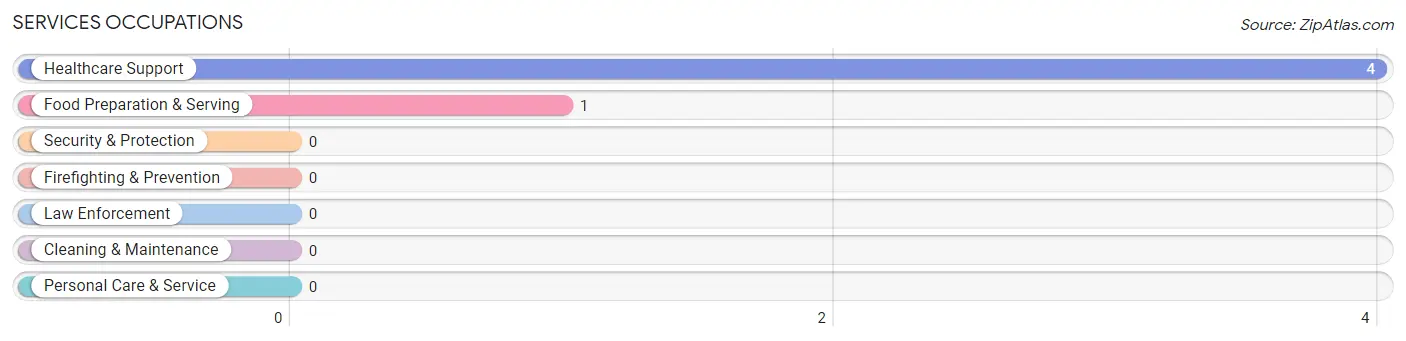
Services Occupations
The most common Services occupations in Kathryn are Healthcare Support (4 | 17.4%), and Food Preparation & Serving (1 | 4.3%).
Services Occupations by Sex
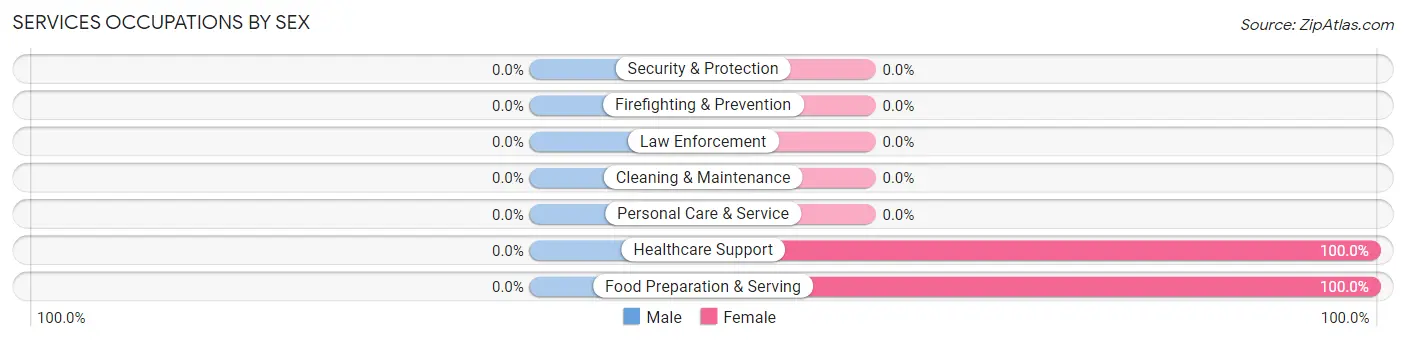
| Occupation | Male | Female |
| Healthcare Support | 0 (0.0%) | 4 (100.0%) |
| Security & Protection | 0 (0.0%) | 0 (0.0%) |
| Firefighting & Prevention | 0 (0.0%) | 0 (0.0%) |
| Law Enforcement | 0 (0.0%) | 0 (0.0%) |
| Food Preparation & Serving | 0 (0.0%) | 1 (100.0%) |
| Cleaning & Maintenance | 0 (0.0%) | 0 (0.0%) |
| Personal Care & Service | 0 (0.0%) | 0 (0.0%) |
| Total (Category) | 0 (0.0%) | 5 (100.0%) |
| Total (Overall) | 17 (73.9%) | 6 (26.1%) |
Sales and Office Occupations
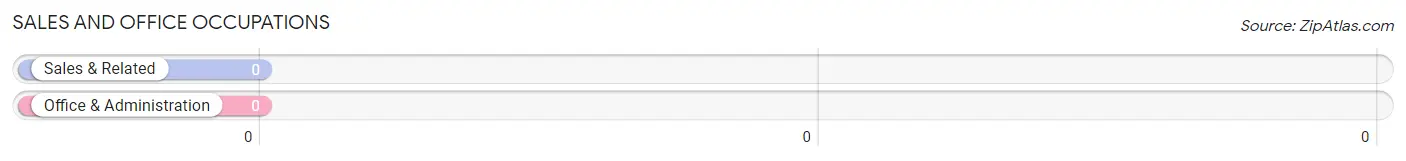
Sales and Office Occupations by Sex
| Occupation | Male | Female |
| Sales & Related | 0 (0.0%) | 0 (0.0%) |
| Office & Administration | 0 (0.0%) | 0 (0.0%) |
| Total (Category) | 0 (0.0%) | 0 (0.0%) |
| Total (Overall) | 17 (73.9%) | 6 (26.1%) |
Natural Resources, Construction and Maintenance Occupations
The most common Natural Resources, Construction and Maintenance occupations in Kathryn are Installation, Maintenance & Repair (5 | 21.7%), and Construction & Extraction (1 | 4.3%).
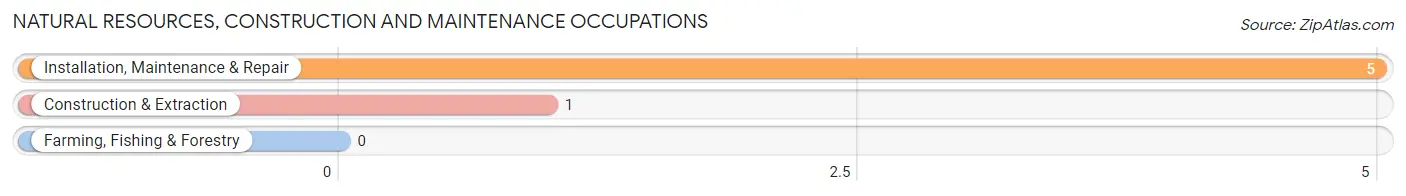
Natural Resources, Construction and Maintenance Occupations by Sex
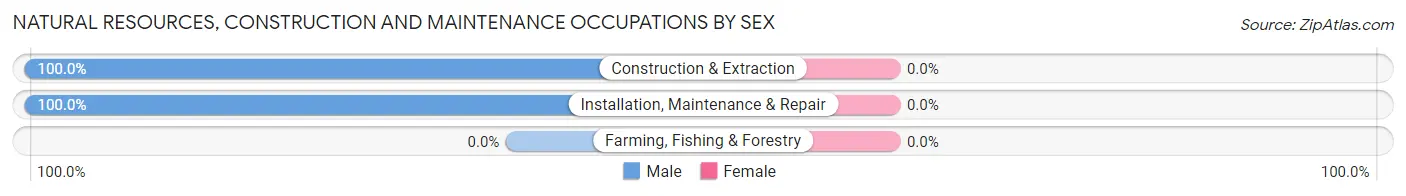
| Occupation | Male | Female |
| Farming, Fishing & Forestry | 0 (0.0%) | 0 (0.0%) |
| Construction & Extraction | 1 (100.0%) | 0 (0.0%) |
| Installation, Maintenance & Repair | 5 (100.0%) | 0 (0.0%) |
| Total (Category) | 6 (100.0%) | 0 (0.0%) |
| Total (Overall) | 17 (73.9%) | 6 (26.1%) |
Production, Transportation and Moving Occupations
The most common Production, Transportation and Moving occupations in Kathryn are , and Transportation (2 | 8.7%).
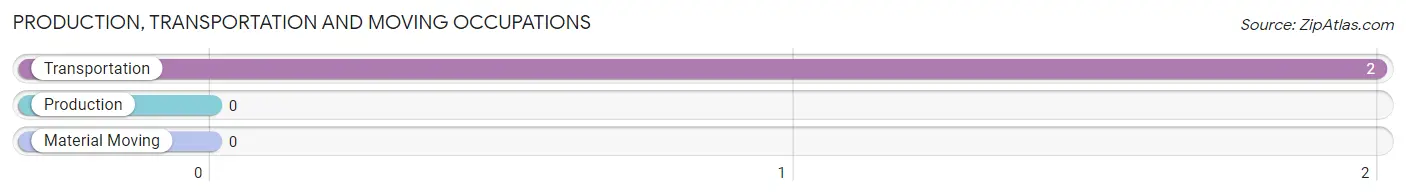
Production, Transportation and Moving Occupations by Sex
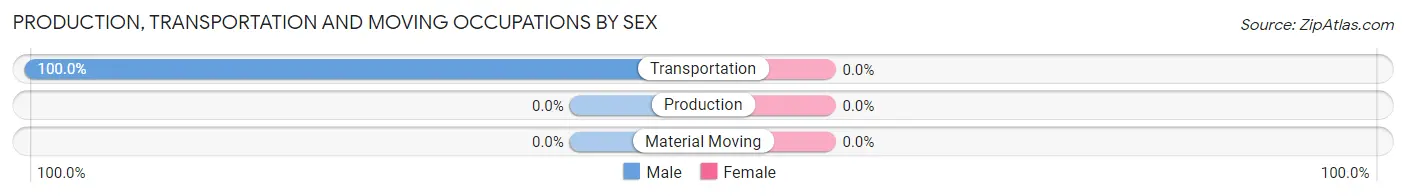
| Occupation | Male | Female |
| Production | 0 (0.0%) | 0 (0.0%) |
| Transportation | 2 (100.0%) | 0 (0.0%) |
| Material Moving | 0 (0.0%) | 0 (0.0%) |
| Total (Category) | 2 (100.0%) | 0 (0.0%) |
| Total (Overall) | 17 (73.9%) | 6 (26.1%) |
Employment Industries by Sex in Kathryn
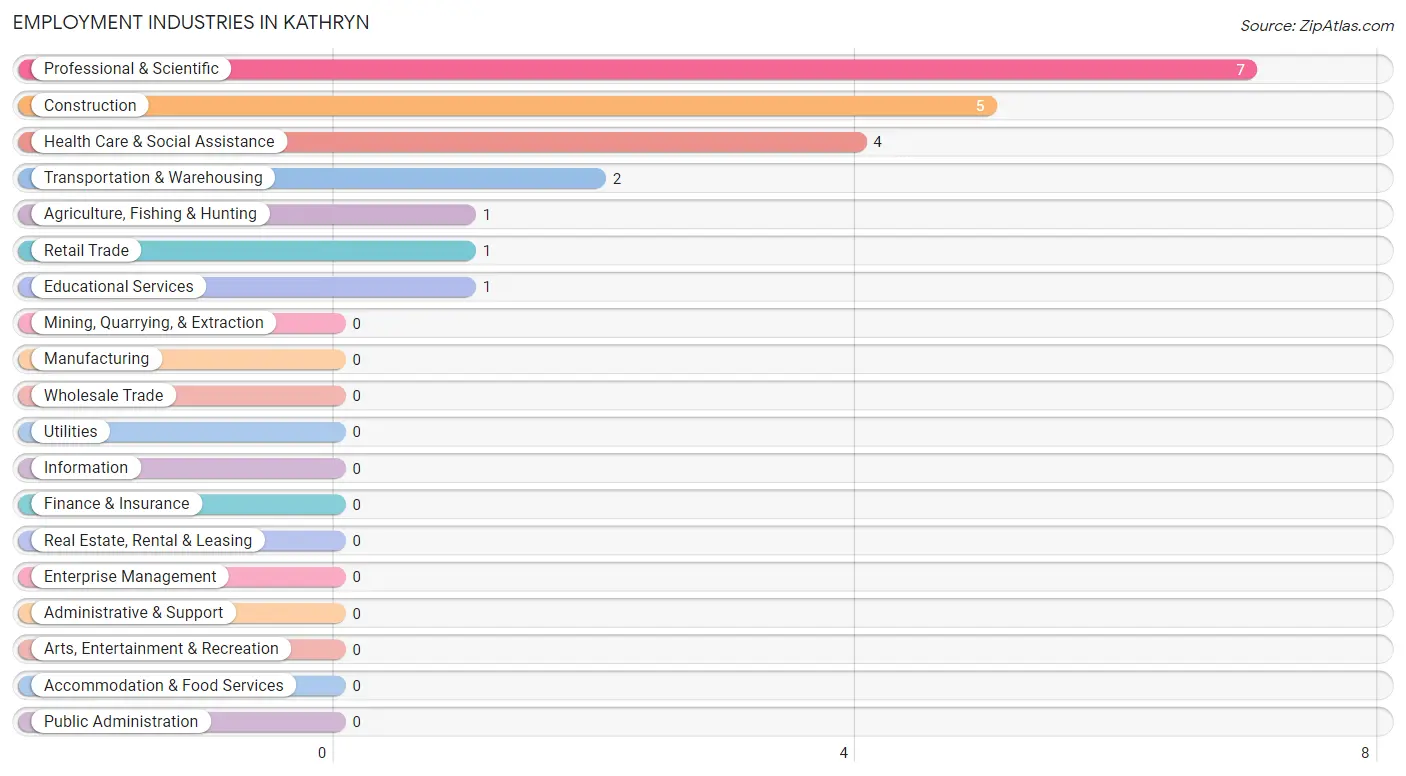
Employment Industries in Kathryn
The major employment industries in Kathryn include Professional & Scientific (7 | 30.4%), Construction (5 | 21.7%), Health Care & Social Assistance (4 | 17.4%), Transportation & Warehousing (2 | 8.7%), and Agriculture, Fishing & Hunting (1 | 4.3%).
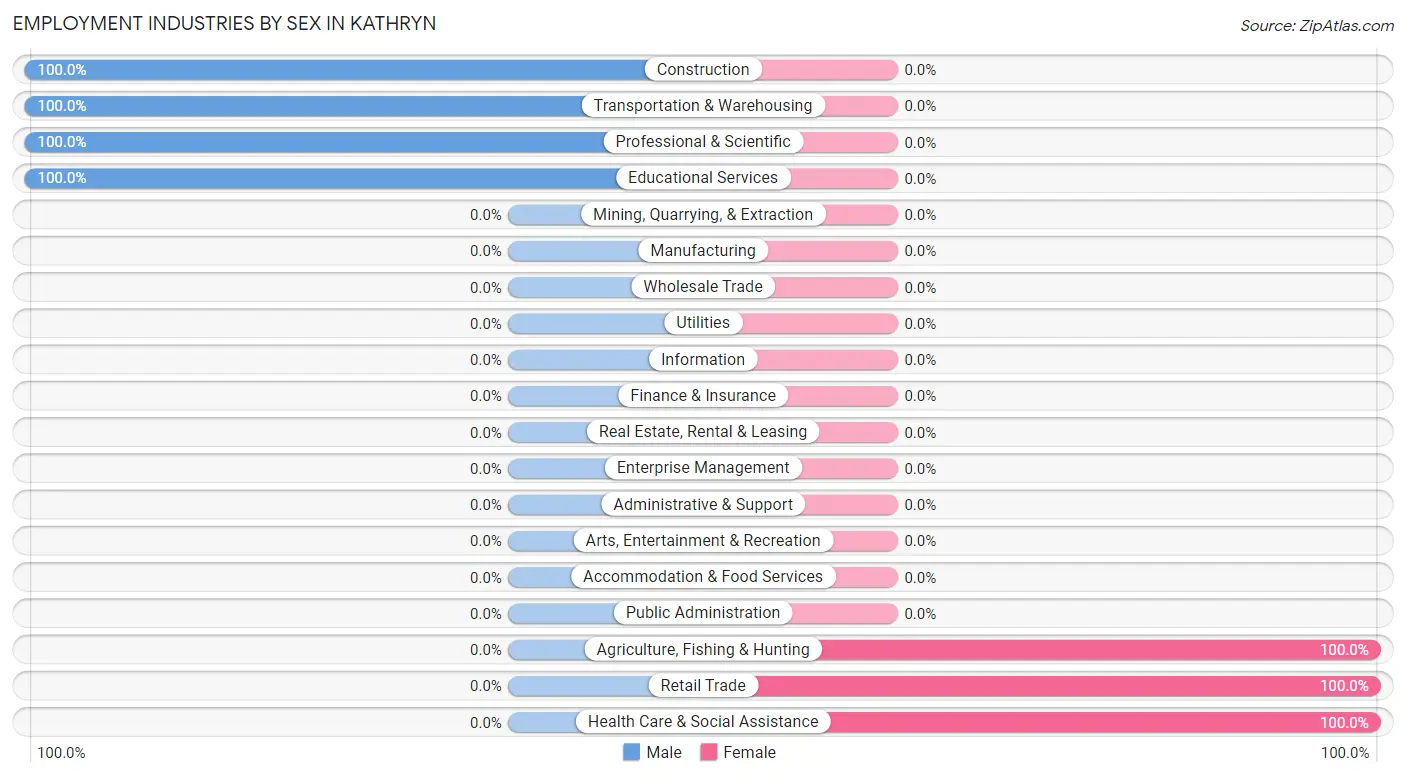
Employment Industries by Sex in Kathryn
The Kathryn industries that see more men than women are Construction (100.0%), Transportation & Warehousing (100.0%), and Professional & Scientific (100.0%), whereas the industries that tend to have a higher number of women are Agriculture, Fishing & Hunting (100.0%), Retail Trade (100.0%), and Health Care & Social Assistance (100.0%).
| Industry | Male | Female |
| Agriculture, Fishing & Hunting | 0 (0.0%) | 1 (100.0%) |
| Mining, Quarrying, & Extraction | 0 (0.0%) | 0 (0.0%) |
| Construction | 5 (100.0%) | 0 (0.0%) |
| Manufacturing | 0 (0.0%) | 0 (0.0%) |
| Wholesale Trade | 0 (0.0%) | 0 (0.0%) |
| Retail Trade | 0 (0.0%) | 1 (100.0%) |
| Transportation & Warehousing | 2 (100.0%) | 0 (0.0%) |
| Utilities | 0 (0.0%) | 0 (0.0%) |
| Information | 0 (0.0%) | 0 (0.0%) |
| Finance & Insurance | 0 (0.0%) | 0 (0.0%) |
| Real Estate, Rental & Leasing | 0 (0.0%) | 0 (0.0%) |
| Professional & Scientific | 7 (100.0%) | 0 (0.0%) |
| Enterprise Management | 0 (0.0%) | 0 (0.0%) |
| Administrative & Support | 0 (0.0%) | 0 (0.0%) |
| Educational Services | 1 (100.0%) | 0 (0.0%) |
| Health Care & Social Assistance | 0 (0.0%) | 4 (100.0%) |
| Arts, Entertainment & Recreation | 0 (0.0%) | 0 (0.0%) |
| Accommodation & Food Services | 0 (0.0%) | 0 (0.0%) |
| Public Administration | 0 (0.0%) | 0 (0.0%) |
| Total | 17 (73.9%) | 6 (26.1%) |
Education in Kathryn
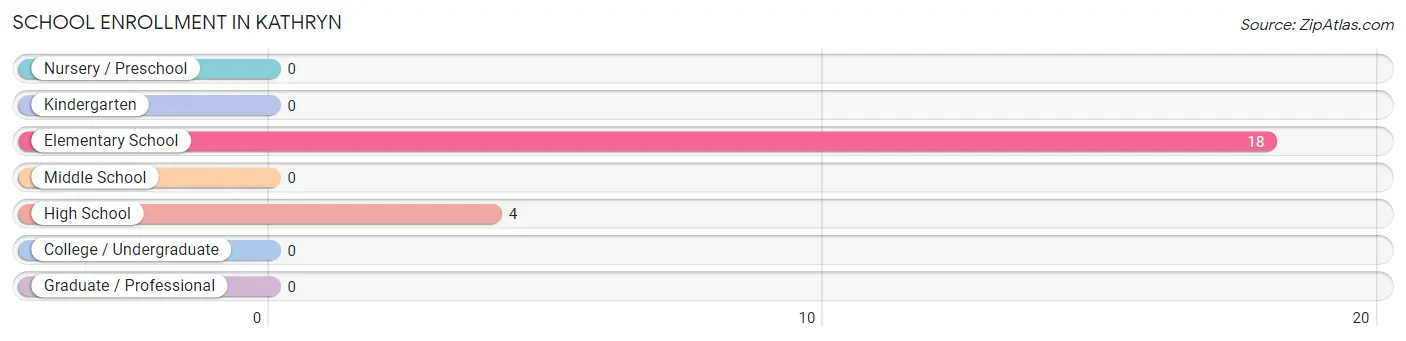
School Enrollment in Kathryn
The most common levels of schooling among the 22 students in Kathryn are elementary school (18 | 81.8%), and high school (4 | 18.2%).
| School Level | # Students | % Students |
| Nursery / Preschool | 0 | 0.0% |
| Kindergarten | 0 | 0.0% |
| Elementary School | 18 | 81.8% |
| Middle School | 0 | 0.0% |
| High School | 4 | 18.2% |
| College / Undergraduate | 0 | 0.0% |
| Graduate / Professional | 0 | 0.0% |
| Total | 22 | 100.0% |
School Enrollment by Age by Funding Source in Kathryn
Out of a total of 22 students who are enrolled in schools in Kathryn, 4 (18.2%) attend a private institution, while the remaining 18 (81.8%) are enrolled in public schools. The age group of 15 to 17 year olds has the highest likelihood of being enrolled in private schools, with 4 (100.0% in the age bracket) enrolled. Conversely, the age group of 5 to 9 year old has the lowest likelihood of being enrolled in a private school, with 12 (100.0% in the age bracket) attending a public institution.
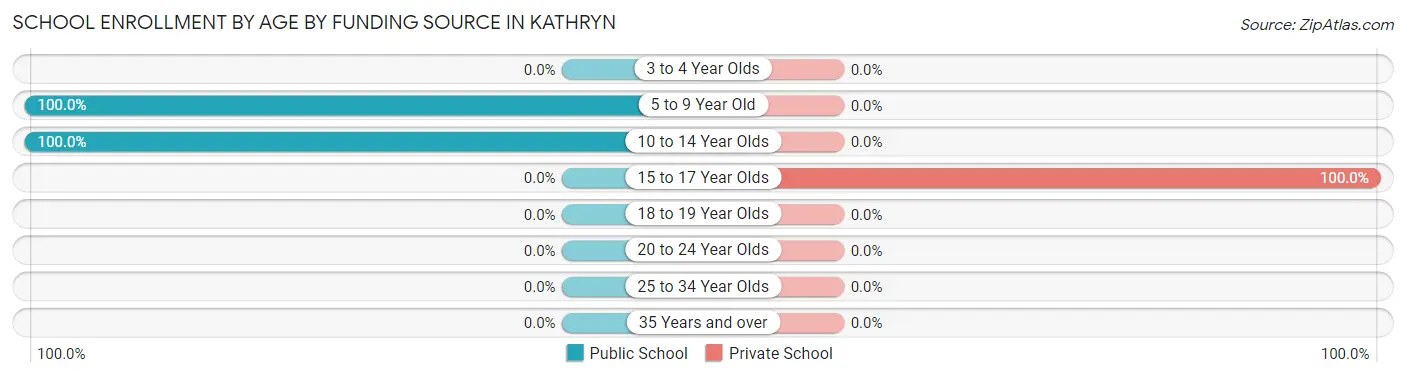
| Age Bracket | Public School | Private School |
| 3 to 4 Year Olds | 0 (0.0%) | 0 (0.0%) |
| 5 to 9 Year Old | 12 (100.0%) | 0 (0.0%) |
| 10 to 14 Year Olds | 6 (100.0%) | 0 (0.0%) |
| 15 to 17 Year Olds | 0 (0.0%) | 4 (100.0%) |
| 18 to 19 Year Olds | 0 (0.0%) | 0 (0.0%) |
| 20 to 24 Year Olds | 0 (0.0%) | 0 (0.0%) |
| 25 to 34 Year Olds | 0 (0.0%) | 0 (0.0%) |
| 35 Years and over | 0 (0.0%) | 0 (0.0%) |
| Total | 18 (81.8%) | 4 (18.2%) |
Educational Attainment by Field of Study in Kathryn
Multidisciplinary studies (11 | 37.9%), business (7 | 24.1%), psychology (4 | 13.8%), education (4 | 13.8%), and literature & languages (2 | 6.9%) are the most common fields of study among 29 individuals in Kathryn who have obtained a bachelor's degree or higher.
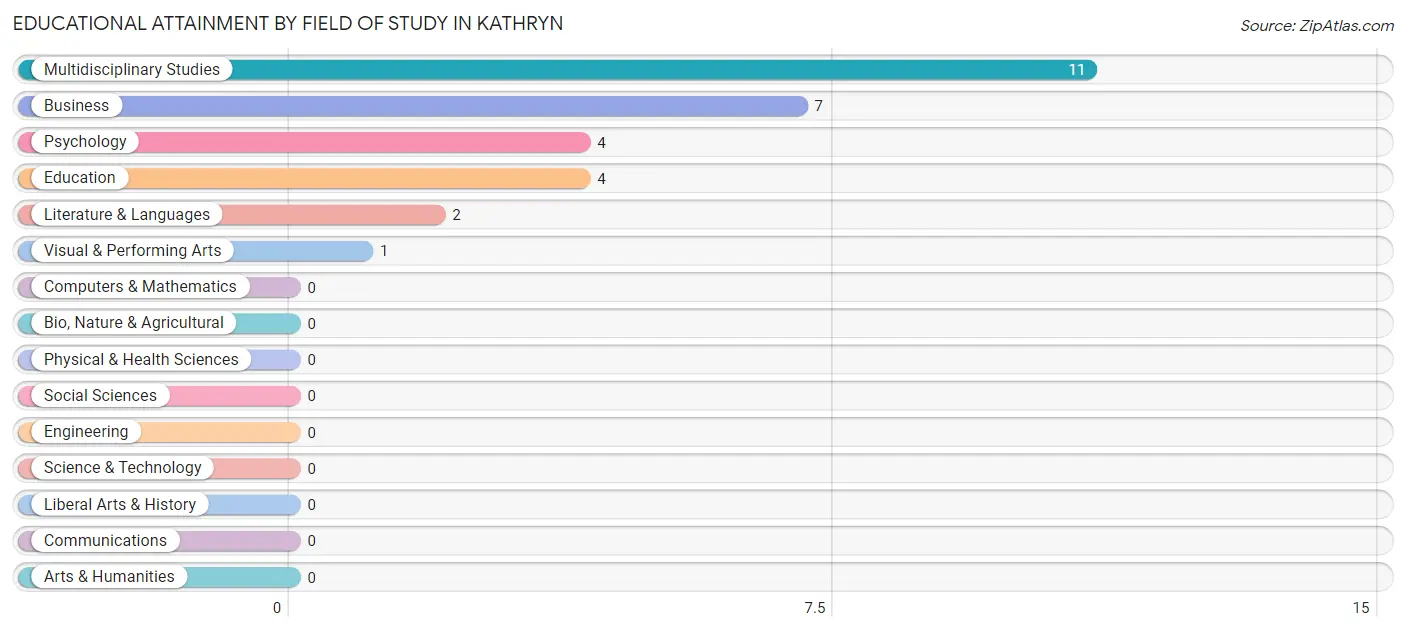
| Field of Study | # Graduates | % Graduates |
| Computers & Mathematics | 0 | 0.0% |
| Bio, Nature & Agricultural | 0 | 0.0% |
| Physical & Health Sciences | 0 | 0.0% |
| Psychology | 4 | 13.8% |
| Social Sciences | 0 | 0.0% |
| Engineering | 0 | 0.0% |
| Multidisciplinary Studies | 11 | 37.9% |
| Science & Technology | 0 | 0.0% |
| Business | 7 | 24.1% |
| Education | 4 | 13.8% |
| Literature & Languages | 2 | 6.9% |
| Liberal Arts & History | 0 | 0.0% |
| Visual & Performing Arts | 1 | 3.5% |
| Communications | 0 | 0.0% |
| Arts & Humanities | 0 | 0.0% |
| Total | 29 | 100.0% |
Transportation & Commute in Kathryn
Vehicle Availability by Sex in Kathryn
The most prevalent vehicle ownership categories in Kathryn are males with 2 vehicles (11, accounting for 64.7%) and females with 2 vehicles (2, making up 183.3%).
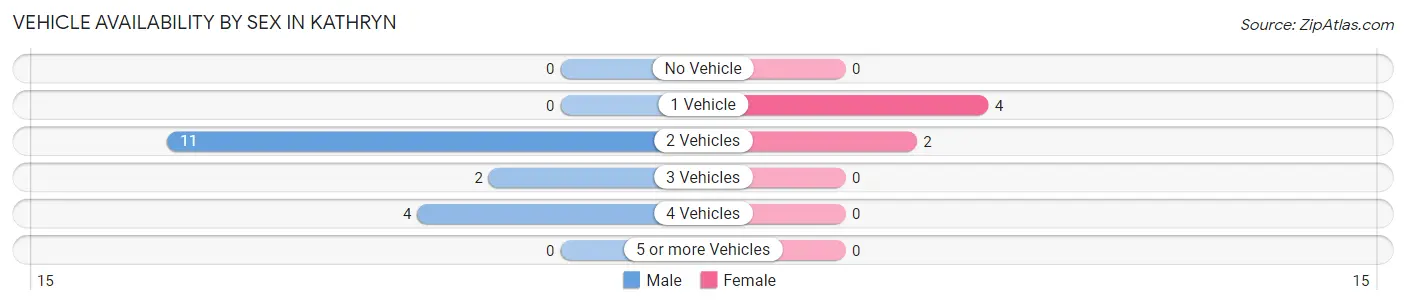
| Vehicles Available | Male | Female |
| No Vehicle | 0 (0.0%) | 0 (0.0%) |
| 1 Vehicle | 0 (0.0%) | 4 (66.7%) |
| 2 Vehicles | 11 (64.7%) | 2 (33.3%) |
| 3 Vehicles | 2 (11.8%) | 0 (0.0%) |
| 4 Vehicles | 4 (23.5%) | 0 (0.0%) |
| 5 or more Vehicles | 0 (0.0%) | 0 (0.0%) |
| Total | 17 (100.0%) | 6 (100.0%) |
Commute Time in Kathryn
The most frequently occuring commute durations in Kathryn are 25 to 29 minutes (8 commuters, 38.1%), 60 to 89 minutes (6 commuters, 28.6%), and 35 to 39 minutes (4 commuters, 19.1%).
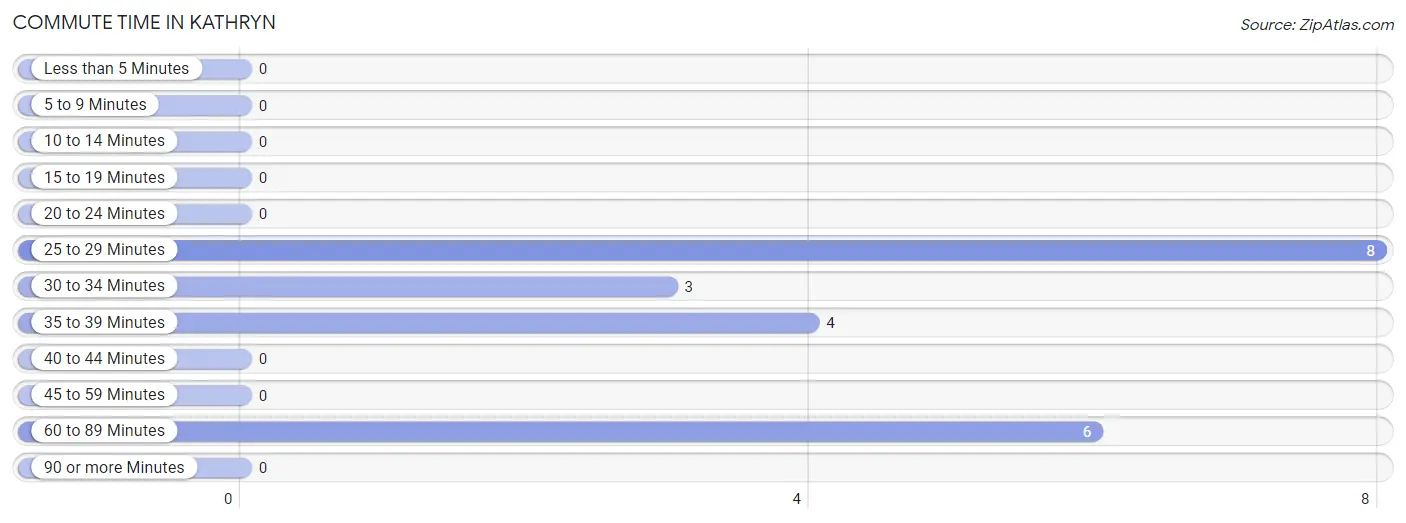
| Commute Time | # Commuters | % Commuters |
| Less than 5 Minutes | 0 | 0.0% |
| 5 to 9 Minutes | 0 | 0.0% |
| 10 to 14 Minutes | 0 | 0.0% |
| 15 to 19 Minutes | 0 | 0.0% |
| 20 to 24 Minutes | 0 | 0.0% |
| 25 to 29 Minutes | 8 | 38.1% |
| 30 to 34 Minutes | 3 | 14.3% |
| 35 to 39 Minutes | 4 | 19.1% |
| 40 to 44 Minutes | 0 | 0.0% |
| 45 to 59 Minutes | 0 | 0.0% |
| 60 to 89 Minutes | 6 | 28.6% |
| 90 or more Minutes | 0 | 0.0% |
Commute Time by Sex in Kathryn
The most common commute times in Kathryn are 25 to 29 minutes (7 commuters, 46.7%) for males and 35 to 39 minutes (4 commuters, 66.7%) for females.
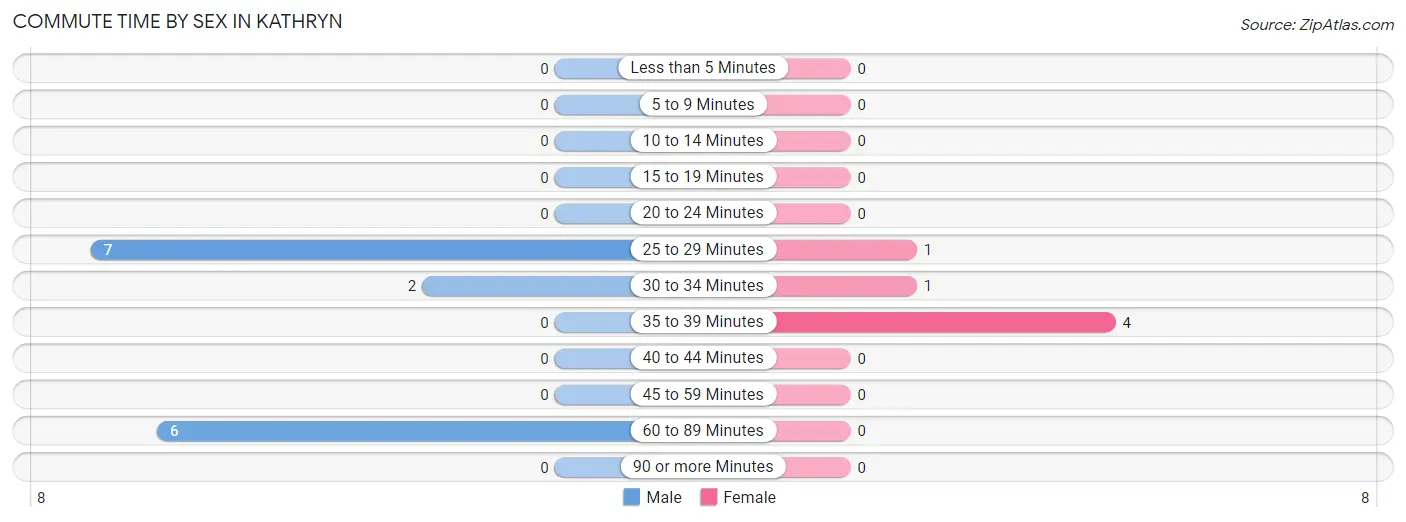
| Commute Time | Male | Female |
| Less than 5 Minutes | 0 (0.0%) | 0 (0.0%) |
| 5 to 9 Minutes | 0 (0.0%) | 0 (0.0%) |
| 10 to 14 Minutes | 0 (0.0%) | 0 (0.0%) |
| 15 to 19 Minutes | 0 (0.0%) | 0 (0.0%) |
| 20 to 24 Minutes | 0 (0.0%) | 0 (0.0%) |
| 25 to 29 Minutes | 7 (46.7%) | 1 (16.7%) |
| 30 to 34 Minutes | 2 (13.3%) | 1 (16.7%) |
| 35 to 39 Minutes | 0 (0.0%) | 4 (66.7%) |
| 40 to 44 Minutes | 0 (0.0%) | 0 (0.0%) |
| 45 to 59 Minutes | 0 (0.0%) | 0 (0.0%) |
| 60 to 89 Minutes | 6 (40.0%) | 0 (0.0%) |
| 90 or more Minutes | 0 (0.0%) | 0 (0.0%) |
Time of Departure to Work by Sex in Kathryn
The most frequent times of departure to work in Kathryn are 7:00 AM to 7:29 AM (11, 73.3%) for males and 12:00 PM to 3:59 PM (4, 66.7%) for females.
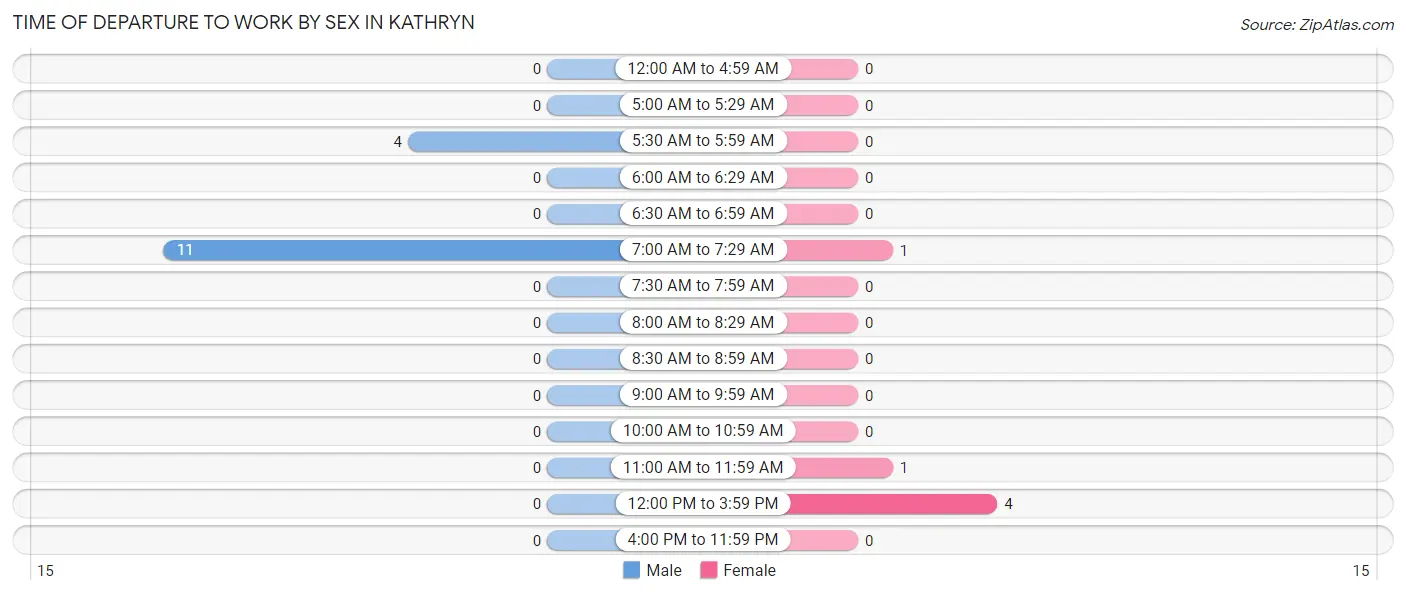
| Time of Departure | Male | Female |
| 12:00 AM to 4:59 AM | 0 (0.0%) | 0 (0.0%) |
| 5:00 AM to 5:29 AM | 0 (0.0%) | 0 (0.0%) |
| 5:30 AM to 5:59 AM | 4 (26.7%) | 0 (0.0%) |
| 6:00 AM to 6:29 AM | 0 (0.0%) | 0 (0.0%) |
| 6:30 AM to 6:59 AM | 0 (0.0%) | 0 (0.0%) |
| 7:00 AM to 7:29 AM | 11 (73.3%) | 1 (16.7%) |
| 7:30 AM to 7:59 AM | 0 (0.0%) | 0 (0.0%) |
| 8:00 AM to 8:29 AM | 0 (0.0%) | 0 (0.0%) |
| 8:30 AM to 8:59 AM | 0 (0.0%) | 0 (0.0%) |
| 9:00 AM to 9:59 AM | 0 (0.0%) | 0 (0.0%) |
| 10:00 AM to 10:59 AM | 0 (0.0%) | 0 (0.0%) |
| 11:00 AM to 11:59 AM | 0 (0.0%) | 1 (16.7%) |
| 12:00 PM to 3:59 PM | 0 (0.0%) | 4 (66.7%) |
| 4:00 PM to 11:59 PM | 0 (0.0%) | 0 (0.0%) |
| Total | 15 (100.0%) | 6 (100.0%) |
Housing Occupancy in Kathryn
Occupancy by Ownership in Kathryn
Of the total 36 dwellings in Kathryn, owner-occupied units account for 31 (86.1%), while renter-occupied units make up 5 (13.9%).
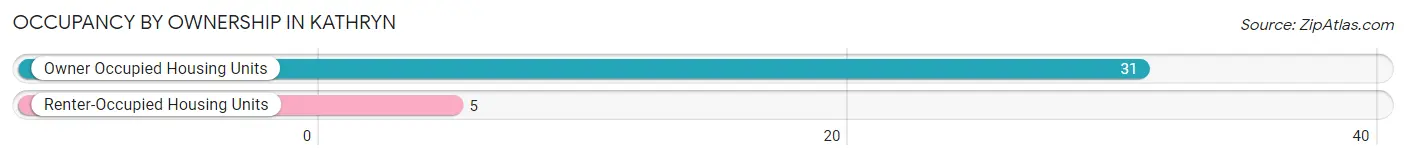
| Occupancy | # Housing Units | % Housing Units |
| Owner Occupied Housing Units | 31 | 86.1% |
| Renter-Occupied Housing Units | 5 | 13.9% |
| Total Occupied Housing Units | 36 | 100.0% |
Occupancy by Household Size in Kathryn
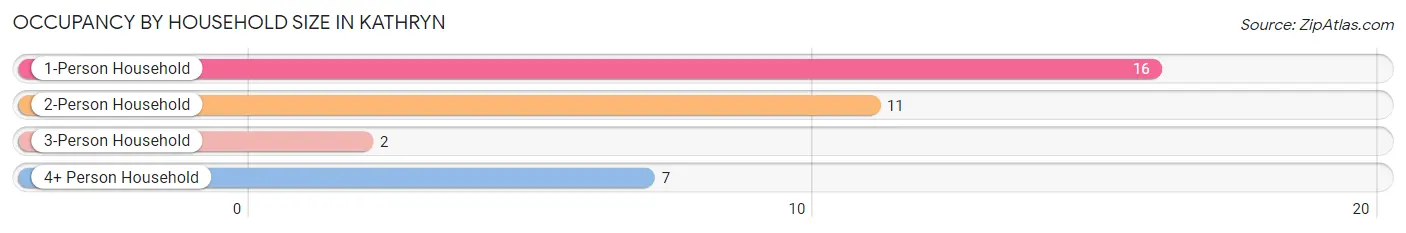
| Household Size | # Housing Units | % Housing Units |
| 1-Person Household | 16 | 44.4% |
| 2-Person Household | 11 | 30.6% |
| 3-Person Household | 2 | 5.6% |
| 4+ Person Household | 7 | 19.4% |
| Total Housing Units | 36 | 100.0% |
Occupancy by Ownership by Household Size in Kathryn
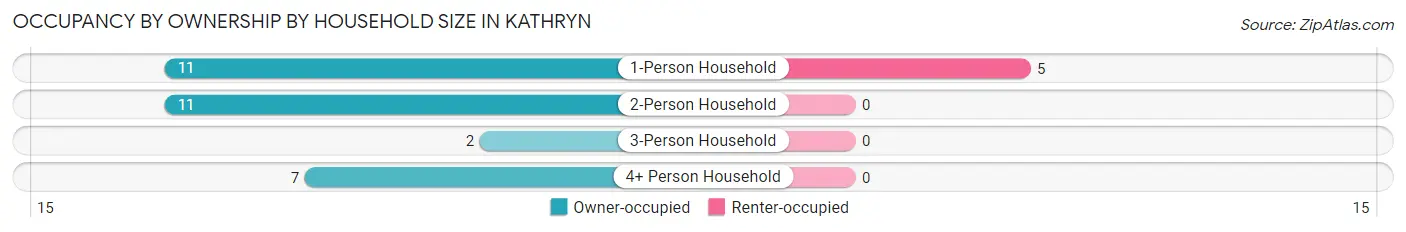
| Household Size | Owner-occupied | Renter-occupied |
| 1-Person Household | 11 (68.8%) | 5 (31.2%) |
| 2-Person Household | 11 (100.0%) | 0 (0.0%) |
| 3-Person Household | 2 (100.0%) | 0 (0.0%) |
| 4+ Person Household | 7 (100.0%) | 0 (0.0%) |
| Total Housing Units | 31 (86.1%) | 5 (13.9%) |
Occupancy by Educational Attainment in Kathryn
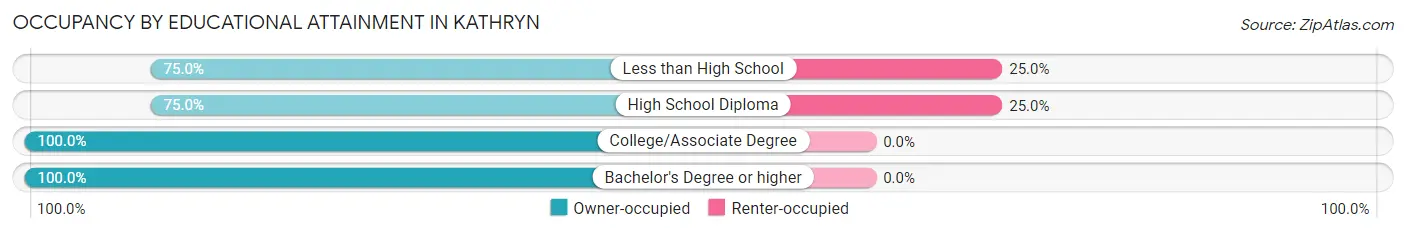
| Household Size | Owner-occupied | Renter-occupied |
| Less than High School | 3 (75.0%) | 1 (25.0%) |
| High School Diploma | 12 (75.0%) | 4 (25.0%) |
| College/Associate Degree | 3 (100.0%) | 0 (0.0%) |
| Bachelor's Degree or higher | 13 (100.0%) | 0 (0.0%) |
Occupancy by Age of Householder in Kathryn
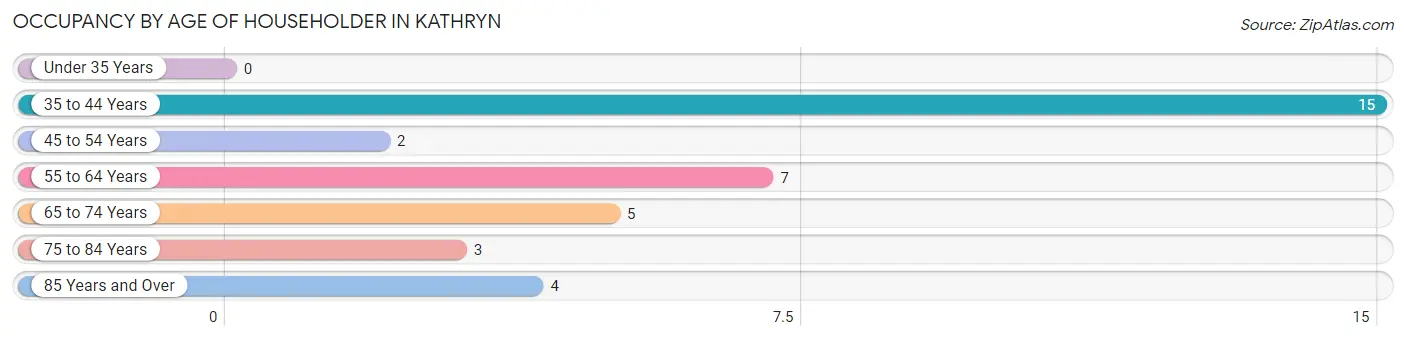
| Age Bracket | # Households | % Households |
| Under 35 Years | 0 | 0.0% |
| 35 to 44 Years | 15 | 41.7% |
| 45 to 54 Years | 2 | 5.6% |
| 55 to 64 Years | 7 | 19.4% |
| 65 to 74 Years | 5 | 13.9% |
| 75 to 84 Years | 3 | 8.3% |
| 85 Years and Over | 4 | 11.1% |
| Total | 36 | 100.0% |
Housing Finances in Kathryn
Median Income by Occupancy in Kathryn
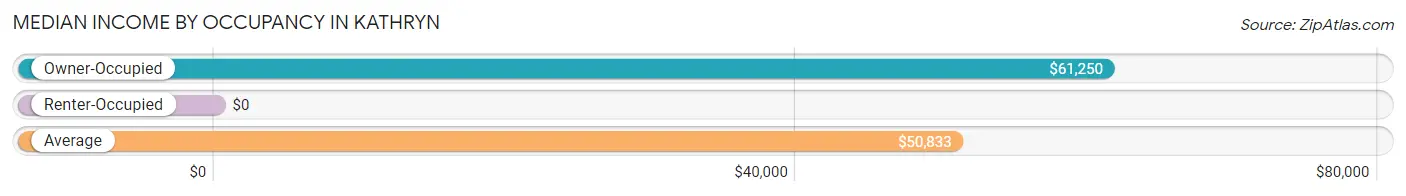
| Occupancy Type | # Households | Median Income |
| Owner-Occupied | 31 (86.1%) | $61,250 |
| Renter-Occupied | 5 (13.9%) | $0 |
| Average | 36 (100.0%) | $50,833 |
Occupancy by Householder Income Bracket in Kathryn
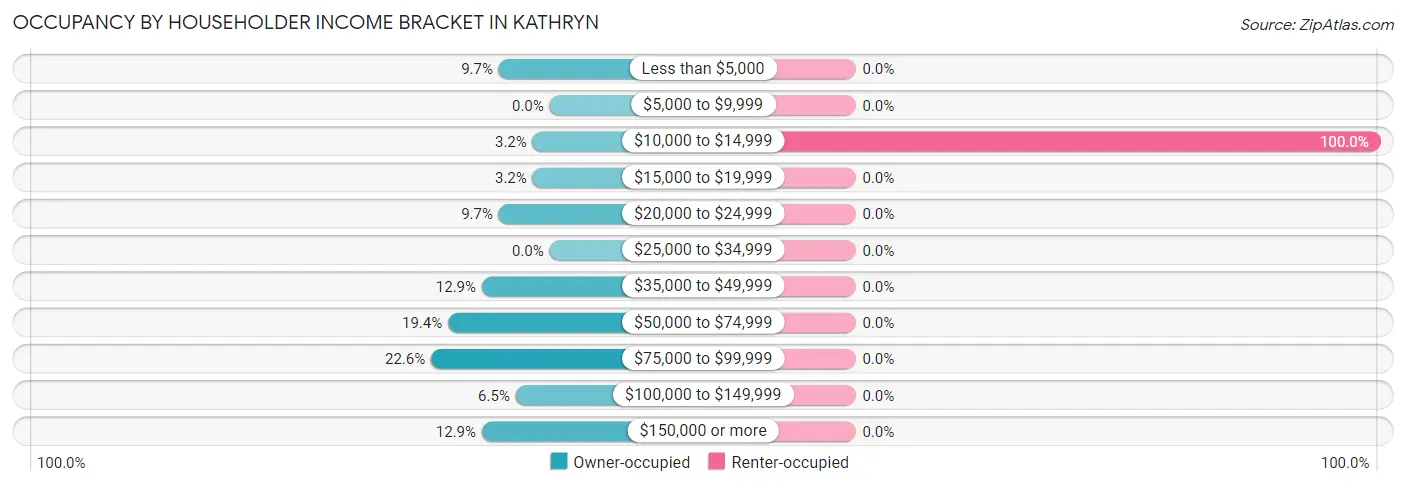
| Income Bracket | Owner-occupied | Renter-occupied |
| Less than $5,000 | 3 (9.7%) | 0 (0.0%) |
| $5,000 to $9,999 | 0 (0.0%) | 0 (0.0%) |
| $10,000 to $14,999 | 1 (3.2%) | 5 (100.0%) |
| $15,000 to $19,999 | 1 (3.2%) | 0 (0.0%) |
| $20,000 to $24,999 | 3 (9.7%) | 0 (0.0%) |
| $25,000 to $34,999 | 0 (0.0%) | 0 (0.0%) |
| $35,000 to $49,999 | 4 (12.9%) | 0 (0.0%) |
| $50,000 to $74,999 | 6 (19.4%) | 0 (0.0%) |
| $75,000 to $99,999 | 7 (22.6%) | 0 (0.0%) |
| $100,000 to $149,999 | 2 (6.5%) | 0 (0.0%) |
| $150,000 or more | 4 (12.9%) | 0 (0.0%) |
| Total | 31 (100.0%) | 5 (100.0%) |
Monthly Housing Cost Tiers in Kathryn
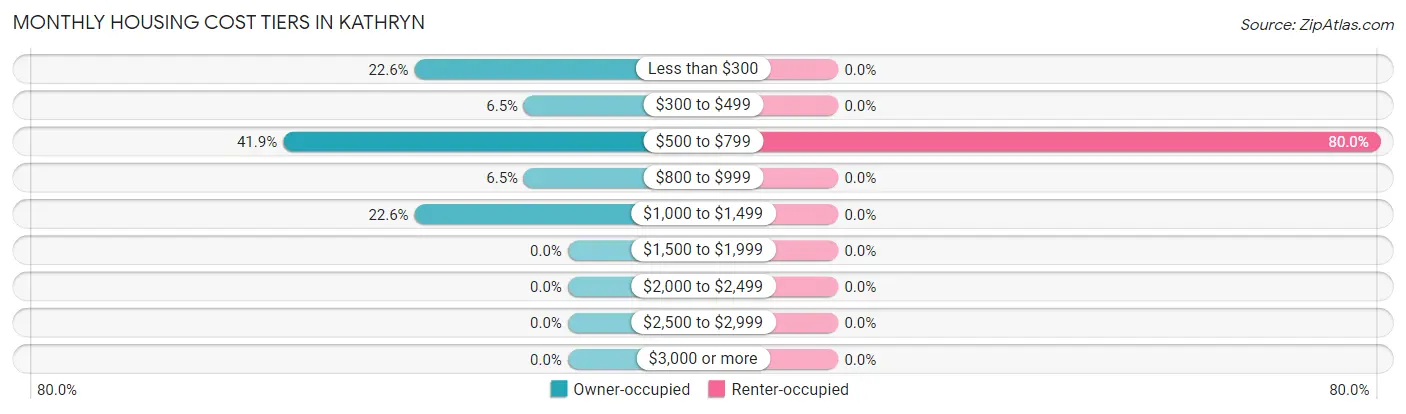
| Monthly Cost | Owner-occupied | Renter-occupied |
| Less than $300 | 7 (22.6%) | 0 (0.0%) |
| $300 to $499 | 2 (6.5%) | 0 (0.0%) |
| $500 to $799 | 13 (41.9%) | 4 (80.0%) |
| $800 to $999 | 2 (6.5%) | 0 (0.0%) |
| $1,000 to $1,499 | 7 (22.6%) | 0 (0.0%) |
| $1,500 to $1,999 | 0 (0.0%) | 0 (0.0%) |
| $2,000 to $2,499 | 0 (0.0%) | 0 (0.0%) |
| $2,500 to $2,999 | 0 (0.0%) | 0 (0.0%) |
| $3,000 or more | 0 (0.0%) | 0 (0.0%) |
| Total | 31 (100.0%) | 5 (100.0%) |
Physical Housing Characteristics in Kathryn
Housing Structures in Kathryn
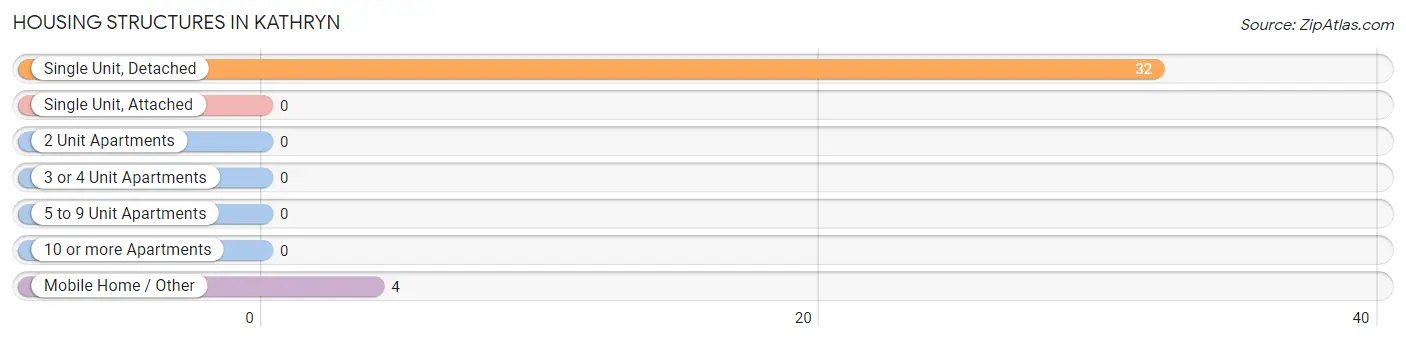
| Structure Type | # Housing Units | % Housing Units |
| Single Unit, Detached | 32 | 88.9% |
| Single Unit, Attached | 0 | 0.0% |
| 2 Unit Apartments | 0 | 0.0% |
| 3 or 4 Unit Apartments | 0 | 0.0% |
| 5 to 9 Unit Apartments | 0 | 0.0% |
| 10 or more Apartments | 0 | 0.0% |
| Mobile Home / Other | 4 | 11.1% |
| Total | 36 | 100.0% |
Housing Structures by Occupancy in Kathryn
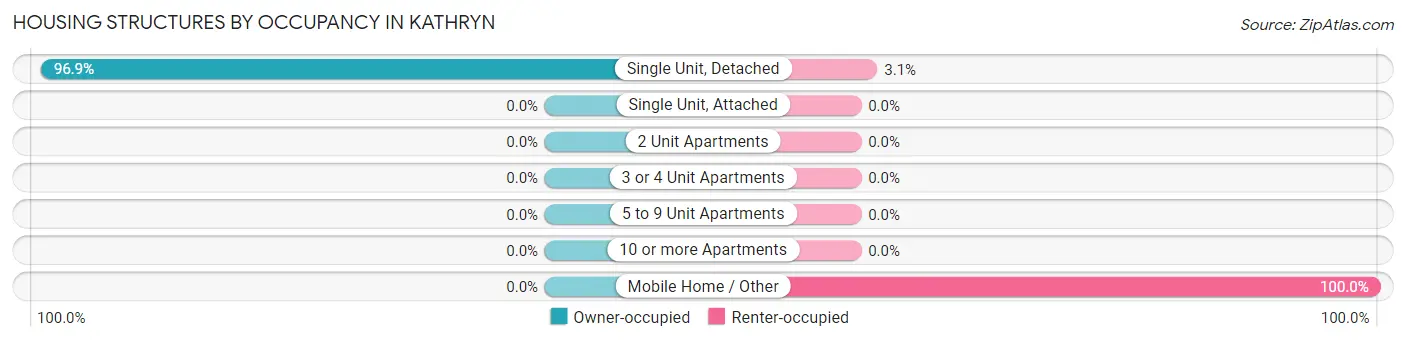
| Structure Type | Owner-occupied | Renter-occupied |
| Single Unit, Detached | 31 (96.9%) | 1 (3.1%) |
| Single Unit, Attached | 0 (0.0%) | 0 (0.0%) |
| 2 Unit Apartments | 0 (0.0%) | 0 (0.0%) |
| 3 or 4 Unit Apartments | 0 (0.0%) | 0 (0.0%) |
| 5 to 9 Unit Apartments | 0 (0.0%) | 0 (0.0%) |
| 10 or more Apartments | 0 (0.0%) | 0 (0.0%) |
| Mobile Home / Other | 0 (0.0%) | 4 (100.0%) |
| Total | 31 (86.1%) | 5 (13.9%) |
Housing Structures by Number of Rooms in Kathryn
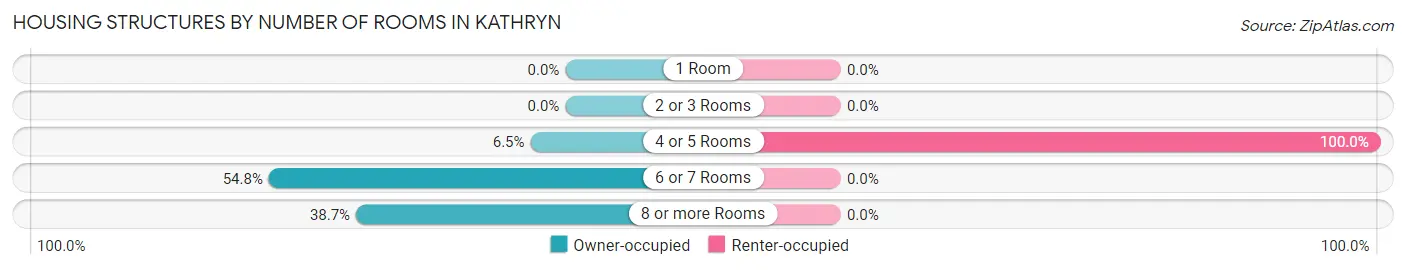
| Number of Rooms | Owner-occupied | Renter-occupied |
| 1 Room | 0 (0.0%) | 0 (0.0%) |
| 2 or 3 Rooms | 0 (0.0%) | 0 (0.0%) |
| 4 or 5 Rooms | 2 (6.5%) | 5 (100.0%) |
| 6 or 7 Rooms | 17 (54.8%) | 0 (0.0%) |
| 8 or more Rooms | 12 (38.7%) | 0 (0.0%) |
| Total | 31 (100.0%) | 5 (100.0%) |
Housing Structure by Heating Type in Kathryn
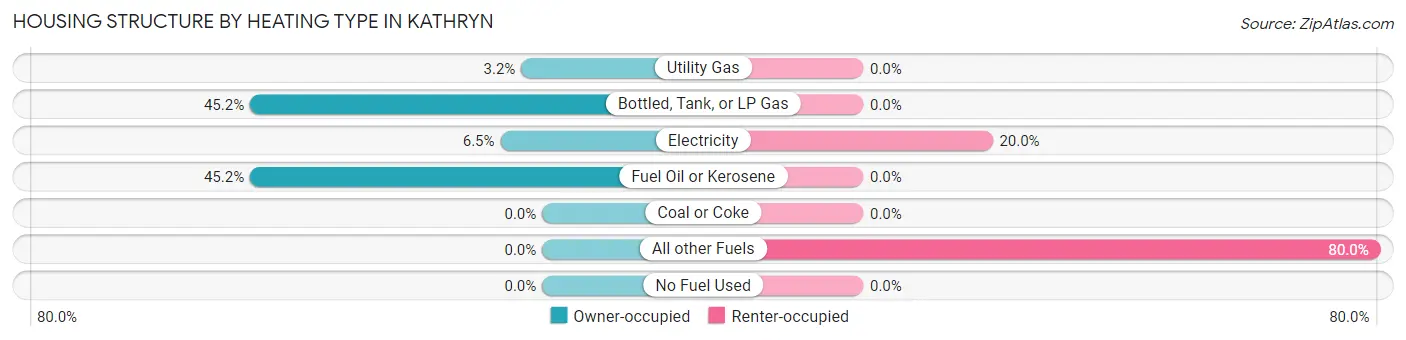
| Heating Type | Owner-occupied | Renter-occupied |
| Utility Gas | 1 (3.2%) | 0 (0.0%) |
| Bottled, Tank, or LP Gas | 14 (45.2%) | 0 (0.0%) |
| Electricity | 2 (6.5%) | 1 (20.0%) |
| Fuel Oil or Kerosene | 14 (45.2%) | 0 (0.0%) |
| Coal or Coke | 0 (0.0%) | 0 (0.0%) |
| All other Fuels | 0 (0.0%) | 4 (80.0%) |
| No Fuel Used | 0 (0.0%) | 0 (0.0%) |
| Total | 31 (100.0%) | 5 (100.0%) |
Household Vehicle Usage in Kathryn
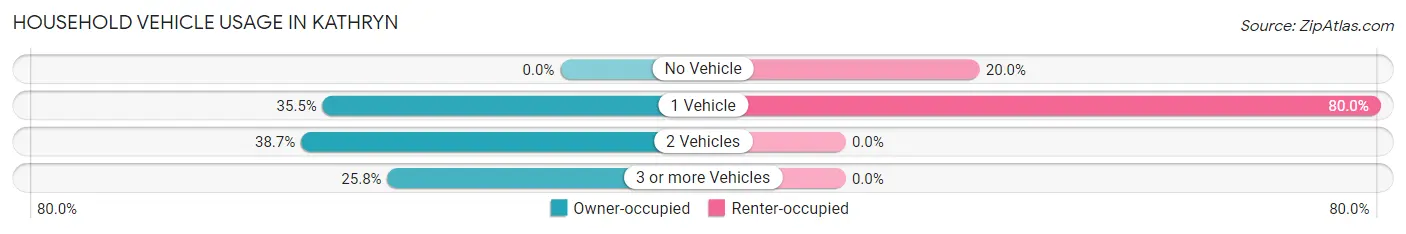
| Vehicles per Household | Owner-occupied | Renter-occupied |
| No Vehicle | 0 (0.0%) | 1 (20.0%) |
| 1 Vehicle | 11 (35.5%) | 4 (80.0%) |
| 2 Vehicles | 12 (38.7%) | 0 (0.0%) |
| 3 or more Vehicles | 8 (25.8%) | 0 (0.0%) |
| Total | 31 (100.0%) | 5 (100.0%) |
Real Estate & Mortgages in Kathryn
Real Estate and Mortgage Overview in Kathryn
| Characteristic | Without Mortgage | With Mortgage |
| Housing Units | 20 | 11 |
| Median Property Value | $84,200 | $0 |
| Median Household Income | - | - |
| Monthly Housing Costs | $650 | $0 |
| Real Estate Taxes | $536 | $0 |
Property Value by Mortgage Status in Kathryn
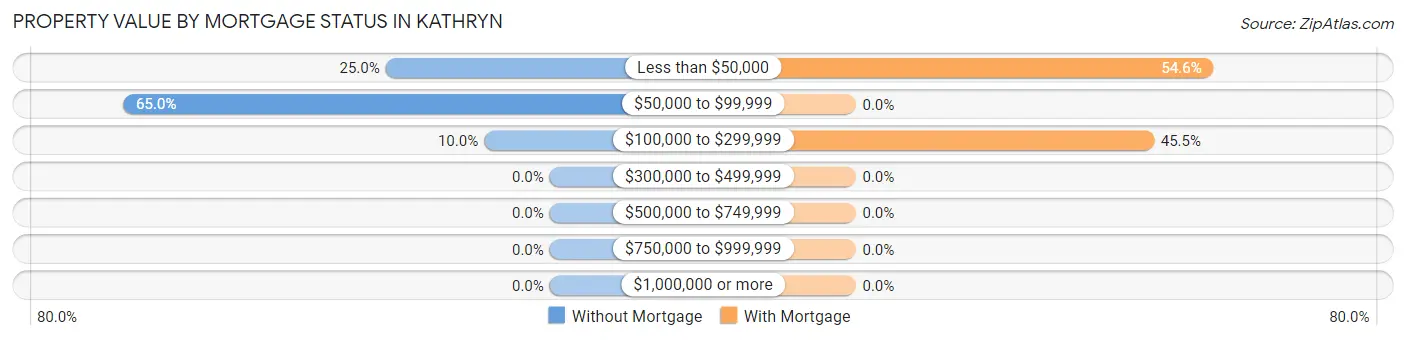
| Property Value | Without Mortgage | With Mortgage |
| Less than $50,000 | 5 (25.0%) | 6 (54.5%) |
| $50,000 to $99,999 | 13 (65.0%) | 0 (0.0%) |
| $100,000 to $299,999 | 2 (10.0%) | 5 (45.5%) |
| $300,000 to $499,999 | 0 (0.0%) | 0 (0.0%) |
| $500,000 to $749,999 | 0 (0.0%) | 0 (0.0%) |
| $750,000 to $999,999 | 0 (0.0%) | 0 (0.0%) |
| $1,000,000 or more | 0 (0.0%) | 0 (0.0%) |
| Total | 20 (100.0%) | 11 (100.0%) |
Household Income by Mortgage Status in Kathryn
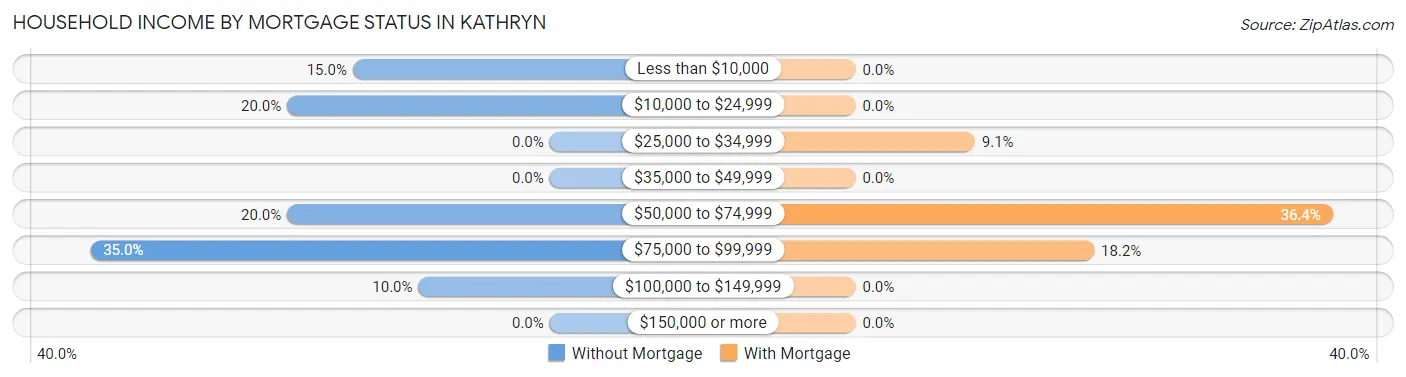
| Household Income | Without Mortgage | With Mortgage |
| Less than $10,000 | 3 (15.0%) | 0 (0.0%) |
| $10,000 to $24,999 | 4 (20.0%) | 0 (0.0%) |
| $25,000 to $34,999 | 0 (0.0%) | 1 (9.1%) |
| $35,000 to $49,999 | 0 (0.0%) | 0 (0.0%) |
| $50,000 to $74,999 | 4 (20.0%) | 4 (36.4%) |
| $75,000 to $99,999 | 7 (35.0%) | 2 (18.2%) |
| $100,000 to $149,999 | 2 (10.0%) | 0 (0.0%) |
| $150,000 or more | 0 (0.0%) | 0 (0.0%) |
| Total | 20 (100.0%) | 11 (100.0%) |
Property Value to Household Income Ratio in Kathryn
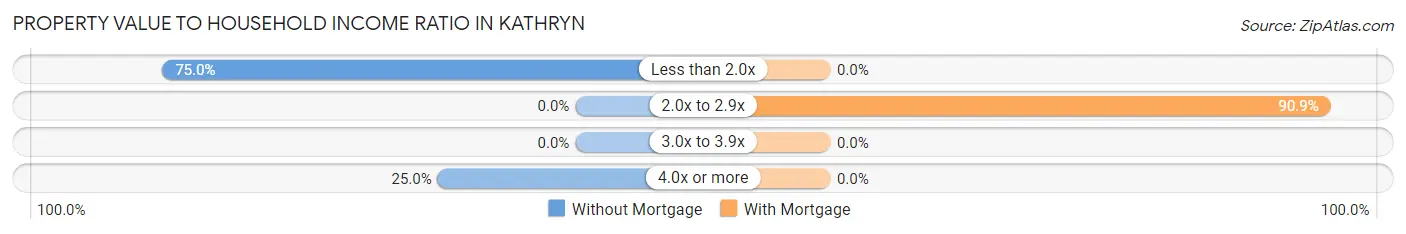
| Value-to-Income Ratio | Without Mortgage | With Mortgage |
| Less than 2.0x | 15 (75.0%) | 0 (0.0%) |
| 2.0x to 2.9x | 0 (0.0%) | 10 (90.9%) |
| 3.0x to 3.9x | 0 (0.0%) | 0 (0.0%) |
| 4.0x or more | 5 (25.0%) | 0 (0.0%) |
| Total | 20 (100.0%) | 11 (100.0%) |
Real Estate Taxes by Mortgage Status in Kathryn
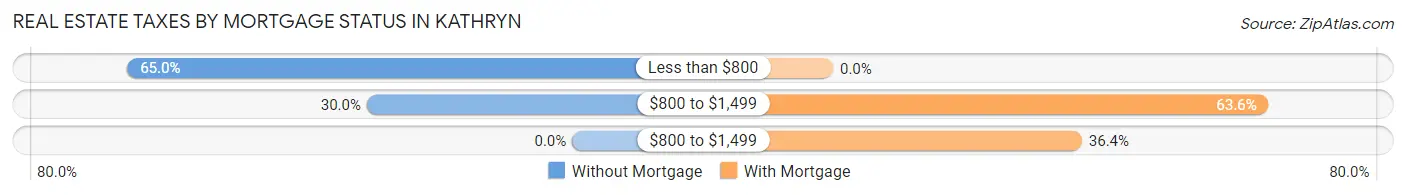
| Property Taxes | Without Mortgage | With Mortgage |
| Less than $800 | 13 (65.0%) | 0 (0.0%) |
| $800 to $1,499 | 6 (30.0%) | 7 (63.6%) |
| $800 to $1,499 | 0 (0.0%) | 4 (36.4%) |
| Total | 20 (100.0%) | 11 (100.0%) |
Health & Disability in Kathryn
Health Insurance Coverage by Age in Kathryn
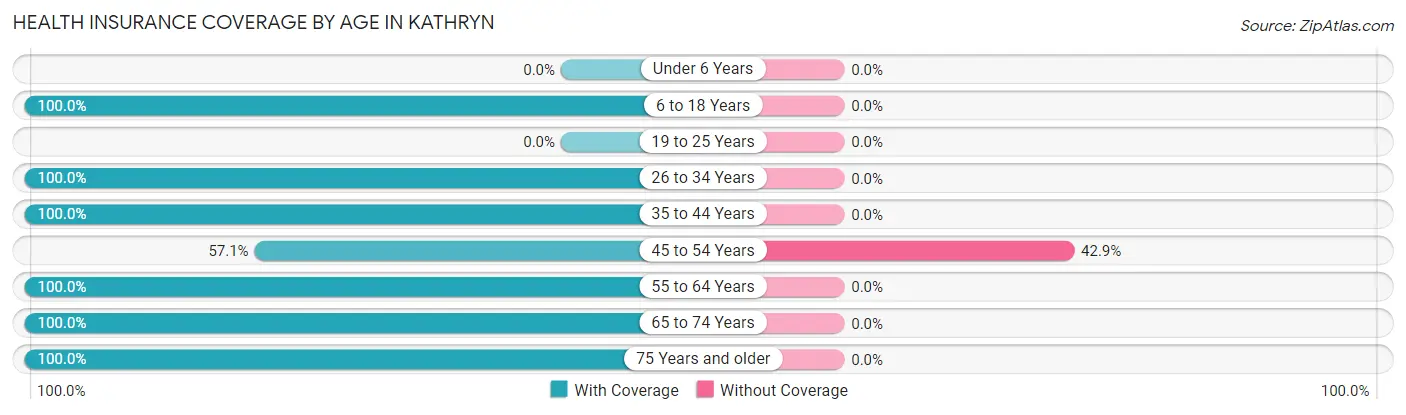
| Age Bracket | With Coverage | Without Coverage |
| Under 6 Years | 0 (0.0%) | 0 (0.0%) |
| 6 to 18 Years | 22 (100.0%) | 0 (0.0%) |
| 19 to 25 Years | 0 (0.0%) | 0 (0.0%) |
| 26 to 34 Years | 1 (100.0%) | 0 (0.0%) |
| 35 to 44 Years | 26 (100.0%) | 0 (0.0%) |
| 45 to 54 Years | 4 (57.1%) | 3 (42.9%) |
| 55 to 64 Years | 11 (100.0%) | 0 (0.0%) |
| 65 to 74 Years | 7 (100.0%) | 0 (0.0%) |
| 75 Years and older | 8 (100.0%) | 0 (0.0%) |
| Total | 79 (96.3%) | 3 (3.7%) |
Health Insurance Coverage by Citizenship Status in Kathryn
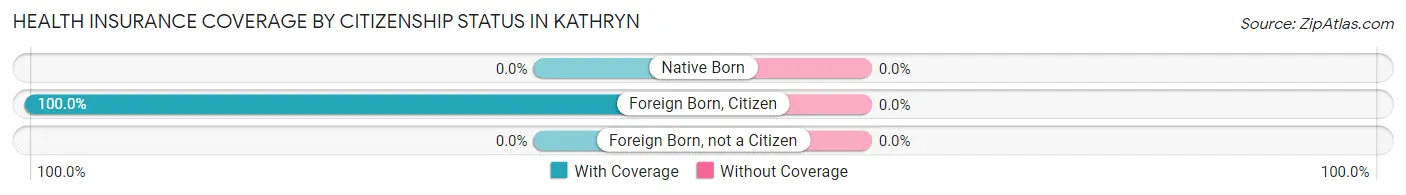
| Citizenship Status | With Coverage | Without Coverage |
| Native Born | 0 (0.0%) | 0 (0.0%) |
| Foreign Born, Citizen | 22 (100.0%) | 0 (0.0%) |
| Foreign Born, not a Citizen | 0 (0.0%) | 0 (0.0%) |
Health Insurance Coverage by Household Income in Kathryn
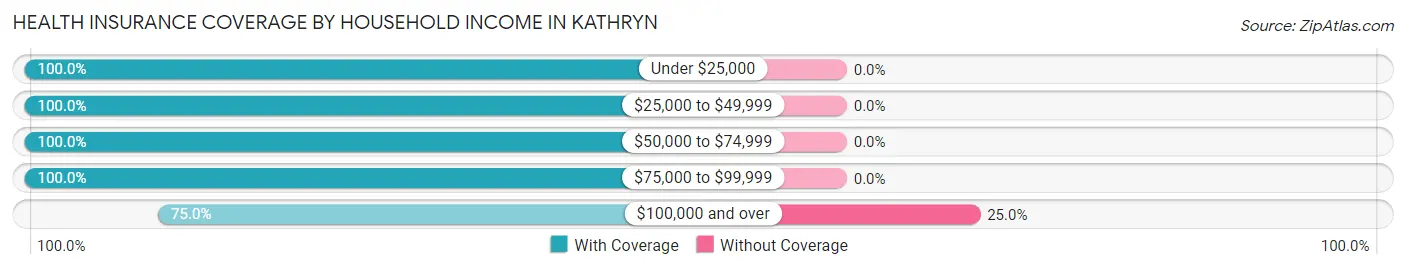
| Household Income | With Coverage | Without Coverage |
| Under $25,000 | 14 (100.0%) | 0 (0.0%) |
| $25,000 to $49,999 | 4 (100.0%) | 0 (0.0%) |
| $50,000 to $74,999 | 12 (100.0%) | 0 (0.0%) |
| $75,000 to $99,999 | 40 (100.0%) | 0 (0.0%) |
| $100,000 and over | 9 (75.0%) | 3 (25.0%) |
Public vs Private Health Insurance Coverage by Age in Kathryn
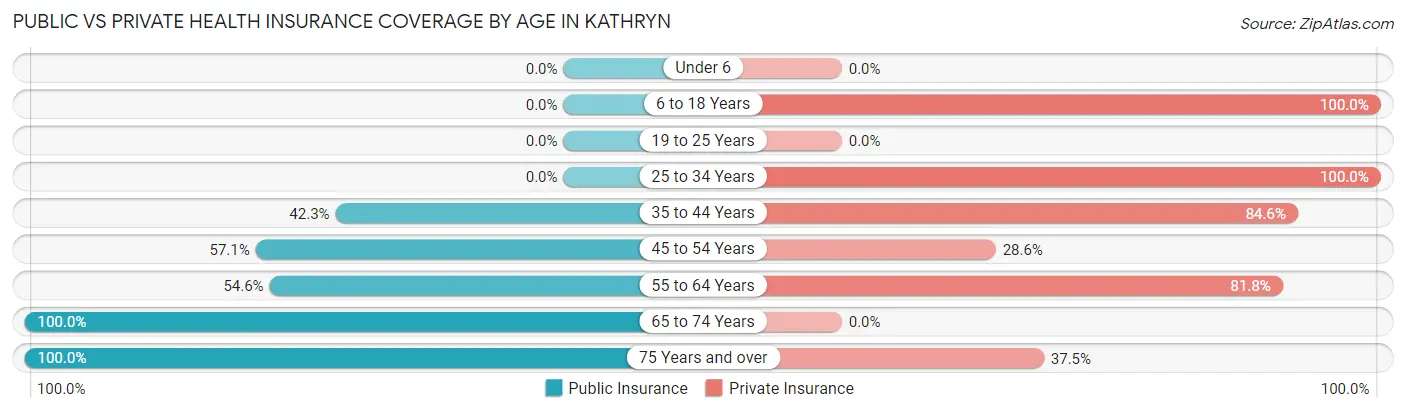
| Age Bracket | Public Insurance | Private Insurance |
| Under 6 | 0 (0.0%) | 0 (0.0%) |
| 6 to 18 Years | 0 (0.0%) | 22 (100.0%) |
| 19 to 25 Years | 0 (0.0%) | 0 (0.0%) |
| 25 to 34 Years | 0 (0.0%) | 1 (100.0%) |
| 35 to 44 Years | 11 (42.3%) | 22 (84.6%) |
| 45 to 54 Years | 4 (57.1%) | 2 (28.6%) |
| 55 to 64 Years | 6 (54.5%) | 9 (81.8%) |
| 65 to 74 Years | 7 (100.0%) | 0 (0.0%) |
| 75 Years and over | 8 (100.0%) | 3 (37.5%) |
| Total | 36 (43.9%) | 59 (72.0%) |
Disability Status by Sex by Age in Kathryn
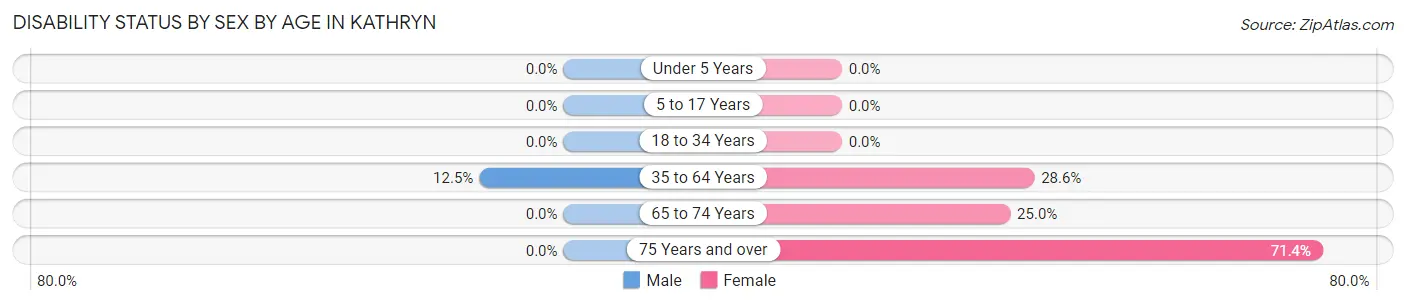
| Age Bracket | Male | Female |
| Under 5 Years | 0 (0.0%) | 0 (0.0%) |
| 5 to 17 Years | 0 (0.0%) | 0 (0.0%) |
| 18 to 34 Years | 0 (0.0%) | 0 (0.0%) |
| 35 to 64 Years | 2 (12.5%) | 8 (28.6%) |
| 65 to 74 Years | 0 (0.0%) | 1 (25.0%) |
| 75 Years and over | 0 (0.0%) | 5 (71.4%) |
Disability Class by Sex by Age in Kathryn
Disability Class: Hearing Difficulty
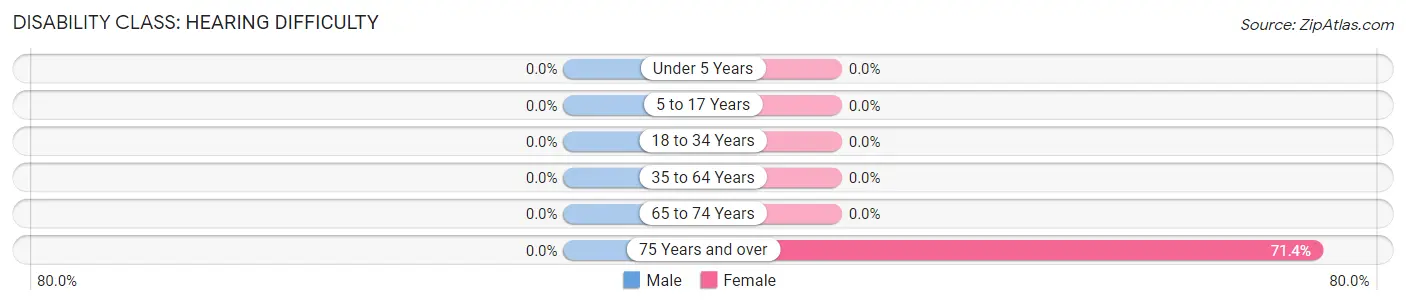
| Age Bracket | Male | Female |
| Under 5 Years | 0 (0.0%) | 0 (0.0%) |
| 5 to 17 Years | 0 (0.0%) | 0 (0.0%) |
| 18 to 34 Years | 0 (0.0%) | 0 (0.0%) |
| 35 to 64 Years | 0 (0.0%) | 0 (0.0%) |
| 65 to 74 Years | 0 (0.0%) | 0 (0.0%) |
| 75 Years and over | 0 (0.0%) | 5 (71.4%) |
Disability Class: Vision Difficulty
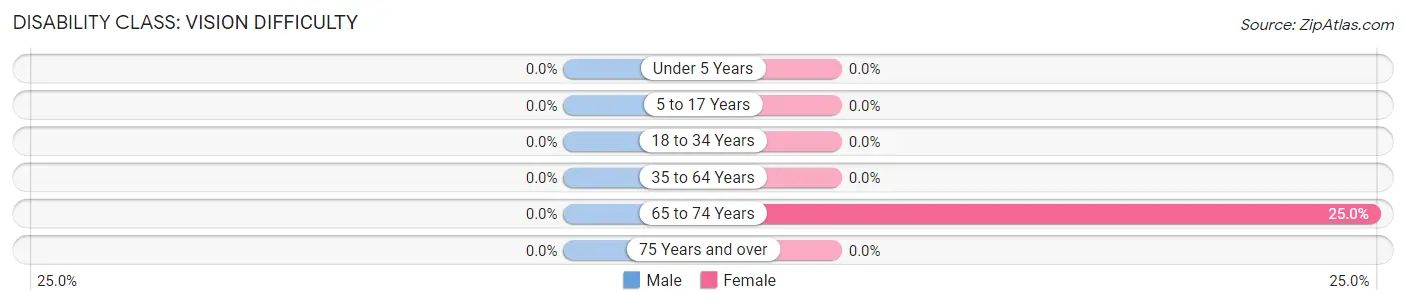
| Age Bracket | Male | Female |
| Under 5 Years | 0 (0.0%) | 0 (0.0%) |
| 5 to 17 Years | 0 (0.0%) | 0 (0.0%) |
| 18 to 34 Years | 0 (0.0%) | 0 (0.0%) |
| 35 to 64 Years | 0 (0.0%) | 0 (0.0%) |
| 65 to 74 Years | 0 (0.0%) | 1 (25.0%) |
| 75 Years and over | 0 (0.0%) | 0 (0.0%) |
Disability Class: Cognitive Difficulty
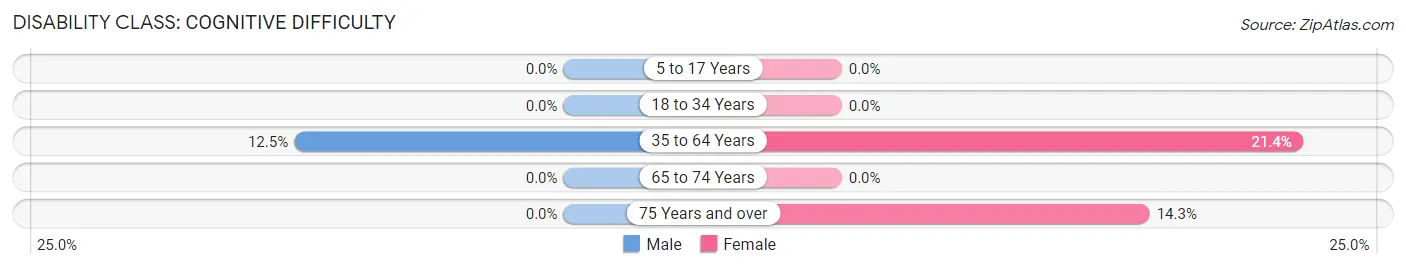
| Age Bracket | Male | Female |
| 5 to 17 Years | 0 (0.0%) | 0 (0.0%) |
| 18 to 34 Years | 0 (0.0%) | 0 (0.0%) |
| 35 to 64 Years | 2 (12.5%) | 6 (21.4%) |
| 65 to 74 Years | 0 (0.0%) | 0 (0.0%) |
| 75 Years and over | 0 (0.0%) | 1 (14.3%) |
Disability Class: Ambulatory Difficulty
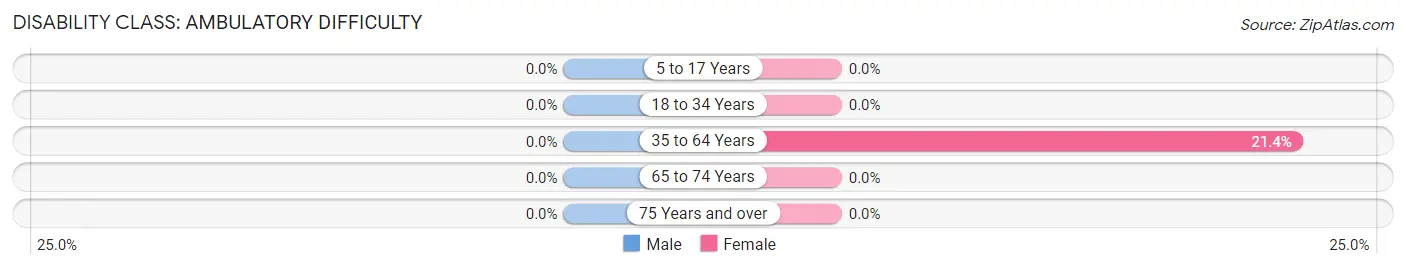
| Age Bracket | Male | Female |
| 5 to 17 Years | 0 (0.0%) | 0 (0.0%) |
| 18 to 34 Years | 0 (0.0%) | 0 (0.0%) |
| 35 to 64 Years | 0 (0.0%) | 6 (21.4%) |
| 65 to 74 Years | 0 (0.0%) | 0 (0.0%) |
| 75 Years and over | 0 (0.0%) | 0 (0.0%) |
Disability Class: Self-Care Difficulty
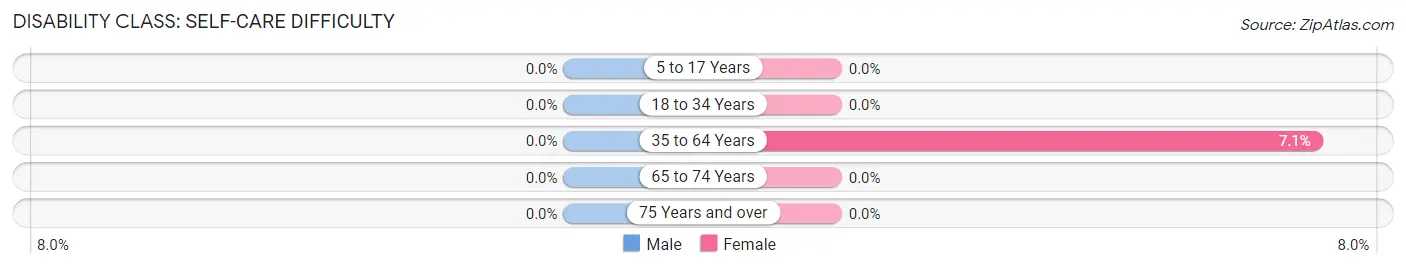
| Age Bracket | Male | Female |
| 5 to 17 Years | 0 (0.0%) | 0 (0.0%) |
| 18 to 34 Years | 0 (0.0%) | 0 (0.0%) |
| 35 to 64 Years | 0 (0.0%) | 2 (7.1%) |
| 65 to 74 Years | 0 (0.0%) | 0 (0.0%) |
| 75 Years and over | 0 (0.0%) | 0 (0.0%) |
Technology Access in Kathryn
Computing Device Access in Kathryn
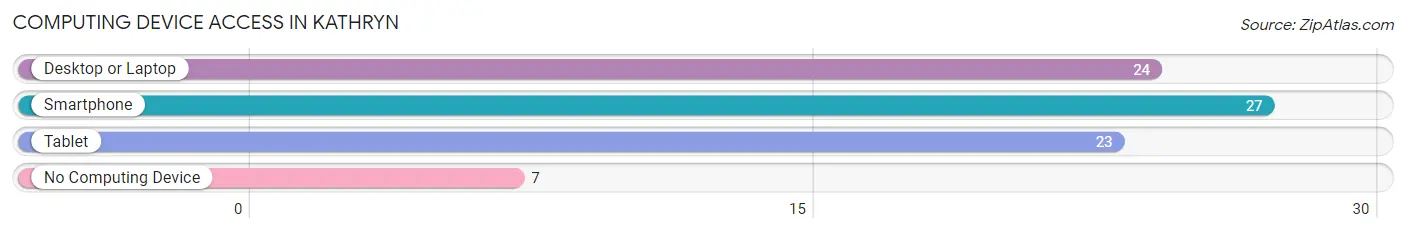
| Device Type | # Households | % Households |
| Desktop or Laptop | 24 | 66.7% |
| Smartphone | 27 | 75.0% |
| Tablet | 23 | 63.9% |
| No Computing Device | 7 | 19.4% |
| Total | 36 | 100.0% |
Internet Access in Kathryn
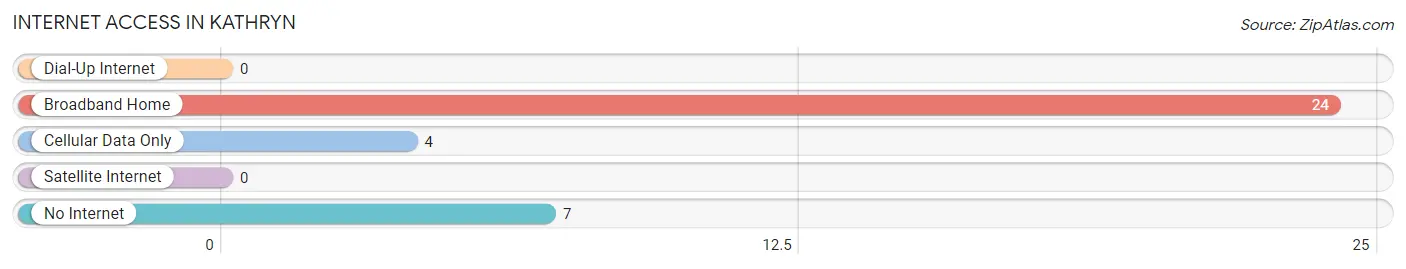
| Internet Type | # Households | % Households |
| Dial-Up Internet | 0 | 0.0% |
| Broadband Home | 24 | 66.7% |
| Cellular Data Only | 4 | 11.1% |
| Satellite Internet | 0 | 0.0% |
| No Internet | 7 | 19.4% |
| Total | 36 | 100.0% |
Kathryn Summary
History
North Dakota is a state located in the Midwestern and Great Plains regions of the United States. It is the 19th largest state by area, and the 4th least populous state. North Dakota was admitted to the Union on November 2, 1889, as the 39th state.
The area that is now North Dakota has been inhabited for thousands of years by various Native American tribes. The first Europeans to explore the area were French fur traders, who arrived in the late 17th century. The area was part of the Louisiana Purchase in 1803, and was part of the Dakota Territory until 1889, when it became a state.
During the late 19th century, North Dakota experienced a period of rapid growth and development. The state was a major producer of wheat, and the development of railroads and other infrastructure helped to spur economic growth. The state also experienced a period of political turmoil, as the Populist Party and other progressive movements sought to reform the state’s political and economic systems.
In the early 20th century, North Dakota experienced a period of economic decline. The state’s agricultural economy was hit hard by the Great Depression, and the Dust Bowl of the 1930s caused further economic hardship. The state’s economy began to recover in the 1940s, and the state experienced a period of growth and prosperity in the 1950s and 1960s.
Geography
North Dakota is located in the Midwestern and Great Plains regions of the United States. It is bordered by Minnesota to the east, South Dakota to the south, Montana to the west, and the Canadian provinces of Saskatchewan and Manitoba to the north.
The state has a total area of 70,700 square miles, making it the 19th largest state in the country. North Dakota is mostly flat, with rolling hills in the east and west. The state is divided into three distinct geographic regions: the Red River Valley in the east, the Missouri Plateau in the west, and the Great Plains in the center.
The Red River Valley is a flat, fertile region that is home to the state’s largest cities, including Fargo and Grand Forks. The Missouri Plateau is a rugged, hilly region that is home to the state’s highest point, White Butte, which stands at 3,506 feet. The Great Plains is a vast, flat region that is home to the state’s largest lake, Lake Sakakawea.
Economy
North Dakota’s economy is largely based on agriculture and energy production. The state is a major producer of wheat, barley, oats, and other grains. It is also a major producer of oil, natural gas, and coal.
The state’s agricultural sector is supported by a variety of government programs, including the Conservation Reserve Program, which pays farmers to set aside land for conservation purposes. The state also has a thriving tourism industry, with visitors drawn to its natural beauty and outdoor recreation opportunities.
North Dakota’s economy has experienced steady growth in recent years, with the state’s gross domestic product increasing by an average of 3.2% annually from 2010 to 2018. The state’s unemployment rate has also remained low, at 2.9% in 2018.
Demographics
As of 2019, North Dakota had an estimated population of 762,062, making it the 4th least populous state in the country. The state’s population is largely concentrated in the eastern part of the state, with the largest cities being Fargo and Grand Forks.
The state’s population is predominantly white, with 87.3% of the population identifying as white. The state also has a significant Native American population, with 5.3% of the population identifying as Native American. Other racial and ethnic groups make up the remaining 7.4% of the population.
The state’s median household income is $58,906, and the poverty rate is 11.2%. The state’s largest industries are agriculture, energy production, and tourism. The state’s largest employers are the state government, the University of North Dakota, and Sanford Health.
Common Questions
What is Per Capita Income in Kathryn?
Per Capita income in Kathryn is $28,349.
What is the Median Family Income in Kathryn?
Median Family Income in Kathryn is $96,071.
What is the Median Household income in Kathryn?
Median Household Income in Kathryn is $50,833.
What is Income or Wage Gap in Kathryn?
Income or Wage Gap in Kathryn is 75.1%.
Women in Kathryn earn 24.9 cents for every dollar earned by a man.
What is Inequality or Gini Index in Kathryn?
Inequality or Gini Index in Kathryn is 0.47.
What is the Total Population of Kathryn?
Total Population of Kathryn is 82.
What is the Total Male Population of Kathryn?
Total Male Population of Kathryn is 32.
What is the Total Female Population of Kathryn?
Total Female Population of Kathryn is 50.
What is the Ratio of Males per 100 Females in Kathryn?
There are 64.00 Males per 100 Females in Kathryn.
What is the Ratio of Females per 100 Males in Kathryn?
There are 156.25 Females per 100 Males in Kathryn.
What is the Median Population Age in Kathryn?
Median Population Age in Kathryn is 43.0 Years.
What is the Average Family Size in Kathryn
Average Family Size in Kathryn is 4.2 People.
What is the Average Household Size in Kathryn
Average Household Size in Kathryn is 2.3 People.
How Large is the Labor Force in Kathryn?
There are 23 People in the Labor Forcein in Kathryn.
What is the Percentage of People in the Labor Force in Kathryn?
35.9% of People are in the Labor Force in Kathryn.