Edmore, ND Map & Demographics
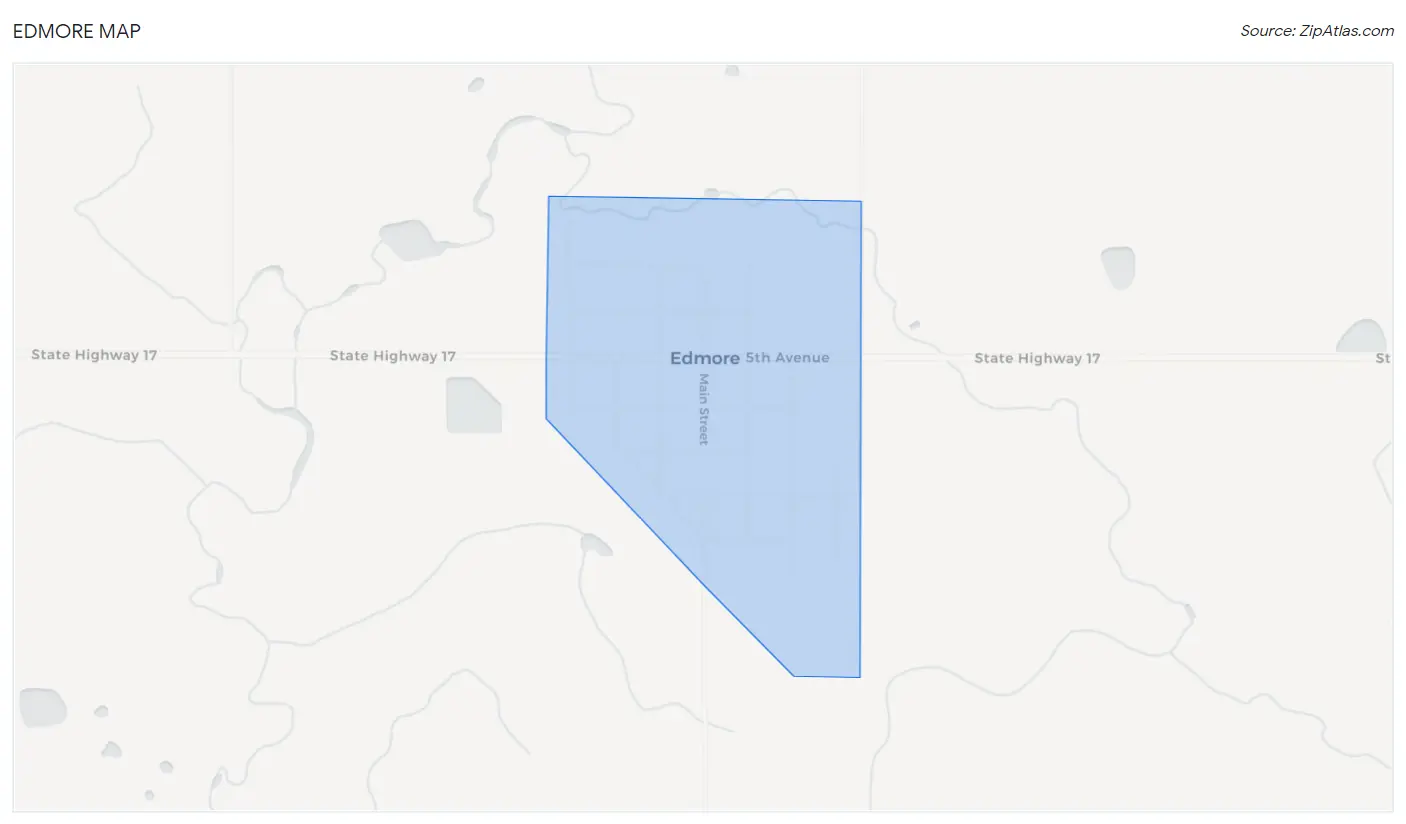
Edmore Map
Edmore Overview
$34,965
PER CAPITA INCOME
$71,667
AVG FAMILY INCOME
$65,291
AVG HOUSEHOLD INCOME
8.6%
WAGE / INCOME GAP [ % ]
91.4¢/ $1
WAGE / INCOME GAP [ $ ]
0.34
INEQUALITY / GINI INDEX
296
TOTAL POPULATION
153
MALE POPULATION
143
FEMALE POPULATION
106.99
MALES / 100 FEMALES
93.46
FEMALES / 100 MALES
72.2
MEDIAN AGE
2.9
AVG FAMILY SIZE
1.4
AVG HOUSEHOLD SIZE
153
LABOR FORCE [ PEOPLE ]
54.1%
PERCENT IN LABOR FORCE
0.7%
UNEMPLOYMENT RATE
Edmore Zip Codes
Edmore Area Codes
Income in Edmore
Income Overview in Edmore
Per Capita Income in Edmore is $34,965, while median incomes of families and households are $71,667 and $65,291 respectively.
| Characteristic | Number | Measure |
| Per Capita Income | 296 | $34,965 |
| Median Family Income | 34 | $71,667 |
| Mean Family Income | 34 | $72,691 |
| Median Household Income | 197 | $65,291 |
| Mean Household Income | 197 | $48,029 |
| Income Deficit | 34 | $0 |
| Wage / Income Gap (%) | 296 | 8.63% |
| Wage / Income Gap ($) | 296 | 91.37¢ per $1 |
| Gini / Inequality Index | 296 | 0.34 |
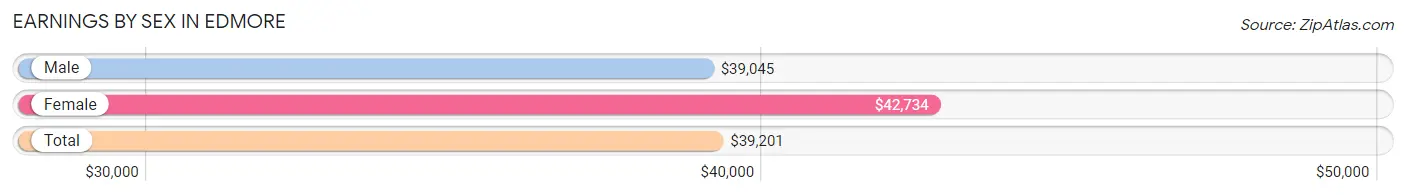
Earnings by Sex in Edmore
Average Earnings in Edmore are $39,201, $39,045 for men and $42,734 for women, a difference of 8.6%.
| Sex | Number | Average Earnings |
| Male | 117 (75.0%) | $39,045 |
| Female | 39 (25.0%) | $42,734 |
| Total | 156 (100.0%) | $39,201 |
Earnings by Sex by Income Bracket in Edmore
The most common earnings brackets in Edmore are $35,000 to $39,999 for men (73 | 62.4%) and $40,000 to $44,999 for women (19 | 48.7%).
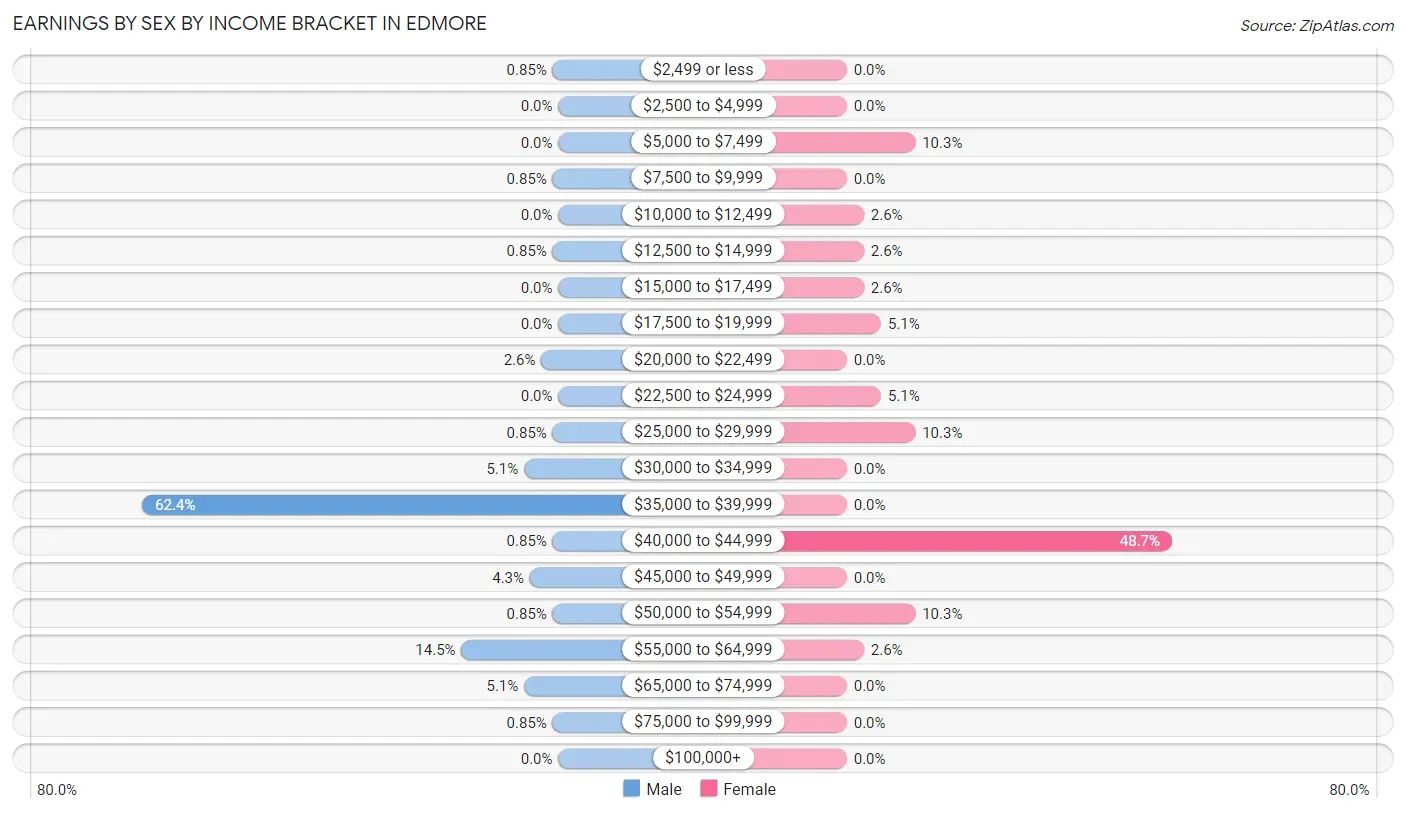
| Income | Male | Female |
| $2,499 or less | 1 (0.9%) | 0 (0.0%) |
| $2,500 to $4,999 | 0 (0.0%) | 0 (0.0%) |
| $5,000 to $7,499 | 0 (0.0%) | 4 (10.3%) |
| $7,500 to $9,999 | 1 (0.9%) | 0 (0.0%) |
| $10,000 to $12,499 | 0 (0.0%) | 1 (2.6%) |
| $12,500 to $14,999 | 1 (0.9%) | 1 (2.6%) |
| $15,000 to $17,499 | 0 (0.0%) | 1 (2.6%) |
| $17,500 to $19,999 | 0 (0.0%) | 2 (5.1%) |
| $20,000 to $22,499 | 3 (2.6%) | 0 (0.0%) |
| $22,500 to $24,999 | 0 (0.0%) | 2 (5.1%) |
| $25,000 to $29,999 | 1 (0.9%) | 4 (10.3%) |
| $30,000 to $34,999 | 6 (5.1%) | 0 (0.0%) |
| $35,000 to $39,999 | 73 (62.4%) | 0 (0.0%) |
| $40,000 to $44,999 | 1 (0.9%) | 19 (48.7%) |
| $45,000 to $49,999 | 5 (4.3%) | 0 (0.0%) |
| $50,000 to $54,999 | 1 (0.9%) | 4 (10.3%) |
| $55,000 to $64,999 | 17 (14.5%) | 1 (2.6%) |
| $65,000 to $74,999 | 6 (5.1%) | 0 (0.0%) |
| $75,000 to $99,999 | 1 (0.9%) | 0 (0.0%) |
| $100,000+ | 0 (0.0%) | 0 (0.0%) |
| Total | 117 (100.0%) | 39 (100.0%) |
Earnings by Sex by Educational Attainment in Edmore
Average earnings in Edmore are $38,924 for men and $28,750 for women, a difference of 26.1%. Men with an educational attainment of high school diploma enjoy the highest average annual earnings of $60,625, while those with graduate degree education earn the least with $38,802. Women with an educational attainment of college or associate's degree earn the most with the average annual earnings of $38,750, while those with high school diploma education have the smallest earnings of $21,250.
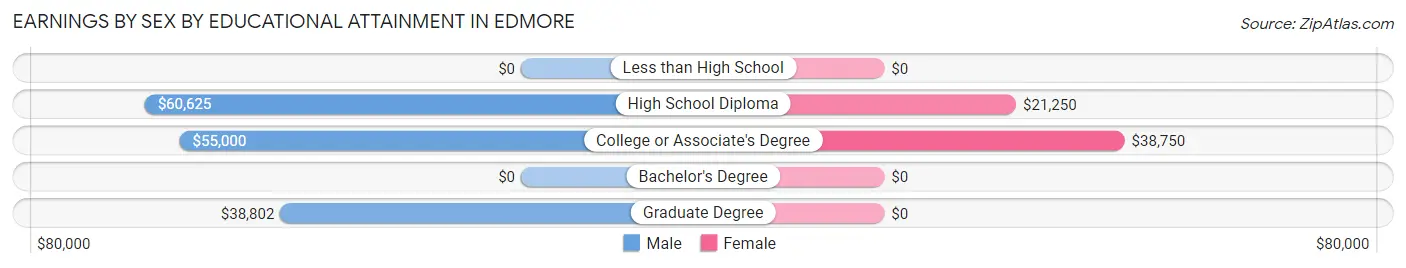
| Educational Attainment | Male Income | Female Income |
| Less than High School | - | - |
| High School Diploma | $60,625 | $21,250 |
| College or Associate's Degree | $55,000 | $38,750 |
| Bachelor's Degree | - | - |
| Graduate Degree | $38,802 | $0 |
| Total | $38,924 | $28,750 |
Family Income in Edmore
Family Income Brackets in Edmore
According to the Edmore family income data, there are 12 families falling into the $50,000 to $74,999 income range, which is the most common income bracket and makes up 35.3% of all families.
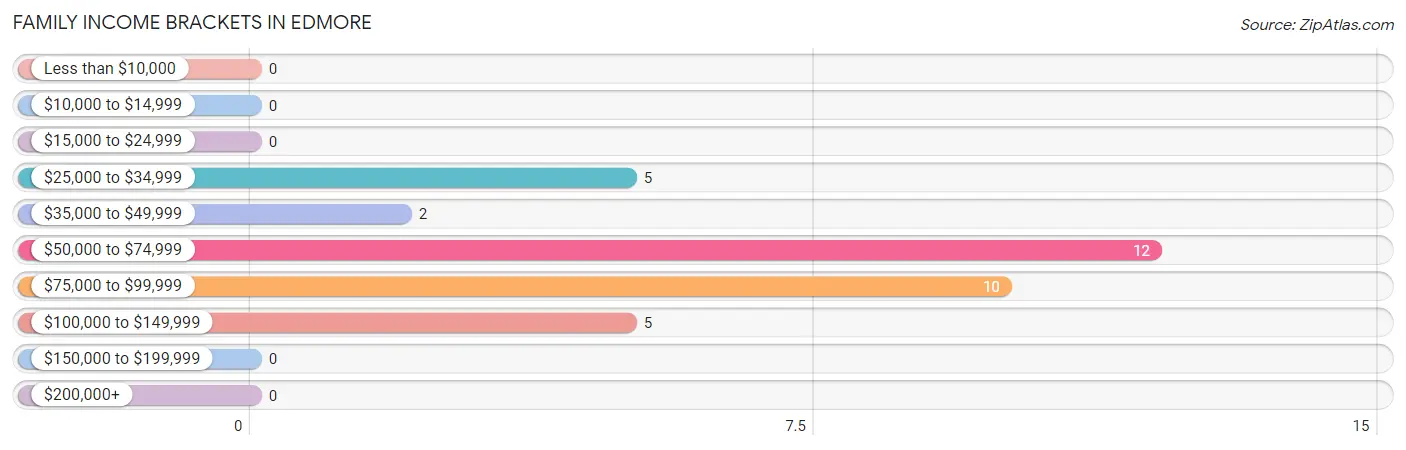
| Income Bracket | # Families | % Families |
| Less than $10,000 | 0 | 0.0% |
| $10,000 to $14,999 | 0 | 0.0% |
| $15,000 to $24,999 | 0 | 0.0% |
| $25,000 to $34,999 | 5 | 14.7% |
| $35,000 to $49,999 | 2 | 5.9% |
| $50,000 to $74,999 | 12 | 35.3% |
| $75,000 to $99,999 | 10 | 29.4% |
| $100,000 to $149,999 | 5 | 14.7% |
| $150,000 to $199,999 | 0 | 0.0% |
| $200,000+ | 0 | 0.0% |
Family Income by Famaliy Size in Edmore
3-person families (9 | 26.5%) account for the highest median family income in Edmore with $96,250 per family, while 2-person families (21 | 61.8%) have the highest median income of $35,312 per family member.
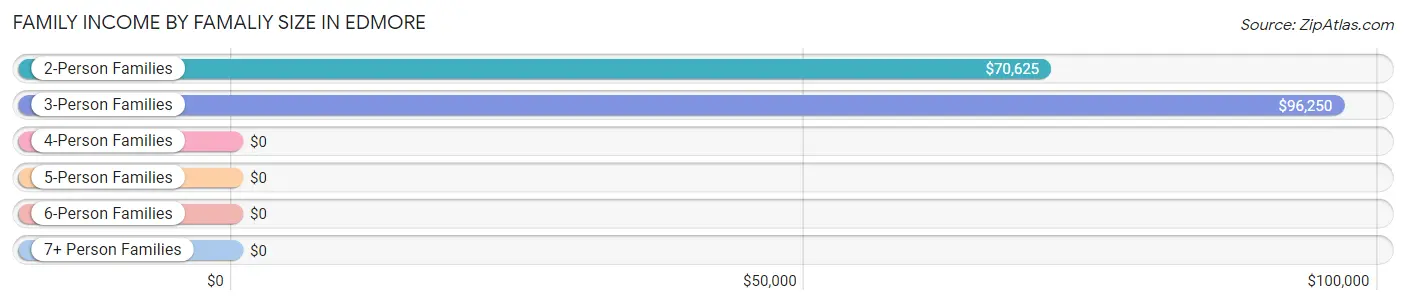
| Income Bracket | # Families | Median Income |
| 2-Person Families | 21 (61.8%) | $70,625 |
| 3-Person Families | 9 (26.5%) | $96,250 |
| 4-Person Families | 1 (2.9%) | $0 |
| 5-Person Families | 2 (5.9%) | $0 |
| 6-Person Families | 1 (2.9%) | $0 |
| 7+ Person Families | 0 (0.0%) | $0 |
| Total | 34 (100.0%) | $71,667 |
Family Income by Number of Earners in Edmore
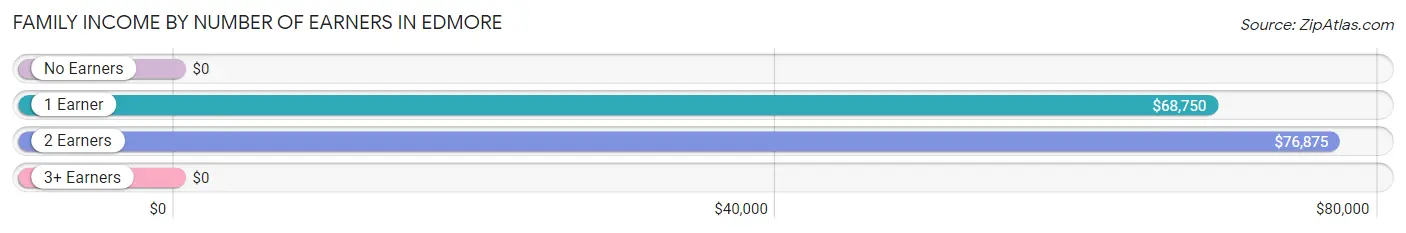
| Number of Earners | # Families | Median Income |
| No Earners | 6 (17.6%) | $0 |
| 1 Earner | 10 (29.4%) | $68,750 |
| 2 Earners | 17 (50.0%) | $76,875 |
| 3+ Earners | 1 (2.9%) | $0 |
| Total | 34 (100.0%) | $71,667 |
Household Income in Edmore
Household Income Brackets in Edmore
With 90 households falling in the category, the $50,000 to $74,999 income range is the most frequent in Edmore, accounting for 45.7% of all households.
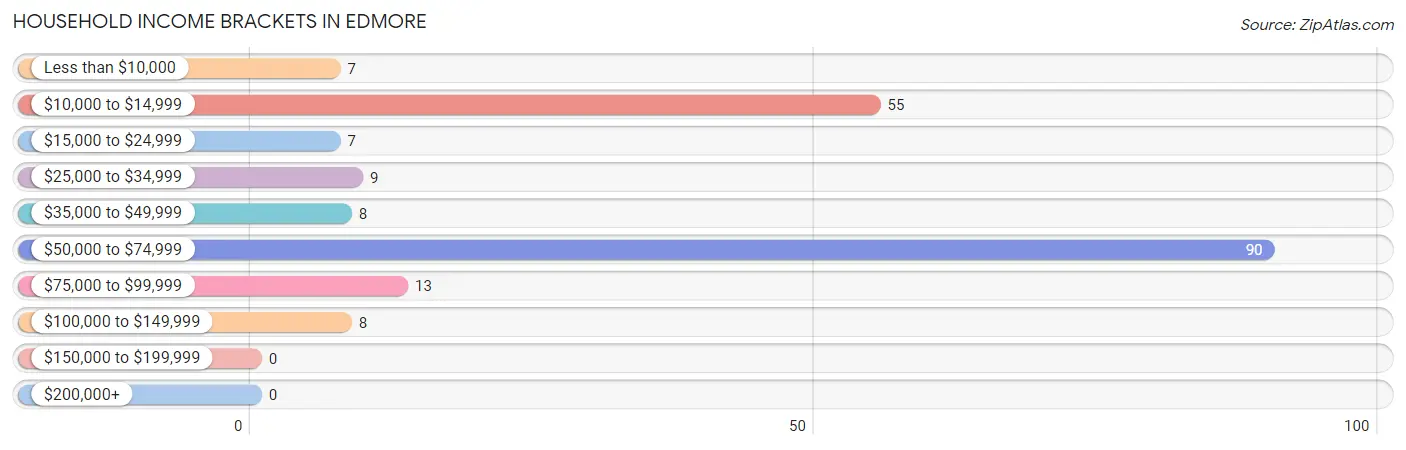
| Income Bracket | # Households | % Households |
| Less than $10,000 | 7 | 3.6% |
| $10,000 to $14,999 | 55 | 27.9% |
| $15,000 to $24,999 | 7 | 3.6% |
| $25,000 to $34,999 | 9 | 4.6% |
| $35,000 to $49,999 | 8 | 4.1% |
| $50,000 to $74,999 | 90 | 45.7% |
| $75,000 to $99,999 | 13 | 6.6% |
| $100,000 to $149,999 | 8 | 4.1% |
| $150,000 to $199,999 | 0 | 0.0% |
| $200,000+ | 0 | 0.0% |
Household Income by Householder Age in Edmore
The median household income in Edmore is $65,291, with the highest median household income of $76,250 found in the 25 to 44 years age bracket for the primary householder. A total of 22 households (11.2%) fall into this category. Meanwhile, the 15 to 24 years age bracket for the primary householder has the lowest median household income of $0, with 7 households (3.5%) in this group.
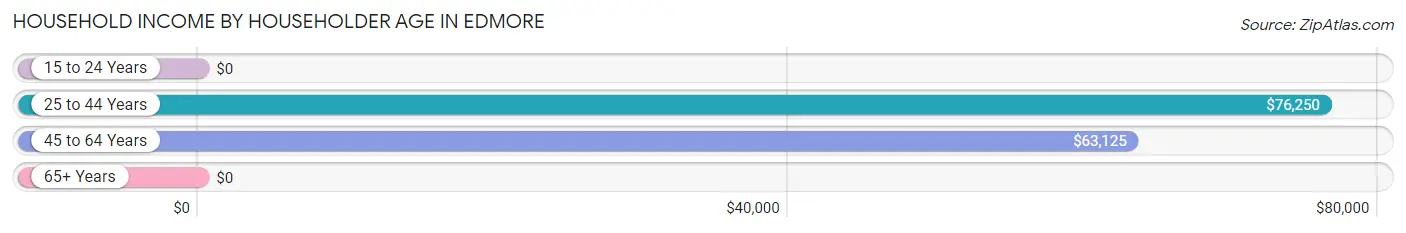
| Income Bracket | # Households | Median Income |
| 15 to 24 Years | 7 (3.5%) | $0 |
| 25 to 44 Years | 22 (11.2%) | $76,250 |
| 45 to 64 Years | 13 (6.6%) | $63,125 |
| 65+ Years | 155 (78.7%) | $0 |
| Total | 197 (100.0%) | $65,291 |
Poverty in Edmore
Income Below Poverty by Sex and Age in Edmore
With 7.2% poverty level for males and 56.3% for females among the residents of Edmore, 16 and 17 year old males and 75 year old and over females are the most vulnerable to poverty, with 4 males (100.0%) and 52 females (91.2%) in their respective age groups living below the poverty level.
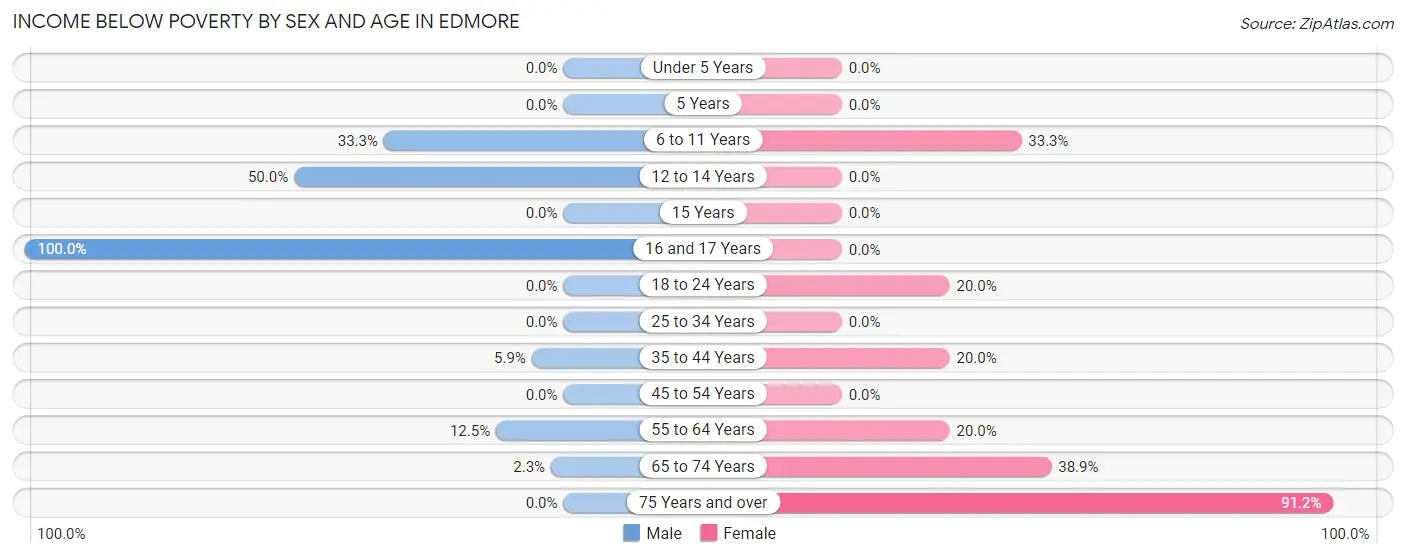
| Age Bracket | Male | Female |
| Under 5 Years | 0 (0.0%) | 0 (0.0%) |
| 5 Years | 0 (0.0%) | 0 (0.0%) |
| 6 to 11 Years | 1 (33.3%) | 1 (33.3%) |
| 12 to 14 Years | 2 (50.0%) | 0 (0.0%) |
| 15 Years | 0 (0.0%) | 0 (0.0%) |
| 16 and 17 Years | 4 (100.0%) | 0 (0.0%) |
| 18 to 24 Years | 0 (0.0%) | 4 (20.0%) |
| 25 to 34 Years | 0 (0.0%) | 0 (0.0%) |
| 35 to 44 Years | 1 (5.9%) | 1 (20.0%) |
| 45 to 54 Years | 0 (0.0%) | 0 (0.0%) |
| 55 to 64 Years | 1 (12.5%) | 2 (20.0%) |
| 65 to 74 Years | 2 (2.3%) | 7 (38.9%) |
| 75 Years and over | 0 (0.0%) | 52 (91.2%) |
| Total | 11 (7.2%) | 67 (56.3%) |
Income Above Poverty by Sex and Age in Edmore
According to the poverty statistics in Edmore, males aged under 5 years and females aged under 5 years are the age groups that are most secure financially, with 100.0% of males and 100.0% of females in these age groups living above the poverty line.
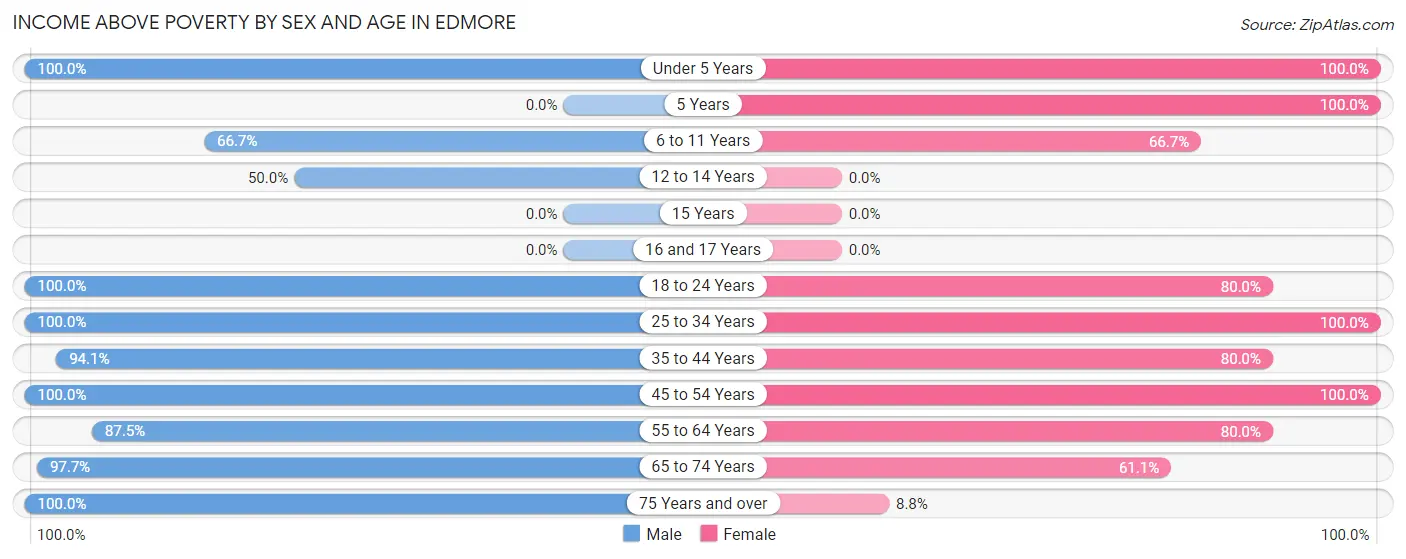
| Age Bracket | Male | Female |
| Under 5 Years | 1 (100.0%) | 1 (100.0%) |
| 5 Years | 0 (0.0%) | 1 (100.0%) |
| 6 to 11 Years | 2 (66.7%) | 2 (66.7%) |
| 12 to 14 Years | 2 (50.0%) | 0 (0.0%) |
| 15 Years | 0 (0.0%) | 0 (0.0%) |
| 16 and 17 Years | 0 (0.0%) | 0 (0.0%) |
| 18 to 24 Years | 11 (100.0%) | 16 (80.0%) |
| 25 to 34 Years | 11 (100.0%) | 2 (100.0%) |
| 35 to 44 Years | 16 (94.1%) | 4 (80.0%) |
| 45 to 54 Years | 3 (100.0%) | 2 (100.0%) |
| 55 to 64 Years | 7 (87.5%) | 8 (80.0%) |
| 65 to 74 Years | 85 (97.7%) | 11 (61.1%) |
| 75 Years and over | 4 (100.0%) | 5 (8.8%) |
| Total | 142 (92.8%) | 52 (43.7%) |
Income Below Poverty Among Married-Couple Families in Edmore
The poverty statistics for married-couple families in Edmore show that 3.8% or 1 of the total 26 families live below the poverty line. Families with 3 or 4 children have the highest poverty rate of 100.0%, comprising of 1 families. On the other hand, families with no children have the lowest poverty rate of 0.0%, which includes 0 families.
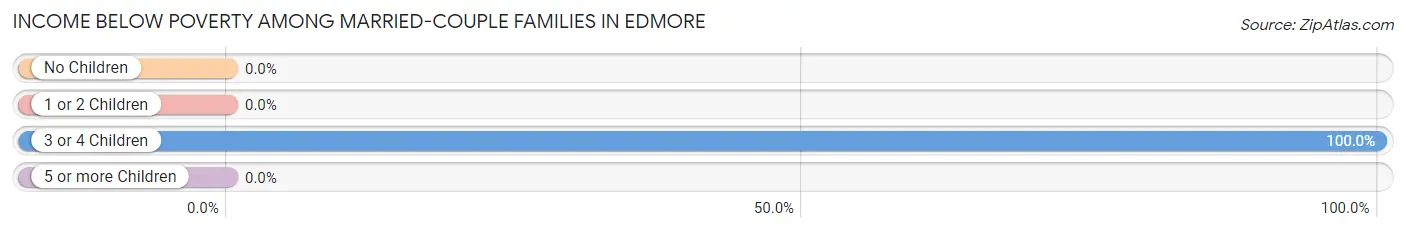
| Children | Above Poverty | Below Poverty |
| No Children | 24 (100.0%) | 0 (0.0%) |
| 1 or 2 Children | 1 (100.0%) | 0 (0.0%) |
| 3 or 4 Children | 0 (0.0%) | 1 (100.0%) |
| 5 or more Children | 0 (0.0%) | 0 (0.0%) |
| Total | 25 (96.2%) | 1 (3.8%) |
Income Below Poverty Among Single-Parent Households in Edmore
| Children | Single Father | Single Mother |
| No Children | 0 (0.0%) | 0 (0.0%) |
| 1 or 2 Children | 0 (0.0%) | 0 (0.0%) |
| 3 or 4 Children | 0 (0.0%) | 0 (0.0%) |
| 5 or more Children | 0 (0.0%) | 0 (0.0%) |
| Total | 0 (0.0%) | 0 (0.0%) |
Income Below Poverty Among Married-Couple vs Single-Parent Households in Edmore
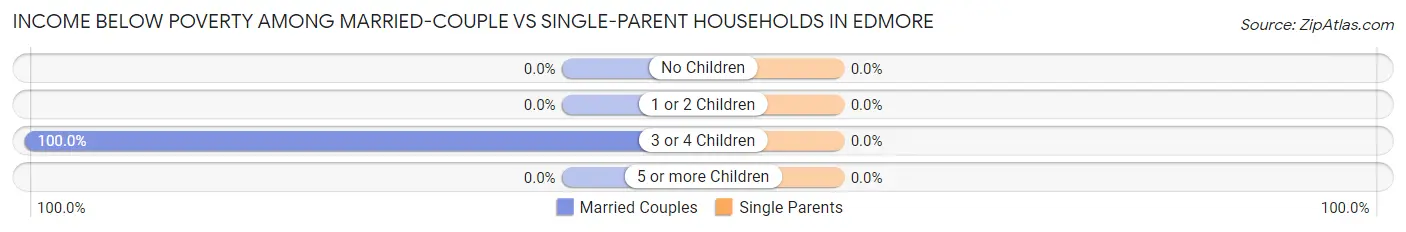
| Children | Married-Couple Families | Single-Parent Households |
| No Children | 0 (0.0%) | 0 (0.0%) |
| 1 or 2 Children | 0 (0.0%) | 0 (0.0%) |
| 3 or 4 Children | 1 (100.0%) | 0 (0.0%) |
| 5 or more Children | 0 (0.0%) | 0 (0.0%) |
| Total | 1 (3.8%) | 0 (0.0%) |
Race in Edmore
The most populous races in Edmore are White / Caucasian (235 | 79.4%), Hispanic or Latino (54 | 18.2%), and Some other Race (50 | 16.9%).
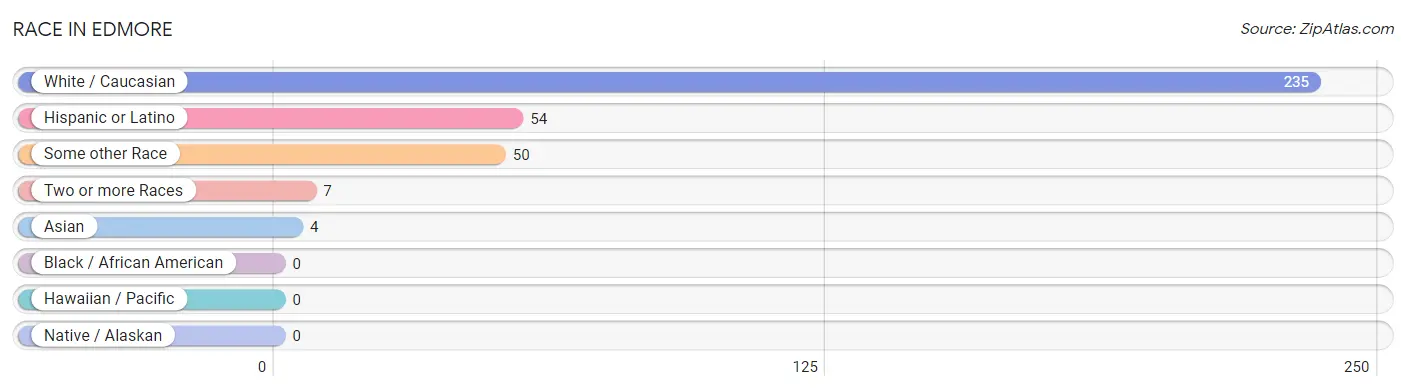
| Race | # Population | % Population |
| Asian | 4 | 1.3% |
| Black / African American | 0 | 0.0% |
| Hawaiian / Pacific | 0 | 0.0% |
| Hispanic or Latino | 54 | 18.2% |
| Native / Alaskan | 0 | 0.0% |
| White / Caucasian | 235 | 79.4% |
| Two or more Races | 7 | 2.4% |
| Some other Race | 50 | 16.9% |
| Total | 296 | 100.0% |
Ancestry in Edmore
The most populous ancestries reported in Edmore are Norwegian (146 | 49.3%), Central American (50 | 16.9%), Panamanian (50 | 16.9%), German (46 | 15.5%), and Dutch (16 | 5.4%), together accounting for 104.0% of all Edmore residents.
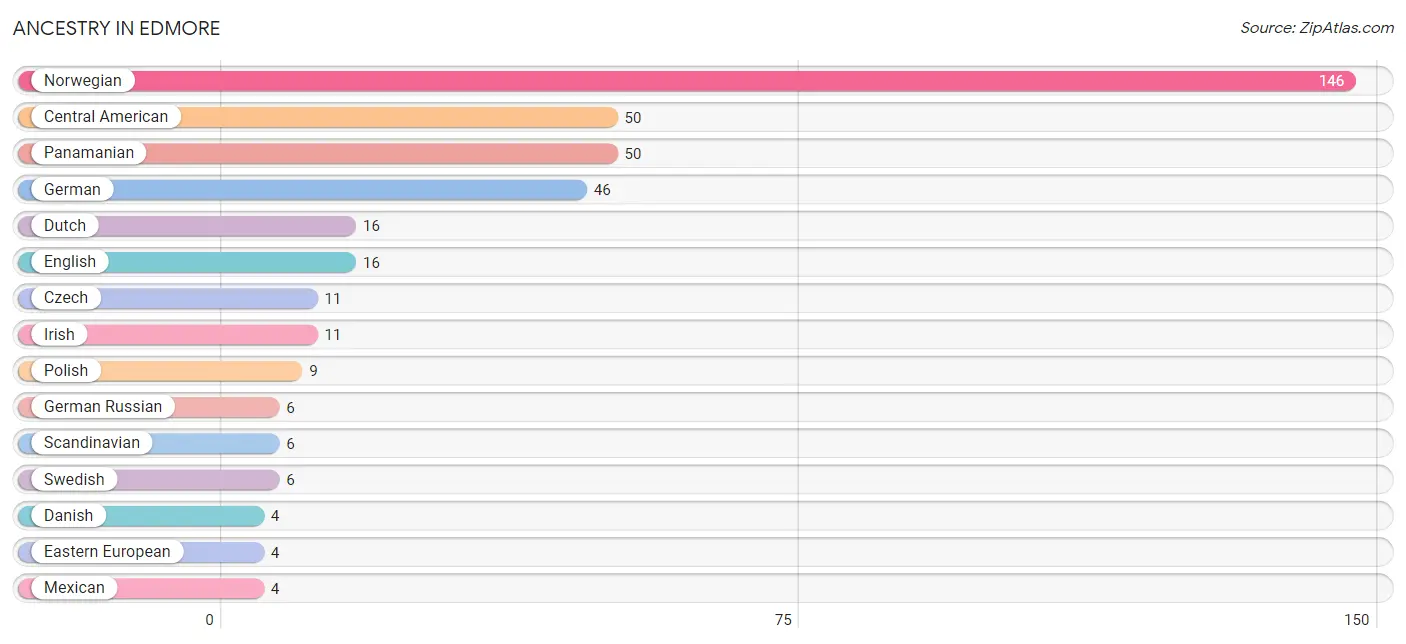
| Ancestry | # Population | % Population |
| Arab | 1 | 0.3% |
| Burmese | 1 | 0.3% |
| Central American | 50 | 16.9% |
| Czech | 11 | 3.7% |
| Danish | 4 | 1.3% |
| Dutch | 16 | 5.4% |
| Eastern European | 4 | 1.3% |
| English | 16 | 5.4% |
| German | 46 | 15.5% |
| German Russian | 6 | 2.0% |
| Icelander | 3 | 1.0% |
| Irish | 11 | 3.7% |
| Korean | 2 | 0.7% |
| Mexican | 4 | 1.3% |
| Norwegian | 146 | 49.3% |
| Panamanian | 50 | 16.9% |
| Pennsylvania German | 1 | 0.3% |
| Polish | 9 | 3.0% |
| Russian | 3 | 1.0% |
| Scandinavian | 6 | 2.0% |
| Scottish | 3 | 1.0% |
| South African | 3 | 1.0% |
| Subsaharan African | 3 | 1.0% |
| Swedish | 6 | 2.0% |
| Syrian | 1 | 0.3% | View All 25 Rows |
Immigrants in Edmore
The most numerous immigrant groups reported in Edmore came from Central America (50 | 16.9%), Latin America (50 | 16.9%), Nicaragua (50 | 16.9%), Asia (4 | 1.3%), and Africa (3 | 1.0%), together accounting for 53.0% of all Edmore residents.
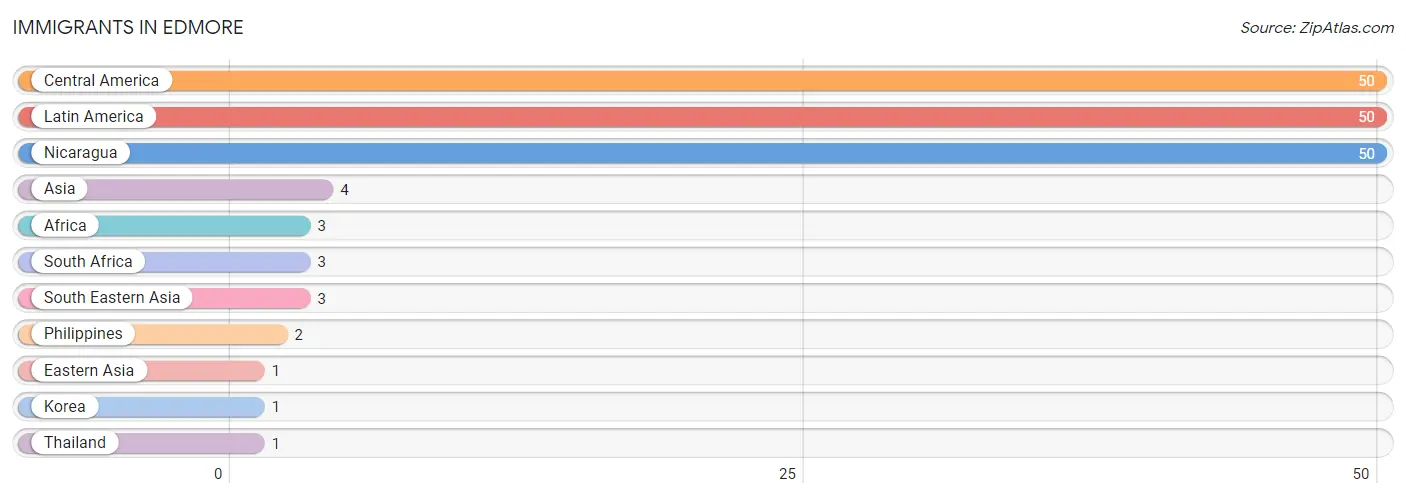
| Immigration Origin | # Population | % Population |
| Africa | 3 | 1.0% |
| Asia | 4 | 1.3% |
| Central America | 50 | 16.9% |
| Eastern Asia | 1 | 0.3% |
| Korea | 1 | 0.3% |
| Latin America | 50 | 16.9% |
| Nicaragua | 50 | 16.9% |
| Philippines | 2 | 0.7% |
| South Africa | 3 | 1.0% |
| South Eastern Asia | 3 | 1.0% |
| Thailand | 1 | 0.3% | View All 11 Rows |
Sex and Age in Edmore
Sex and Age in Edmore
The most populous age groups in Edmore are 70 to 74 Years (77 | 50.3%) for men and 85 Years and over (68 | 47.5%) for women.
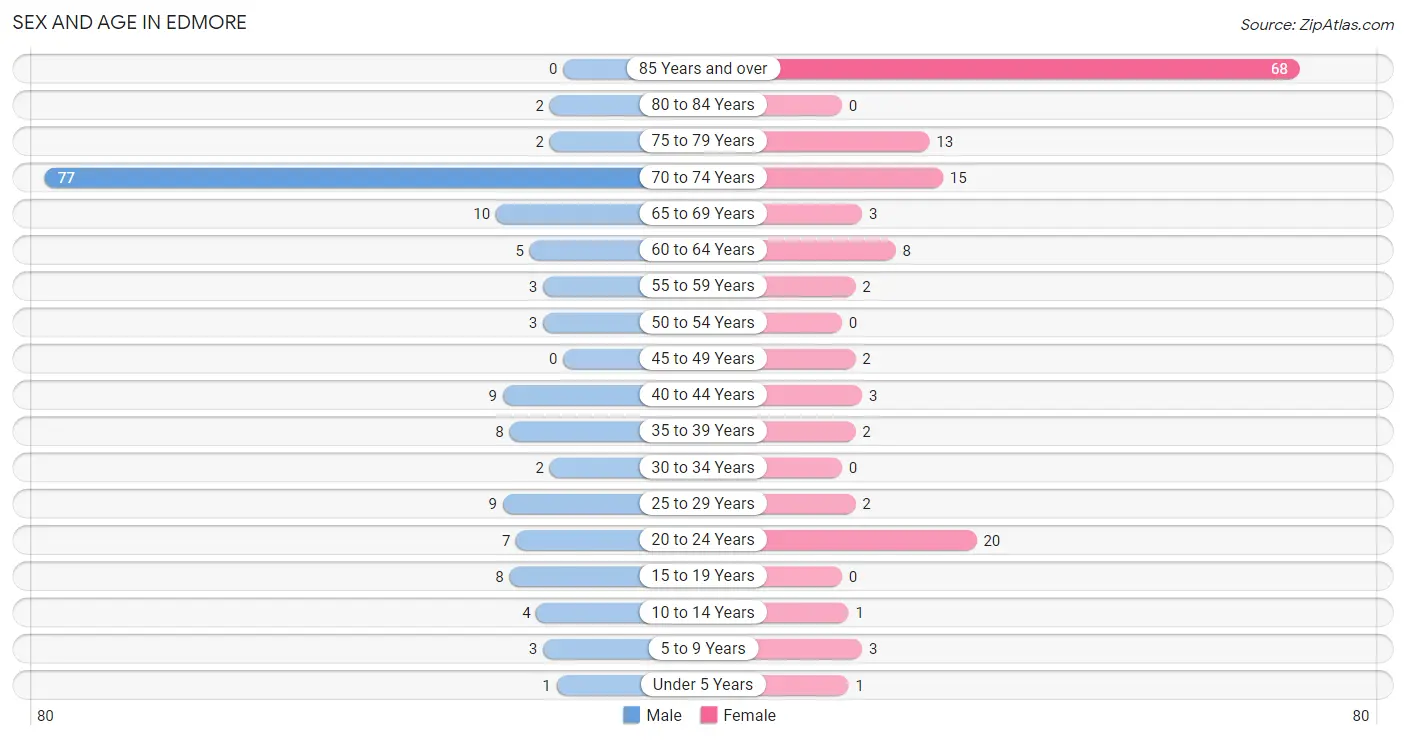
| Age Bracket | Male | Female |
| Under 5 Years | 1 (0.6%) | 1 (0.7%) |
| 5 to 9 Years | 3 (2.0%) | 3 (2.1%) |
| 10 to 14 Years | 4 (2.6%) | 1 (0.7%) |
| 15 to 19 Years | 8 (5.2%) | 0 (0.0%) |
| 20 to 24 Years | 7 (4.6%) | 20 (14.0%) |
| 25 to 29 Years | 9 (5.9%) | 2 (1.4%) |
| 30 to 34 Years | 2 (1.3%) | 0 (0.0%) |
| 35 to 39 Years | 8 (5.2%) | 2 (1.4%) |
| 40 to 44 Years | 9 (5.9%) | 3 (2.1%) |
| 45 to 49 Years | 0 (0.0%) | 2 (1.4%) |
| 50 to 54 Years | 3 (2.0%) | 0 (0.0%) |
| 55 to 59 Years | 3 (2.0%) | 2 (1.4%) |
| 60 to 64 Years | 5 (3.3%) | 8 (5.6%) |
| 65 to 69 Years | 10 (6.5%) | 3 (2.1%) |
| 70 to 74 Years | 77 (50.3%) | 15 (10.5%) |
| 75 to 79 Years | 2 (1.3%) | 13 (9.1%) |
| 80 to 84 Years | 2 (1.3%) | 0 (0.0%) |
| 85 Years and over | 0 (0.0%) | 68 (47.5%) |
| Total | 153 (100.0%) | 143 (100.0%) |
Families and Households in Edmore
Median Family Size in Edmore
The median family size in Edmore is 2.94 persons per family, with married-couple families (26 | 76.5%) accounting for the largest median family size of 3 persons per family. On the other hand, single male/father families (6 | 17.6%) represent the smallest median family size with 2.67 persons per family.
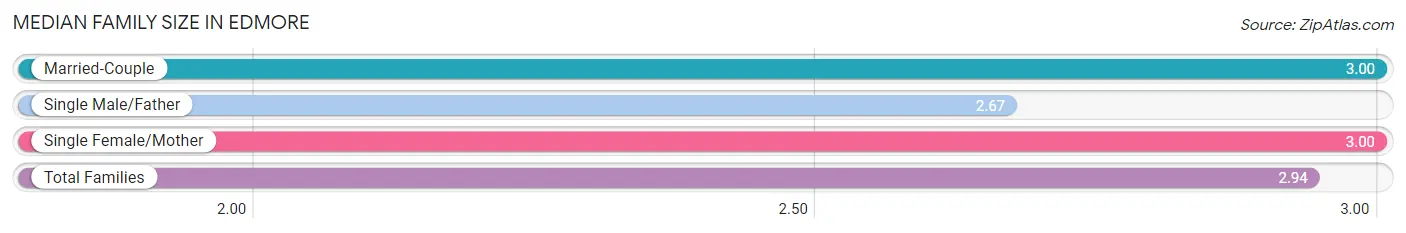
| Family Type | # Families | Family Size |
| Married-Couple | 26 (76.5%) | 3.00 |
| Single Male/Father | 6 (17.6%) | 2.67 |
| Single Female/Mother | 2 (5.9%) | 3.00 |
| Total Families | 34 (100.0%) | 2.94 |
Median Household Size in Edmore
The median household size in Edmore is 1.38 persons per household, with married-couple households (26 | 13.2%) accounting for the largest median household size of 3 persons per household. non-family households (163 | 82.7%) represent the smallest median household size with 1.05 persons per household.
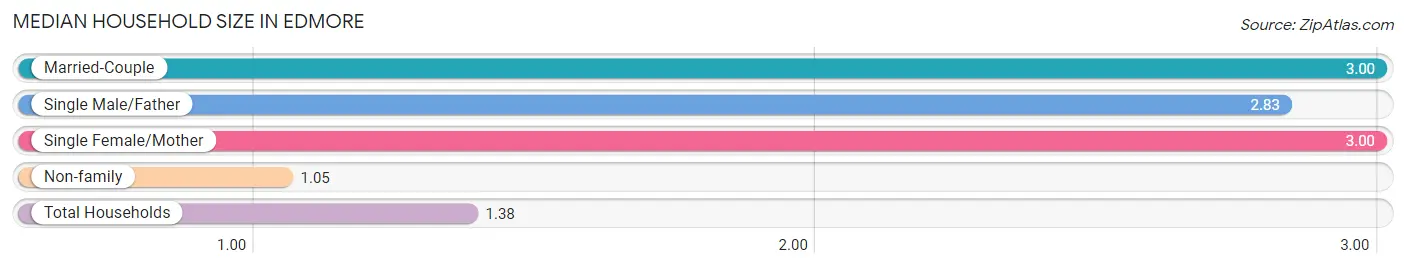
| Household Type | # Households | Household Size |
| Married-Couple | 26 (13.2%) | 3.00 |
| Single Male/Father | 6 (3.0%) | 2.83 |
| Single Female/Mother | 2 (1.0%) | 3.00 |
| Non-family | 163 (82.7%) | 1.05 |
| Total Households | 197 (100.0%) | 1.38 |
Household Size by Marriage Status in Edmore
Out of a total of 197 households in Edmore, 34 (17.3%) are family households, while 163 (82.7%) are nonfamily households. The most numerous type of family households are 2-person households, comprising 21, and the most common type of nonfamily households are 1-person households, comprising 151.
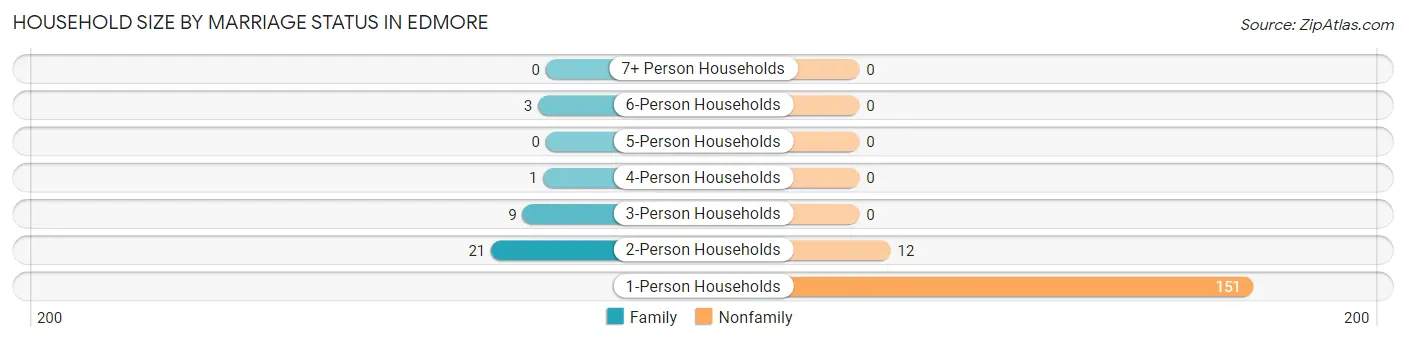
| Household Size | Family Households | Nonfamily Households |
| 1-Person Households | - | 151 (76.6%) |
| 2-Person Households | 21 (10.7%) | 12 (6.1%) |
| 3-Person Households | 9 (4.6%) | 0 (0.0%) |
| 4-Person Households | 1 (0.5%) | 0 (0.0%) |
| 5-Person Households | 0 (0.0%) | 0 (0.0%) |
| 6-Person Households | 3 (1.5%) | 0 (0.0%) |
| 7+ Person Households | 0 (0.0%) | 0 (0.0%) |
| Total | 34 (17.3%) | 163 (82.7%) |
Female Fertility in Edmore
Fertility by Age in Edmore
Average fertility rate in Edmore is 69.0 births per 1,000 women. Women in the age bracket of 35 to 50 years have the highest fertility rate with 286.0 births per 1,000 women. Women in the age bracket of 35 to 50 years acount for 100.0% of all women with births.
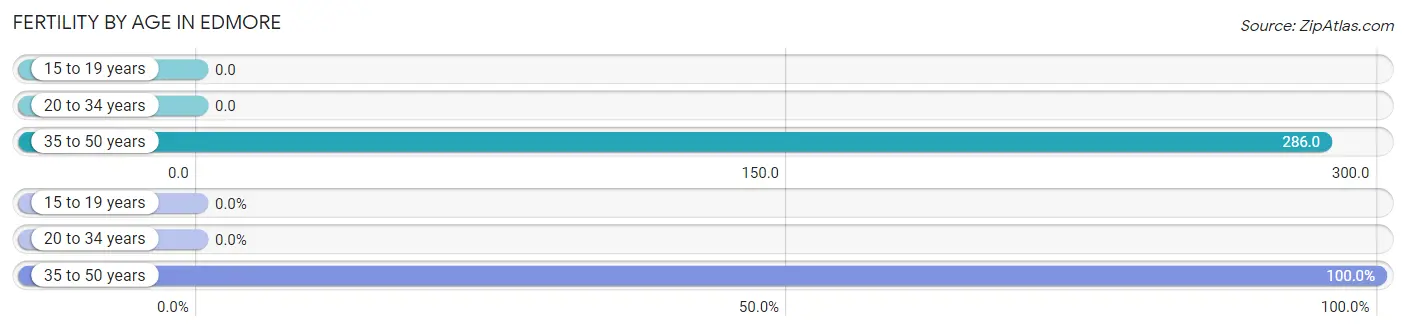
| Age Bracket | Women with Births | Births / 1,000 Women |
| 15 to 19 years | 0 (0.0%) | 0.0 |
| 20 to 34 years | 0 (0.0%) | 0.0 |
| 35 to 50 years | 2 (100.0%) | 286.0 |
| Total | 2 (100.0%) | 69.0 |
Fertility by Age by Marriage Status in Edmore
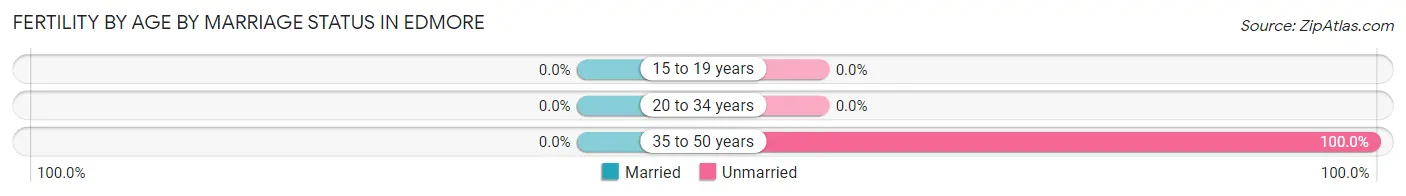
| Age Bracket | Married | Unmarried |
| 15 to 19 years | 0 (0.0%) | 0 (0.0%) |
| 20 to 34 years | 0 (0.0%) | 0 (0.0%) |
| 35 to 50 years | 0 (0.0%) | 2 (100.0%) |
| Total | 0 (0.0%) | 2 (100.0%) |
Fertility by Education in Edmore
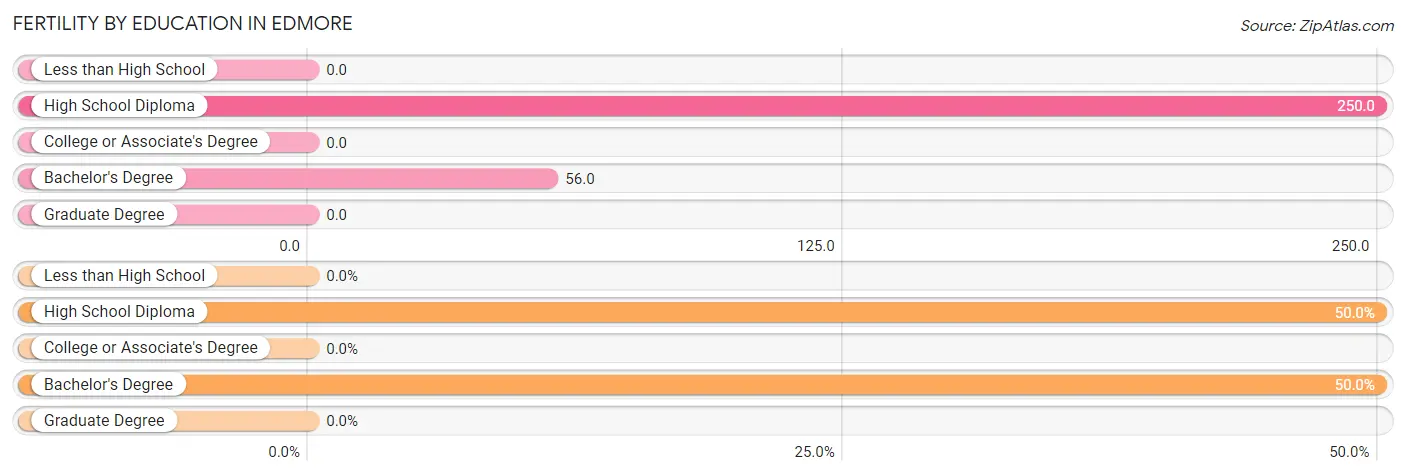
| Educational Attainment | Women with Births | Births / 1,000 Women |
| Less than High School | 0 (0.0%) | 0.0 |
| High School Diploma | 1 (50.0%) | 250.0 |
| College or Associate's Degree | 0 (0.0%) | 0.0 |
| Bachelor's Degree | 1 (50.0%) | 56.0 |
| Graduate Degree | 0 (0.0%) | 0.0 |
| Total | 2 (100.0%) | 69.0 |
Fertility by Education by Marriage Status in Edmore
| Educational Attainment | Married | Unmarried |
| Less than High School | 0 (0.0%) | 0 (0.0%) |
| High School Diploma | 0 (0.0%) | 1 (100.0%) |
| College or Associate's Degree | 0 (0.0%) | 0 (0.0%) |
| Bachelor's Degree | 0 (0.0%) | 1 (100.0%) |
| Graduate Degree | 0 (0.0%) | 0 (0.0%) |
| Total | 0 (0.0%) | 2 (100.0%) |
Employment Characteristics in Edmore
Employment by Class of Employer in Edmore
Among the 149 employed individuals in Edmore, not-for-profit organizations (74 | 49.7%), local government employees (25 | 16.8%), and private company employees (23 | 15.4%) make up the most common classes of employment.
| Employer Class | # Employees | % Employees |
| Private Company Employees | 23 | 15.4% |
| Self-Employed (Incorporated) | 7 | 4.7% |
| Self-Employed (Not Incorporated) | 18 | 12.1% |
| Not-for-profit Organizations | 74 | 49.7% |
| Local Government Employees | 25 | 16.8% |
| State Government Employees | 2 | 1.3% |
| Federal Government Employees | 0 | 0.0% |
| Unpaid Family Workers | 0 | 0.0% |
| Total | 149 | 100.0% |
Employment Status by Age in Edmore
According to the labor force statistics for Edmore, out of the total population over 16 years of age (283), 54.1% or 153 individuals are in the labor force, with 0.7% or 1 of them unemployed. The age group with the highest labor force participation rate is 20 to 24 years, with 100.0% or 27 individuals in the labor force. Within the labor force, the 65 to 74 years age range has the highest percentage of unemployed individuals, with 1.3% or 1 of them being unemployed.
| Age Bracket | In Labor Force | Unemployed |
| 16 to 19 Years | 0 (0.0%) | 0 (0.0%) |
| 20 to 24 Years | 27 (100.0%) | 0 (0.0%) |
| 25 to 29 Years | 11 (100.0%) | 0 (0.0%) |
| 30 to 34 Years | 2 (100.0%) | 0 (0.0%) |
| 35 to 44 Years | 21 (95.5%) | 0 (0.0%) |
| 45 to 54 Years | 5 (100.0%) | 0 (0.0%) |
| 55 to 59 Years | 4 (80.0%) | 0 (0.0%) |
| 60 to 64 Years | 5 (38.5%) | 0 (0.0%) |
| 65 to 74 Years | 78 (74.3%) | 1 (1.3%) |
| 75 Years and over | 0 (0.0%) | 0 (0.0%) |
| Total | 153 (54.1%) | 1 (0.7%) |
Employment Status by Educational Attainment in Edmore
| Educational Attainment | In Labor Force | Unemployed |
| Less than High School | 3 (60.0%) | 0 (0.0%) |
| High School Diploma | 17 (89.5%) | 0 (0.0%) |
| College / Associate Degree | 16 (76.2%) | 0 (0.0%) |
| Bachelor's Degree or higher | 12 (92.3%) | 0 (0.0%) |
| Total | 48 (82.8%) | 0 (0.0%) |
Employment Occupations by Sex in Edmore
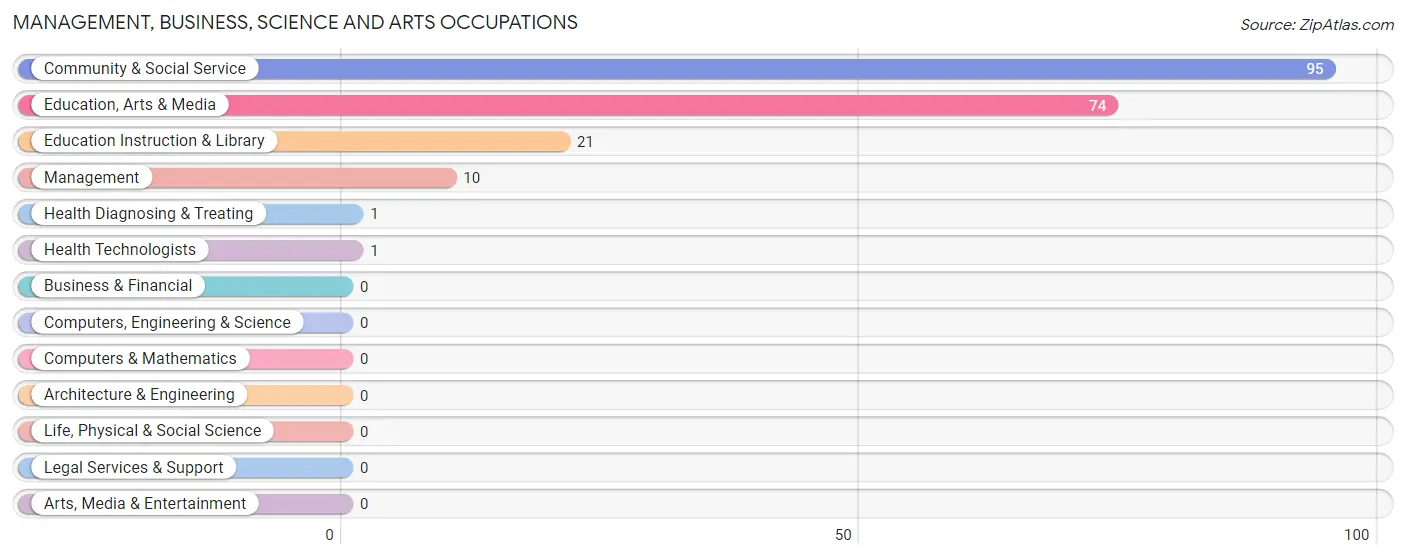
Management, Business, Science and Arts Occupations
The most common Management, Business, Science and Arts occupations in Edmore are Community & Social Service (95 | 62.5%), Education, Arts & Media (74 | 48.7%), Education Instruction & Library (21 | 13.8%), Management (10 | 6.6%), and Health Diagnosing & Treating (1 | 0.7%).
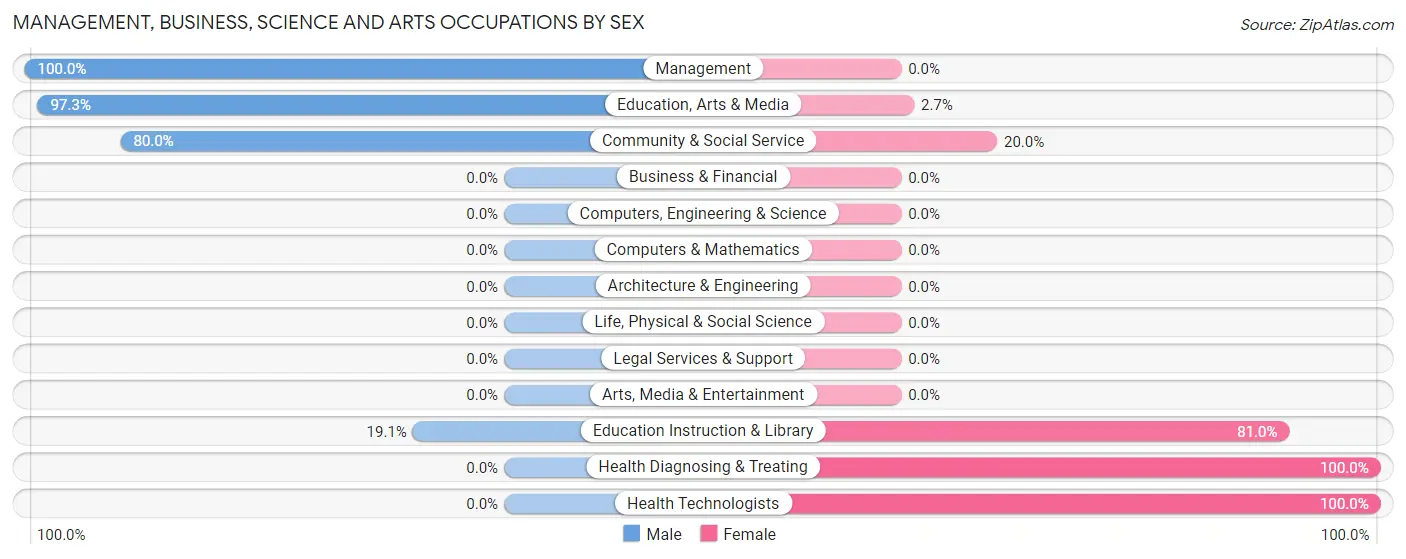
Management, Business, Science and Arts Occupations by Sex
Within the Management, Business, Science and Arts occupations in Edmore, the most male-oriented occupations are Management (100.0%), Education, Arts & Media (97.3%), and Community & Social Service (80.0%), while the most female-oriented occupations are Health Diagnosing & Treating (100.0%), Health Technologists (100.0%), and Education Instruction & Library (80.9%).
| Occupation | Male | Female |
| Management | 10 (100.0%) | 0 (0.0%) |
| Business & Financial | 0 (0.0%) | 0 (0.0%) |
| Computers, Engineering & Science | 0 (0.0%) | 0 (0.0%) |
| Computers & Mathematics | 0 (0.0%) | 0 (0.0%) |
| Architecture & Engineering | 0 (0.0%) | 0 (0.0%) |
| Life, Physical & Social Science | 0 (0.0%) | 0 (0.0%) |
| Community & Social Service | 76 (80.0%) | 19 (20.0%) |
| Education, Arts & Media | 72 (97.3%) | 2 (2.7%) |
| Legal Services & Support | 0 (0.0%) | 0 (0.0%) |
| Education Instruction & Library | 4 (19.1%) | 17 (80.9%) |
| Arts, Media & Entertainment | 0 (0.0%) | 0 (0.0%) |
| Health Diagnosing & Treating | 0 (0.0%) | 1 (100.0%) |
| Health Technologists | 0 (0.0%) | 1 (100.0%) |
| Total (Category) | 86 (81.1%) | 20 (18.9%) |
| Total (Overall) | 116 (76.3%) | 36 (23.7%) |
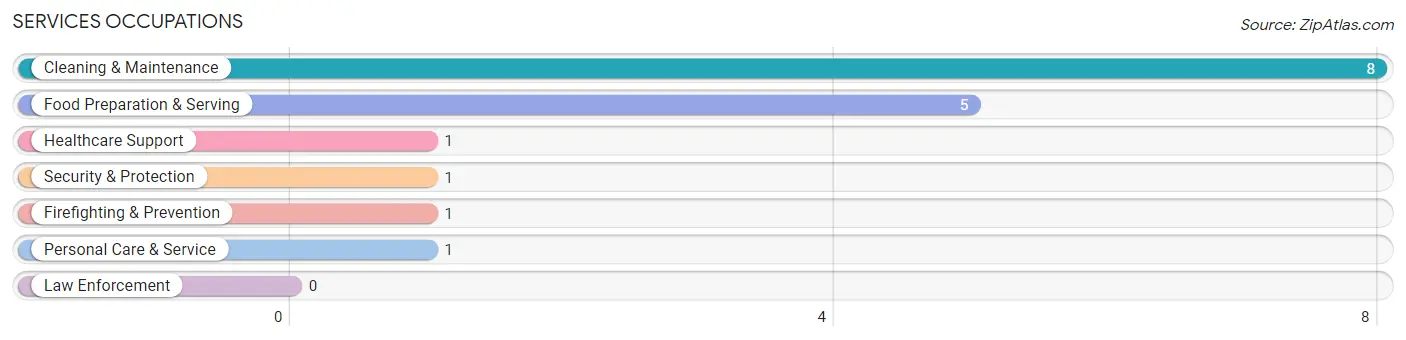
Services Occupations
The most common Services occupations in Edmore are Cleaning & Maintenance (8 | 5.3%), Food Preparation & Serving (5 | 3.3%), Healthcare Support (1 | 0.7%), Security & Protection (1 | 0.7%), and Firefighting & Prevention (1 | 0.7%).
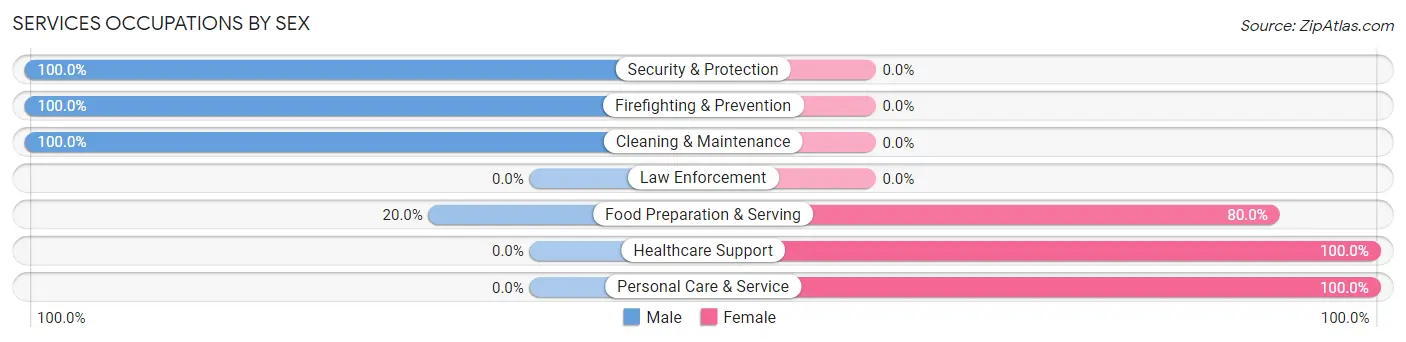
Services Occupations by Sex
Within the Services occupations in Edmore, the most male-oriented occupations are Security & Protection (100.0%), Firefighting & Prevention (100.0%), and Cleaning & Maintenance (100.0%), while the most female-oriented occupations are Healthcare Support (100.0%), Personal Care & Service (100.0%), and Food Preparation & Serving (80.0%).
| Occupation | Male | Female |
| Healthcare Support | 0 (0.0%) | 1 (100.0%) |
| Security & Protection | 1 (100.0%) | 0 (0.0%) |
| Firefighting & Prevention | 1 (100.0%) | 0 (0.0%) |
| Law Enforcement | 0 (0.0%) | 0 (0.0%) |
| Food Preparation & Serving | 1 (20.0%) | 4 (80.0%) |
| Cleaning & Maintenance | 8 (100.0%) | 0 (0.0%) |
| Personal Care & Service | 0 (0.0%) | 1 (100.0%) |
| Total (Category) | 10 (62.5%) | 6 (37.5%) |
| Total (Overall) | 116 (76.3%) | 36 (23.7%) |
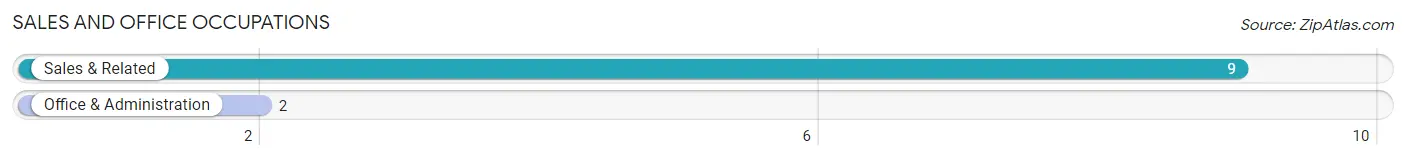
Sales and Office Occupations
The most common Sales and Office occupations in Edmore are Sales & Related (9 | 5.9%), and Office & Administration (2 | 1.3%).
Sales and Office Occupations by Sex
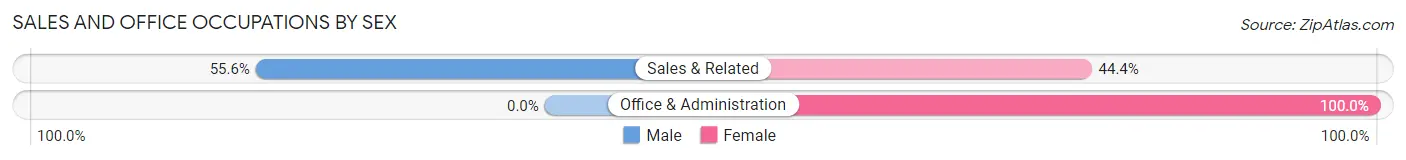
| Occupation | Male | Female |
| Sales & Related | 5 (55.6%) | 4 (44.4%) |
| Office & Administration | 0 (0.0%) | 2 (100.0%) |
| Total (Category) | 5 (45.5%) | 6 (54.5%) |
| Total (Overall) | 116 (76.3%) | 36 (23.7%) |
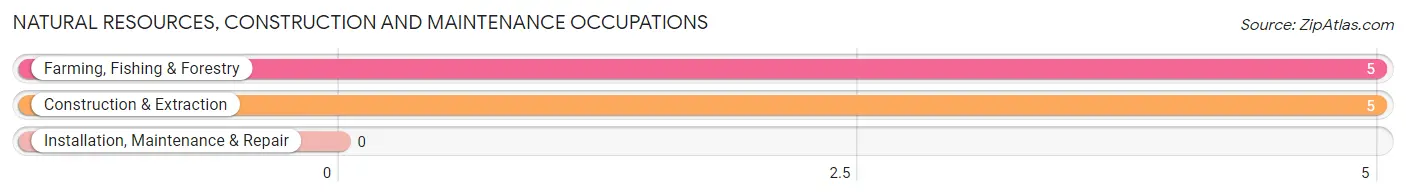
Natural Resources, Construction and Maintenance Occupations
The most common Natural Resources, Construction and Maintenance occupations in Edmore are Farming, Fishing & Forestry (5 | 3.3%), and Construction & Extraction (5 | 3.3%).
Natural Resources, Construction and Maintenance Occupations by Sex
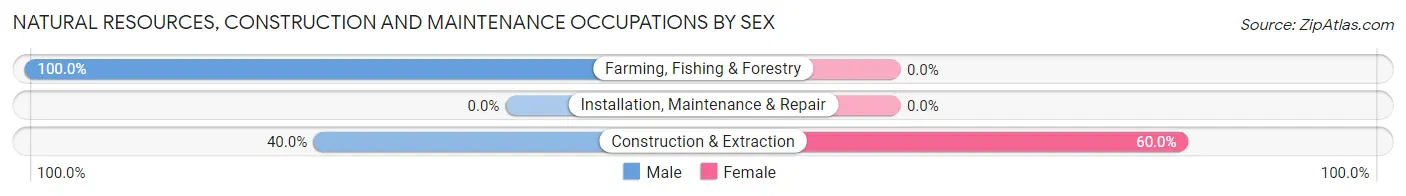
| Occupation | Male | Female |
| Farming, Fishing & Forestry | 5 (100.0%) | 0 (0.0%) |
| Construction & Extraction | 2 (40.0%) | 3 (60.0%) |
| Installation, Maintenance & Repair | 0 (0.0%) | 0 (0.0%) |
| Total (Category) | 7 (70.0%) | 3 (30.0%) |
| Total (Overall) | 116 (76.3%) | 36 (23.7%) |
Production, Transportation and Moving Occupations
The most common Production, Transportation and Moving occupations in Edmore are Transportation (8 | 5.3%), and Production (1 | 0.7%).
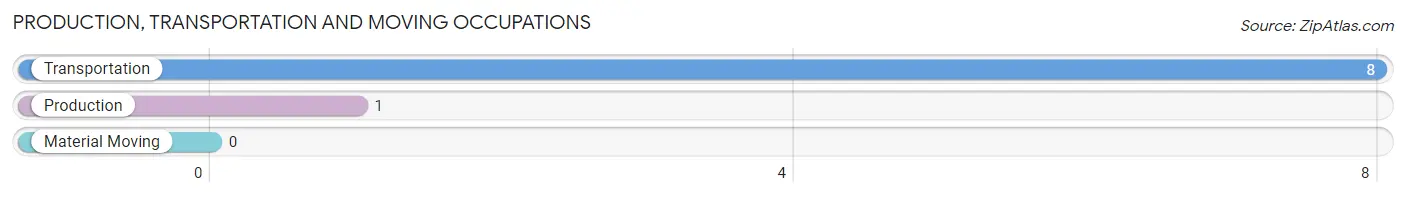
Production, Transportation and Moving Occupations by Sex
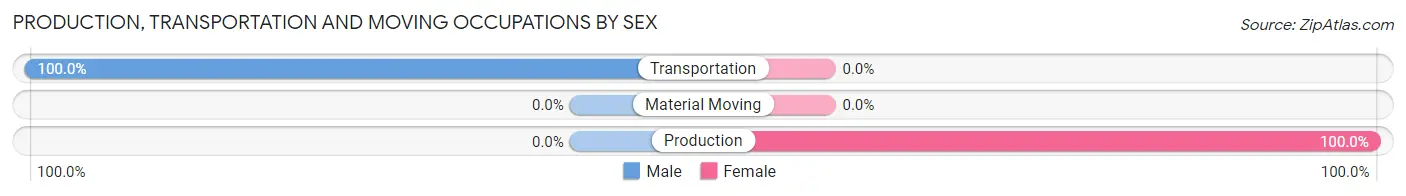
| Occupation | Male | Female |
| Production | 0 (0.0%) | 1 (100.0%) |
| Transportation | 8 (100.0%) | 0 (0.0%) |
| Material Moving | 0 (0.0%) | 0 (0.0%) |
| Total (Category) | 8 (88.9%) | 1 (11.1%) |
| Total (Overall) | 116 (76.3%) | 36 (23.7%) |
Employment Industries by Sex in Edmore
Employment Industries in Edmore
The major employment industries in Edmore include Educational Services (28 | 18.4%), Agriculture, Fishing & Hunting (14 | 9.2%), Construction (8 | 5.3%), Retail Trade (7 | 4.6%), and Transportation & Warehousing (6 | 4.0%).
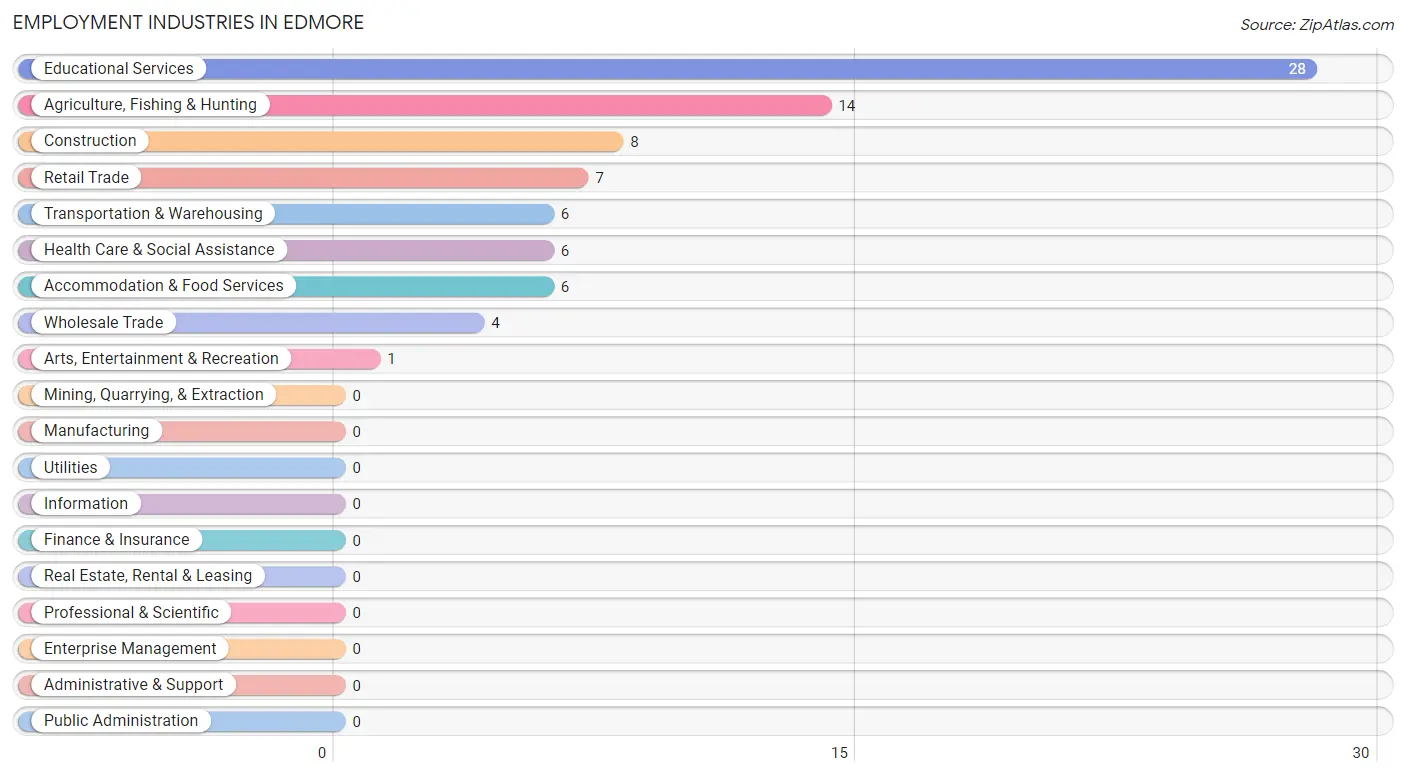
Employment Industries by Sex in Edmore
The Edmore industries that see more men than women are Agriculture, Fishing & Hunting (100.0%), Wholesale Trade (100.0%), and Arts, Entertainment & Recreation (100.0%), whereas the industries that tend to have a higher number of women are Health Care & Social Assistance (100.0%), Accommodation & Food Services (66.7%), and Educational Services (60.7%).
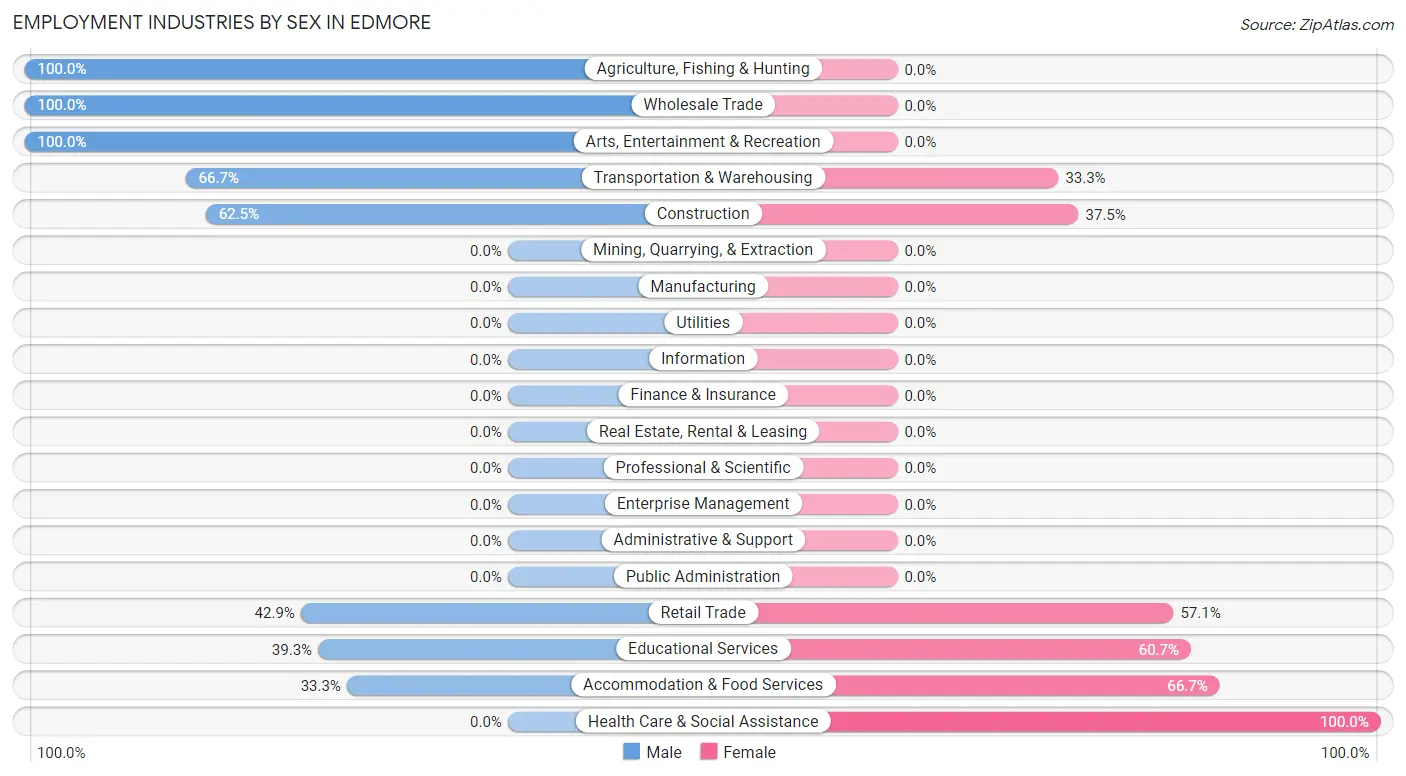
| Industry | Male | Female |
| Agriculture, Fishing & Hunting | 14 (100.0%) | 0 (0.0%) |
| Mining, Quarrying, & Extraction | 0 (0.0%) | 0 (0.0%) |
| Construction | 5 (62.5%) | 3 (37.5%) |
| Manufacturing | 0 (0.0%) | 0 (0.0%) |
| Wholesale Trade | 4 (100.0%) | 0 (0.0%) |
| Retail Trade | 3 (42.9%) | 4 (57.1%) |
| Transportation & Warehousing | 4 (66.7%) | 2 (33.3%) |
| Utilities | 0 (0.0%) | 0 (0.0%) |
| Information | 0 (0.0%) | 0 (0.0%) |
| Finance & Insurance | 0 (0.0%) | 0 (0.0%) |
| Real Estate, Rental & Leasing | 0 (0.0%) | 0 (0.0%) |
| Professional & Scientific | 0 (0.0%) | 0 (0.0%) |
| Enterprise Management | 0 (0.0%) | 0 (0.0%) |
| Administrative & Support | 0 (0.0%) | 0 (0.0%) |
| Educational Services | 11 (39.3%) | 17 (60.7%) |
| Health Care & Social Assistance | 0 (0.0%) | 6 (100.0%) |
| Arts, Entertainment & Recreation | 1 (100.0%) | 0 (0.0%) |
| Accommodation & Food Services | 2 (33.3%) | 4 (66.7%) |
| Public Administration | 0 (0.0%) | 0 (0.0%) |
| Total | 116 (76.3%) | 36 (23.7%) |
Education in Edmore
School Enrollment in Edmore
The most common levels of schooling among the 38 students in Edmore are graduate / professional (17 | 44.7%), high school (8 | 21.0%), and middle school (4 | 10.5%).
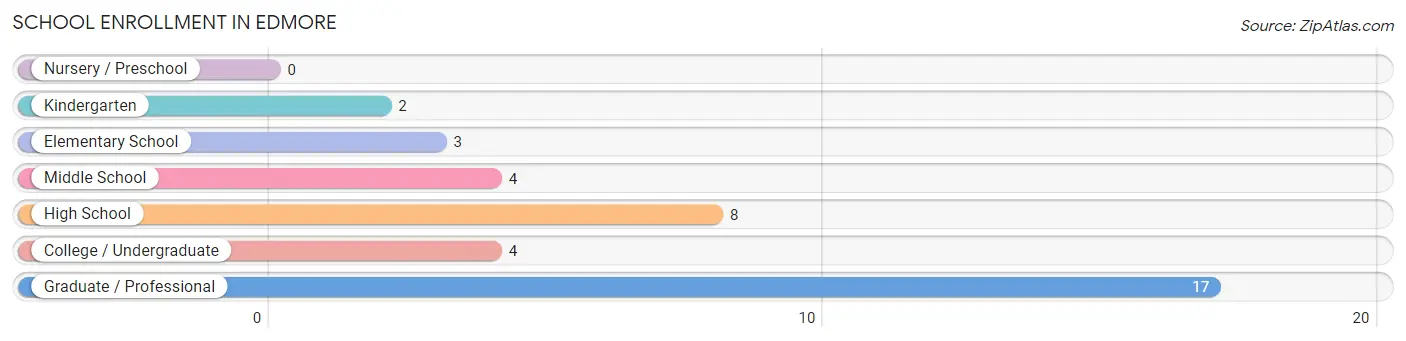
| School Level | # Students | % Students |
| Nursery / Preschool | 0 | 0.0% |
| Kindergarten | 2 | 5.3% |
| Elementary School | 3 | 7.9% |
| Middle School | 4 | 10.5% |
| High School | 8 | 21.0% |
| College / Undergraduate | 4 | 10.5% |
| Graduate / Professional | 17 | 44.7% |
| Total | 38 | 100.0% |
School Enrollment by Age by Funding Source in Edmore
Out of a total of 38 students who are enrolled in schools in Edmore, 1 (2.6%) attend a private institution, while the remaining 37 (97.4%) are enrolled in public schools. The age group of 5 to 9 year old has the highest likelihood of being enrolled in private schools, with 1 (20.0% in the age bracket) enrolled. Conversely, the age group of 10 to 14 year olds has the lowest likelihood of being enrolled in a private school, with 4 (100.0% in the age bracket) attending a public institution.
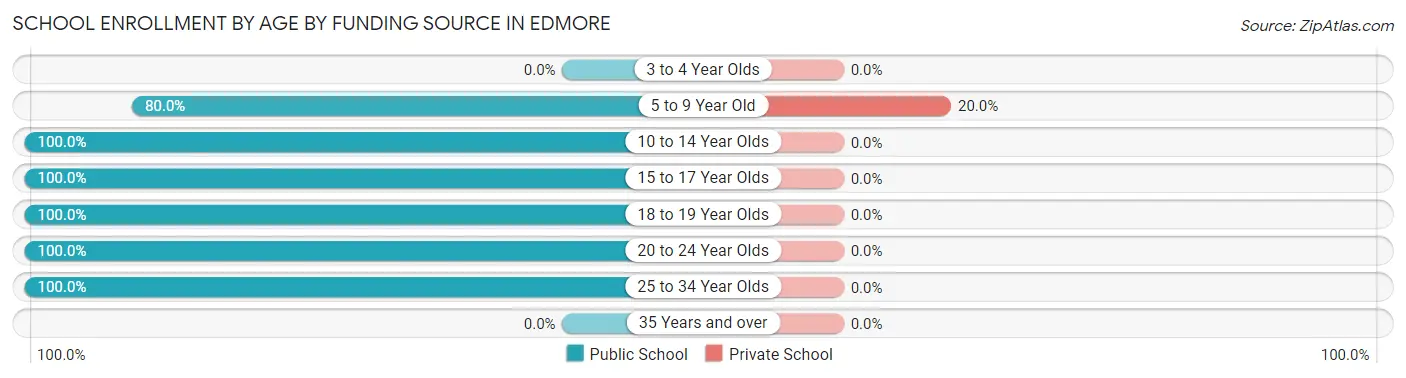
| Age Bracket | Public School | Private School |
| 3 to 4 Year Olds | 0 (0.0%) | 0 (0.0%) |
| 5 to 9 Year Old | 4 (80.0%) | 1 (20.0%) |
| 10 to 14 Year Olds | 4 (100.0%) | 0 (0.0%) |
| 15 to 17 Year Olds | 4 (100.0%) | 0 (0.0%) |
| 18 to 19 Year Olds | 4 (100.0%) | 0 (0.0%) |
| 20 to 24 Year Olds | 20 (100.0%) | 0 (0.0%) |
| 25 to 34 Year Olds | 1 (100.0%) | 0 (0.0%) |
| 35 Years and over | 0 (0.0%) | 0 (0.0%) |
| Total | 37 (97.4%) | 1 (2.6%) |
Educational Attainment by Field of Study in Edmore
Liberal arts & history (73 | 44.0%), literature & languages (72 | 43.4%), bio, nature & agricultural (7 | 4.2%), education (7 | 4.2%), and science & technology (4 | 2.4%) are the most common fields of study among 166 individuals in Edmore who have obtained a bachelor's degree or higher.
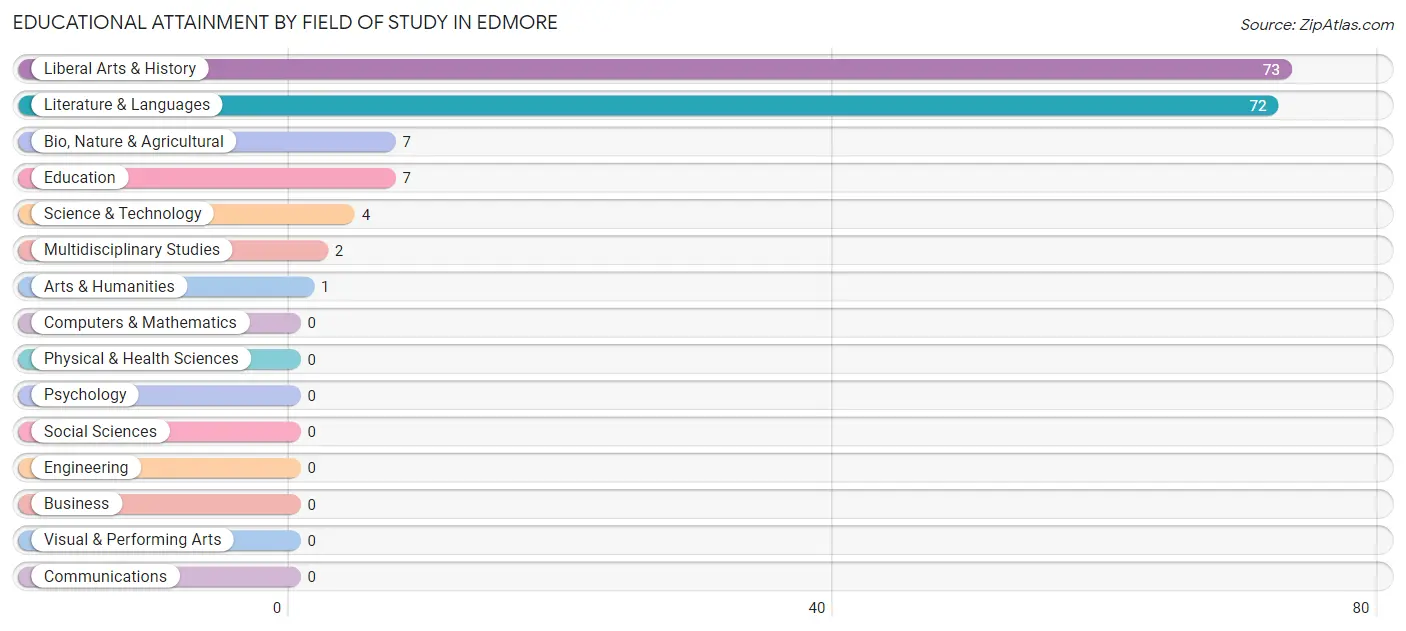
| Field of Study | # Graduates | % Graduates |
| Computers & Mathematics | 0 | 0.0% |
| Bio, Nature & Agricultural | 7 | 4.2% |
| Physical & Health Sciences | 0 | 0.0% |
| Psychology | 0 | 0.0% |
| Social Sciences | 0 | 0.0% |
| Engineering | 0 | 0.0% |
| Multidisciplinary Studies | 2 | 1.2% |
| Science & Technology | 4 | 2.4% |
| Business | 0 | 0.0% |
| Education | 7 | 4.2% |
| Literature & Languages | 72 | 43.4% |
| Liberal Arts & History | 73 | 44.0% |
| Visual & Performing Arts | 0 | 0.0% |
| Communications | 0 | 0.0% |
| Arts & Humanities | 1 | 0.6% |
| Total | 166 | 100.0% |
Transportation & Commute in Edmore
Vehicle Availability by Sex in Edmore
The most prevalent vehicle ownership categories in Edmore are males with 4 vehicles (76, accounting for 67.3%) and females with 4 vehicles (3, making up 211.1%).
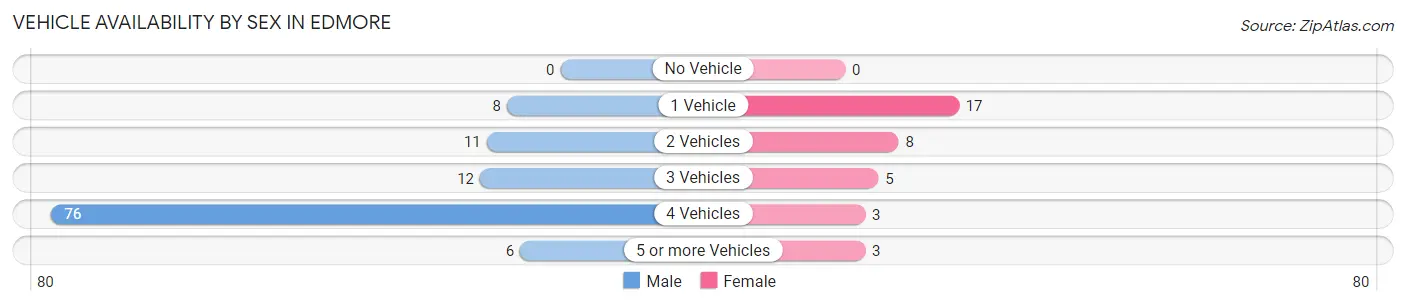
| Vehicles Available | Male | Female |
| No Vehicle | 0 (0.0%) | 0 (0.0%) |
| 1 Vehicle | 8 (7.1%) | 17 (47.2%) |
| 2 Vehicles | 11 (9.7%) | 8 (22.2%) |
| 3 Vehicles | 12 (10.6%) | 5 (13.9%) |
| 4 Vehicles | 76 (67.3%) | 3 (8.3%) |
| 5 or more Vehicles | 6 (5.3%) | 3 (8.3%) |
| Total | 113 (100.0%) | 36 (100.0%) |
Commute Time in Edmore
The most frequently occuring commute durations in Edmore are 5 to 9 minutes (81 commuters, 55.9%), 10 to 14 minutes (22 commuters, 15.2%), and 45 to 59 minutes (18 commuters, 12.4%).
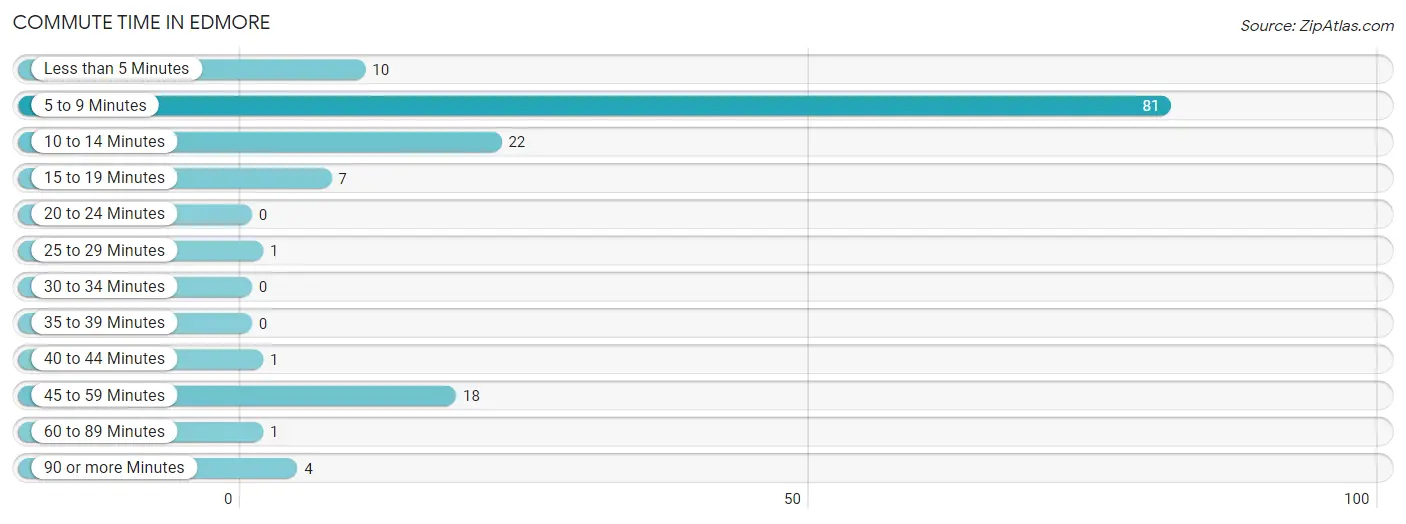
| Commute Time | # Commuters | % Commuters |
| Less than 5 Minutes | 10 | 6.9% |
| 5 to 9 Minutes | 81 | 55.9% |
| 10 to 14 Minutes | 22 | 15.2% |
| 15 to 19 Minutes | 7 | 4.8% |
| 20 to 24 Minutes | 0 | 0.0% |
| 25 to 29 Minutes | 1 | 0.7% |
| 30 to 34 Minutes | 0 | 0.0% |
| 35 to 39 Minutes | 0 | 0.0% |
| 40 to 44 Minutes | 1 | 0.7% |
| 45 to 59 Minutes | 18 | 12.4% |
| 60 to 89 Minutes | 1 | 0.7% |
| 90 or more Minutes | 4 | 2.8% |
Commute Time by Sex in Edmore
The most common commute times in Edmore are 5 to 9 minutes (76 commuters, 69.1%) for males and 10 to 14 minutes (16 commuters, 45.7%) for females.
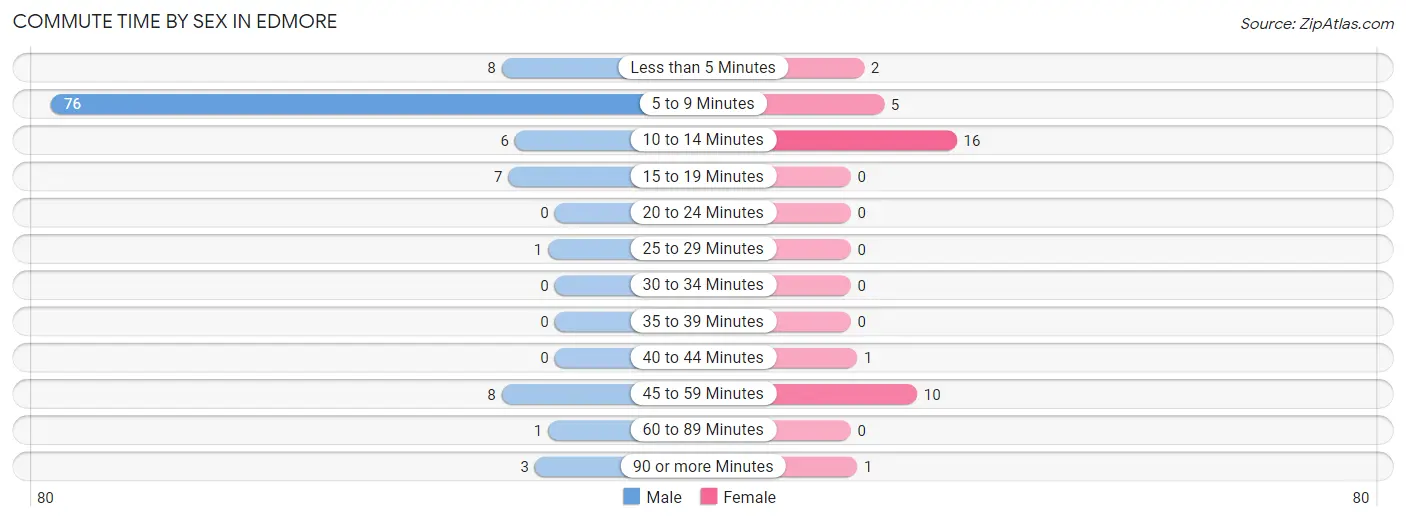
| Commute Time | Male | Female |
| Less than 5 Minutes | 8 (7.3%) | 2 (5.7%) |
| 5 to 9 Minutes | 76 (69.1%) | 5 (14.3%) |
| 10 to 14 Minutes | 6 (5.4%) | 16 (45.7%) |
| 15 to 19 Minutes | 7 (6.4%) | 0 (0.0%) |
| 20 to 24 Minutes | 0 (0.0%) | 0 (0.0%) |
| 25 to 29 Minutes | 1 (0.9%) | 0 (0.0%) |
| 30 to 34 Minutes | 0 (0.0%) | 0 (0.0%) |
| 35 to 39 Minutes | 0 (0.0%) | 0 (0.0%) |
| 40 to 44 Minutes | 0 (0.0%) | 1 (2.9%) |
| 45 to 59 Minutes | 8 (7.3%) | 10 (28.6%) |
| 60 to 89 Minutes | 1 (0.9%) | 0 (0.0%) |
| 90 or more Minutes | 3 (2.7%) | 1 (2.9%) |
Time of Departure to Work by Sex in Edmore
The most frequent times of departure to work in Edmore are 10:00 AM to 10:59 AM (72, 65.4%) for males and 7:00 AM to 7:29 AM (19, 54.3%) for females.
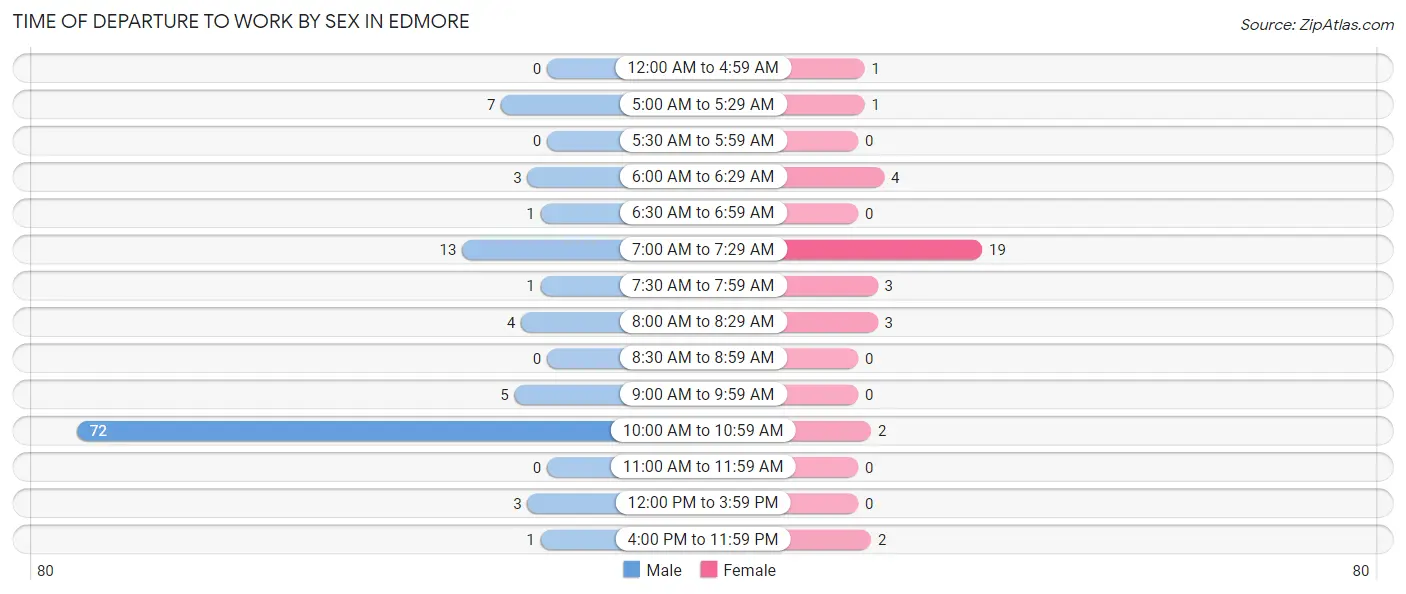
| Time of Departure | Male | Female |
| 12:00 AM to 4:59 AM | 0 (0.0%) | 1 (2.9%) |
| 5:00 AM to 5:29 AM | 7 (6.4%) | 1 (2.9%) |
| 5:30 AM to 5:59 AM | 0 (0.0%) | 0 (0.0%) |
| 6:00 AM to 6:29 AM | 3 (2.7%) | 4 (11.4%) |
| 6:30 AM to 6:59 AM | 1 (0.9%) | 0 (0.0%) |
| 7:00 AM to 7:29 AM | 13 (11.8%) | 19 (54.3%) |
| 7:30 AM to 7:59 AM | 1 (0.9%) | 3 (8.6%) |
| 8:00 AM to 8:29 AM | 4 (3.6%) | 3 (8.6%) |
| 8:30 AM to 8:59 AM | 0 (0.0%) | 0 (0.0%) |
| 9:00 AM to 9:59 AM | 5 (4.5%) | 0 (0.0%) |
| 10:00 AM to 10:59 AM | 72 (65.4%) | 2 (5.7%) |
| 11:00 AM to 11:59 AM | 0 (0.0%) | 0 (0.0%) |
| 12:00 PM to 3:59 PM | 3 (2.7%) | 0 (0.0%) |
| 4:00 PM to 11:59 PM | 1 (0.9%) | 2 (5.7%) |
| Total | 110 (100.0%) | 35 (100.0%) |
Housing Occupancy in Edmore
Occupancy by Ownership in Edmore
Of the total 197 dwellings in Edmore, owner-occupied units account for 117 (59.4%), while renter-occupied units make up 80 (40.6%).
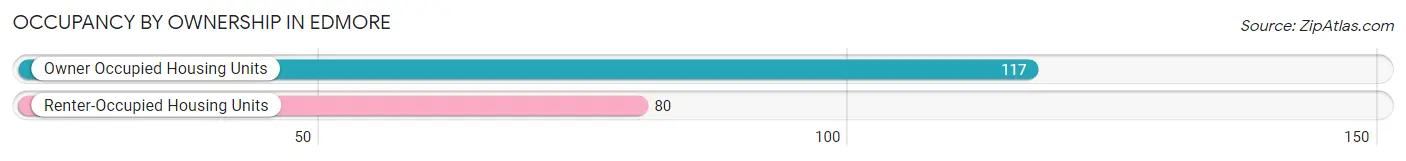
| Occupancy | # Housing Units | % Housing Units |
| Owner Occupied Housing Units | 117 | 59.4% |
| Renter-Occupied Housing Units | 80 | 40.6% |
| Total Occupied Housing Units | 197 | 100.0% |
Occupancy by Household Size in Edmore
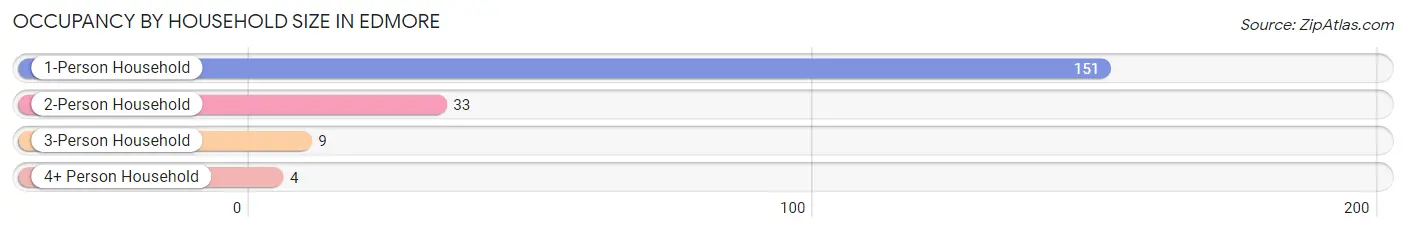
| Household Size | # Housing Units | % Housing Units |
| 1-Person Household | 151 | 76.6% |
| 2-Person Household | 33 | 16.8% |
| 3-Person Household | 9 | 4.6% |
| 4+ Person Household | 4 | 2.0% |
| Total Housing Units | 197 | 100.0% |
Occupancy by Ownership by Household Size in Edmore
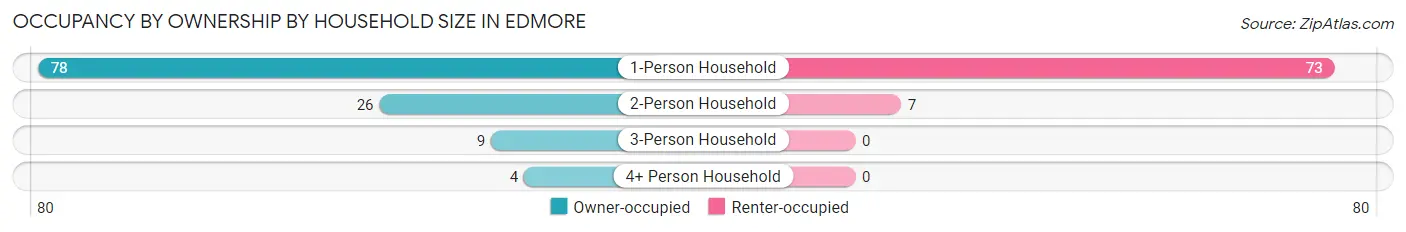
| Household Size | Owner-occupied | Renter-occupied |
| 1-Person Household | 78 (51.7%) | 73 (48.3%) |
| 2-Person Household | 26 (78.8%) | 7 (21.2%) |
| 3-Person Household | 9 (100.0%) | 0 (0.0%) |
| 4+ Person Household | 4 (100.0%) | 0 (0.0%) |
| Total Housing Units | 117 (59.4%) | 80 (40.6%) |
Occupancy by Educational Attainment in Edmore
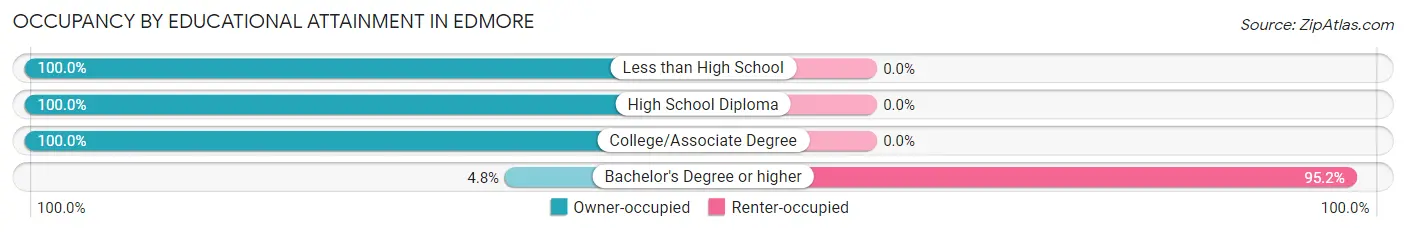
| Household Size | Owner-occupied | Renter-occupied |
| Less than High School | 54 (100.0%) | 0 (0.0%) |
| High School Diploma | 29 (100.0%) | 0 (0.0%) |
| College/Associate Degree | 30 (100.0%) | 0 (0.0%) |
| Bachelor's Degree or higher | 4 (4.8%) | 80 (95.2%) |
Occupancy by Age of Householder in Edmore
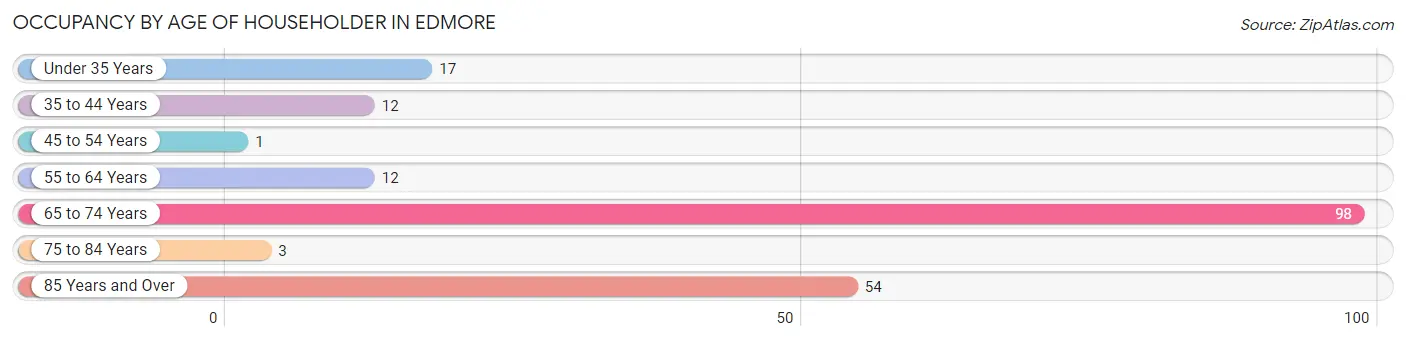
| Age Bracket | # Households | % Households |
| Under 35 Years | 17 | 8.6% |
| 35 to 44 Years | 12 | 6.1% |
| 45 to 54 Years | 1 | 0.5% |
| 55 to 64 Years | 12 | 6.1% |
| 65 to 74 Years | 98 | 49.7% |
| 75 to 84 Years | 3 | 1.5% |
| 85 Years and Over | 54 | 27.4% |
| Total | 197 | 100.0% |
Housing Finances in Edmore
Median Income by Occupancy in Edmore
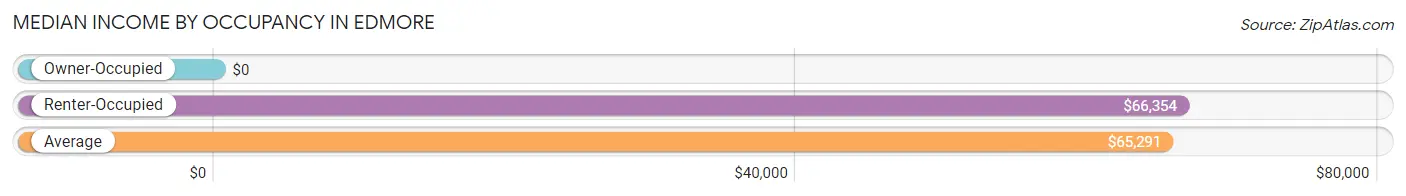
| Occupancy Type | # Households | Median Income |
| Owner-Occupied | 117 (59.4%) | $0 |
| Renter-Occupied | 80 (40.6%) | $66,354 |
| Average | 197 (100.0%) | $65,291 |
Occupancy by Householder Income Bracket in Edmore
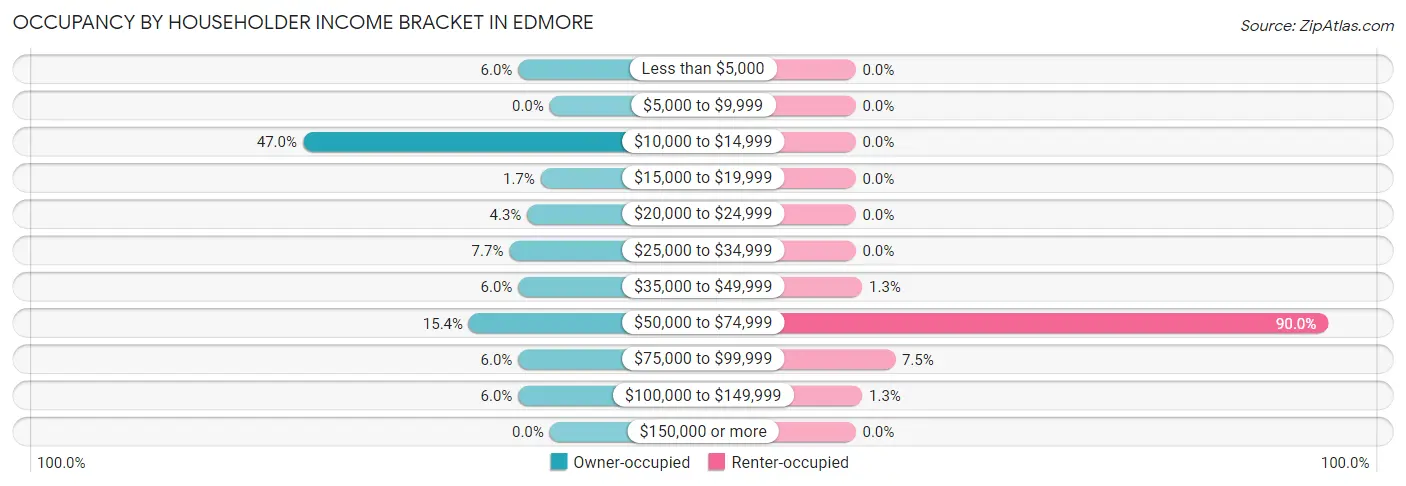
| Income Bracket | Owner-occupied | Renter-occupied |
| Less than $5,000 | 7 (6.0%) | 0 (0.0%) |
| $5,000 to $9,999 | 0 (0.0%) | 0 (0.0%) |
| $10,000 to $14,999 | 55 (47.0%) | 0 (0.0%) |
| $15,000 to $19,999 | 2 (1.7%) | 0 (0.0%) |
| $20,000 to $24,999 | 5 (4.3%) | 0 (0.0%) |
| $25,000 to $34,999 | 9 (7.7%) | 0 (0.0%) |
| $35,000 to $49,999 | 7 (6.0%) | 1 (1.3%) |
| $50,000 to $74,999 | 18 (15.4%) | 72 (90.0%) |
| $75,000 to $99,999 | 7 (6.0%) | 6 (7.5%) |
| $100,000 to $149,999 | 7 (6.0%) | 1 (1.3%) |
| $150,000 or more | 0 (0.0%) | 0 (0.0%) |
| Total | 117 (100.0%) | 80 (100.0%) |
Monthly Housing Cost Tiers in Edmore
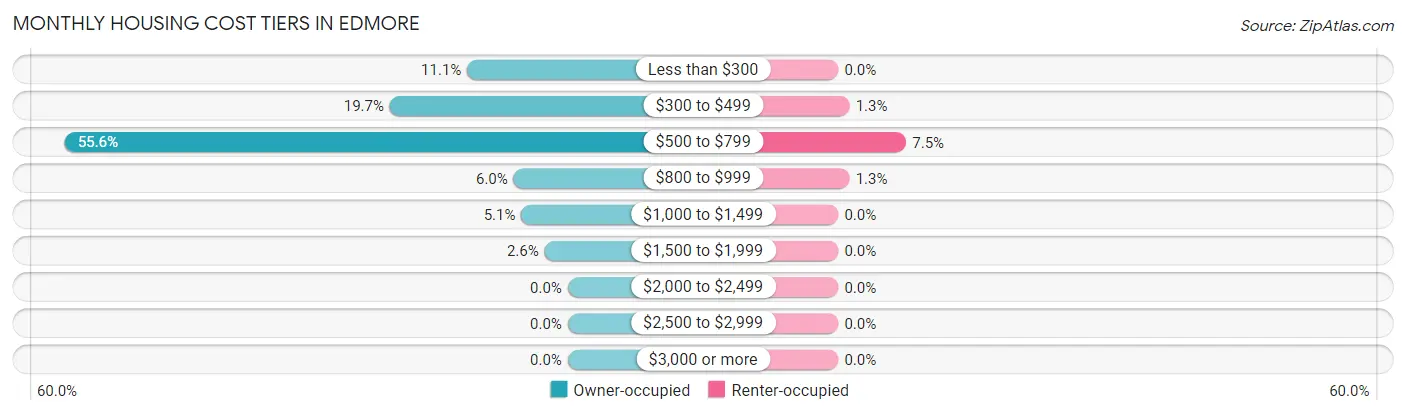
| Monthly Cost | Owner-occupied | Renter-occupied |
| Less than $300 | 13 (11.1%) | 0 (0.0%) |
| $300 to $499 | 23 (19.7%) | 1 (1.3%) |
| $500 to $799 | 65 (55.6%) | 6 (7.5%) |
| $800 to $999 | 7 (6.0%) | 1 (1.3%) |
| $1,000 to $1,499 | 6 (5.1%) | 0 (0.0%) |
| $1,500 to $1,999 | 3 (2.6%) | 0 (0.0%) |
| $2,000 to $2,499 | 0 (0.0%) | 0 (0.0%) |
| $2,500 to $2,999 | 0 (0.0%) | 0 (0.0%) |
| $3,000 or more | 0 (0.0%) | 0 (0.0%) |
| Total | 117 (100.0%) | 80 (100.0%) |
Physical Housing Characteristics in Edmore
Housing Structures in Edmore
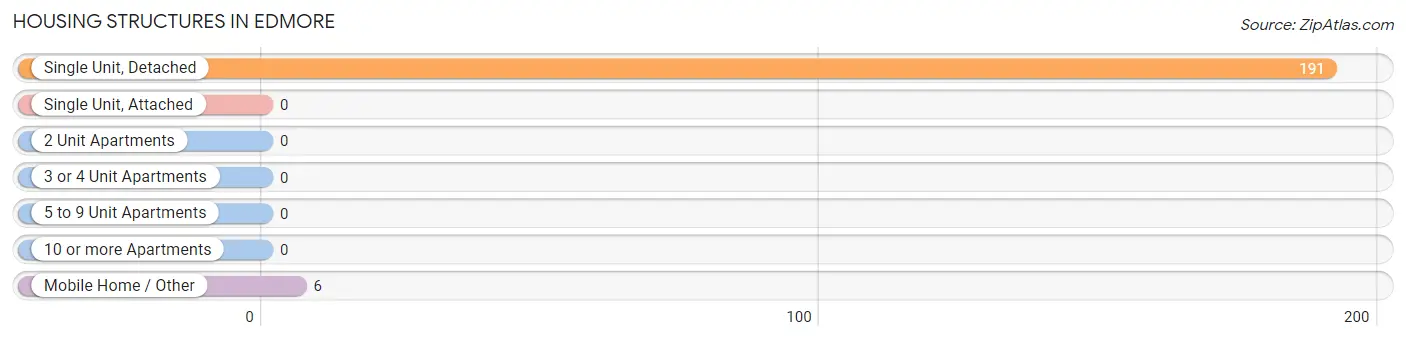
| Structure Type | # Housing Units | % Housing Units |
| Single Unit, Detached | 191 | 97.0% |
| Single Unit, Attached | 0 | 0.0% |
| 2 Unit Apartments | 0 | 0.0% |
| 3 or 4 Unit Apartments | 0 | 0.0% |
| 5 to 9 Unit Apartments | 0 | 0.0% |
| 10 or more Apartments | 0 | 0.0% |
| Mobile Home / Other | 6 | 3.0% |
| Total | 197 | 100.0% |
Housing Structures by Occupancy in Edmore
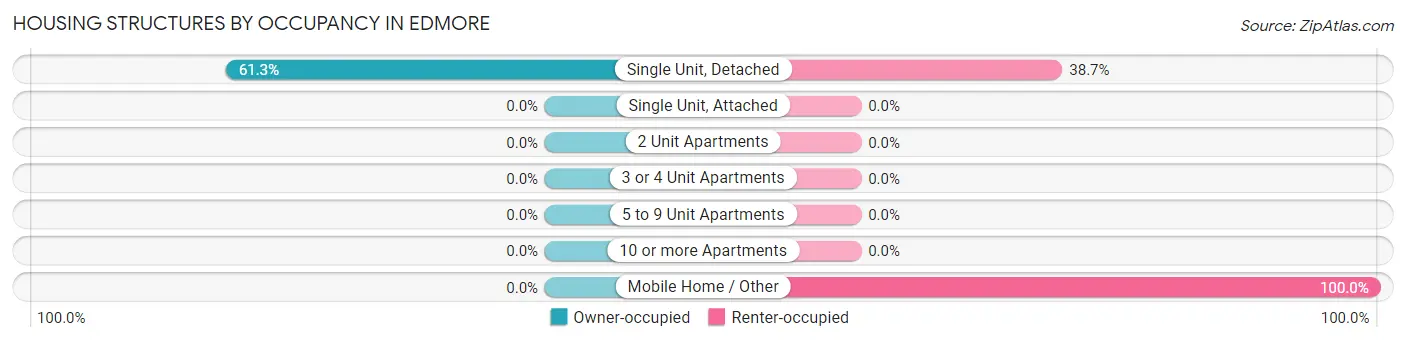
| Structure Type | Owner-occupied | Renter-occupied |
| Single Unit, Detached | 117 (61.3%) | 74 (38.7%) |
| Single Unit, Attached | 0 (0.0%) | 0 (0.0%) |
| 2 Unit Apartments | 0 (0.0%) | 0 (0.0%) |
| 3 or 4 Unit Apartments | 0 (0.0%) | 0 (0.0%) |
| 5 to 9 Unit Apartments | 0 (0.0%) | 0 (0.0%) |
| 10 or more Apartments | 0 (0.0%) | 0 (0.0%) |
| Mobile Home / Other | 0 (0.0%) | 6 (100.0%) |
| Total | 117 (59.4%) | 80 (40.6%) |
Housing Structures by Number of Rooms in Edmore
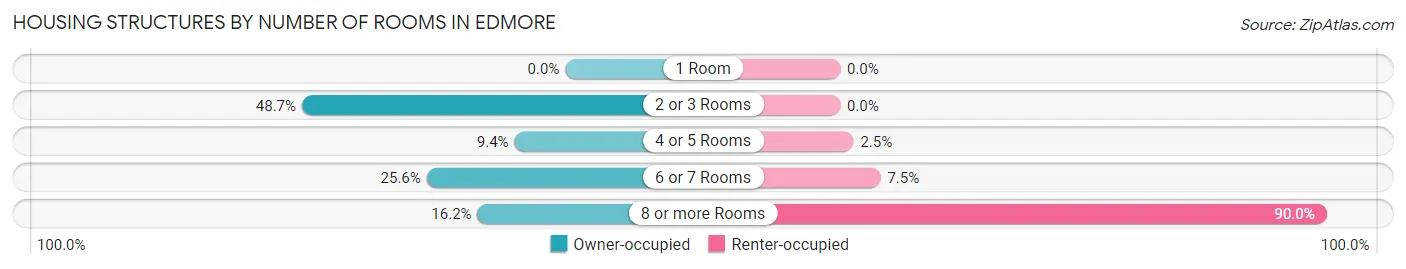
| Number of Rooms | Owner-occupied | Renter-occupied |
| 1 Room | 0 (0.0%) | 0 (0.0%) |
| 2 or 3 Rooms | 57 (48.7%) | 0 (0.0%) |
| 4 or 5 Rooms | 11 (9.4%) | 2 (2.5%) |
| 6 or 7 Rooms | 30 (25.6%) | 6 (7.5%) |
| 8 or more Rooms | 19 (16.2%) | 72 (90.0%) |
| Total | 117 (100.0%) | 80 (100.0%) |
Housing Structure by Heating Type in Edmore
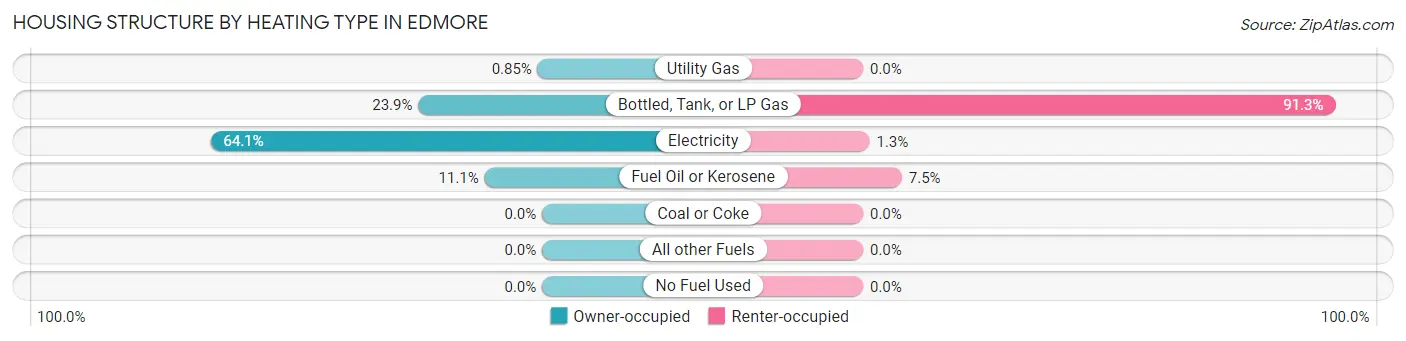
| Heating Type | Owner-occupied | Renter-occupied |
| Utility Gas | 1 (0.9%) | 0 (0.0%) |
| Bottled, Tank, or LP Gas | 28 (23.9%) | 73 (91.2%) |
| Electricity | 75 (64.1%) | 1 (1.3%) |
| Fuel Oil or Kerosene | 13 (11.1%) | 6 (7.5%) |
| Coal or Coke | 0 (0.0%) | 0 (0.0%) |
| All other Fuels | 0 (0.0%) | 0 (0.0%) |
| No Fuel Used | 0 (0.0%) | 0 (0.0%) |
| Total | 117 (100.0%) | 80 (100.0%) |
Household Vehicle Usage in Edmore
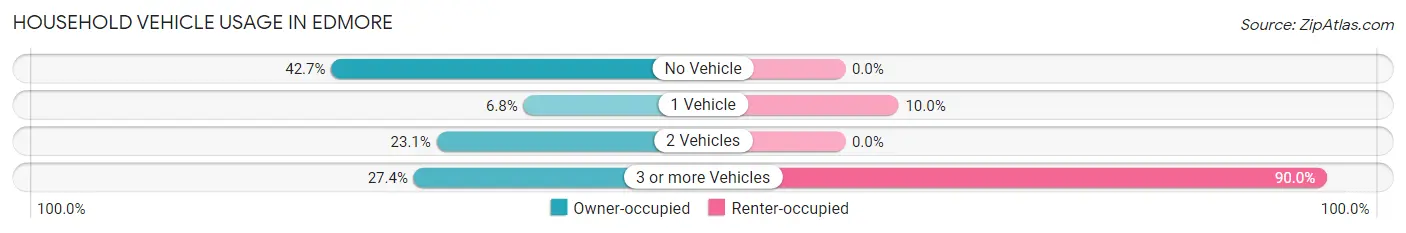
| Vehicles per Household | Owner-occupied | Renter-occupied |
| No Vehicle | 50 (42.7%) | 0 (0.0%) |
| 1 Vehicle | 8 (6.8%) | 8 (10.0%) |
| 2 Vehicles | 27 (23.1%) | 0 (0.0%) |
| 3 or more Vehicles | 32 (27.4%) | 72 (90.0%) |
| Total | 117 (100.0%) | 80 (100.0%) |
Real Estate & Mortgages in Edmore
Real Estate and Mortgage Overview in Edmore
| Characteristic | Without Mortgage | With Mortgage |
| Housing Units | 106 | 11 |
| Median Property Value | $80,400 | $72,500 |
| Median Household Income | - | - |
| Monthly Housing Costs | $533 | $0 |
| Real Estate Taxes | $482 | $0 |
Property Value by Mortgage Status in Edmore
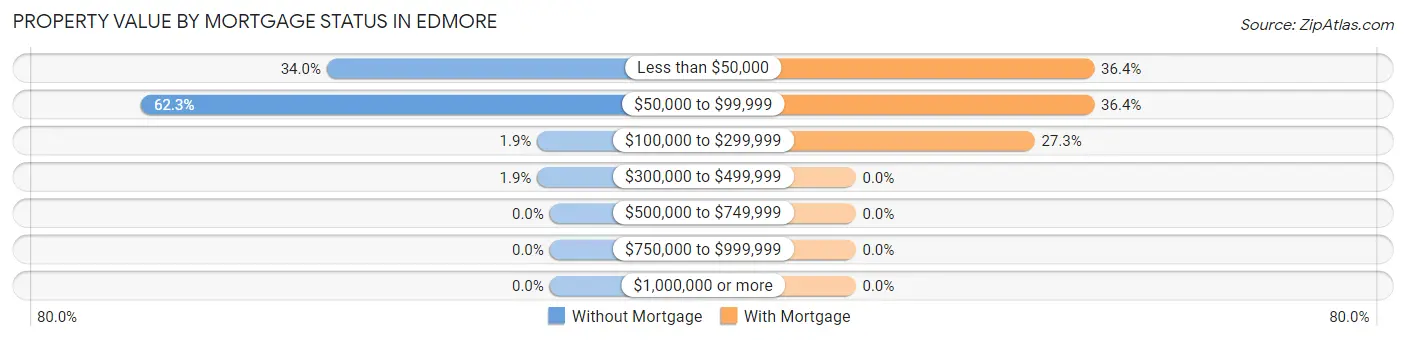
| Property Value | Without Mortgage | With Mortgage |
| Less than $50,000 | 36 (34.0%) | 4 (36.4%) |
| $50,000 to $99,999 | 66 (62.3%) | 4 (36.4%) |
| $100,000 to $299,999 | 2 (1.9%) | 3 (27.3%) |
| $300,000 to $499,999 | 2 (1.9%) | 0 (0.0%) |
| $500,000 to $749,999 | 0 (0.0%) | 0 (0.0%) |
| $750,000 to $999,999 | 0 (0.0%) | 0 (0.0%) |
| $1,000,000 or more | 0 (0.0%) | 0 (0.0%) |
| Total | 106 (100.0%) | 11 (100.0%) |
Household Income by Mortgage Status in Edmore
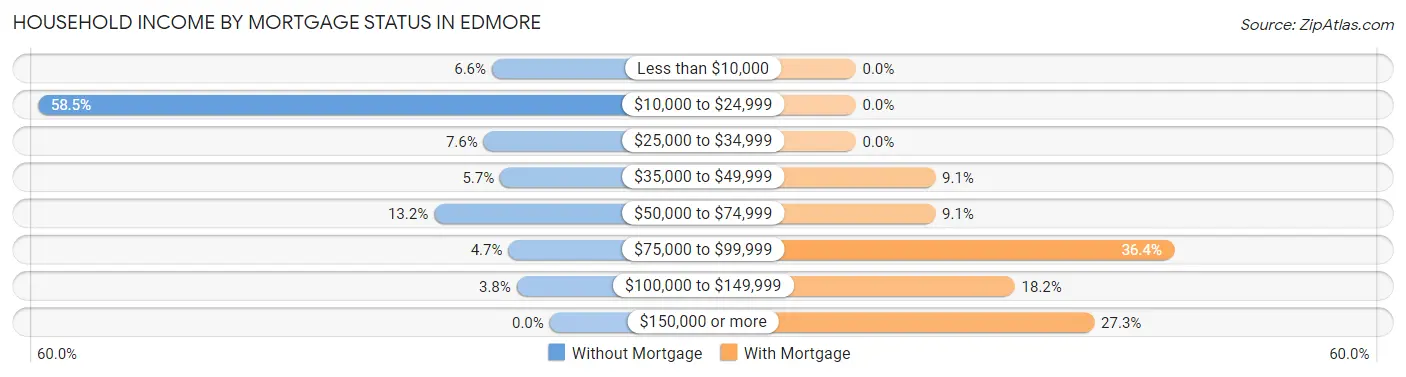
| Household Income | Without Mortgage | With Mortgage |
| Less than $10,000 | 7 (6.6%) | 0 (0.0%) |
| $10,000 to $24,999 | 62 (58.5%) | 0 (0.0%) |
| $25,000 to $34,999 | 8 (7.5%) | 0 (0.0%) |
| $35,000 to $49,999 | 6 (5.7%) | 1 (9.1%) |
| $50,000 to $74,999 | 14 (13.2%) | 1 (9.1%) |
| $75,000 to $99,999 | 5 (4.7%) | 4 (36.4%) |
| $100,000 to $149,999 | 4 (3.8%) | 2 (18.2%) |
| $150,000 or more | 0 (0.0%) | 3 (27.3%) |
| Total | 106 (100.0%) | 11 (100.0%) |
Property Value to Household Income Ratio in Edmore
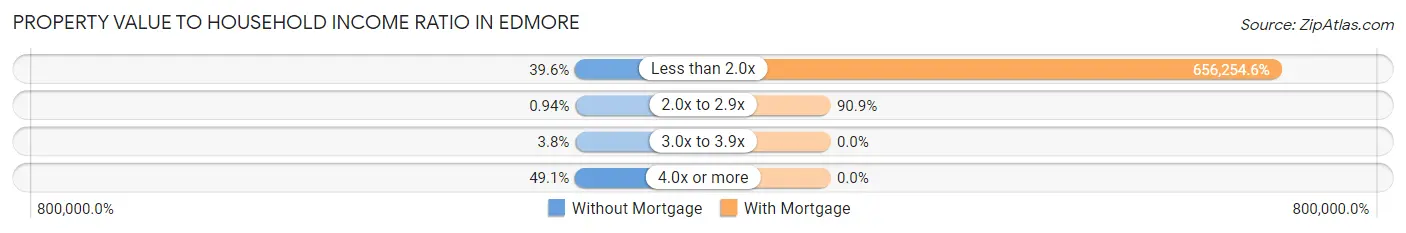
| Value-to-Income Ratio | Without Mortgage | With Mortgage |
| Less than 2.0x | 42 (39.6%) | 72,188 (656,254.6%) |
| 2.0x to 2.9x | 1 (0.9%) | 10 (90.9%) |
| 3.0x to 3.9x | 4 (3.8%) | 0 (0.0%) |
| 4.0x or more | 52 (49.1%) | 0 (0.0%) |
| Total | 106 (100.0%) | 11 (100.0%) |
Real Estate Taxes by Mortgage Status in Edmore
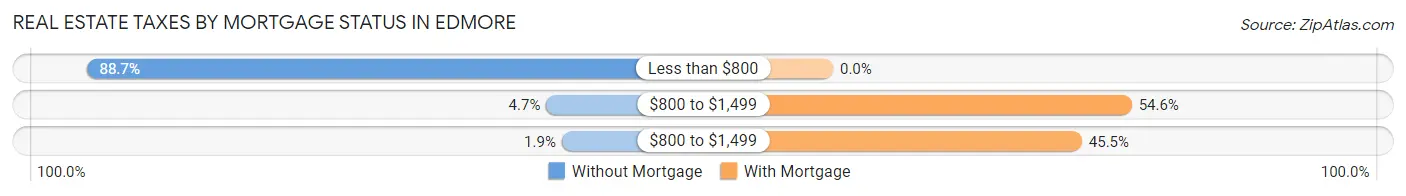
| Property Taxes | Without Mortgage | With Mortgage |
| Less than $800 | 94 (88.7%) | 0 (0.0%) |
| $800 to $1,499 | 5 (4.7%) | 6 (54.5%) |
| $800 to $1,499 | 2 (1.9%) | 5 (45.5%) |
| Total | 106 (100.0%) | 11 (100.0%) |
Health & Disability in Edmore
Health Insurance Coverage by Age in Edmore
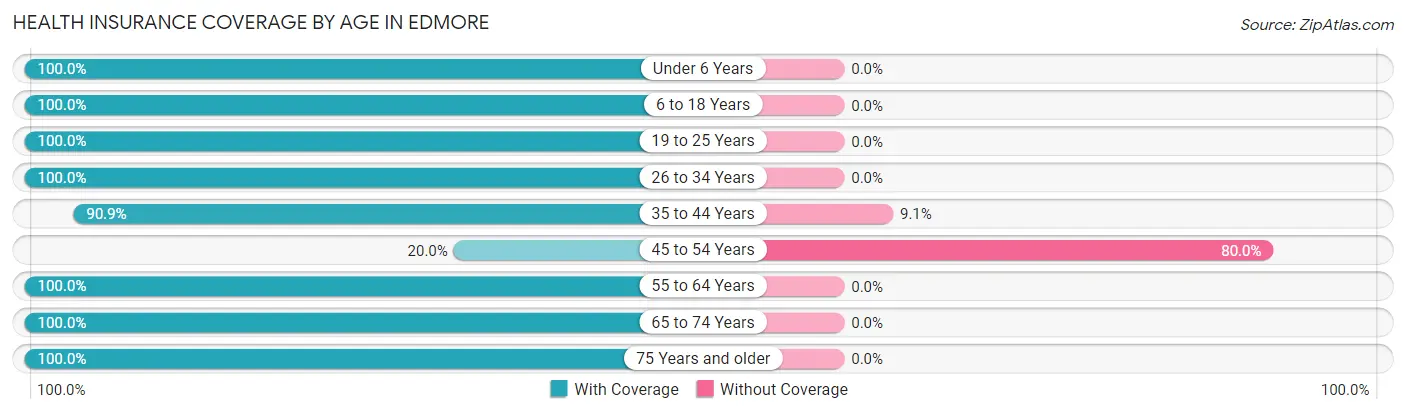
| Age Bracket | With Coverage | Without Coverage |
| Under 6 Years | 3 (100.0%) | 0 (0.0%) |
| 6 to 18 Years | 18 (100.0%) | 0 (0.0%) |
| 19 to 25 Years | 35 (100.0%) | 0 (0.0%) |
| 26 to 34 Years | 5 (100.0%) | 0 (0.0%) |
| 35 to 44 Years | 20 (90.9%) | 2 (9.1%) |
| 45 to 54 Years | 1 (20.0%) | 4 (80.0%) |
| 55 to 64 Years | 18 (100.0%) | 0 (0.0%) |
| 65 to 74 Years | 105 (100.0%) | 0 (0.0%) |
| 75 Years and older | 61 (100.0%) | 0 (0.0%) |
| Total | 266 (97.8%) | 6 (2.2%) |
Health Insurance Coverage by Citizenship Status in Edmore
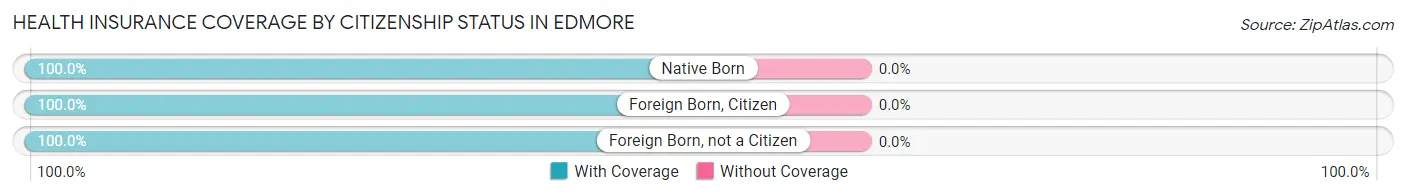
| Citizenship Status | With Coverage | Without Coverage |
| Native Born | 3 (100.0%) | 0 (0.0%) |
| Foreign Born, Citizen | 18 (100.0%) | 0 (0.0%) |
| Foreign Born, not a Citizen | 35 (100.0%) | 0 (0.0%) |
Health Insurance Coverage by Household Income in Edmore
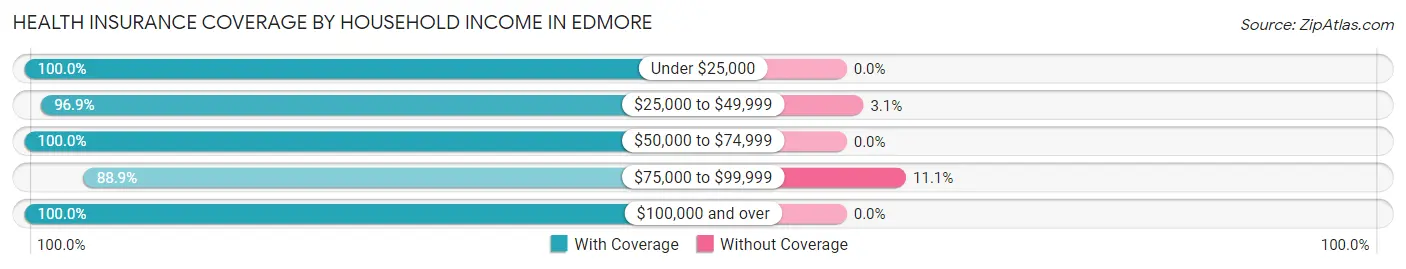
| Household Income | With Coverage | Without Coverage |
| Under $25,000 | 71 (100.0%) | 0 (0.0%) |
| $25,000 to $49,999 | 31 (96.9%) | 1 (3.1%) |
| $50,000 to $74,999 | 102 (100.0%) | 0 (0.0%) |
| $75,000 to $99,999 | 40 (88.9%) | 5 (11.1%) |
| $100,000 and over | 22 (100.0%) | 0 (0.0%) |
Public vs Private Health Insurance Coverage by Age in Edmore
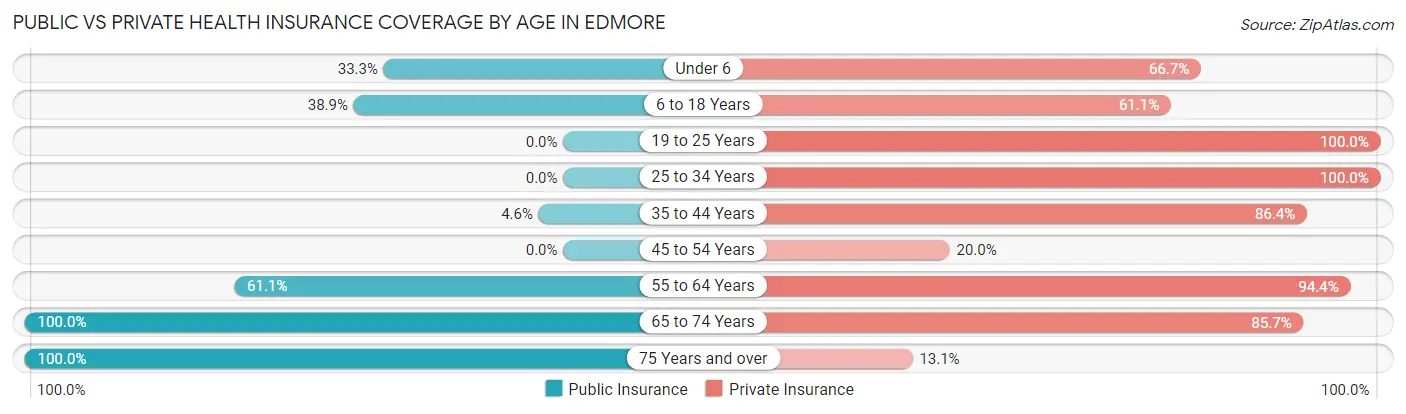
| Age Bracket | Public Insurance | Private Insurance |
| Under 6 | 1 (33.3%) | 2 (66.7%) |
| 6 to 18 Years | 7 (38.9%) | 11 (61.1%) |
| 19 to 25 Years | 0 (0.0%) | 35 (100.0%) |
| 25 to 34 Years | 0 (0.0%) | 5 (100.0%) |
| 35 to 44 Years | 1 (4.5%) | 19 (86.4%) |
| 45 to 54 Years | 0 (0.0%) | 1 (20.0%) |
| 55 to 64 Years | 11 (61.1%) | 17 (94.4%) |
| 65 to 74 Years | 105 (100.0%) | 90 (85.7%) |
| 75 Years and over | 61 (100.0%) | 8 (13.1%) |
| Total | 186 (68.4%) | 188 (69.1%) |
Disability Status by Sex by Age in Edmore
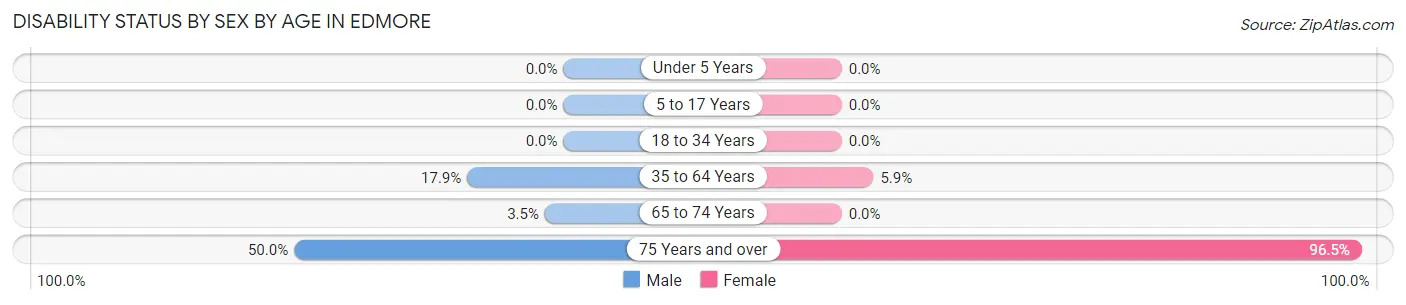
| Age Bracket | Male | Female |
| Under 5 Years | 0 (0.0%) | 0 (0.0%) |
| 5 to 17 Years | 0 (0.0%) | 0 (0.0%) |
| 18 to 34 Years | 0 (0.0%) | 0 (0.0%) |
| 35 to 64 Years | 5 (17.9%) | 1 (5.9%) |
| 65 to 74 Years | 3 (3.5%) | 0 (0.0%) |
| 75 Years and over | 2 (50.0%) | 55 (96.5%) |
Disability Class by Sex by Age in Edmore
Disability Class: Hearing Difficulty
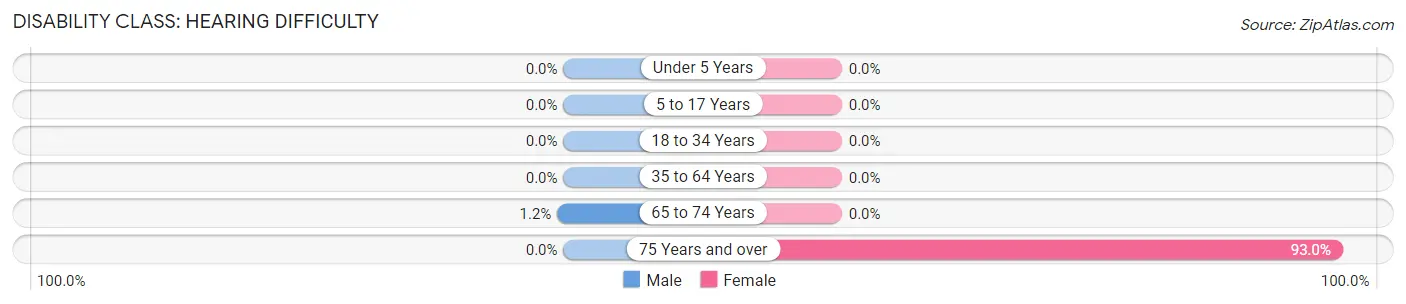
| Age Bracket | Male | Female |
| Under 5 Years | 0 (0.0%) | 0 (0.0%) |
| 5 to 17 Years | 0 (0.0%) | 0 (0.0%) |
| 18 to 34 Years | 0 (0.0%) | 0 (0.0%) |
| 35 to 64 Years | 0 (0.0%) | 0 (0.0%) |
| 65 to 74 Years | 1 (1.1%) | 0 (0.0%) |
| 75 Years and over | 0 (0.0%) | 53 (93.0%) |
Disability Class: Vision Difficulty
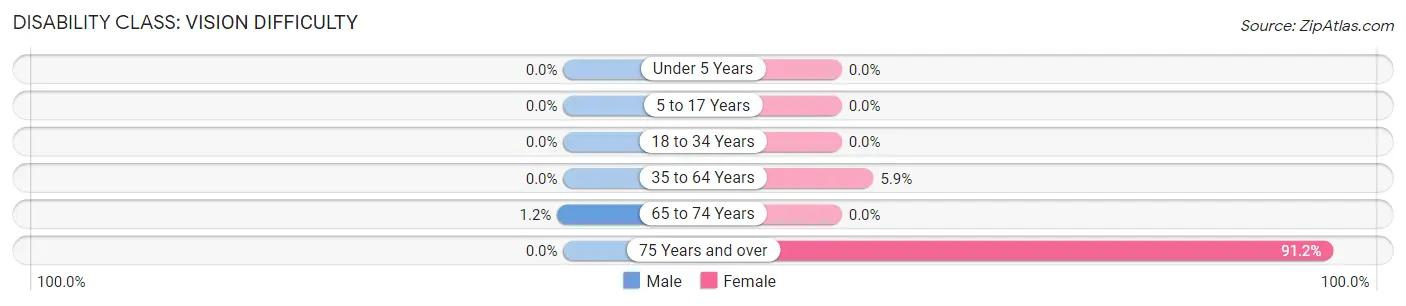
| Age Bracket | Male | Female |
| Under 5 Years | 0 (0.0%) | 0 (0.0%) |
| 5 to 17 Years | 0 (0.0%) | 0 (0.0%) |
| 18 to 34 Years | 0 (0.0%) | 0 (0.0%) |
| 35 to 64 Years | 0 (0.0%) | 1 (5.9%) |
| 65 to 74 Years | 1 (1.1%) | 0 (0.0%) |
| 75 Years and over | 0 (0.0%) | 52 (91.2%) |
Disability Class: Cognitive Difficulty
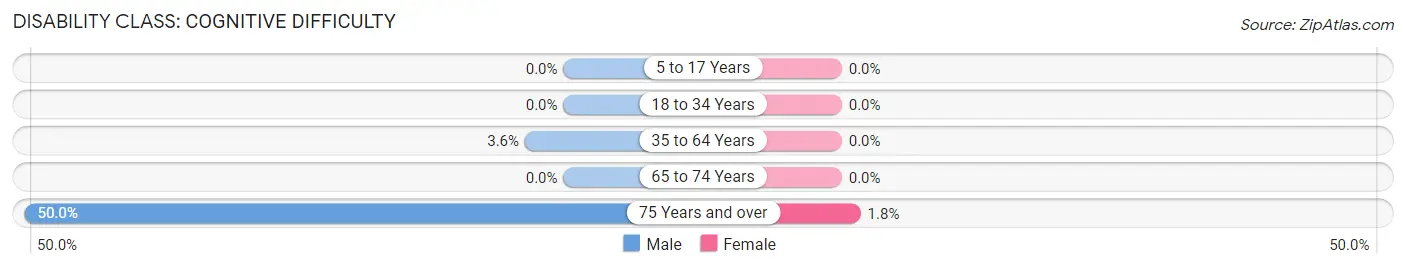
| Age Bracket | Male | Female |
| 5 to 17 Years | 0 (0.0%) | 0 (0.0%) |
| 18 to 34 Years | 0 (0.0%) | 0 (0.0%) |
| 35 to 64 Years | 1 (3.6%) | 0 (0.0%) |
| 65 to 74 Years | 0 (0.0%) | 0 (0.0%) |
| 75 Years and over | 2 (50.0%) | 1 (1.8%) |
Disability Class: Ambulatory Difficulty
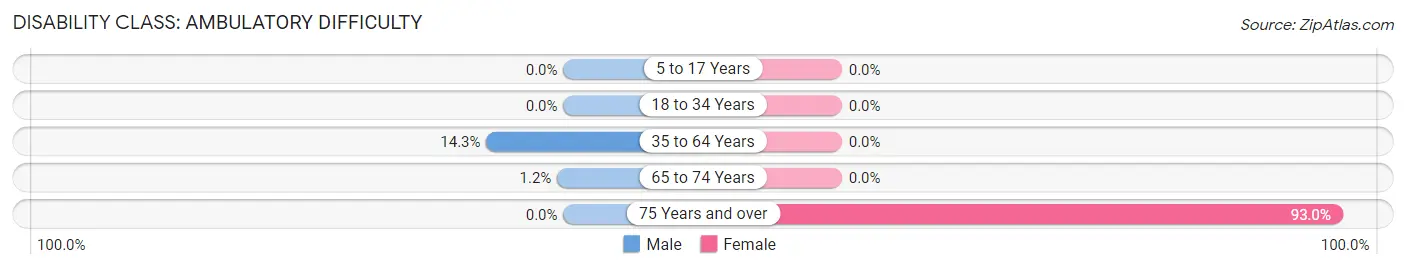
| Age Bracket | Male | Female |
| 5 to 17 Years | 0 (0.0%) | 0 (0.0%) |
| 18 to 34 Years | 0 (0.0%) | 0 (0.0%) |
| 35 to 64 Years | 4 (14.3%) | 0 (0.0%) |
| 65 to 74 Years | 1 (1.1%) | 0 (0.0%) |
| 75 Years and over | 0 (0.0%) | 53 (93.0%) |
Disability Class: Self-Care Difficulty
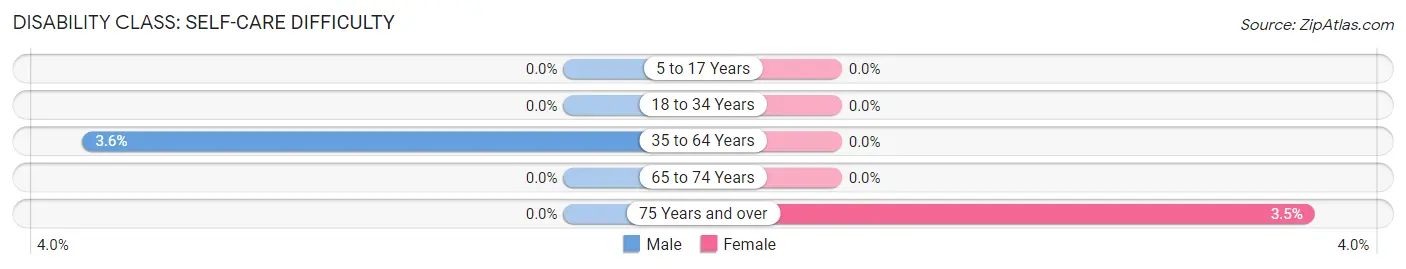
| Age Bracket | Male | Female |
| 5 to 17 Years | 0 (0.0%) | 0 (0.0%) |
| 18 to 34 Years | 0 (0.0%) | 0 (0.0%) |
| 35 to 64 Years | 1 (3.6%) | 0 (0.0%) |
| 65 to 74 Years | 0 (0.0%) | 0 (0.0%) |
| 75 Years and over | 0 (0.0%) | 2 (3.5%) |
Technology Access in Edmore
Computing Device Access in Edmore
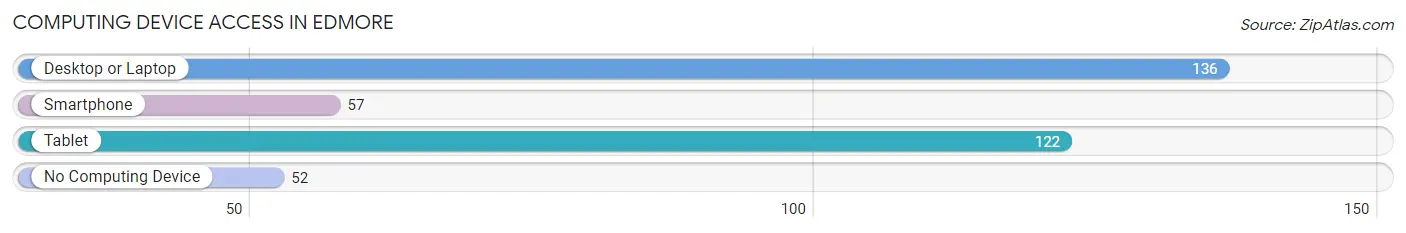
| Device Type | # Households | % Households |
| Desktop or Laptop | 136 | 69.0% |
| Smartphone | 57 | 28.9% |
| Tablet | 122 | 61.9% |
| No Computing Device | 52 | 26.4% |
| Total | 197 | 100.0% |
Internet Access in Edmore
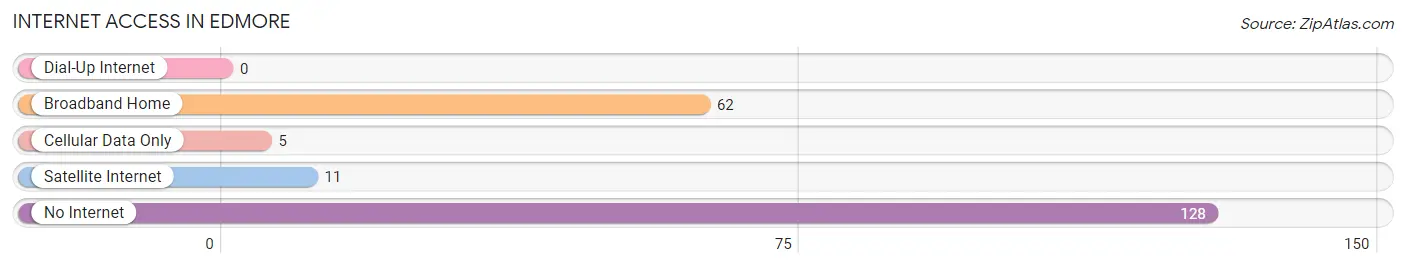
| Internet Type | # Households | % Households |
| Dial-Up Internet | 0 | 0.0% |
| Broadband Home | 62 | 31.5% |
| Cellular Data Only | 5 | 2.5% |
| Satellite Internet | 11 | 5.6% |
| No Internet | 128 | 65.0% |
| Total | 197 | 100.0% |
Edmore Summary
Edmore, North Dakota is a small town located in Ramsey County, in the northeastern part of the state. It is situated on the banks of the Tongue River, and is home to a population of just over 500 people. The town was founded in 1883, and has a rich history of farming, ranching, and small business.
Geography
Edmore is located in the northeastern part of North Dakota, in Ramsey County. It is situated on the banks of the Tongue River, and is surrounded by rolling hills and prairies. The town is located about 25 miles from the Canadian border, and is about an hour and a half drive from the state capital of Bismarck. The town is also close to the Turtle Mountain State Forest, which is a popular destination for outdoor recreation.
Economy
Edmore’s economy is largely based on agriculture and ranching. The town is home to several farms and ranches, which produce a variety of crops and livestock. The town also has a few small businesses, including a grocery store, a hardware store, and a few restaurants. The town is also home to a few manufacturing companies, which produce a variety of products, including furniture, clothing, and automotive parts.
Demographics
As of the 2010 census, Edmore had a population of 517 people. The town is predominantly white, with a small percentage of Native American and African American residents. The median household income in Edmore is $41,250, and the median age is 44. The town has a high rate of homeownership, with over 80% of residents owning their own homes.
Conclusion
Edmore, North Dakota is a small town with a rich history and a vibrant economy. The town is home to a diverse population, and is a popular destination for outdoor recreation. The town is largely based on agriculture and ranching, and is home to several small businesses. Edmore is a great place to live and work, and is a great example of small-town life in North Dakota.
Common Questions
What is Per Capita Income in Edmore?
Per Capita income in Edmore is $34,965.
What is the Median Family Income in Edmore?
Median Family Income in Edmore is $71,667.
What is the Median Household income in Edmore?
Median Household Income in Edmore is $65,291.
What is Income or Wage Gap in Edmore?
Income or Wage Gap in Edmore is 8.6%.
Women in Edmore earn 91.4 cents for every dollar earned by a man.
What is Inequality or Gini Index in Edmore?
Inequality or Gini Index in Edmore is 0.34.
What is the Total Population of Edmore?
Total Population of Edmore is 296.
What is the Total Male Population of Edmore?
Total Male Population of Edmore is 153.
What is the Total Female Population of Edmore?
Total Female Population of Edmore is 143.
What is the Ratio of Males per 100 Females in Edmore?
There are 106.99 Males per 100 Females in Edmore.
What is the Ratio of Females per 100 Males in Edmore?
There are 93.46 Females per 100 Males in Edmore.
What is the Median Population Age in Edmore?
Median Population Age in Edmore is 72.2 Years.
What is the Average Family Size in Edmore
Average Family Size in Edmore is 2.9 People.
What is the Average Household Size in Edmore
Average Household Size in Edmore is 1.4 People.
How Large is the Labor Force in Edmore?
There are 153 People in the Labor Forcein in Edmore.
What is the Percentage of People in the Labor Force in Edmore?
54.1% of People are in the Labor Force in Edmore.
What is the Unemployment Rate in Edmore?
Unemployment Rate in Edmore is 0.7%.