Earnings by Sex by Educational Attainment in Pillsbury
Educational Attainment
Male Income
Female Income
Less than High School
-
-
High School Diploma
-
-
College or Associate's Degree
-
-
Bachelor's Degree
-
-
Graduate Degree
-
-
Total
-
-
Family Income in Pillsbury
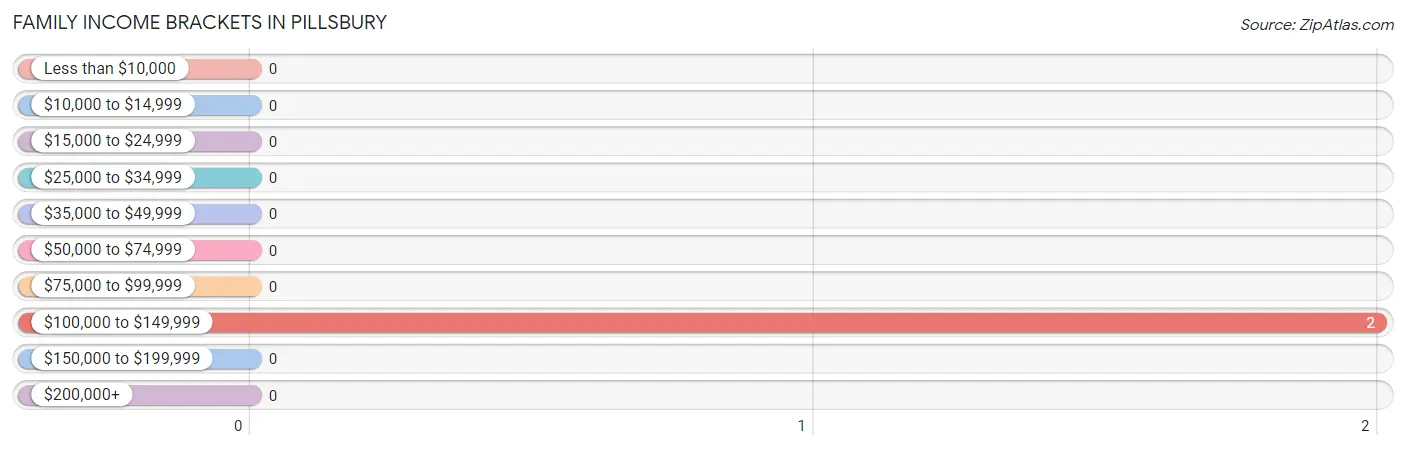
Family Income Brackets in Pillsbury
According to the Pillsbury family income data, there are 2 families falling into the $100,000 to $149,999 income range, which is the most common income bracket and makes up 100.0% of all families.
Income Bracket
# Families
% Families
Less than $10,000
0
0.0%
$10,000 to $14,999
0
0.0%
$15,000 to $24,999
0
0.0%
$25,000 to $34,999
0
0.0%
$35,000 to $49,999
0
0.0%
$50,000 to $74,999
0
0.0%
$75,000 to $99,999
0
0.0%
$100,000 to $149,999
2
100.0%
$150,000 to $199,999
0
0.0%
$200,000+
0
0.0%
Family Income by Famaliy Size in Pillsbury
Income Bracket
# Families
Median Income
2-Person Families
2 (100.0%)
$0
3-Person Families
0 (0.0%)
$0
4-Person Families
0 (0.0%)
$0
5-Person Families
0 (0.0%)
$0
6-Person Families
0 (0.0%)
$0
7+ Person Families
0 (0.0%)
$0
Total
2 (100.0%)
$0
Family Income by Number of Earners in Pillsbury
Number of Earners
# Families
Median Income
No Earners
2 (100.0%)
$0
1 Earner
0 (0.0%)
$0
2 Earners
0 (0.0%)
$0
3+ Earners
0 (0.0%)
$0
Total
2 (100.0%)
$0
Household Income in Pillsbury
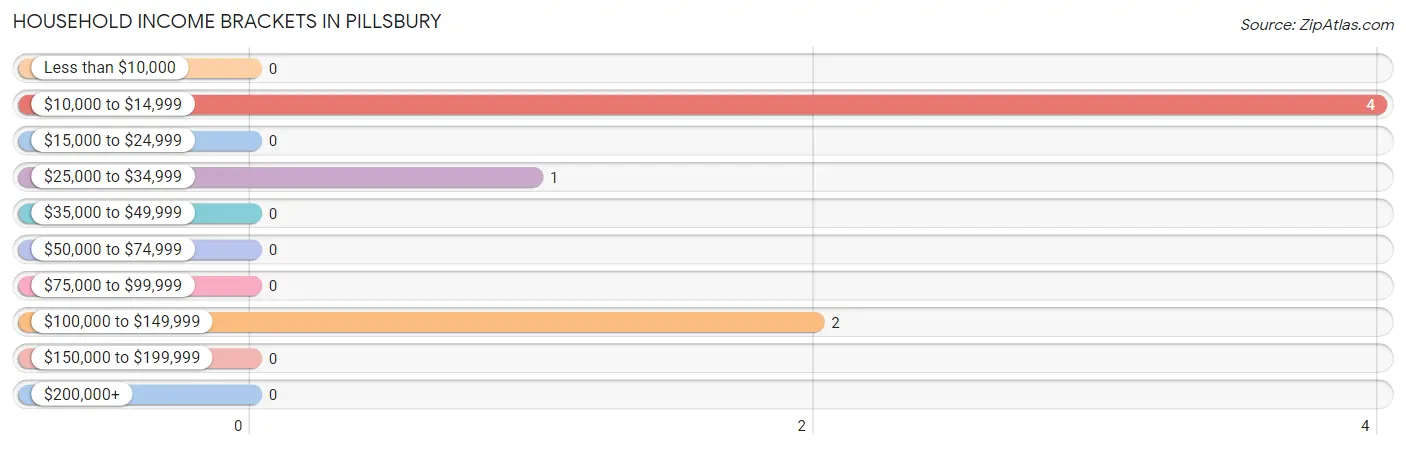
Household Income Brackets in Pillsbury
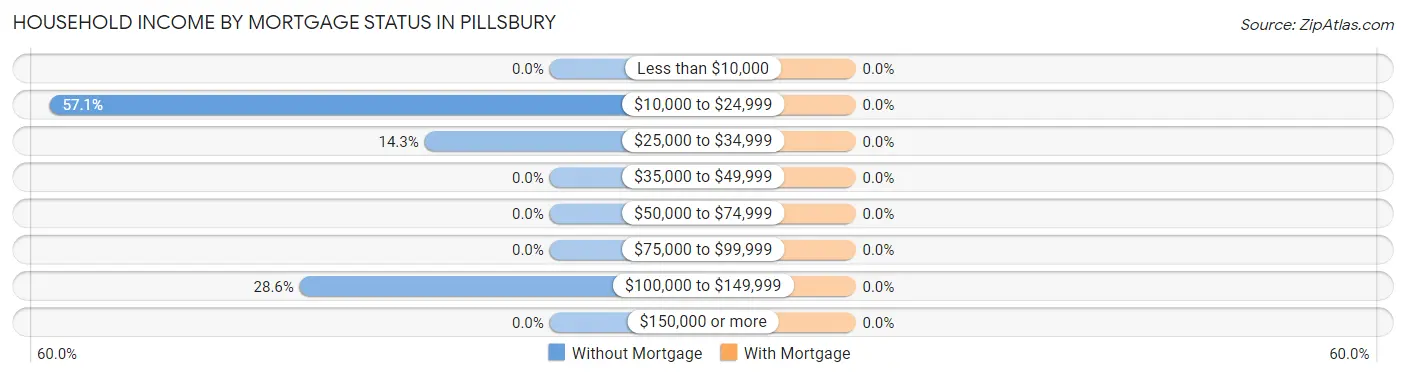
With 4 households falling in the category, the $10,000 to $14,999 income range is the most frequent in Pillsbury, accounting for 57.1% of all households.
Income Bracket
# Households
% Households
Less than $10,000
0
0.0%
$10,000 to $14,999
4
57.1%
$15,000 to $24,999
0
0.0%
$25,000 to $34,999
1
14.3%
$35,000 to $49,999
0
0.0%
$50,000 to $74,999
0
0.0%
$75,000 to $99,999
0
0.0%
$100,000 to $149,999
2
28.6%
$150,000 to $199,999
0
0.0%
$200,000+
0
0.0%
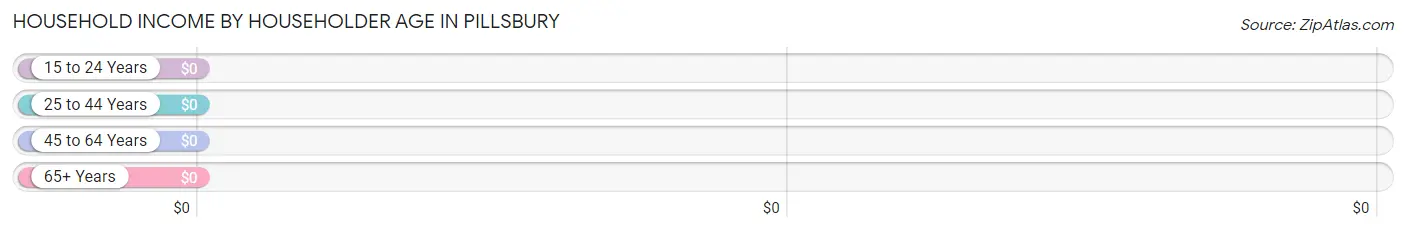
Household Income by Householder Age in Pillsbury
Income Bracket
# Households
Median Income
15 to 24 Years
0 (0.0%)
$0
25 to 44 Years
0 (0.0%)
$0
45 to 64 Years
3 (42.9%)
$0
65+ Years
4 (57.1%)
$0
Total
7 (100.0%)
$0
Poverty in Pillsbury
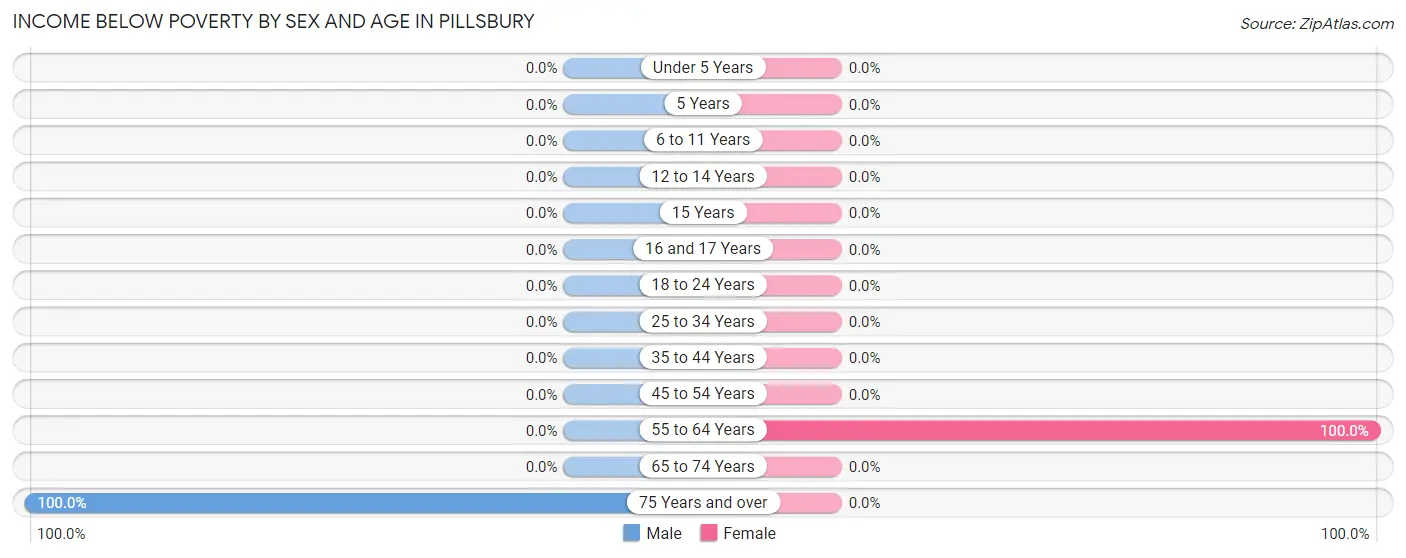
Income Below Poverty by Sex and Age in Pillsbury
With 57.1% poverty level for males and 50.0% for females among the residents of Pillsbury, 75 year old and over males and 55 to 64 year old females are the most vulnerable to poverty, with 4 males (100.0%) and 1 females (100.0%) in their respective age groups living below the poverty level.
Age Bracket
Male
Female
Under 5 Years
0 (0.0%)
0 (0.0%)
5 Years
0 (0.0%)
0 (0.0%)
6 to 11 Years
0 (0.0%)
0 (0.0%)
12 to 14 Years
0 (0.0%)
0 (0.0%)
15 Years
0 (0.0%)
0 (0.0%)
16 and 17 Years
0 (0.0%)
0 (0.0%)
18 to 24 Years
0 (0.0%)
0 (0.0%)
25 to 34 Years
0 (0.0%)
0 (0.0%)
35 to 44 Years
0 (0.0%)
0 (0.0%)
45 to 54 Years
0 (0.0%)
0 (0.0%)
55 to 64 Years
0 (0.0%)
1 (100.0%)
65 to 74 Years
0 (0.0%)
0 (0.0%)
75 Years and over
4 (100.0%)
0 (0.0%)
Total
4 (57.1%)
1 (50.0%)
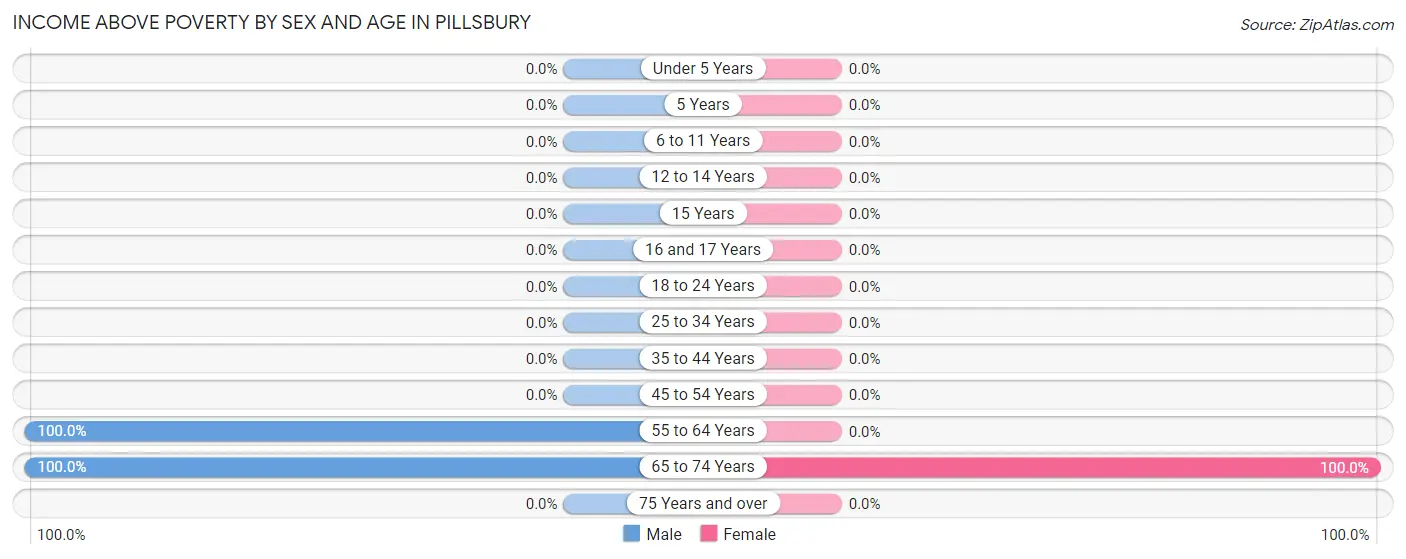
Income Above Poverty by Sex and Age in Pillsbury
According to the poverty statistics in Pillsbury, males aged 55 to 64 years and females aged 65 to 74 years are the age groups that are most secure financially, with 100.0% of males and 100.0% of females in these age groups living above the poverty line.
Age Bracket
Male
Female
Under 5 Years
0 (0.0%)
0 (0.0%)
5 Years
0 (0.0%)
0 (0.0%)
6 to 11 Years
0 (0.0%)
0 (0.0%)
12 to 14 Years
0 (0.0%)
0 (0.0%)
15 Years
0 (0.0%)
0 (0.0%)
16 and 17 Years
0 (0.0%)
0 (0.0%)
18 to 24 Years
0 (0.0%)
0 (0.0%)
25 to 34 Years
0 (0.0%)
0 (0.0%)
35 to 44 Years
0 (0.0%)
0 (0.0%)
45 to 54 Years
0 (0.0%)
0 (0.0%)
55 to 64 Years
2 (100.0%)
0 (0.0%)
65 to 74 Years
1 (100.0%)
1 (100.0%)
75 Years and over
0 (0.0%)
0 (0.0%)
Total
3 (42.9%)
1 (50.0%)
Income Below Poverty Among Married-Couple Families in Pillsbury
Children
Above Poverty
Below Poverty
No Children
2 (100.0%)
0 (0.0%)
1 or 2 Children
0 (0.0%)
0 (0.0%)
3 or 4 Children
0 (0.0%)
0 (0.0%)
5 or more Children
0 (0.0%)
0 (0.0%)
Total
2 (100.0%)
0 (0.0%)
Income Below Poverty Among Single-Parent Households in Pillsbury
Children
Single Father
Single Mother
No Children
0 (0.0%)
0 (0.0%)
1 or 2 Children
0 (0.0%)
0 (0.0%)
3 or 4 Children
0 (0.0%)
0 (0.0%)
5 or more Children
0 (0.0%)
0 (0.0%)
Total
0 (0.0%)
0 (0.0%)
Income Below Poverty Among Married-Couple vs Single-Parent Households in Pillsbury
Children
Married-Couple Families
Single-Parent Households
No Children
0 (0.0%)
0 (0.0%)
1 or 2 Children
0 (0.0%)
0 (0.0%)
3 or 4 Children
0 (0.0%)
0 (0.0%)
5 or more Children
0 (0.0%)
0 (0.0%)
Total
0 (0.0%)
0 (0.0%)
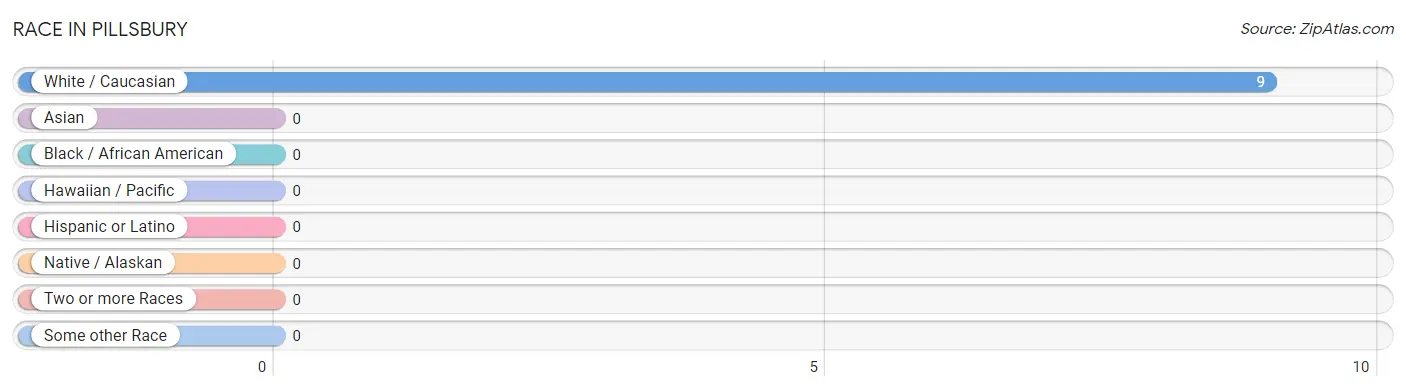
Race in Pillsbury
The most populous races in Pillsbury are , and White / Caucasian (9 | 100.0%).
Race
# Population
% Population
Asian
0
0.0%
Black / African American
0
0.0%
Hawaiian / Pacific
0
0.0%
Hispanic or Latino
0
0.0%
Native / Alaskan
0
0.0%
White / Caucasian
9
100.0%
Two or more Races
0
0.0%
Some other Race
0
0.0%
Total
9
100.0%
Ancestry in Pillsbury
The most populous ancestries reported in Pillsbury are , and Norwegian (1 | 11.1%), together accounting for 11.1% of all Pillsbury residents.
Ancestry
# Population
% Population
Norwegian
1
11.1%
View All 1 Rows
Immigrants in Pillsbury
Immigration Origin
# Population
% Population
View All 0 Rows
Sex and Age in Pillsbury
Sex and Age in Pillsbury
The most populous age groups in Pillsbury are 75 to 79 Years (4 | 57.1%) for men and 55 to 59 Years (1 | 50.0%) for women.
Age Bracket
Male
Female
Under 5 Years
0 (0.0%)
0 (0.0%)
5 to 9 Years
0 (0.0%)
0 (0.0%)
10 to 14 Years
0 (0.0%)
0 (0.0%)
15 to 19 Years
0 (0.0%)
0 (0.0%)
20 to 24 Years
0 (0.0%)
0 (0.0%)
25 to 29 Years
0 (0.0%)
0 (0.0%)
30 to 34 Years
0 (0.0%)
0 (0.0%)
35 to 39 Years
0 (0.0%)
0 (0.0%)
40 to 44 Years
0 (0.0%)
0 (0.0%)
45 to 49 Years
0 (0.0%)
0 (0.0%)
50 to 54 Years
0 (0.0%)
0 (0.0%)
55 to 59 Years
0 (0.0%)
1 (50.0%)
60 to 64 Years
2 (28.6%)
0 (0.0%)
65 to 69 Years
0 (0.0%)
0 (0.0%)
70 to 74 Years
1 (14.3%)
1 (50.0%)
75 to 79 Years
4 (57.1%)
0 (0.0%)
80 to 84 Years
0 (0.0%)
0 (0.0%)
85 Years and over
0 (0.0%)
0 (0.0%)
Total
7 (100.0%)
2 (100.0%)
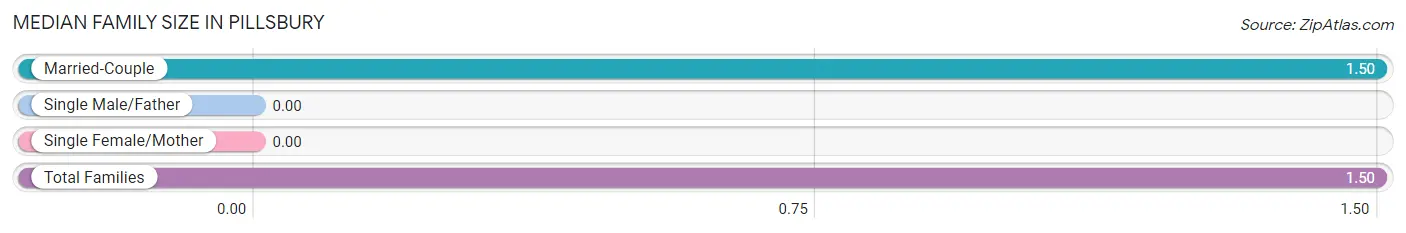
Families and Households in Pillsbury
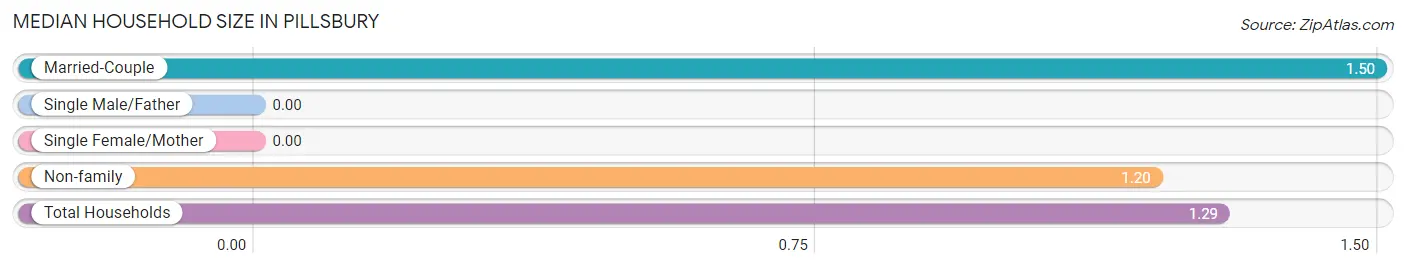
Median Family Size in Pillsbury
Family Type
# Families
Family Size
Married-Couple
2 (100.0%)
1.50
Single Male/Father
0 (0.0%)
-
Single Female/Mother
0 (0.0%)
-
Total Families
2 (100.0%)
1.50
Median Household Size in Pillsbury
Household Type
# Households
Household Size
Married-Couple
2 (28.6%)
1.50
Single Male/Father
0 (0.0%)
-
Single Female/Mother
0 (0.0%)
-
Non-family
5 (71.4%)
1.20
Total Households
7 (100.0%)
1.29
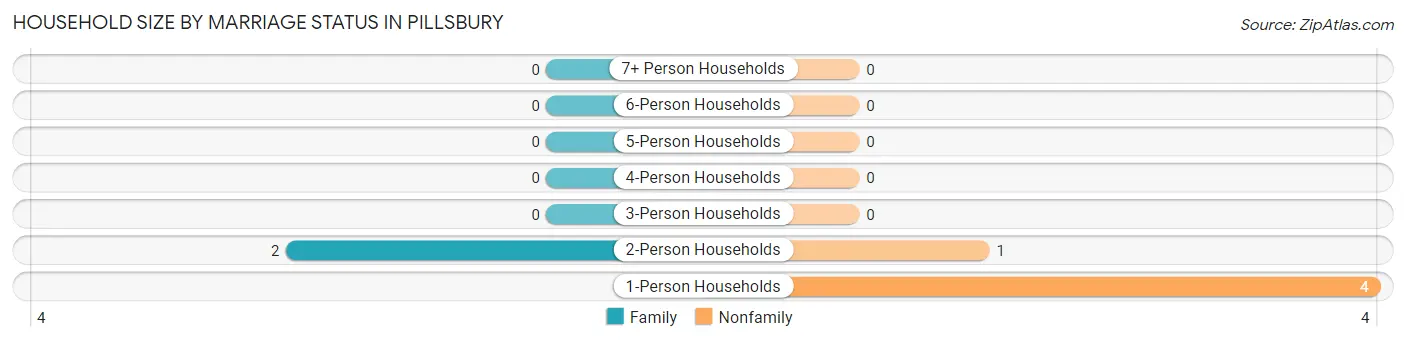
Household Size by Marriage Status in Pillsbury
Out of a total of 7 households in Pillsbury, 2 (28.6%) are family households, while 5 (71.4%) are nonfamily households. The most numerous type of family households are 2-person households, comprising 2, and the most common type of nonfamily households are 1-person households, comprising 4.
Household Size
Family Households
Nonfamily Households
1-Person Households
-
4 (57.1%)
2-Person Households
2 (28.6%)
1 (14.3%)
3-Person Households
0 (0.0%)
0 (0.0%)
4-Person Households
0 (0.0%)
0 (0.0%)
5-Person Households
0 (0.0%)
0 (0.0%)
6-Person Households
0 (0.0%)
0 (0.0%)
7+ Person Households
0 (0.0%)
0 (0.0%)
Total
2 (28.6%)
5 (71.4%)
Female Fertility in Pillsbury
Fertility by Age in Pillsbury
Age Bracket
Women with Births
Births / 1,000 Women
15 to 19 years
0 (0.0%)
0.0
20 to 34 years
0 (0.0%)
0.0
35 to 50 years
0 (0.0%)
0.0
Total
0 (0.0%)
0.0
Fertility by Age by Marriage Status in Pillsbury
Age Bracket
Married
Unmarried
15 to 19 years
0 (0.0%)
0 (0.0%)
20 to 34 years
0 (0.0%)
0 (0.0%)
35 to 50 years
0 (0.0%)
0 (0.0%)
Total
0 (0.0%)
0 (0.0%)
Fertility by Education in Pillsbury
Educational Attainment
Women with Births
Births / 1,000 Women
Less than High School
0 (0.0%)
0.0
High School Diploma
0 (0.0%)
0.0
College or Associate's Degree
0 (0.0%)
0.0
Bachelor's Degree
0 (0.0%)
0.0
Graduate Degree
0 (0.0%)
0.0
Total
0 (0.0%)
0.0
Fertility by Education by Marriage Status in Pillsbury
Educational Attainment
Married
Unmarried
Less than High School
0 (0.0%)
0 (0.0%)
High School Diploma
0 (0.0%)
0 (0.0%)
College or Associate's Degree
0 (0.0%)
0 (0.0%)
Bachelor's Degree
0 (0.0%)
0 (0.0%)
Graduate Degree
0 (0.0%)
0 (0.0%)
Total
0 (0.0%)
0 (0.0%)
Employment Characteristics in Pillsbury
Employment by Class of Employer in Pillsbury
Employer Class
# Employees
% Employees
Private Company Employees
0
0.0%
Self-Employed (Incorporated)
0
0.0%
Self-Employed (Not Incorporated)
0
0.0%
Not-for-profit Organizations
0
0.0%
Local Government Employees
0
0.0%
State Government Employees
0
0.0%
Federal Government Employees
0
0.0%
Unpaid Family Workers
0
0.0%
Total
0
0.0%
Employment Status by Age in Pillsbury
Age Bracket
In Labor Force
Unemployed
16 to 19 Years
0 (0.0%)
0 (0.0%)
20 to 24 Years
0 (0.0%)
0 (0.0%)
25 to 29 Years
0 (0.0%)
0 (0.0%)
30 to 34 Years
0 (0.0%)
0 (0.0%)
35 to 44 Years
0 (0.0%)
0 (0.0%)
45 to 54 Years
0 (0.0%)
0 (0.0%)
55 to 59 Years
0 (0.0%)
0 (0.0%)
60 to 64 Years
0 (0.0%)
0 (0.0%)
65 to 74 Years
0 (0.0%)
0 (0.0%)
75 Years and over
0 (0.0%)
0 (0.0%)
Total
0 (0.0%)
0 (0.0%)
Employment Status by Educational Attainment in Pillsbury
Educational Attainment
In Labor Force
Unemployed
Less than High School
0 (0.0%)
0 (0.0%)
High School Diploma
0 (0.0%)
0 (0.0%)
College / Associate Degree
0 (0.0%)
0 (0.0%)
Bachelor's Degree or higher
0 (0.0%)
0 (0.0%)
Total
0 (0.0%)
0 (0.0%)
Employment Occupations by Sex in Pillsbury
Management, Business, Science and Arts Occupations
Management, Business, Science and Arts Occupations by Sex
Occupation
Male
Female
Management
0 (0.0%)
0 (0.0%)
Business & Financial
0 (0.0%)
0 (0.0%)
Computers, Engineering & Science
0 (0.0%)
0 (0.0%)
Computers & Mathematics
0 (0.0%)
0 (0.0%)
Architecture & Engineering
0 (0.0%)
0 (0.0%)
Life, Physical & Social Science
0 (0.0%)
0 (0.0%)
Community & Social Service
0 (0.0%)
0 (0.0%)
Education, Arts & Media
0 (0.0%)
0 (0.0%)
Legal Services & Support
0 (0.0%)
0 (0.0%)
Education Instruction & Library
0 (0.0%)
0 (0.0%)
Arts, Media & Entertainment
0 (0.0%)
0 (0.0%)
Health Diagnosing & Treating
0 (0.0%)
0 (0.0%)
Health Technologists
0 (0.0%)
0 (0.0%)
Total (Category)
0 (0.0%)
0 (0.0%)
Total (Overall)
0 (0.0%)
0 (0.0%)
Services Occupations
Services Occupations by Sex
Occupation
Male
Female
Healthcare Support
0 (0.0%)
0 (0.0%)
Security & Protection
0 (0.0%)
0 (0.0%)
Firefighting & Prevention
0 (0.0%)
0 (0.0%)
Law Enforcement
0 (0.0%)
0 (0.0%)
Food Preparation & Serving
0 (0.0%)
0 (0.0%)
Cleaning & Maintenance
0 (0.0%)
0 (0.0%)
Personal Care & Service
0 (0.0%)
0 (0.0%)
Total (Category)
0 (0.0%)
0 (0.0%)
Total (Overall)
0 (0.0%)
0 (0.0%)
Sales and Office Occupations
Sales and Office Occupations by Sex
Occupation
Male
Female
Sales & Related
0 (0.0%)
0 (0.0%)
Office & Administration
0 (0.0%)
0 (0.0%)
Total (Category)
0 (0.0%)
0 (0.0%)
Total (Overall)
0 (0.0%)
0 (0.0%)
Natural Resources, Construction and Maintenance Occupations
Natural Resources, Construction and Maintenance Occupations by Sex
Occupation
Male
Female
Farming, Fishing & Forestry
0 (0.0%)
0 (0.0%)
Construction & Extraction
0 (0.0%)
0 (0.0%)
Installation, Maintenance & Repair
0 (0.0%)
0 (0.0%)
Total (Category)
0 (0.0%)
0 (0.0%)
Total (Overall)
0 (0.0%)
0 (0.0%)
Production, Transportation and Moving Occupations
Production, Transportation and Moving Occupations by Sex
Occupation
Male
Female
Production
0 (0.0%)
0 (0.0%)
Transportation
0 (0.0%)
0 (0.0%)
Material Moving
0 (0.0%)
0 (0.0%)
Total (Category)
0 (0.0%)
0 (0.0%)
Total (Overall)
0 (0.0%)
0 (0.0%)
Employment Industries by Sex in Pillsbury
Employment Industries in Pillsbury
Employment Industries by Sex in Pillsbury
Industry
Male
Female
Agriculture, Fishing & Hunting
0 (0.0%)
0 (0.0%)
Mining, Quarrying, & Extraction
0 (0.0%)
0 (0.0%)
Construction
0 (0.0%)
0 (0.0%)
Manufacturing
0 (0.0%)
0 (0.0%)
Wholesale Trade
0 (0.0%)
0 (0.0%)
Retail Trade
0 (0.0%)
0 (0.0%)
Transportation & Warehousing
0 (0.0%)
0 (0.0%)
Utilities
0 (0.0%)
0 (0.0%)
Information
0 (0.0%)
0 (0.0%)
Finance & Insurance
0 (0.0%)
0 (0.0%)
Real Estate, Rental & Leasing
0 (0.0%)
0 (0.0%)
Professional & Scientific
0 (0.0%)
0 (0.0%)
Enterprise Management
0 (0.0%)
0 (0.0%)
Administrative & Support
0 (0.0%)
0 (0.0%)
Educational Services
0 (0.0%)
0 (0.0%)
Health Care & Social Assistance
0 (0.0%)
0 (0.0%)
Arts, Entertainment & Recreation
0 (0.0%)
0 (0.0%)
Accommodation & Food Services
0 (0.0%)
0 (0.0%)
Public Administration
0 (0.0%)
0 (0.0%)
Total
0 (0.0%)
0 (0.0%)
Education in Pillsbury
School Enrollment in Pillsbury
School Level
# Students
% Students
Nursery / Preschool
0
0.0%
Kindergarten
0
0.0%
Elementary School
0
0.0%
Middle School
0
0.0%
High School
0
0.0%
College / Undergraduate
0
0.0%
Graduate / Professional
0
0.0%
Total
0
0.0%
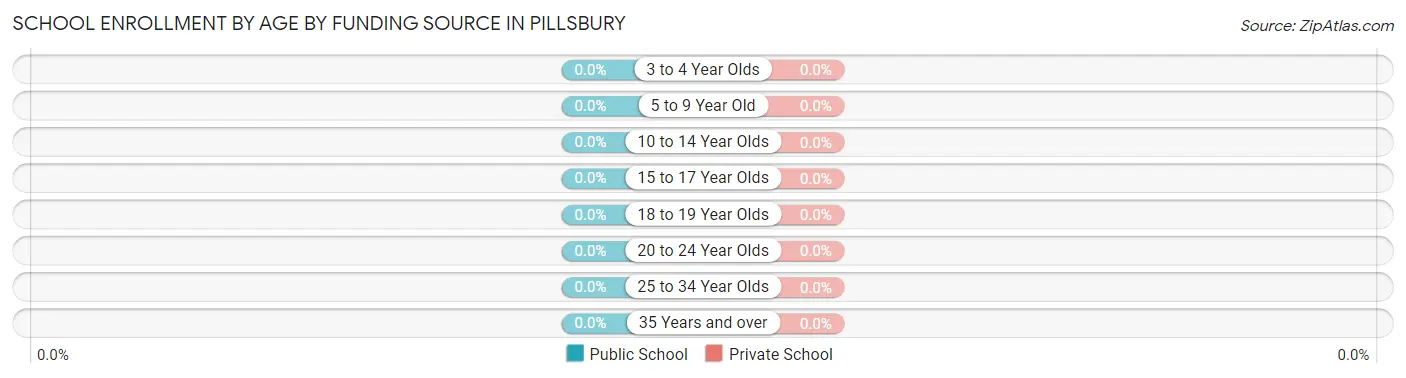
School Enrollment by Age by Funding Source in Pillsbury
Age Bracket
Public School
Private School
3 to 4 Year Olds
0 (0.0%)
0 (0.0%)
5 to 9 Year Old
0 (0.0%)
0 (0.0%)
10 to 14 Year Olds
0 (0.0%)
0 (0.0%)
15 to 17 Year Olds
0 (0.0%)
0 (0.0%)
18 to 19 Year Olds
0 (0.0%)
0 (0.0%)
20 to 24 Year Olds
0 (0.0%)
0 (0.0%)
25 to 34 Year Olds
0 (0.0%)
0 (0.0%)
35 Years and over
0 (0.0%)
0 (0.0%)
Total
0 (0.0%)
0 (0.0%)
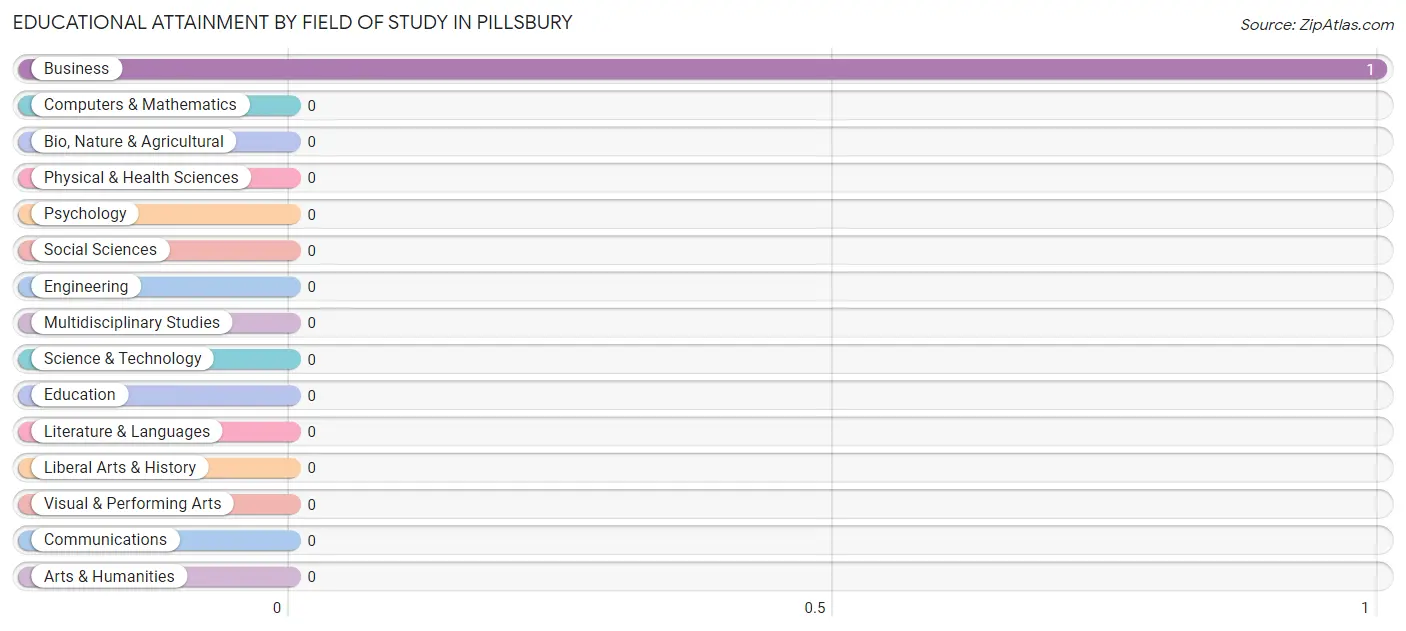
Educational Attainment by Field of Study in Pillsbury
, and business (1 | 100.0%) are the most common fields of study among 1 individuals in Pillsbury who have obtained a bachelor's degree or higher.
Field of Study
# Graduates
% Graduates
Computers & Mathematics
0
0.0%
Bio, Nature & Agricultural
0
0.0%
Physical & Health Sciences
0
0.0%
Psychology
0
0.0%
Social Sciences
0
0.0%
Engineering
0
0.0%
Multidisciplinary Studies
0
0.0%
Science & Technology
0
0.0%
Business
1
100.0%
Education
0
0.0%
Literature & Languages
0
0.0%
Liberal Arts & History
0
0.0%
Visual & Performing Arts
0
0.0%
Communications
0
0.0%
Arts & Humanities
0
0.0%
Total
1
100.0%
Transportation & Commute in Pillsbury
Vehicle Availability by Sex in Pillsbury
Vehicles Available
Male
Female
No Vehicle
0 (0.0%)
0 (0.0%)
1 Vehicle
0 (0.0%)
0 (0.0%)
2 Vehicles
0 (0.0%)
0 (0.0%)
3 Vehicles
0 (0.0%)
0 (0.0%)
4 Vehicles
0 (0.0%)
0 (0.0%)
5 or more Vehicles
0 (0.0%)
0 (0.0%)
Total
0 (0.0%)
0 (0.0%)
Commute Time in Pillsbury
Commute Time
# Commuters
% Commuters
Less than 5 Minutes
0
0.0%
5 to 9 Minutes
0
0.0%
10 to 14 Minutes
0
0.0%
15 to 19 Minutes
0
0.0%
20 to 24 Minutes
0
0.0%
25 to 29 Minutes
0
0.0%
30 to 34 Minutes
0
0.0%
35 to 39 Minutes
0
0.0%
40 to 44 Minutes
0
0.0%
45 to 59 Minutes
0
0.0%
60 to 89 Minutes
0
0.0%
90 or more Minutes
0
0.0%
Commute Time by Sex in Pillsbury
Commute Time
Male
Female
Less than 5 Minutes
0 (0.0%)
0 (0.0%)
5 to 9 Minutes
0 (0.0%)
0 (0.0%)
10 to 14 Minutes
0 (0.0%)
0 (0.0%)
15 to 19 Minutes
0 (0.0%)
0 (0.0%)
20 to 24 Minutes
0 (0.0%)
0 (0.0%)
25 to 29 Minutes
0 (0.0%)
0 (0.0%)
30 to 34 Minutes
0 (0.0%)
0 (0.0%)
35 to 39 Minutes
0 (0.0%)
0 (0.0%)
40 to 44 Minutes
0 (0.0%)
0 (0.0%)
45 to 59 Minutes
0 (0.0%)
0 (0.0%)
60 to 89 Minutes
0 (0.0%)
0 (0.0%)
90 or more Minutes
0 (0.0%)
0 (0.0%)
Time of Departure to Work by Sex in Pillsbury
Time of Departure
Male
Female
12:00 AM to 4:59 AM
0 (0.0%)
0 (0.0%)
5:00 AM to 5:29 AM
0 (0.0%)
0 (0.0%)
5:30 AM to 5:59 AM
0 (0.0%)
0 (0.0%)
6:00 AM to 6:29 AM
0 (0.0%)
0 (0.0%)
6:30 AM to 6:59 AM
0 (0.0%)
0 (0.0%)
7:00 AM to 7:29 AM
0 (0.0%)
0 (0.0%)
7:30 AM to 7:59 AM
0 (0.0%)
0 (0.0%)
8:00 AM to 8:29 AM
0 (0.0%)
0 (0.0%)
8:30 AM to 8:59 AM
0 (0.0%)
0 (0.0%)
9:00 AM to 9:59 AM
0 (0.0%)
0 (0.0%)
10:00 AM to 10:59 AM
0 (0.0%)
0 (0.0%)
11:00 AM to 11:59 AM
0 (0.0%)
0 (0.0%)
12:00 PM to 3:59 PM
0 (0.0%)
0 (0.0%)
4:00 PM to 11:59 PM
0 (0.0%)
0 (0.0%)
Total
0 (0.0%)
0 (0.0%)
Housing Occupancy in Pillsbury
Occupancy by Ownership in Pillsbury
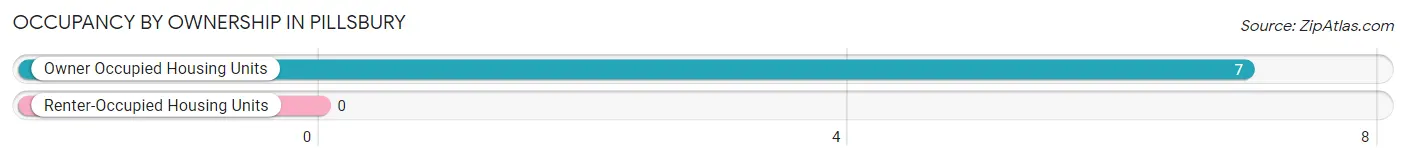
Of the total 7 dwellings in Pillsbury, owner-occupied units account for 7 (100.0%), while renter-occupied units make up 0 (0.0%).
Occupancy
# Housing Units
% Housing Units
Owner Occupied Housing Units
7
100.0%
Renter-Occupied Housing Units
0
0.0%
Total Occupied Housing Units
7
100.0%
Occupancy by Household Size in Pillsbury
Household Size
# Housing Units
% Housing Units
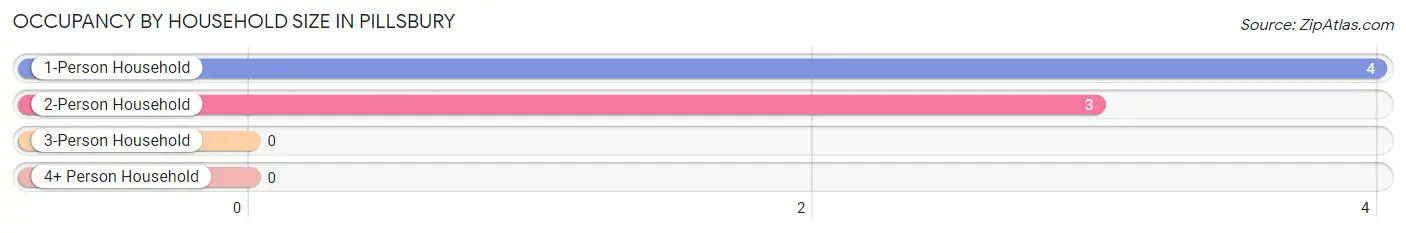
1-Person Household
4
57.1%
2-Person Household
3
42.9%
3-Person Household
0
0.0%
4+ Person Household
0
0.0%
Total Housing Units
7
100.0%
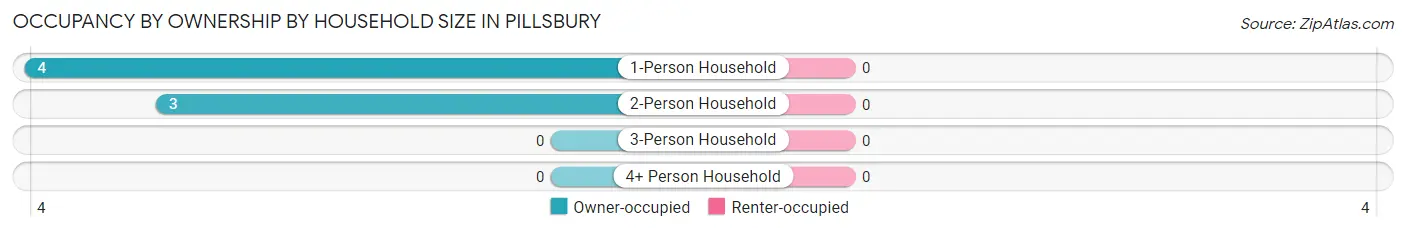
Occupancy by Ownership by Household Size in Pillsbury
Household Size
Owner-occupied
Renter-occupied
1-Person Household
4 (100.0%)
0 (0.0%)
2-Person Household
3 (100.0%)
0 (0.0%)
3-Person Household
0 (0.0%)
0 (0.0%)
4+ Person Household
0 (0.0%)
0 (0.0%)
Total Housing Units
7 (100.0%)
0 (0.0%)
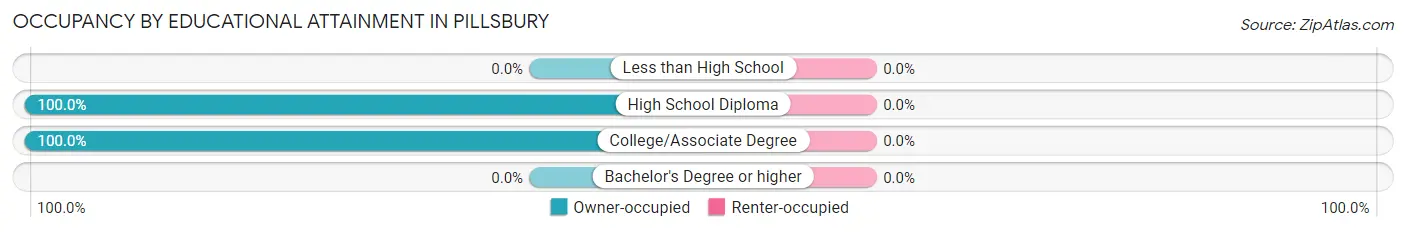
Occupancy by Educational Attainment in Pillsbury
Household Size
Owner-occupied
Renter-occupied
Less than High School
0 (0.0%)
0 (0.0%)
High School Diploma
4 (100.0%)
0 (0.0%)
College/Associate Degree
3 (100.0%)
0 (0.0%)
Bachelor's Degree or higher
0 (0.0%)
0 (0.0%)
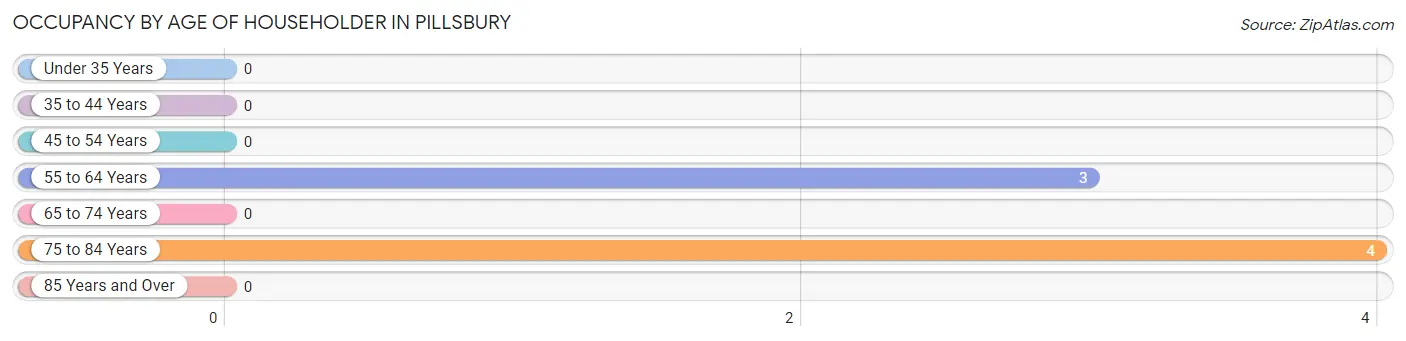
Occupancy by Age of Householder in Pillsbury
Age Bracket
# Households
% Households
Under 35 Years
0
0.0%
35 to 44 Years
0
0.0%
45 to 54 Years
0
0.0%
55 to 64 Years
3
42.9%
65 to 74 Years
0
0.0%
75 to 84 Years
4
57.1%
85 Years and Over
0
0.0%
Total
7
100.0%
Housing Finances in Pillsbury
Median Income by Occupancy in Pillsbury
Occupancy Type
# Households
Median Income
Owner-Occupied
7 (100.0%)
$0
Renter-Occupied
0 (0.0%)
$0
Average
7 (100.0%)
$0
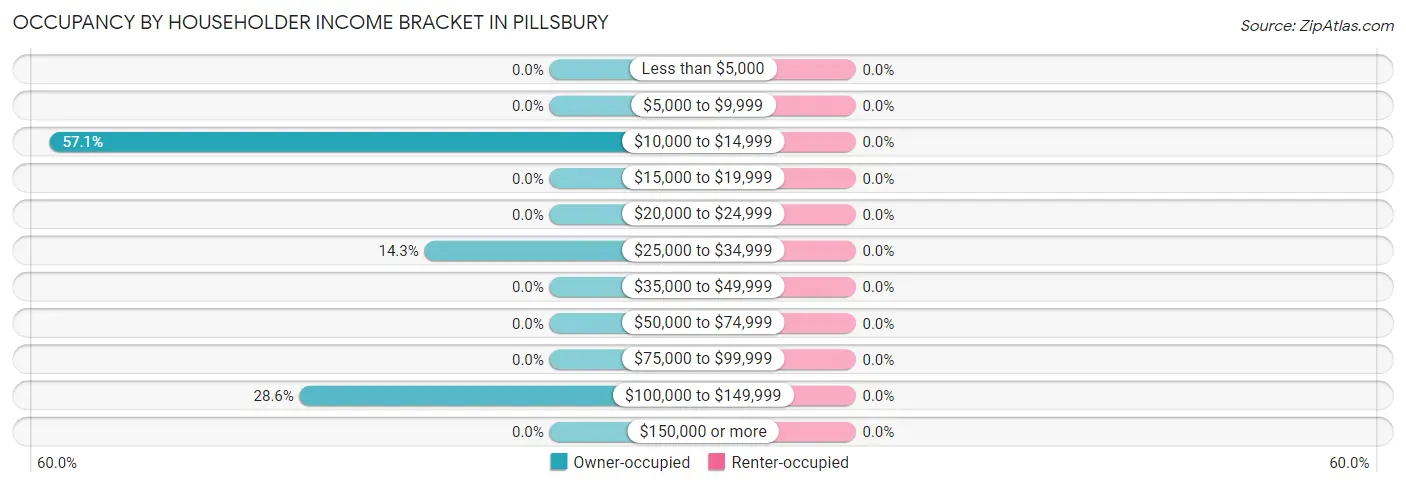
Occupancy by Householder Income Bracket in Pillsbury
Income Bracket
Owner-occupied
Renter-occupied
Less than $5,000
0 (0.0%)
0 (0.0%)
$5,000 to $9,999
0 (0.0%)
0 (0.0%)
$10,000 to $14,999
4 (57.1%)
0 (0.0%)
$15,000 to $19,999
0 (0.0%)
0 (0.0%)
$20,000 to $24,999
0 (0.0%)
0 (0.0%)
$25,000 to $34,999
1 (14.3%)
0 (0.0%)
$35,000 to $49,999
0 (0.0%)
0 (0.0%)
$50,000 to $74,999
0 (0.0%)
0 (0.0%)
$75,000 to $99,999
0 (0.0%)
0 (0.0%)
$100,000 to $149,999
2 (28.6%)
0 (0.0%)
$150,000 or more
0 (0.0%)
0 (0.0%)
Total
7 (100.0%)
0 (0.0%)
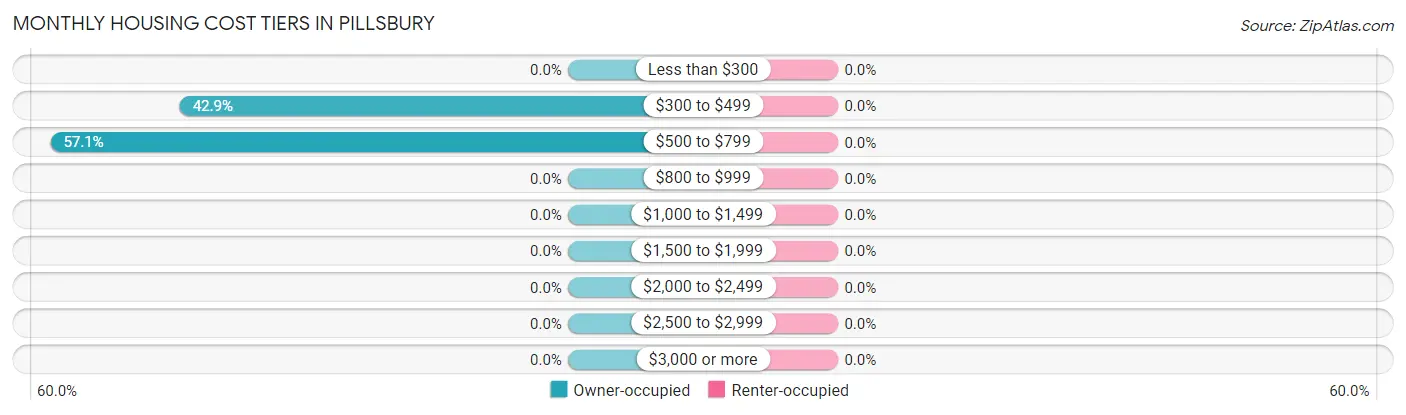
Monthly Housing Cost Tiers in Pillsbury
Monthly Cost
Owner-occupied
Renter-occupied
Less than $300
0 (0.0%)
0 (0.0%)
$300 to $499
3 (42.9%)
0 (0.0%)
$500 to $799
4 (57.1%)
0 (0.0%)
$800 to $999
0 (0.0%)
0 (0.0%)
$1,000 to $1,499
0 (0.0%)
0 (0.0%)
$1,500 to $1,999
0 (0.0%)
0 (0.0%)
$2,000 to $2,499
0 (0.0%)
0 (0.0%)
$2,500 to $2,999
0 (0.0%)
0 (0.0%)
$3,000 or more
0 (0.0%)
0 (0.0%)
Total
7 (100.0%)
0 (0.0%)
Physical Housing Characteristics in Pillsbury
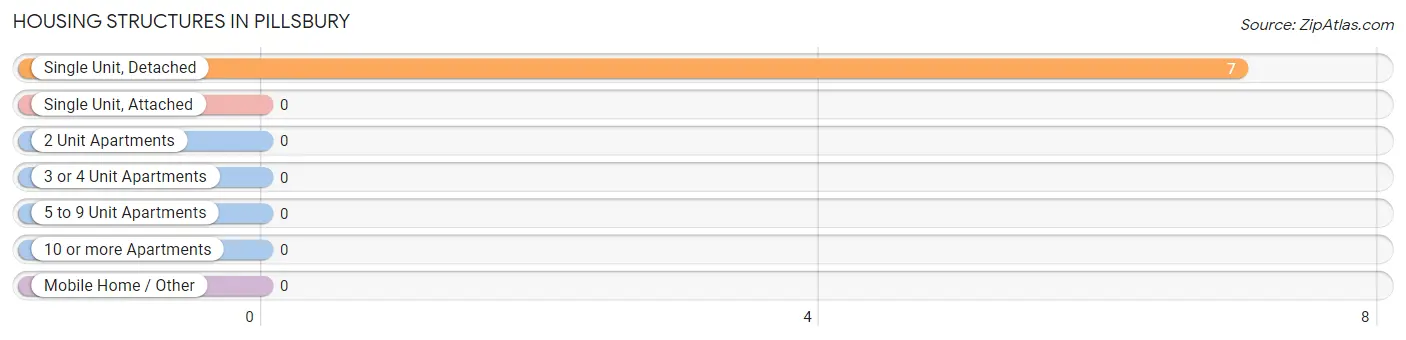
Housing Structures in Pillsbury
Structure Type
# Housing Units
% Housing Units
Single Unit, Detached
7
100.0%
Single Unit, Attached
0
0.0%
2 Unit Apartments
0
0.0%
3 or 4 Unit Apartments
0
0.0%
5 to 9 Unit Apartments
0
0.0%
10 or more Apartments
0
0.0%
Mobile Home / Other
0
0.0%
Total
7
100.0%
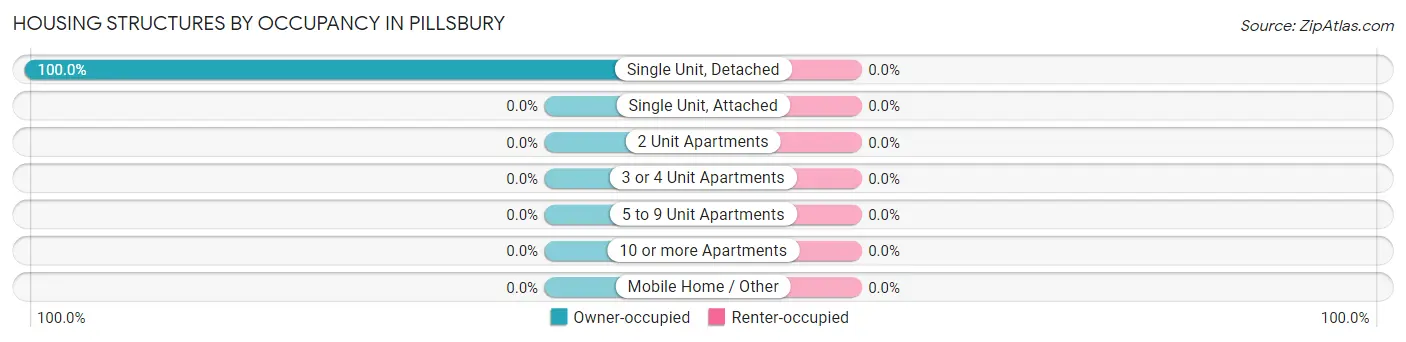
Housing Structures by Occupancy in Pillsbury
Structure Type
Owner-occupied
Renter-occupied
Single Unit, Detached
7 (100.0%)
0 (0.0%)
Single Unit, Attached
0 (0.0%)
0 (0.0%)
2 Unit Apartments
0 (0.0%)
0 (0.0%)
3 or 4 Unit Apartments
0 (0.0%)
0 (0.0%)
5 to 9 Unit Apartments
0 (0.0%)
0 (0.0%)
10 or more Apartments
0 (0.0%)
0 (0.0%)
Mobile Home / Other
0 (0.0%)
0 (0.0%)
Total
7 (100.0%)
0 (0.0%)
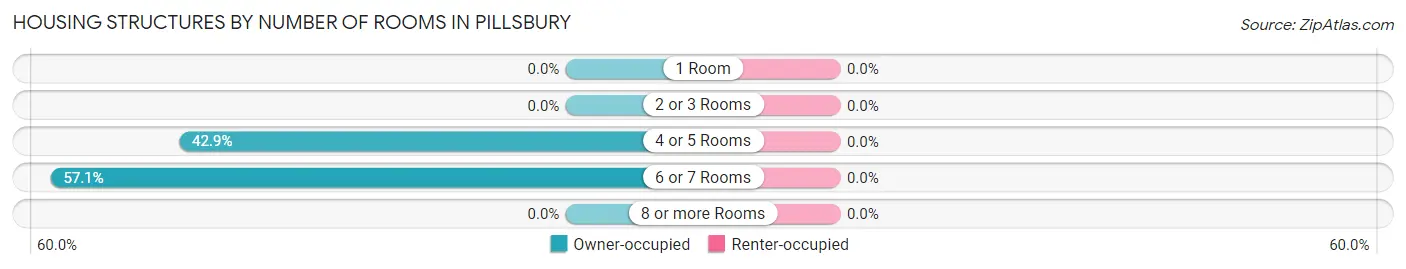
Housing Structures by Number of Rooms in Pillsbury
Number of Rooms
Owner-occupied
Renter-occupied
1 Room
0 (0.0%)
0 (0.0%)
2 or 3 Rooms
0 (0.0%)
0 (0.0%)
4 or 5 Rooms
3 (42.9%)
0 (0.0%)
6 or 7 Rooms
4 (57.1%)
0 (0.0%)
8 or more Rooms
0 (0.0%)
0 (0.0%)
Total
7 (100.0%)
0 (0.0%)
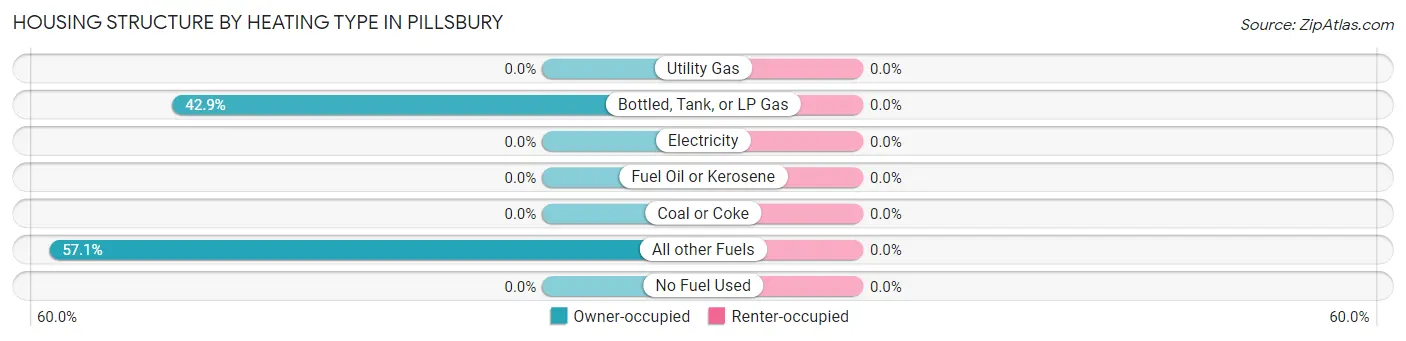
Housing Structure by Heating Type in Pillsbury
Heating Type
Owner-occupied
Renter-occupied
Utility Gas
0 (0.0%)
0 (0.0%)
Bottled, Tank, or LP Gas
3 (42.9%)
0 (0.0%)
Electricity
0 (0.0%)
0 (0.0%)
Fuel Oil or Kerosene
0 (0.0%)
0 (0.0%)
Coal or Coke
0 (0.0%)
0 (0.0%)
All other Fuels
4 (57.1%)
0 (0.0%)
No Fuel Used
0 (0.0%)
0 (0.0%)
Total
7 (100.0%)
0 (0.0%)
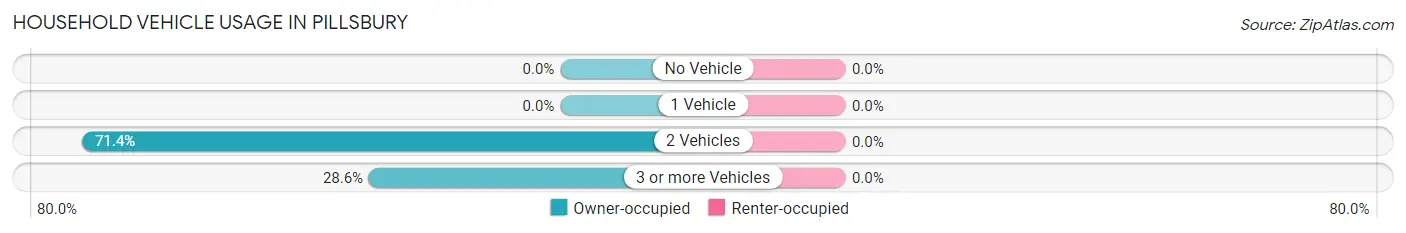
Household Vehicle Usage in Pillsbury
Vehicles per Household
Owner-occupied
Renter-occupied
No Vehicle
0 (0.0%)
0 (0.0%)
1 Vehicle
0 (0.0%)
0 (0.0%)
2 Vehicles
5 (71.4%)
0 (0.0%)
3 or more Vehicles
2 (28.6%)
0 (0.0%)
Total
7 (100.0%)
0 (0.0%)
Real Estate & Mortgages in Pillsbury
Real Estate and Mortgage Overview in Pillsbury
Characteristic
Without Mortgage
With Mortgage
Housing Units
7
0
Median Property Value
$206,300
$0
Median Household Income
-
-
Monthly Housing Costs
$613
$0
Real Estate Taxes
-
-
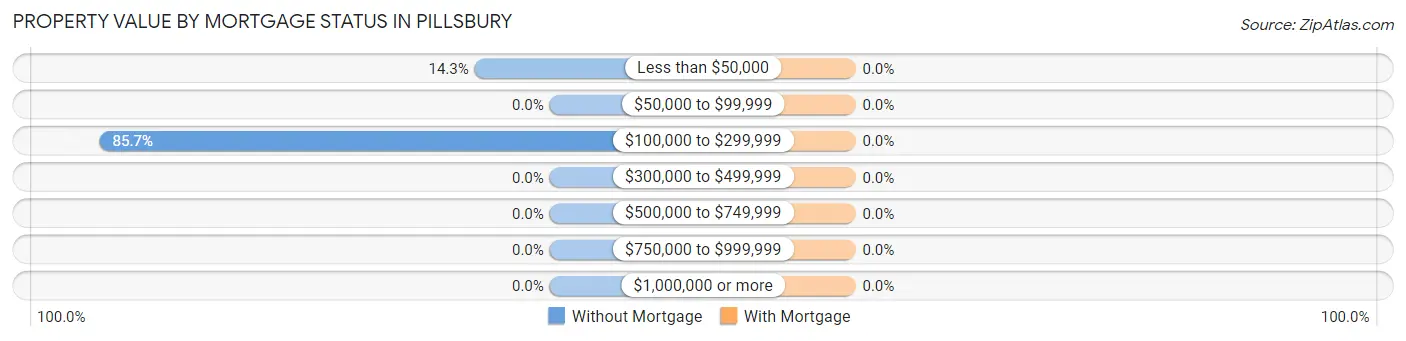
Property Value by Mortgage Status in Pillsbury
Property Value
Without Mortgage
With Mortgage
Less than $50,000
1 (14.3%)
0 (0.0%)
$50,000 to $99,999
0 (0.0%)
0 (0.0%)
$100,000 to $299,999
6 (85.7%)
0 (0.0%)
$300,000 to $499,999
0 (0.0%)
0 (0.0%)
$500,000 to $749,999
0 (0.0%)
0 (0.0%)
$750,000 to $999,999
0 (0.0%)
0 (0.0%)
$1,000,000 or more
0 (0.0%)
0 (0.0%)
Total
7 (100.0%)
0 (0.0%)
Household Income by Mortgage Status in Pillsbury
Household Income
Without Mortgage
With Mortgage
Less than $10,000
0 (0.0%)
0 (0.0%)
$10,000 to $24,999
4 (57.1%)
0 (0.0%)
$25,000 to $34,999
1 (14.3%)
0 (0.0%)
$35,000 to $49,999
0 (0.0%)
0 (0.0%)
$50,000 to $74,999
0 (0.0%)
0 (0.0%)
$75,000 to $99,999
0 (0.0%)
0 (0.0%)
$100,000 to $149,999
2 (28.6%)
0 (0.0%)
$150,000 or more
0 (0.0%)
0 (0.0%)
Total
7 (100.0%)
0 (0.0%)
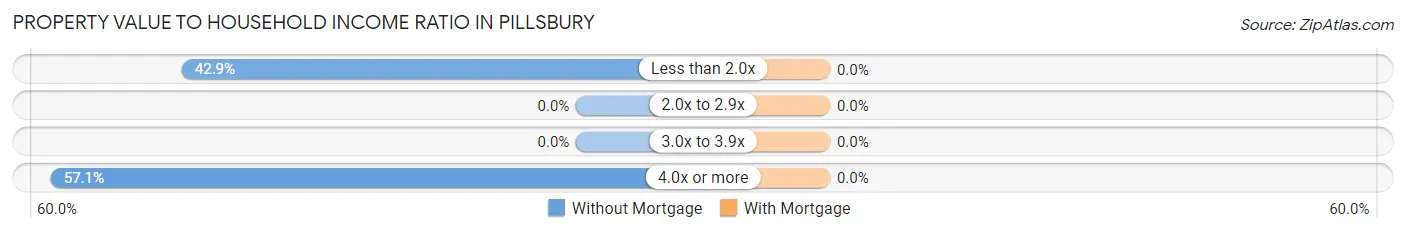
Property Value to Household Income Ratio in Pillsbury
Value-to-Income Ratio
Without Mortgage
With Mortgage
Less than 2.0x
3 (42.9%)
0 (0.0%)
2.0x to 2.9x
0 (0.0%)
0 (0.0%)
3.0x to 3.9x
0 (0.0%)
0 (0.0%)
4.0x or more
4 (57.1%)
0 (0.0%)
Total
7 (100.0%)
0 (0.0%)
Real Estate Taxes by Mortgage Status in Pillsbury
Property Taxes
Without Mortgage
With Mortgage
Less than $800
3 (42.9%)
0 (0.0%)
$800 to $1,499
0 (0.0%)
0 (0.0%)
$800 to $1,499
4 (57.1%)
0 (0.0%)
Total
7 (100.0%)
0 (0.0%)
Health & Disability in Pillsbury
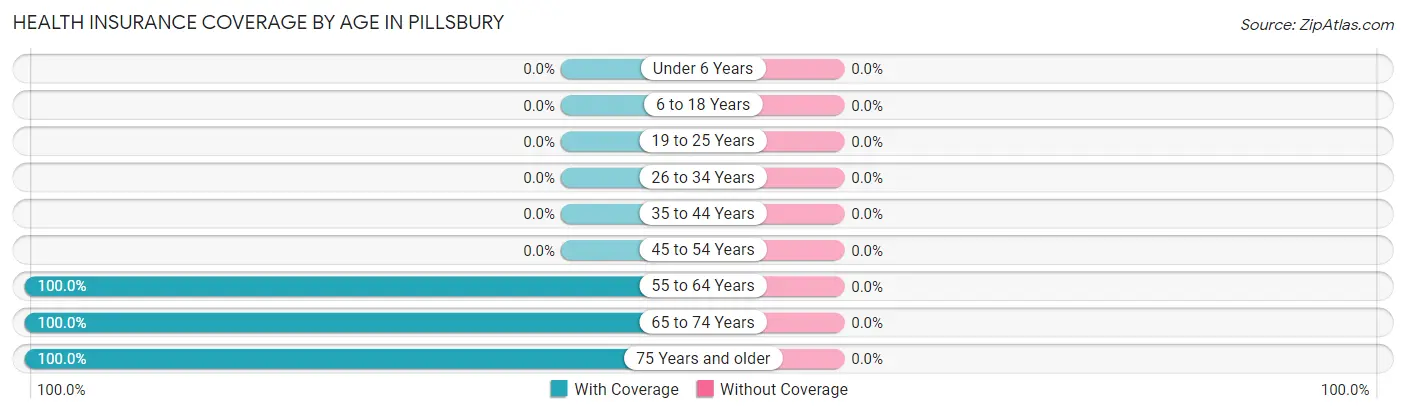
Health Insurance Coverage by Age in Pillsbury
Age Bracket
With Coverage
Without Coverage
Under 6 Years
0 (0.0%)
0 (0.0%)
6 to 18 Years
0 (0.0%)
0 (0.0%)
19 to 25 Years
0 (0.0%)
0 (0.0%)
26 to 34 Years
0 (0.0%)
0 (0.0%)
35 to 44 Years
0 (0.0%)
0 (0.0%)
45 to 54 Years
0 (0.0%)
0 (0.0%)
55 to 64 Years
3 (100.0%)
0 (0.0%)
65 to 74 Years
2 (100.0%)
0 (0.0%)
75 Years and older
4 (100.0%)
0 (0.0%)
Total
9 (100.0%)
0 (0.0%)
Health Insurance Coverage by Citizenship Status in Pillsbury
Citizenship Status
With Coverage
Without Coverage
Native Born
0 (0.0%)
0 (0.0%)
Foreign Born, Citizen
0 (0.0%)
0 (0.0%)
Foreign Born, not a Citizen
0 (0.0%)
0 (0.0%)
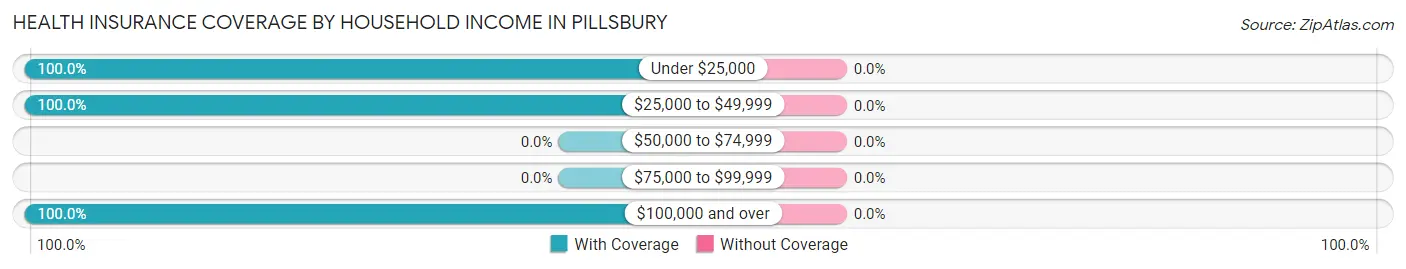
Health Insurance Coverage by Household Income in Pillsbury
Household Income
With Coverage
Without Coverage
Under $25,000
4 (100.0%)
0 (0.0%)
$25,000 to $49,999
2 (100.0%)
0 (0.0%)
$50,000 to $74,999
0 (0.0%)
0 (0.0%)
$75,000 to $99,999
0 (0.0%)
0 (0.0%)
$100,000 and over
3 (100.0%)
0 (0.0%)
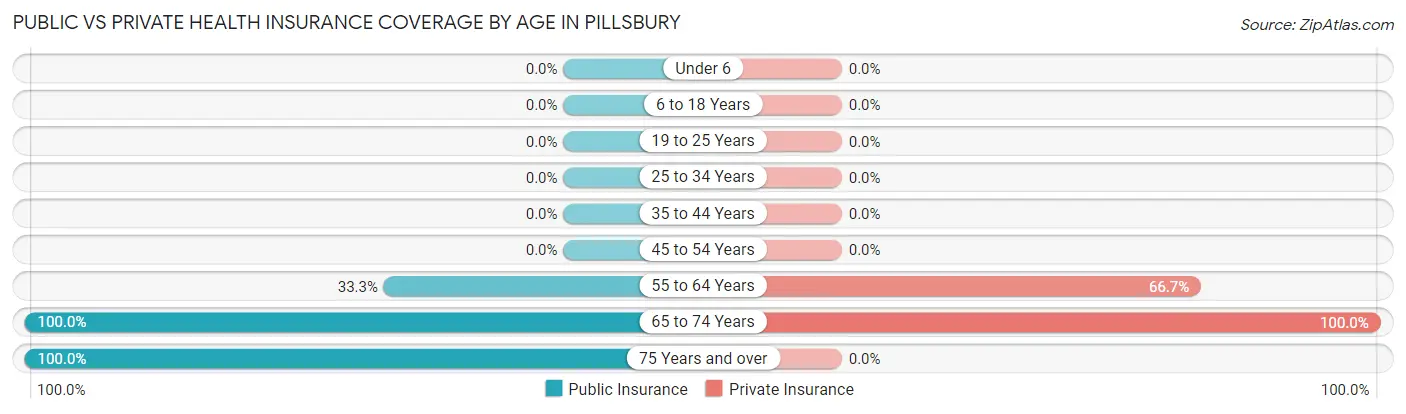
Public vs Private Health Insurance Coverage by Age in Pillsbury
Age Bracket
Public Insurance
Private Insurance
Under 6
0 (0.0%)
0 (0.0%)
6 to 18 Years
0 (0.0%)
0 (0.0%)
19 to 25 Years
0 (0.0%)
0 (0.0%)
25 to 34 Years
0 (0.0%)
0 (0.0%)
35 to 44 Years
0 (0.0%)
0 (0.0%)
45 to 54 Years
0 (0.0%)
0 (0.0%)
55 to 64 Years
1 (33.3%)
2 (66.7%)
65 to 74 Years
2 (100.0%)
2 (100.0%)
75 Years and over
4 (100.0%)
0 (0.0%)
Total
7 (77.8%)
4 (44.4%)
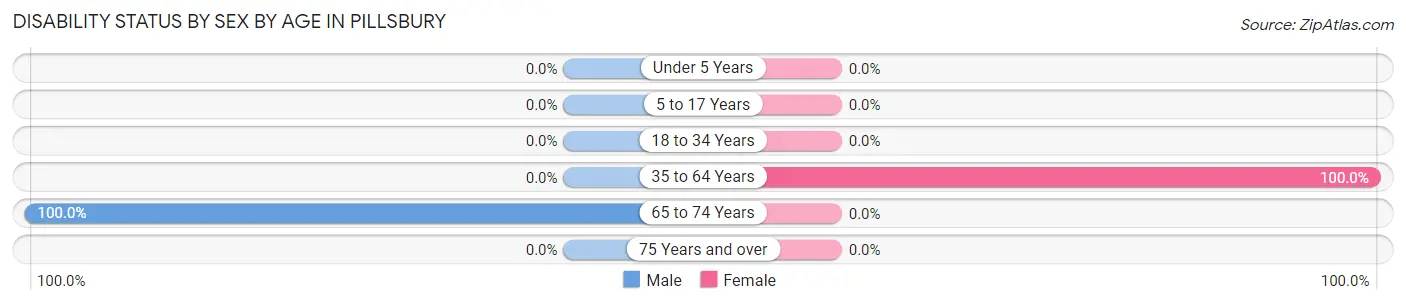
Disability Status by Sex by Age in Pillsbury
Age Bracket
Male
Female
Under 5 Years
0 (0.0%)
0 (0.0%)
5 to 17 Years
0 (0.0%)
0 (0.0%)
18 to 34 Years
0 (0.0%)
0 (0.0%)
35 to 64 Years
0 (0.0%)
1 (100.0%)
65 to 74 Years
1 (100.0%)
0 (0.0%)
75 Years and over
0 (0.0%)
0 (0.0%)
Disability Class by Sex by Age in Pillsbury
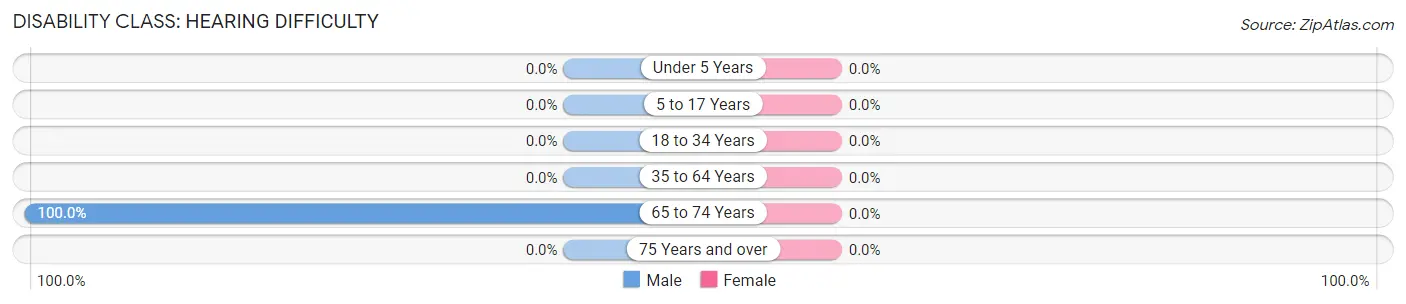
Disability Class: Hearing Difficulty
Age Bracket
Male
Female
Under 5 Years
0 (0.0%)
0 (0.0%)
5 to 17 Years
0 (0.0%)
0 (0.0%)
18 to 34 Years
0 (0.0%)
0 (0.0%)
35 to 64 Years
0 (0.0%)
0 (0.0%)
65 to 74 Years
1 (100.0%)
0 (0.0%)
75 Years and over
0 (0.0%)
0 (0.0%)
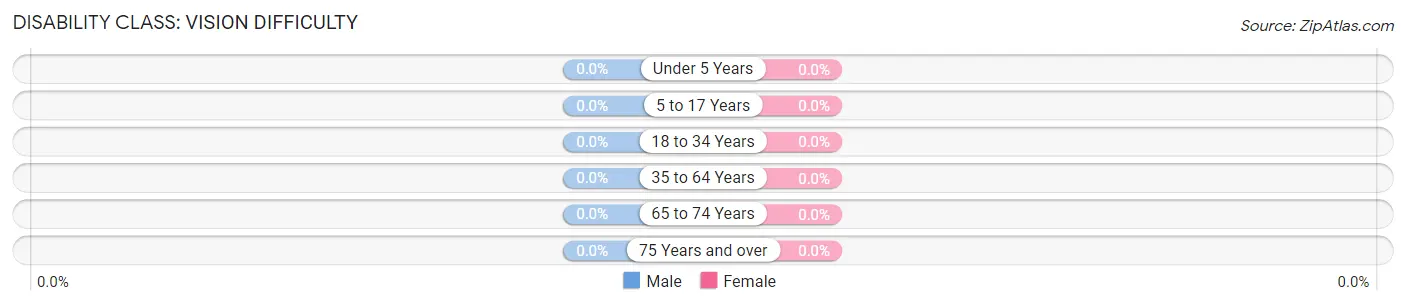
Disability Class: Vision Difficulty
Age Bracket
Male
Female
Under 5 Years
0 (0.0%)
0 (0.0%)
5 to 17 Years
0 (0.0%)
0 (0.0%)
18 to 34 Years
0 (0.0%)
0 (0.0%)
35 to 64 Years
0 (0.0%)
0 (0.0%)
65 to 74 Years
0 (0.0%)
0 (0.0%)
75 Years and over
0 (0.0%)
0 (0.0%)
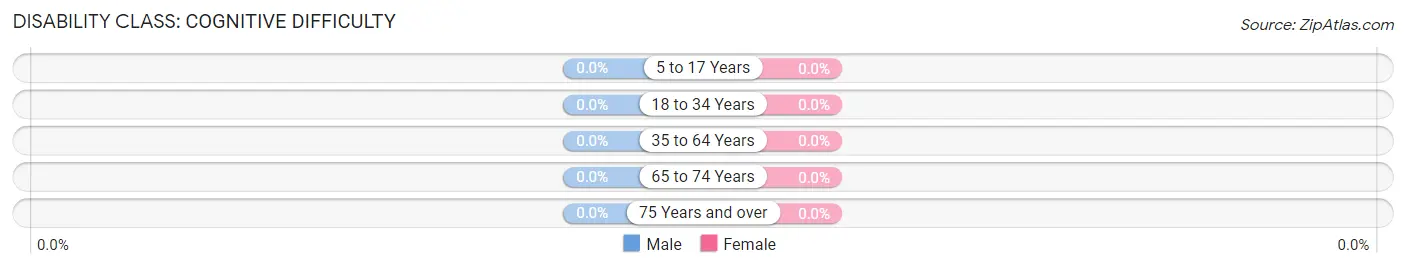
Disability Class: Cognitive Difficulty
Age Bracket
Male
Female
5 to 17 Years
0 (0.0%)
0 (0.0%)
18 to 34 Years
0 (0.0%)
0 (0.0%)
35 to 64 Years
0 (0.0%)
0 (0.0%)
65 to 74 Years
0 (0.0%)
0 (0.0%)
75 Years and over
0 (0.0%)
0 (0.0%)
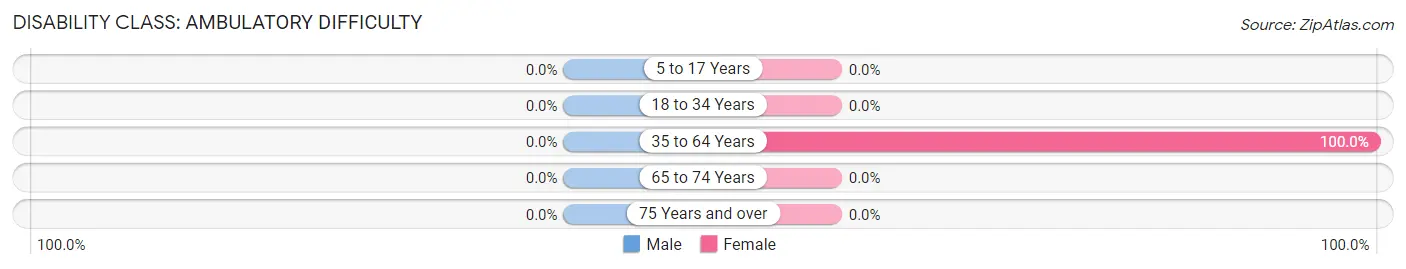
Disability Class: Ambulatory Difficulty
Age Bracket
Male
Female
5 to 17 Years
0 (0.0%)
0 (0.0%)
18 to 34 Years
0 (0.0%)
0 (0.0%)
35 to 64 Years
0 (0.0%)
1 (100.0%)
65 to 74 Years
0 (0.0%)
0 (0.0%)
75 Years and over
0 (0.0%)
0 (0.0%)
Disability Class: Self-Care Difficulty
Age Bracket
Male
Female
5 to 17 Years
0 (0.0%)
0 (0.0%)
18 to 34 Years
0 (0.0%)
0 (0.0%)
35 to 64 Years
0 (0.0%)
0 (0.0%)
65 to 74 Years
0 (0.0%)
0 (0.0%)
75 Years and over
0 (0.0%)
0 (0.0%)
Technology Access in Pillsbury
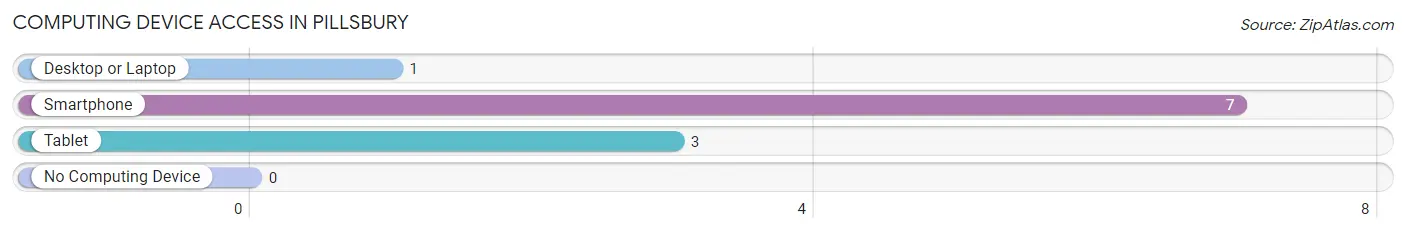
Computing Device Access in Pillsbury
Device Type
# Households
% Households
Desktop or Laptop
1
14.3%
Smartphone
7
100.0%
Tablet
3
42.9%
No Computing Device
0
0.0%
Total
7
100.0%
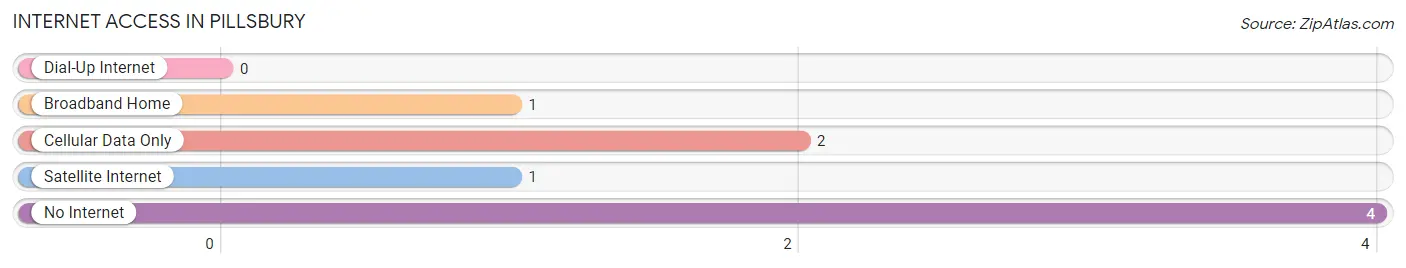
Internet Access in Pillsbury
Internet Type
# Households
% Households
Dial-Up Internet
0
0.0%
Broadband Home
1
14.3%
Cellular Data Only
2
28.6%
Satellite Internet
1
14.3%
No Internet
4
57.1%
Total
7
100.0%
Pillsbury Summary
Pillsbury is a small town located in Traill County, North Dakota. It is situated on the banks of the Red River of the North, approximately 20 miles south of Grand Forks. The town was founded in 1881 and was named after the Pillsbury family, who were early settlers in the area.
Geography
Pillsbury is located in the Red River Valley, a flat, fertile region of North Dakota. The town is situated on the banks of the Red River of the North, which forms the border between North Dakota and Minnesota. The town is surrounded by agricultural land, with the nearest major city being Grand Forks, located 20 miles to the north.
The climate in Pillsbury is continental, with cold winters and hot summers. The average annual temperature is around 40°F (4°C). The average annual precipitation is around 20 inches (51 cm).
Economy
The economy of Pillsbury is largely based on agriculture. The town is surrounded by fertile farmland, and the main crops grown in the area are wheat, corn, soybeans, and sugar beets. The town also has a small manufacturing sector, with a few small factories producing a variety of goods.
The town also has a small tourism industry, with visitors coming to the area to enjoy the natural beauty of the Red River Valley.
Demographics
As of the 2010 census, the population of Pillsbury was 545. The racial makeup of the town was 97.3% White, 0.7% Native American, 0.2% Asian, and 1.8% from two or more races. The median household income was $41,250, and the median family income was $50,000.
The town has a small but diverse population, with a variety of religious backgrounds. The largest religious group in the town is the Catholic Church, followed by the Lutheran Church.
Conclusion
Pillsbury is a small town located in Traill County, North Dakota. It is situated on the banks of the Red River of the North, approximately 20 miles south of Grand Forks. The town was founded in 1881 and was named after the Pillsbury family, who were early settlers in the area. The economy of Pillsbury is largely based on agriculture, with the main crops grown in the area being wheat, corn, soybeans, and sugar beets. The town also has a small manufacturing sector, with a few small factories producing a variety of goods. The town also has a small tourism industry, with visitors coming to the area to enjoy the natural beauty of the Red River Valley. As of the 2010 census, the population of Pillsbury was 545. The racial makeup of the town was 97.3% White, 0.7% Native American, 0.2% Asian, and 1.8% from two or more races. The median household income was $41,250, and the median family income was $50,000. The town has a small but diverse population, with a variety of religious backgrounds.
Common Questions
What is Per Capita Income in Pillsbury?
Per Capita income in Pillsbury is $39,056.
What is Inequality or Gini Index in Pillsbury?
Inequality or Gini Index in Pillsbury is 0.52.
What is the Total Population of Pillsbury?
Total Population of Pillsbury is 9.
What is the Total Male Population of Pillsbury?
Total Male Population of Pillsbury is 7.
What is the Total Female Population of Pillsbury?
Total Female Population of Pillsbury is 2.
What is the Ratio of Males per 100 Females in Pillsbury?
There are 350.00 Males per 100 Females in Pillsbury.
What is the Ratio of Females per 100 Males in Pillsbury?
There are 28.57 Females per 100 Males in Pillsbury.
What is the Median Population Age in Pillsbury?
Median Population Age in Pillsbury is 71.5 Years.
What is the Average Family Size in Pillsbury
Average Family Size in Pillsbury is 1.5 People.
What is the Average Household Size in Pillsbury
Average Household Size in Pillsbury is 1.3 People.
Report Title
Report Link
HTML Copy & Paste Link
Social Media
Copy and paste the folowing code into any webpage where you would like this interactive chart to display