Zip Codes with the Highest Percentage of Population with a Degree in Visual and Performing Arts in Great Falls, MT
RELATED REPORTS & OPTIONS
Visual and Performing Arts
Great Falls
Compare Zip Codes
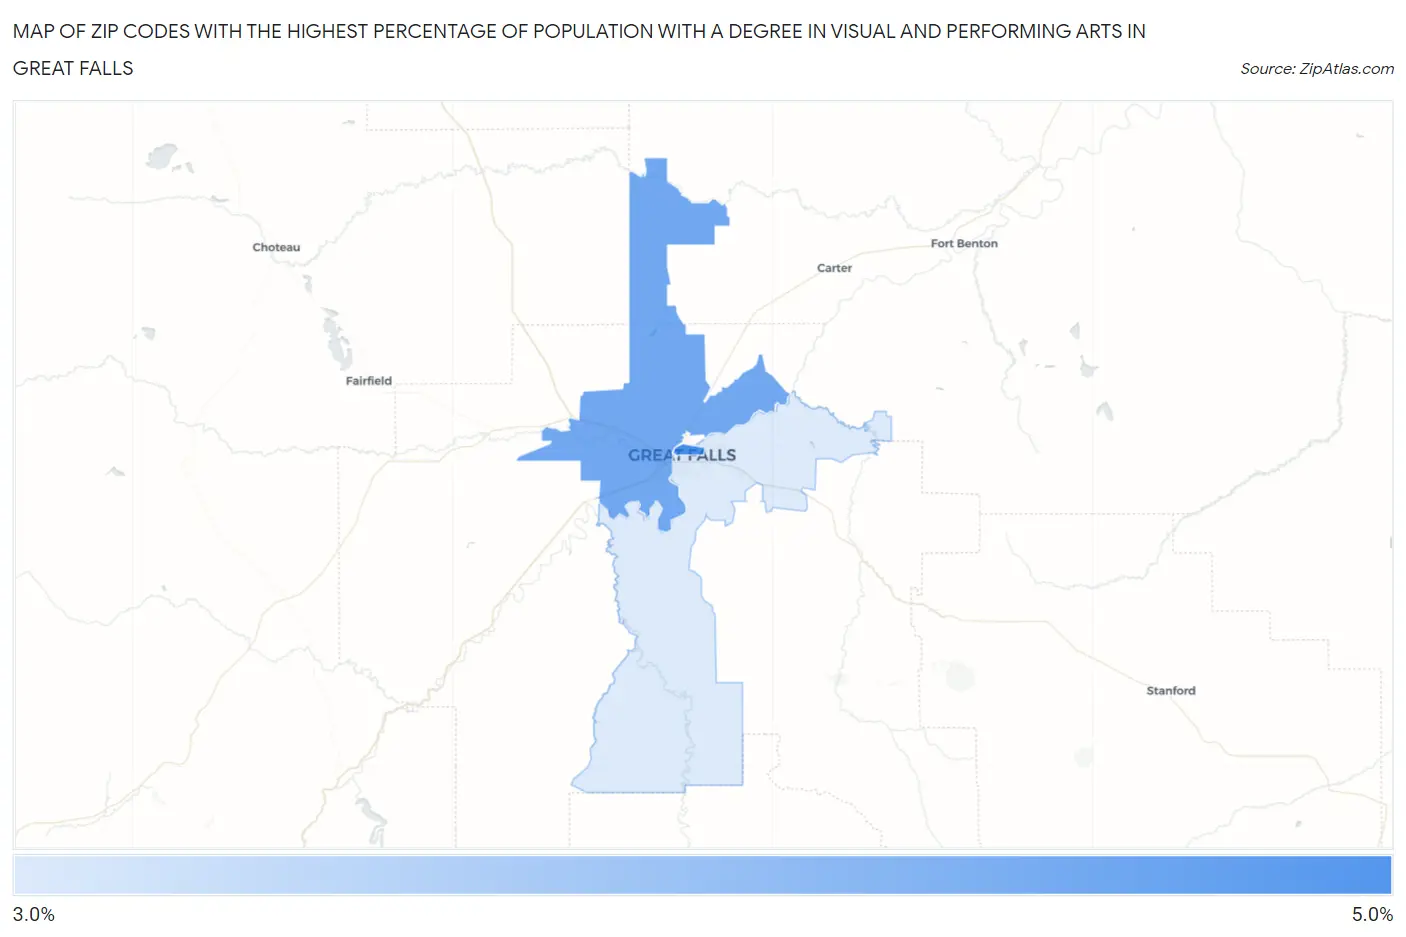
Map of Zip Codes with the Highest Percentage of Population with a Degree in Visual and Performing Arts in Great Falls
3.3%
4.1%
Zip Codes with the Highest Percentage of Population with a Degree in Visual and Performing Arts in Great Falls, MT
| Zip Code | % Graduates | vs State | vs National | |
| 1. | 59401 | 4.1% | 3.8%(+0.329)#74 | 4.3%(-0.141)#8,902 |
| 2. | 59404 | 3.9% | 3.8%(+0.107)#79 | 4.3%(-0.363)#9,612 |
| 3. | 59405 | 3.3% | 3.8%(-0.462)#93 | 4.3%(-0.932)#11,532 |
1
Common Questions
What are the Top Zip Codes with the Highest Percentage of Population with a Degree in Visual and Performing Arts in Great Falls, MT?
Top Zip Codes with the Highest Percentage of Population with a Degree in Visual and Performing Arts in Great Falls, MT are:
What zip code has the Highest Percentage of Population with a Degree in Visual and Performing Arts in Great Falls, MT?
59401 has the Highest Percentage of Population with a Degree in Visual and Performing Arts in Great Falls, MT with 4.1%.
What is the Percentage of Population with a Degree in Visual and Performing Arts in Great Falls, MT?
Percentage of Population with a Degree in Visual and Performing Arts in Great Falls is 3.7%.
What is the Percentage of Population with a Degree in Visual and Performing Arts in Montana?
Percentage of Population with a Degree in Visual and Performing Arts in Montana is 3.8%.
What is the Percentage of Population with a Degree in Visual and Performing Arts in the United States?
Percentage of Population with a Degree in Visual and Performing Arts in the United States is 4.3%.