Zip Codes with the Highest Percentage of Population with a Degree in Psychology in Montana
RELATED REPORTS & OPTIONS
Psychology
Montana
Compare Zip Codes
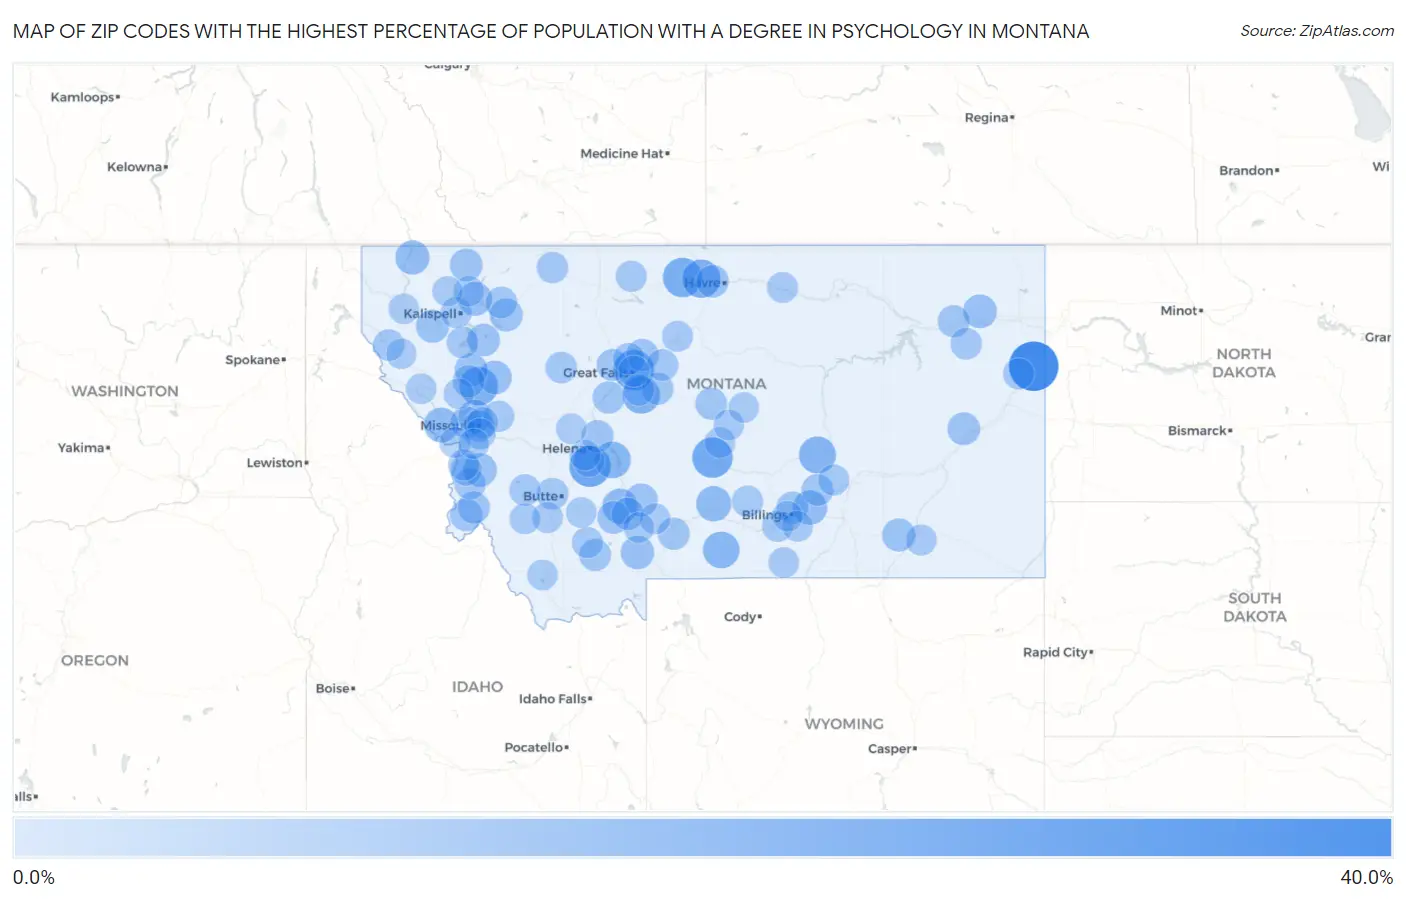
Map of Zip Codes with the Highest Percentage of Population with a Degree in Psychology in Montana
0.0%
40.0%
Zip Codes with the Highest Percentage of Population with a Degree in Psychology in Montana
| Zip Code | % Graduates | vs State | vs National | |
| 1. | 59217 | 33.3% | 4.2%(+29.1)#1 | 5.1%(+28.3)#248 |
| 2. | 59638 | 20.4% | 4.2%(+16.1)#2 | 5.1%(+15.3)#629 |
| 3. | 59414 | 19.0% | 4.2%(+14.7)#3 | 5.1%(+13.9)#728 |
| 4. | 59036 | 18.9% | 4.2%(+14.6)#4 | 5.1%(+13.8)#737 |
| 5. | 59528 | 17.1% | 4.2%(+12.9)#5 | 5.1%(+12.1)#885 |
| 6. | 59865 | 15.9% | 4.2%(+11.6)#6 | 5.1%(+10.8)#1,024 |
| 7. | 59532 | 15.8% | 4.2%(+11.5)#7 | 5.1%(+10.7)#1,035 |
| 8. | 59480 | 14.3% | 4.2%(+10.0)#8 | 5.1%(+9.23)#1,237 |
| 9. | 59059 | 13.6% | 4.2%(+9.32)#9 | 5.1%(+8.51)#1,366 |
| 10. | 59028 | 13.0% | 4.2%(+8.71)#10 | 5.1%(+7.90)#1,490 |
| 11. | 59647 | 12.9% | 4.2%(+8.64)#11 | 5.1%(+7.83)#1,503 |
| 12. | 59011 | 10.8% | 4.2%(+6.53)#12 | 5.1%(+5.72)#2,148 |
| 13. | 59752 | 10.7% | 4.2%(+6.43)#13 | 5.1%(+5.62)#2,189 |
| 14. | 59820 | 10.2% | 4.2%(+5.92)#14 | 5.1%(+5.11)#2,412 |
| 15. | 59037 | 9.7% | 4.2%(+5.45)#15 | 5.1%(+4.64)#2,665 |
| 16. | 59930 | 9.2% | 4.2%(+4.92)#16 | 5.1%(+4.11)#3,008 |
| 17. | 59919 | 8.9% | 4.2%(+4.62)#17 | 5.1%(+3.81)#3,256 |
| 18. | 59828 | 8.4% | 4.2%(+4.21)#18 | 5.1%(+3.40)#3,659 |
| 19. | 59255 | 8.4% | 4.2%(+4.14)#19 | 5.1%(+3.33)#3,730 |
| 20. | 59826 | 8.3% | 4.2%(+4.05)#20 | 5.1%(+3.24)#3,816 |
| 21. | 59730 | 8.0% | 4.2%(+3.78)#21 | 5.1%(+2.97)#4,093 |
| 22. | 59043 | 7.6% | 4.2%(+3.39)#22 | 5.1%(+2.58)#4,597 |
| 23. | 59925 | 7.6% | 4.2%(+3.35)#23 | 5.1%(+2.54)#4,675 |
| 24. | 59936 | 7.5% | 4.2%(+3.29)#24 | 5.1%(+2.48)#4,770 |
| 25. | 59864 | 7.5% | 4.2%(+3.28)#25 | 5.1%(+2.47)#4,776 |
| 26. | 59808 | 7.5% | 4.2%(+3.26)#26 | 5.1%(+2.45)#4,804 |
| 27. | 59714 | 7.3% | 4.2%(+3.10)#27 | 5.1%(+2.29)#5,080 |
| 28. | 59928 | 7.1% | 4.2%(+2.90)#28 | 5.1%(+2.09)#5,397 |
| 29. | 59349 | 7.0% | 4.2%(+2.79)#29 | 5.1%(+1.98)#5,579 |
| 30. | 59760 | 6.9% | 4.2%(+2.66)#30 | 5.1%(+1.85)#5,825 |
| 31. | 59911 | 6.9% | 4.2%(+2.62)#31 | 5.1%(+1.81)#5,884 |
| 32. | 59501 | 6.7% | 4.2%(+2.51)#32 | 5.1%(+1.70)#6,109 |
| 33. | 59829 | 6.7% | 4.2%(+2.42)#33 | 5.1%(+1.60)#6,321 |
| 34. | 59741 | 6.5% | 4.2%(+2.23)#34 | 5.1%(+1.42)#6,714 |
| 35. | 59440 | 6.5% | 4.2%(+2.21)#35 | 5.1%(+1.40)#6,769 |
| 36. | 59827 | 6.3% | 4.2%(+2.08)#36 | 5.1%(+1.26)#7,100 |
| 37. | 59602 | 6.3% | 4.2%(+2.04)#37 | 5.1%(+1.22)#7,194 |
| 38. | 59421 | 6.2% | 4.2%(+2.01)#38 | 5.1%(+1.20)#7,248 |
| 39. | 59047 | 6.1% | 4.2%(+1.83)#39 | 5.1%(+1.01)#7,758 |
| 40. | 59824 | 6.0% | 4.2%(+1.75)#40 | 5.1%(+0.935)#7,985 |
| 41. | 59412 | 6.0% | 4.2%(+1.74)#41 | 5.1%(+0.927)#8,002 |
| 42. | 59201 | 6.0% | 4.2%(+1.72)#42 | 5.1%(+0.913)#8,045 |
| 43. | 59755 | 5.9% | 4.2%(+1.64)#43 | 5.1%(+0.831)#8,331 |
| 44. | 59105 | 5.9% | 4.2%(+1.63)#44 | 5.1%(+0.816)#8,370 |
| 45. | 59804 | 5.8% | 4.2%(+1.53)#45 | 5.1%(+0.724)#8,654 |
| 46. | 59487 | 5.7% | 4.2%(+1.50)#46 | 5.1%(+0.687)#8,773 |
| 47. | 59462 | 5.7% | 4.2%(+1.47)#47 | 5.1%(+0.663)#8,846 |
| 48. | 59801 | 5.7% | 4.2%(+1.41)#48 | 5.1%(+0.603)#9,020 |
| 49. | 59088 | 5.6% | 4.2%(+1.31)#49 | 5.1%(+0.504)#9,332 |
| 50. | 59450 | 5.5% | 4.2%(+1.28)#50 | 5.1%(+0.466)#9,466 |
| 51. | 59916 | 5.5% | 4.2%(+1.25)#51 | 5.1%(+0.443)#9,540 |
| 52. | 59748 | 5.4% | 4.2%(+1.12)#52 | 5.1%(+0.306)#9,980 |
| 53. | 59914 | 5.2% | 4.2%(+0.968)#53 | 5.1%(+0.157)#10,506 |
| 54. | 59274 | 5.2% | 4.2%(+0.932)#54 | 5.1%(+0.121)#10,644 |
| 55. | 59427 | 5.2% | 4.2%(+0.919)#55 | 5.1%(+0.108)#10,686 |
| 56. | 59410 | 5.1% | 4.2%(+0.888)#56 | 5.1%(+0.077)#10,801 |
| 57. | 59840 | 5.1% | 4.2%(+0.852)#57 | 5.1%(+0.042)#10,928 |
| 58. | 59711 | 5.0% | 4.2%(+0.806)#58 | 5.1%(-0.005)#11,085 |
| 59. | 59404 | 5.0% | 4.2%(+0.778)#59 | 5.1%(-0.033)#11,203 |
| 60. | 59841 | 5.0% | 4.2%(+0.759)#60 | 5.1%(-0.051)#11,267 |
| 61. | 59874 | 5.0% | 4.2%(+0.748)#61 | 5.1%(-0.062)#11,316 |
| 62. | 59634 | 4.9% | 4.2%(+0.664)#62 | 5.1%(-0.147)#11,622 |
| 63. | 59405 | 4.9% | 4.2%(+0.631)#63 | 5.1%(-0.179)#11,718 |
| 64. | 59401 | 4.8% | 4.2%(+0.550)#64 | 5.1%(-0.260)#11,977 |
| 65. | 59067 | 4.8% | 4.2%(+0.521)#65 | 5.1%(-0.289)#12,095 |
| 66. | 59901 | 4.7% | 4.2%(+0.445)#66 | 5.1%(-0.366)#12,382 |
| 67. | 59262 | 4.7% | 4.2%(+0.410)#67 | 5.1%(-0.400)#12,516 |
| 68. | 59044 | 4.5% | 4.2%(+0.307)#68 | 5.1%(-0.504)#12,918 |
| 69. | 59444 | 4.5% | 4.2%(+0.305)#69 | 5.1%(-0.506)#12,953 |
| 70. | 59749 | 4.5% | 4.2%(+0.258)#70 | 5.1%(-0.552)#13,113 |
| 71. | 59823 | 4.5% | 4.2%(+0.222)#71 | 5.1%(-0.589)#13,260 |
| 72. | 59875 | 4.4% | 4.2%(+0.201)#72 | 5.1%(-0.610)#13,339 |
| 73. | 59802 | 4.4% | 4.2%(+0.126)#73 | 5.1%(-0.684)#13,604 |
| 74. | 59024 | 4.3% | 4.2%(+0.107)#74 | 5.1%(-0.703)#13,680 |
| 75. | 59803 | 4.3% | 4.2%(+0.106)#75 | 5.1%(-0.705)#13,688 |
| 76. | 59003 | 4.2% | 4.2%(-0.024)#76 | 5.1%(-0.834)#14,163 |
| 77. | 59601 | 4.2% | 4.2%(-0.034)#77 | 5.1%(-0.844)#14,194 |
| 78. | 59526 | 4.2% | 4.2%(-0.059)#78 | 5.1%(-0.870)#14,296 |
| 79. | 59847 | 4.2% | 4.2%(-0.069)#79 | 5.1%(-0.879)#14,320 |
| 80. | 59442 | 4.2% | 4.2%(-0.074)#80 | 5.1%(-0.884)#14,341 |
| 81. | 59727 | 4.2% | 4.2%(-0.074)#81 | 5.1%(-0.884)#14,352 |
| 82. | 59762 | 4.2% | 4.2%(-0.074)#82 | 5.1%(-0.884)#14,357 |
| 83. | 59715 | 4.2% | 4.2%(-0.084)#83 | 5.1%(-0.895)#14,385 |
| 84. | 59101 | 4.0% | 4.2%(-0.258)#84 | 5.1%(-1.07)#14,990 |
| 85. | 59453 | 3.9% | 4.2%(-0.293)#85 | 5.1%(-1.10)#15,121 |
| 86. | 59014 | 3.9% | 4.2%(-0.328)#86 | 5.1%(-1.14)#15,232 |
| 87. | 59464 | 3.8% | 4.2%(-0.395)#87 | 5.1%(-1.20)#15,466 |
| 88. | 59725 | 3.8% | 4.2%(-0.454)#88 | 5.1%(-1.26)#15,668 |
| 89. | 59759 | 3.7% | 4.2%(-0.504)#89 | 5.1%(-1.31)#15,827 |
| 90. | 59457 | 3.7% | 4.2%(-0.524)#90 | 5.1%(-1.33)#15,902 |
| 91. | 59718 | 3.7% | 4.2%(-0.543)#91 | 5.1%(-1.35)#15,971 |
| 92. | 59866 | 3.7% | 4.2%(-0.547)#92 | 5.1%(-1.36)#15,991 |
| 93. | 59923 | 3.7% | 4.2%(-0.564)#93 | 5.1%(-1.37)#16,038 |
| 94. | 59633 | 3.6% | 4.2%(-0.604)#94 | 5.1%(-1.41)#16,204 |
| 95. | 59912 | 3.5% | 4.2%(-0.718)#95 | 5.1%(-1.53)#16,622 |
| 96. | 59102 | 3.5% | 4.2%(-0.718)#96 | 5.1%(-1.53)#16,626 |
| 97. | 59831 | 3.5% | 4.2%(-0.752)#97 | 5.1%(-1.56)#16,732 |
| 98. | 59937 | 3.5% | 4.2%(-0.766)#98 | 5.1%(-1.58)#16,778 |
| 99. | 59873 | 3.5% | 4.2%(-0.771)#99 | 5.1%(-1.58)#16,795 |
| 100. | 59833 | 3.4% | 4.2%(-0.801)#100 | 5.1%(-1.61)#16,887 |
Common Questions
What are the Top 10 Zip Codes with the Highest Percentage of Population with a Degree in Psychology in Montana?
Top 10 Zip Codes with the Highest Percentage of Population with a Degree in Psychology in Montana are:
What zip code has the Highest Percentage of Population with a Degree in Psychology in Montana?
59217 has the Highest Percentage of Population with a Degree in Psychology in Montana with 33.3%.
What is the Percentage of Population with a Degree in Psychology in the State of Montana?
Percentage of Population with a Degree in Psychology in Montana is 4.2%.
What is the Percentage of Population with a Degree in Psychology in the United States?
Percentage of Population with a Degree in Psychology in the United States is 5.1%.