West Havre, MT Map & Demographics
West Havre Map
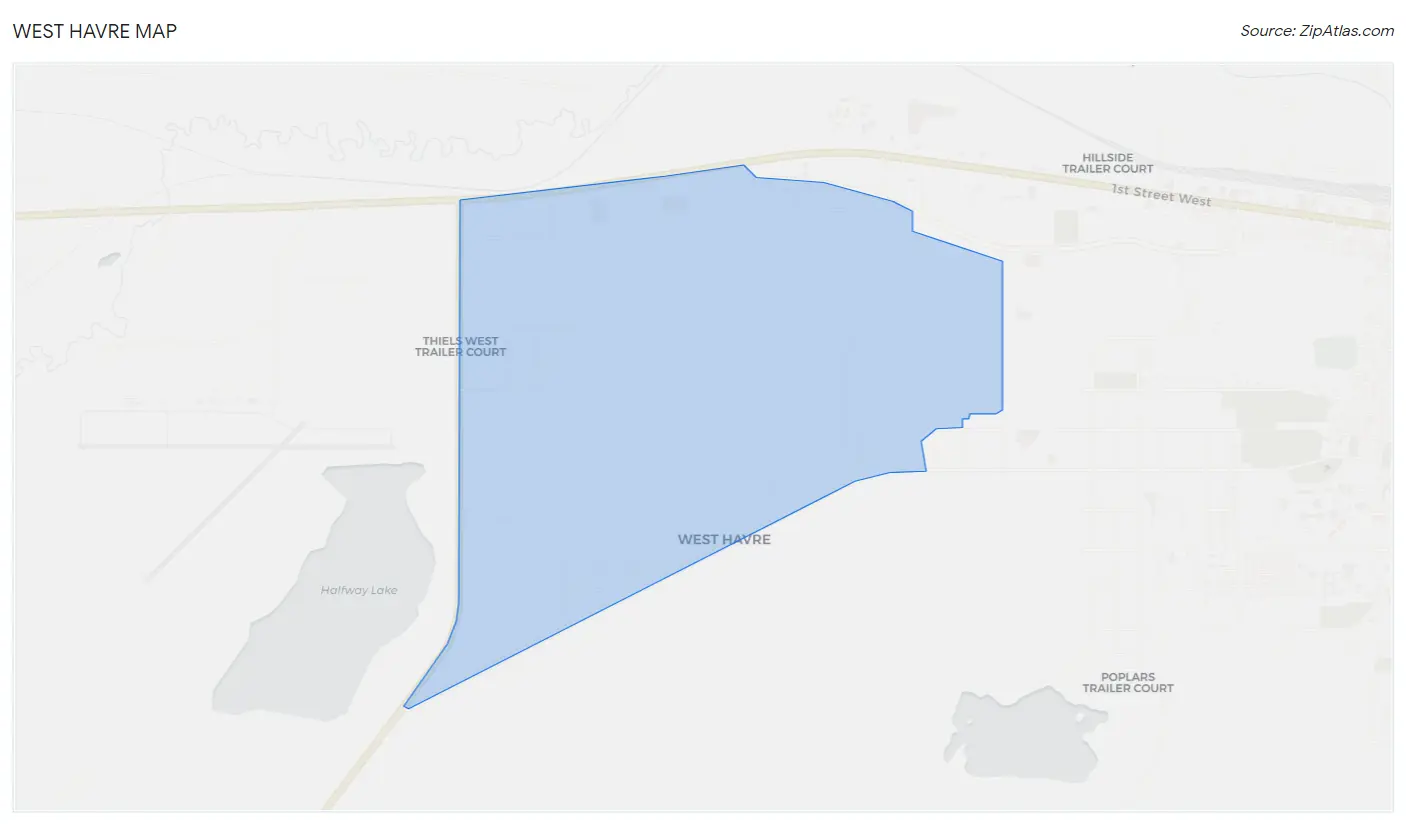
West Havre Overview
$36,919
PER CAPITA INCOME
$108,688
AVG FAMILY INCOME
0.33
INEQUALITY / GINI INDEX
144
TOTAL POPULATION
67
MALE POPULATION
77
FEMALE POPULATION
87.01
MALES / 100 FEMALES
114.93
FEMALES / 100 MALES
64.2
MEDIAN AGE
2.7
AVG FAMILY SIZE
2.0
AVG HOUSEHOLD SIZE
87
LABOR FORCE [ PEOPLE ]
60.4%
PERCENT IN LABOR FORCE
Income in West Havre
Income Overview in West Havre
| Characteristic | Number | Measure |
| Per Capita Income | 144 | $36,919 |
| Median Family Income | 41 | $108,688 |
| Mean Family Income | 41 | $101,254 |
| Median Household Income | 73 | $0 |
| Mean Household Income | 73 | $70,571 |
| Income Deficit | 41 | $0 |
| Wage / Income Gap (%) | 144 | 0.00% |
| Wage / Income Gap ($) | 144 | 100.00¢ per $1 |
| Gini / Inequality Index | 144 | 0.33 |
Earnings by Sex in West Havre
| Sex | Number | Average Earnings |
| Male | 50 (44.3%) | $0 |
| Female | 63 (55.7%) | $0 |
| Total | 113 (100.0%) | $0 |
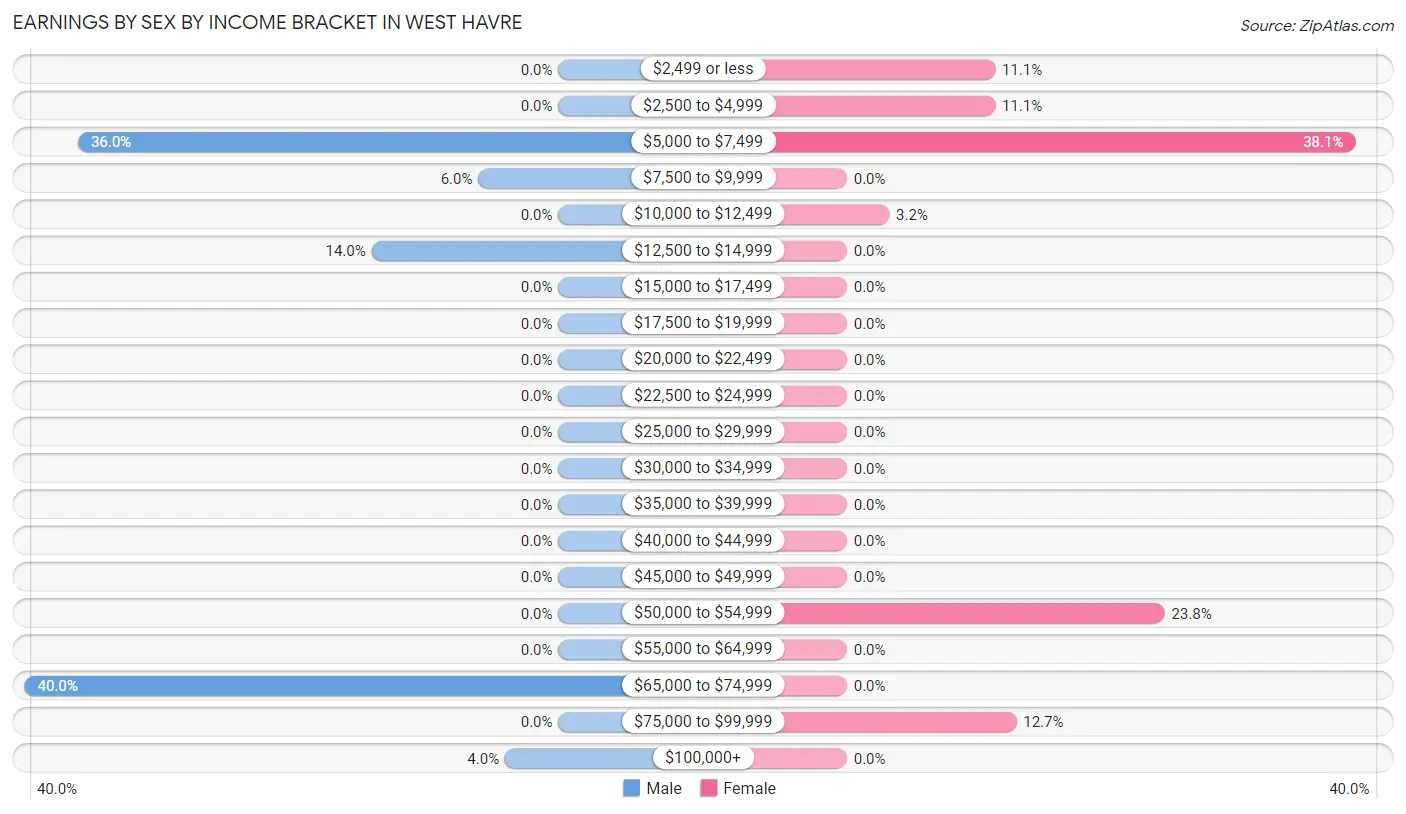
Earnings by Sex by Income Bracket in West Havre
The most common earnings brackets in West Havre are $65,000 to $74,999 for men (20 | 40.0%) and $5,000 to $7,499 for women (24 | 38.1%).
| Income | Male | Female |
| $2,499 or less | 0 (0.0%) | 7 (11.1%) |
| $2,500 to $4,999 | 0 (0.0%) | 7 (11.1%) |
| $5,000 to $7,499 | 18 (36.0%) | 24 (38.1%) |
| $7,500 to $9,999 | 3 (6.0%) | 0 (0.0%) |
| $10,000 to $12,499 | 0 (0.0%) | 2 (3.2%) |
| $12,500 to $14,999 | 7 (14.0%) | 0 (0.0%) |
| $15,000 to $17,499 | 0 (0.0%) | 0 (0.0%) |
| $17,500 to $19,999 | 0 (0.0%) | 0 (0.0%) |
| $20,000 to $22,499 | 0 (0.0%) | 0 (0.0%) |
| $22,500 to $24,999 | 0 (0.0%) | 0 (0.0%) |
| $25,000 to $29,999 | 0 (0.0%) | 0 (0.0%) |
| $30,000 to $34,999 | 0 (0.0%) | 0 (0.0%) |
| $35,000 to $39,999 | 0 (0.0%) | 0 (0.0%) |
| $40,000 to $44,999 | 0 (0.0%) | 0 (0.0%) |
| $45,000 to $49,999 | 0 (0.0%) | 0 (0.0%) |
| $50,000 to $54,999 | 0 (0.0%) | 15 (23.8%) |
| $55,000 to $64,999 | 0 (0.0%) | 0 (0.0%) |
| $65,000 to $74,999 | 20 (40.0%) | 0 (0.0%) |
| $75,000 to $99,999 | 0 (0.0%) | 8 (12.7%) |
| $100,000+ | 2 (4.0%) | 0 (0.0%) |
| Total | 50 (100.0%) | 63 (100.0%) |
Earnings by Sex by Educational Attainment in West Havre
| Educational Attainment | Male Income | Female Income |
| Less than High School | - | - |
| High School Diploma | - | - |
| College or Associate's Degree | - | - |
| Bachelor's Degree | - | - |
| Graduate Degree | - | - |
| Total | - | - |
Family Income in West Havre
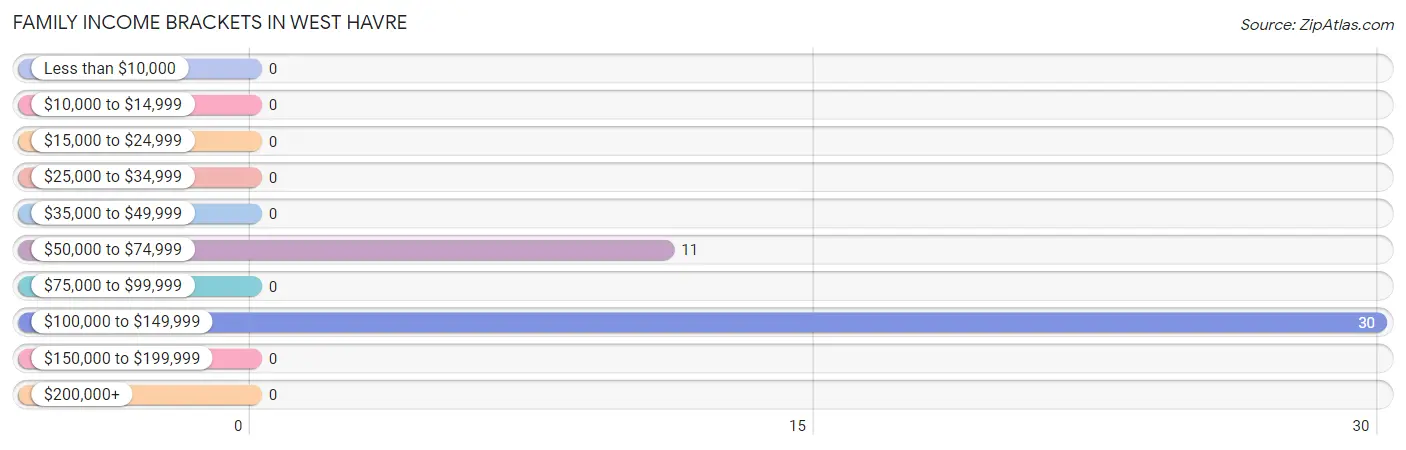
Family Income Brackets in West Havre
According to the West Havre family income data, there are 30 families falling into the $100,000 to $149,999 income range, which is the most common income bracket and makes up 73.2% of all families.
| Income Bracket | # Families | % Families |
| Less than $10,000 | 0 | 0.0% |
| $10,000 to $14,999 | 0 | 0.0% |
| $15,000 to $24,999 | 0 | 0.0% |
| $25,000 to $34,999 | 0 | 0.0% |
| $35,000 to $49,999 | 0 | 0.0% |
| $50,000 to $74,999 | 11 | 26.8% |
| $75,000 to $99,999 | 0 | 0.0% |
| $100,000 to $149,999 | 30 | 73.2% |
| $150,000 to $199,999 | 0 | 0.0% |
| $200,000+ | 0 | 0.0% |
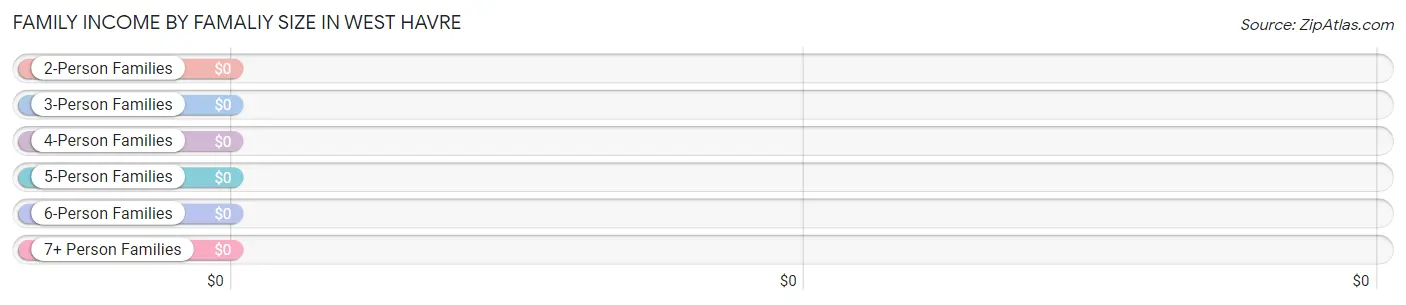
Family Income by Famaliy Size in West Havre
| Income Bracket | # Families | Median Income |
| 2-Person Families | 22 (53.7%) | $0 |
| 3-Person Families | 11 (26.8%) | $0 |
| 4-Person Families | 8 (19.5%) | $0 |
| 5-Person Families | 0 (0.0%) | $0 |
| 6-Person Families | 0 (0.0%) | $0 |
| 7+ Person Families | 0 (0.0%) | $0 |
| Total | 41 (100.0%) | $108,688 |
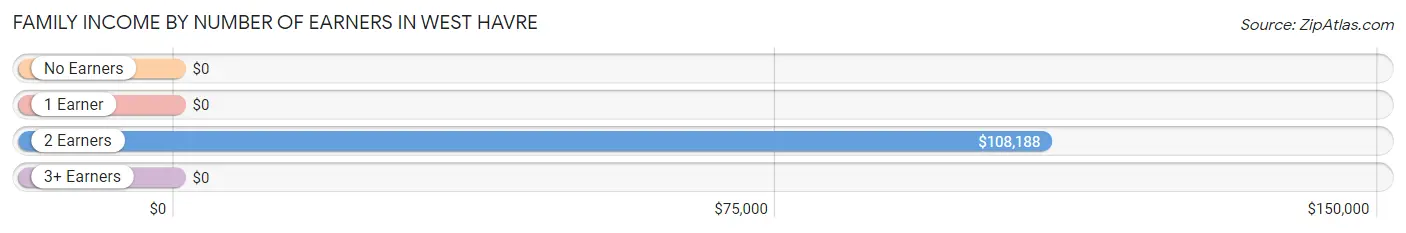
Family Income by Number of Earners in West Havre
| Number of Earners | # Families | Median Income |
| No Earners | 0 (0.0%) | $0 |
| 1 Earner | 0 (0.0%) | $0 |
| 2 Earners | 33 (80.5%) | $108,188 |
| 3+ Earners | 8 (19.5%) | $0 |
| Total | 41 (100.0%) | $108,688 |
Household Income in West Havre
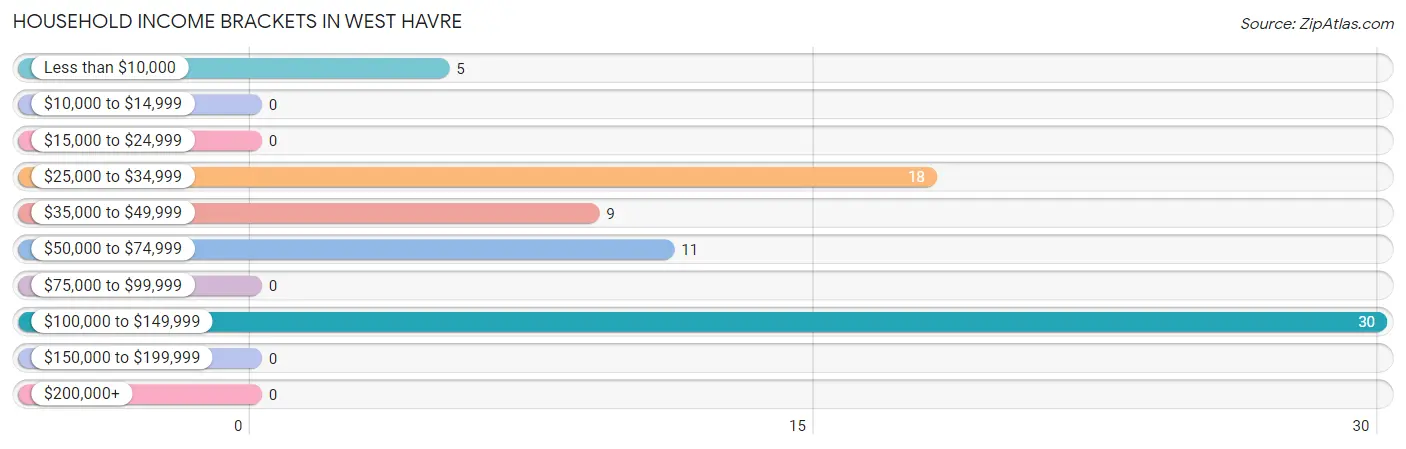
Household Income Brackets in West Havre
With 30 households falling in the category, the $100,000 to $149,999 income range is the most frequent in West Havre, accounting for 41.1% of all households.
| Income Bracket | # Households | % Households |
| Less than $10,000 | 5 | 6.8% |
| $10,000 to $14,999 | 0 | 0.0% |
| $15,000 to $24,999 | 0 | 0.0% |
| $25,000 to $34,999 | 18 | 24.7% |
| $35,000 to $49,999 | 9 | 12.3% |
| $50,000 to $74,999 | 11 | 15.1% |
| $75,000 to $99,999 | 0 | 0.0% |
| $100,000 to $149,999 | 30 | 41.1% |
| $150,000 to $199,999 | 0 | 0.0% |
| $200,000+ | 0 | 0.0% |
Household Income by Householder Age in West Havre
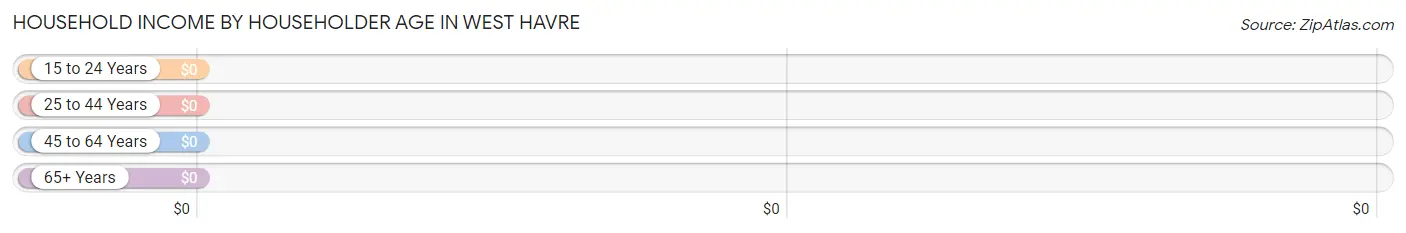
| Income Bracket | # Households | Median Income |
| 15 to 24 Years | 0 (0.0%) | $0 |
| 25 to 44 Years | 8 (11.0%) | $0 |
| 45 to 64 Years | 13 (17.8%) | $0 |
| 65+ Years | 52 (71.2%) | $0 |
| Total | 73 (100.0%) | $0 |
Poverty in West Havre
Income Below Poverty by Sex and Age in West Havre
With 4.5% poverty level for males and 6.5% for females among the residents of West Havre, 18 to 24 year old males and 75 year old and over females are the most vulnerable to poverty, with 3 males (30.0%) and 5 females (100.0%) in their respective age groups living below the poverty level.
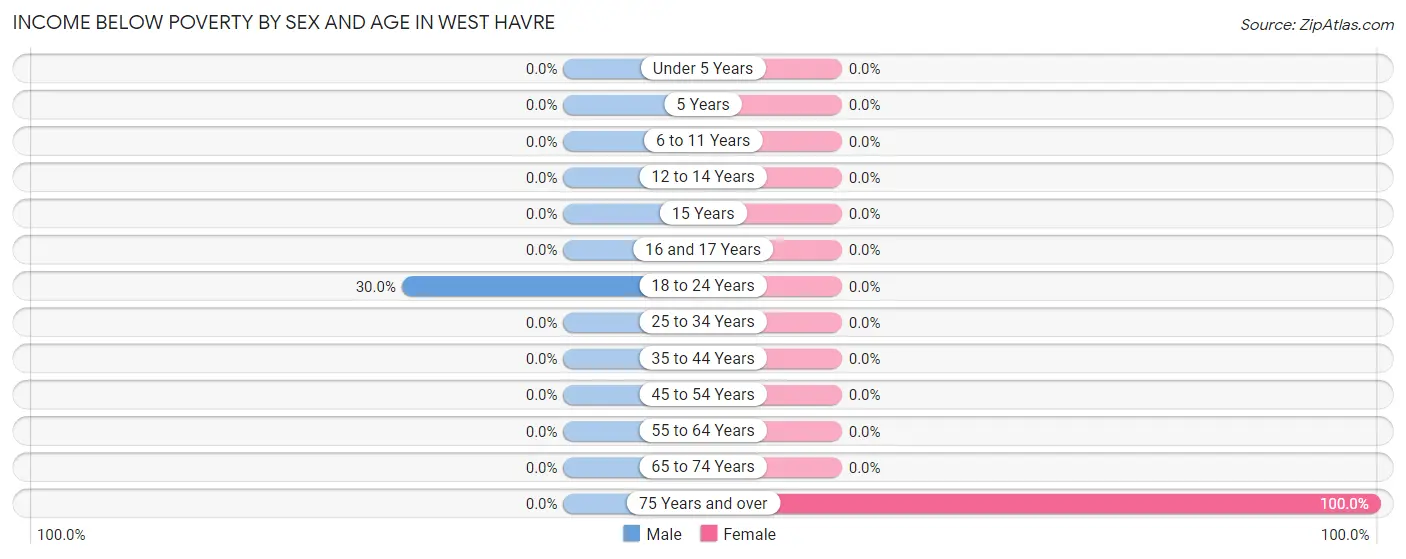
| Age Bracket | Male | Female |
| Under 5 Years | 0 (0.0%) | 0 (0.0%) |
| 5 Years | 0 (0.0%) | 0 (0.0%) |
| 6 to 11 Years | 0 (0.0%) | 0 (0.0%) |
| 12 to 14 Years | 0 (0.0%) | 0 (0.0%) |
| 15 Years | 0 (0.0%) | 0 (0.0%) |
| 16 and 17 Years | 0 (0.0%) | 0 (0.0%) |
| 18 to 24 Years | 3 (30.0%) | 0 (0.0%) |
| 25 to 34 Years | 0 (0.0%) | 0 (0.0%) |
| 35 to 44 Years | 0 (0.0%) | 0 (0.0%) |
| 45 to 54 Years | 0 (0.0%) | 0 (0.0%) |
| 55 to 64 Years | 0 (0.0%) | 0 (0.0%) |
| 65 to 74 Years | 0 (0.0%) | 0 (0.0%) |
| 75 Years and over | 0 (0.0%) | 5 (100.0%) |
| Total | 3 (4.5%) | 5 (6.5%) |
Income Above Poverty by Sex and Age in West Havre
According to the poverty statistics in West Havre, males aged 35 to 44 years and females aged 18 to 24 years are the age groups that are most secure financially, with 100.0% of males and 100.0% of females in these age groups living above the poverty line.
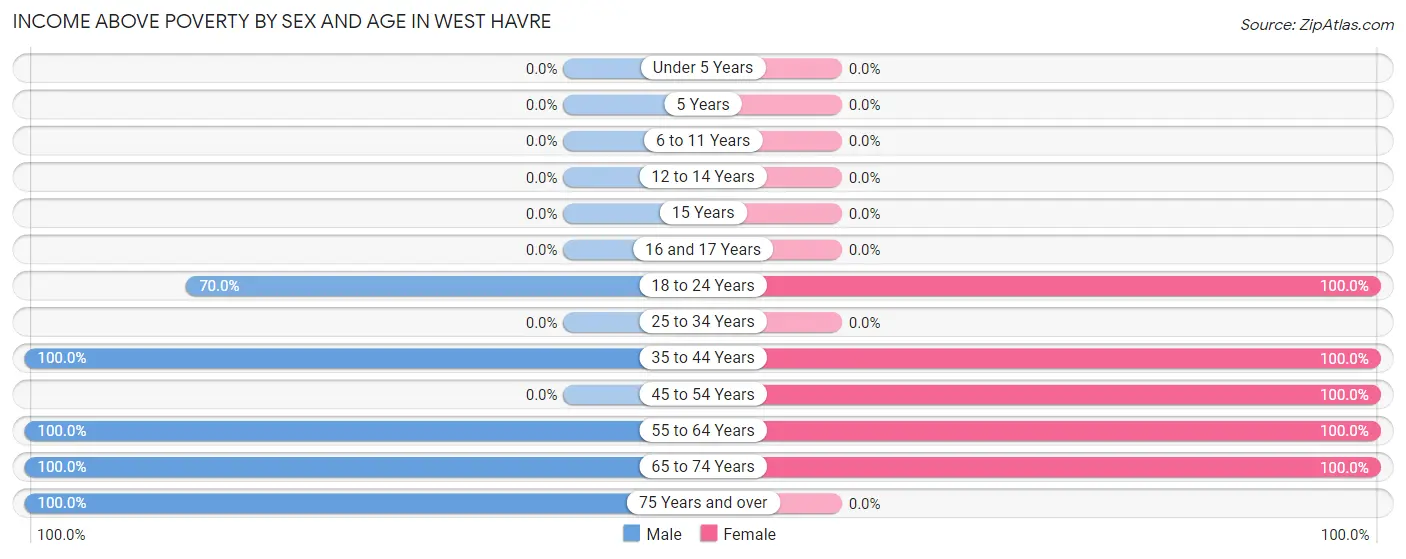
| Age Bracket | Male | Female |
| Under 5 Years | 0 (0.0%) | 0 (0.0%) |
| 5 Years | 0 (0.0%) | 0 (0.0%) |
| 6 to 11 Years | 0 (0.0%) | 0 (0.0%) |
| 12 to 14 Years | 0 (0.0%) | 0 (0.0%) |
| 15 Years | 0 (0.0%) | 0 (0.0%) |
| 16 and 17 Years | 0 (0.0%) | 0 (0.0%) |
| 18 to 24 Years | 7 (70.0%) | 14 (100.0%) |
| 25 to 34 Years | 0 (0.0%) | 0 (0.0%) |
| 35 to 44 Years | 6 (100.0%) | 8 (100.0%) |
| 45 to 54 Years | 0 (0.0%) | 15 (100.0%) |
| 55 to 64 Years | 13 (100.0%) | 26 (100.0%) |
| 65 to 74 Years | 20 (100.0%) | 9 (100.0%) |
| 75 Years and over | 18 (100.0%) | 0 (0.0%) |
| Total | 64 (95.5%) | 72 (93.5%) |
Income Below Poverty Among Married-Couple Families in West Havre
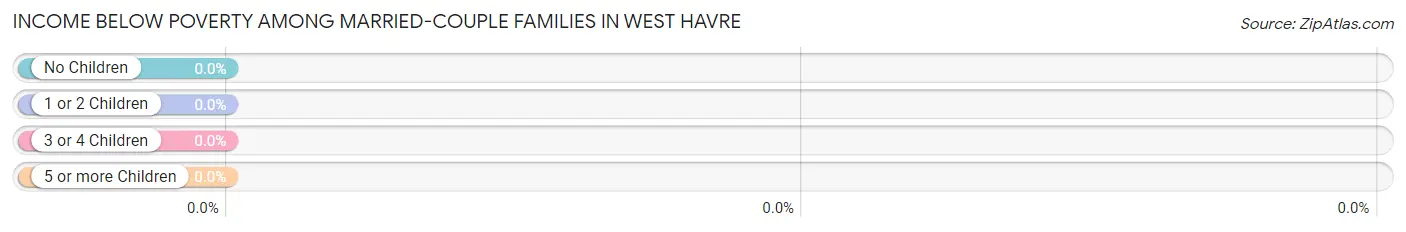
| Children | Above Poverty | Below Poverty |
| No Children | 41 (100.0%) | 0 (0.0%) |
| 1 or 2 Children | 0 (0.0%) | 0 (0.0%) |
| 3 or 4 Children | 0 (0.0%) | 0 (0.0%) |
| 5 or more Children | 0 (0.0%) | 0 (0.0%) |
| Total | 41 (100.0%) | 0 (0.0%) |
Income Below Poverty Among Single-Parent Households in West Havre
| Children | Single Father | Single Mother |
| No Children | 0 (0.0%) | 0 (0.0%) |
| 1 or 2 Children | 0 (0.0%) | 0 (0.0%) |
| 3 or 4 Children | 0 (0.0%) | 0 (0.0%) |
| 5 or more Children | 0 (0.0%) | 0 (0.0%) |
| Total | 0 (0.0%) | 0 (0.0%) |
Income Below Poverty Among Married-Couple vs Single-Parent Households in West Havre
| Children | Married-Couple Families | Single-Parent Households |
| No Children | 0 (0.0%) | 0 (0.0%) |
| 1 or 2 Children | 0 (0.0%) | 0 (0.0%) |
| 3 or 4 Children | 0 (0.0%) | 0 (0.0%) |
| 5 or more Children | 0 (0.0%) | 0 (0.0%) |
| Total | 0 (0.0%) | 0 (0.0%) |
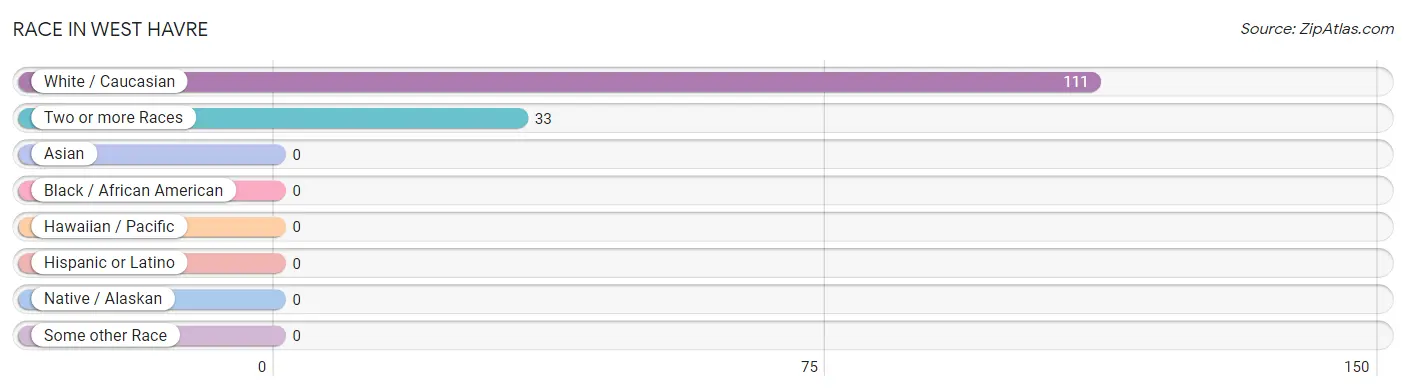
Race in West Havre
The most populous races in West Havre are White / Caucasian (111 | 77.1%), and Two or more Races (33 | 22.9%).
| Race | # Population | % Population |
| Asian | 0 | 0.0% |
| Black / African American | 0 | 0.0% |
| Hawaiian / Pacific | 0 | 0.0% |
| Hispanic or Latino | 0 | 0.0% |
| Native / Alaskan | 0 | 0.0% |
| White / Caucasian | 111 | 77.1% |
| Two or more Races | 33 | 22.9% |
| Some other Race | 0 | 0.0% |
| Total | 144 | 100.0% |
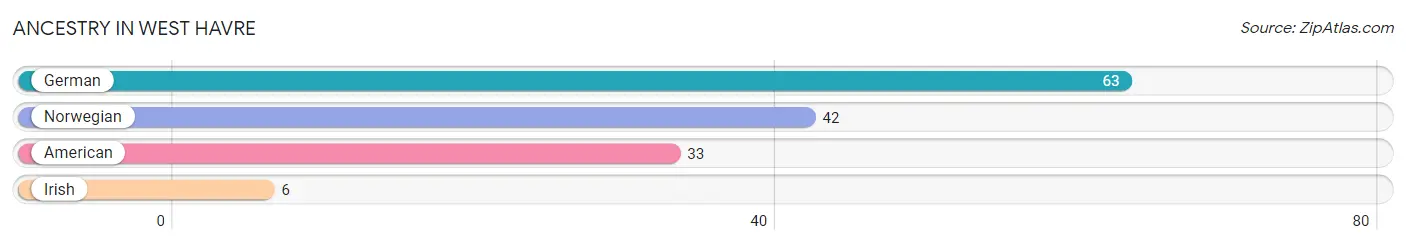
Ancestry in West Havre
The most populous ancestries reported in West Havre are German (63 | 43.8%), Norwegian (42 | 29.2%), American (33 | 22.9%), and Irish (6 | 4.2%), together accounting for 100.0% of all West Havre residents.
| Ancestry | # Population | % Population |
| American | 33 | 22.9% |
| German | 63 | 43.8% |
| Irish | 6 | 4.2% |
| Norwegian | 42 | 29.2% | View All 4 Rows |
Immigrants in West Havre

| Immigration Origin | # Population | % Population | View All 0 Rows |
Sex and Age in West Havre
Sex and Age in West Havre
The most populous age groups in West Havre are 65 to 69 Years (20 | 29.8%) for men and 60 to 64 Years (24 | 31.2%) for women.
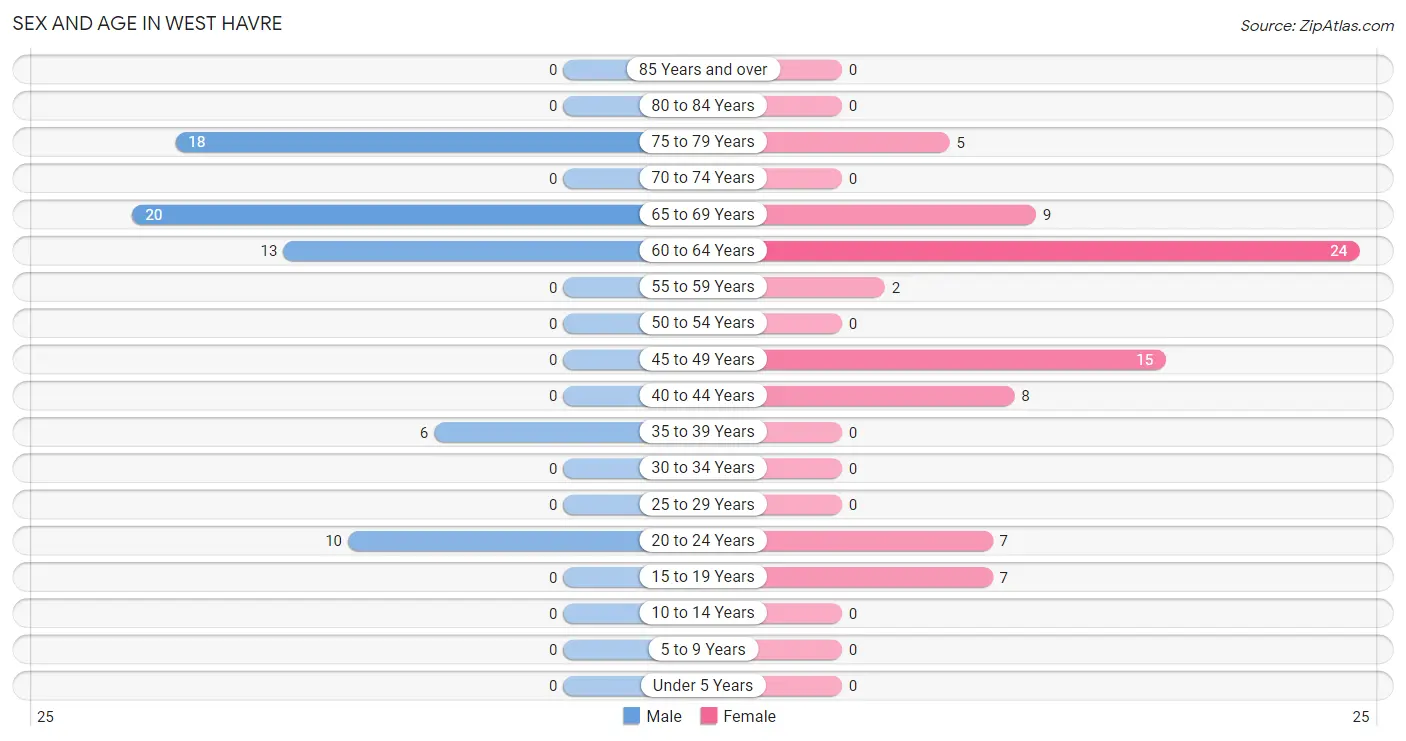
| Age Bracket | Male | Female |
| Under 5 Years | 0 (0.0%) | 0 (0.0%) |
| 5 to 9 Years | 0 (0.0%) | 0 (0.0%) |
| 10 to 14 Years | 0 (0.0%) | 0 (0.0%) |
| 15 to 19 Years | 0 (0.0%) | 7 (9.1%) |
| 20 to 24 Years | 10 (14.9%) | 7 (9.1%) |
| 25 to 29 Years | 0 (0.0%) | 0 (0.0%) |
| 30 to 34 Years | 0 (0.0%) | 0 (0.0%) |
| 35 to 39 Years | 6 (9.0%) | 0 (0.0%) |
| 40 to 44 Years | 0 (0.0%) | 8 (10.4%) |
| 45 to 49 Years | 0 (0.0%) | 15 (19.5%) |
| 50 to 54 Years | 0 (0.0%) | 0 (0.0%) |
| 55 to 59 Years | 0 (0.0%) | 2 (2.6%) |
| 60 to 64 Years | 13 (19.4%) | 24 (31.2%) |
| 65 to 69 Years | 20 (29.8%) | 9 (11.7%) |
| 70 to 74 Years | 0 (0.0%) | 0 (0.0%) |
| 75 to 79 Years | 18 (26.9%) | 5 (6.5%) |
| 80 to 84 Years | 0 (0.0%) | 0 (0.0%) |
| 85 Years and over | 0 (0.0%) | 0 (0.0%) |
| Total | 67 (100.0%) | 77 (100.0%) |
Families and Households in West Havre
Median Family Size in West Havre
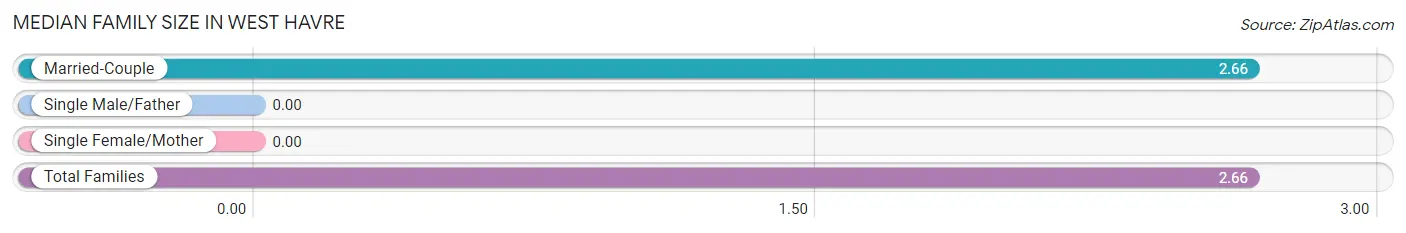
| Family Type | # Families | Family Size |
| Married-Couple | 41 (100.0%) | 2.66 |
| Single Male/Father | 0 (0.0%) | - |
| Single Female/Mother | 0 (0.0%) | - |
| Total Families | 41 (100.0%) | 2.66 |
Median Household Size in West Havre
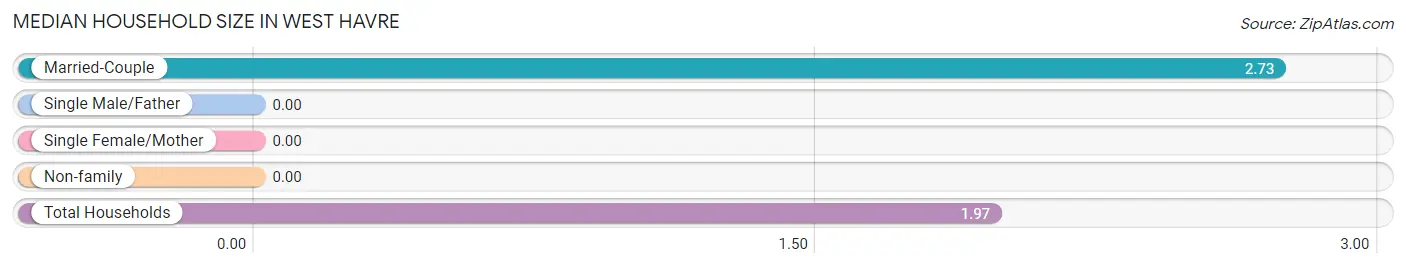
| Household Type | # Households | Household Size |
| Married-Couple | 41 (56.2%) | 2.73 |
| Single Male/Father | 0 (0.0%) | - |
| Single Female/Mother | 0 (0.0%) | - |
| Non-family | 32 (43.8%) | - |
| Total Households | 73 (100.0%) | 1.97 |
Household Size by Marriage Status in West Havre
Out of a total of 73 households in West Havre, 41 (56.2%) are family households, while 32 (43.8%) are nonfamily households. The most numerous type of family households are 2-person households, comprising 22, and the most common type of nonfamily households are 1-person households, comprising 32.
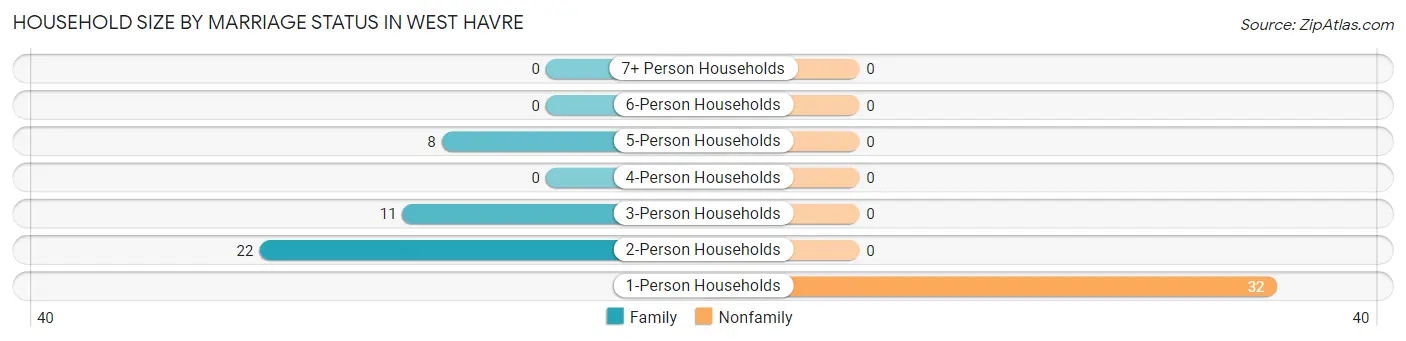
| Household Size | Family Households | Nonfamily Households |
| 1-Person Households | - | 32 (43.8%) |
| 2-Person Households | 22 (30.1%) | 0 (0.0%) |
| 3-Person Households | 11 (15.1%) | 0 (0.0%) |
| 4-Person Households | 0 (0.0%) | 0 (0.0%) |
| 5-Person Households | 8 (11.0%) | 0 (0.0%) |
| 6-Person Households | 0 (0.0%) | 0 (0.0%) |
| 7+ Person Households | 0 (0.0%) | 0 (0.0%) |
| Total | 41 (56.2%) | 32 (43.8%) |
Female Fertility in West Havre
Fertility by Age in West Havre
| Age Bracket | Women with Births | Births / 1,000 Women |
| 15 to 19 years | 0 (0.0%) | 0.0 |
| 20 to 34 years | 0 (0.0%) | 0.0 |
| 35 to 50 years | 0 (0.0%) | 0.0 |
| Total | 0 (0.0%) | 0.0 |
Fertility by Age by Marriage Status in West Havre
| Age Bracket | Married | Unmarried |
| 15 to 19 years | 0 (0.0%) | 0 (0.0%) |
| 20 to 34 years | 0 (0.0%) | 0 (0.0%) |
| 35 to 50 years | 0 (0.0%) | 0 (0.0%) |
| Total | 0 (0.0%) | 0 (0.0%) |
Fertility by Education in West Havre
| Educational Attainment | Women with Births | Births / 1,000 Women |
| Less than High School | 0 (0.0%) | 0.0 |
| High School Diploma | 0 (0.0%) | 0.0 |
| College or Associate's Degree | 0 (0.0%) | 0.0 |
| Bachelor's Degree | 0 (0.0%) | 0.0 |
| Graduate Degree | 0 (0.0%) | 0.0 |
| Total | 0 (0.0%) | 0.0 |
Fertility by Education by Marriage Status in West Havre
| Educational Attainment | Married | Unmarried |
| Less than High School | 0 (0.0%) | 0 (0.0%) |
| High School Diploma | 0 (0.0%) | 0 (0.0%) |
| College or Associate's Degree | 0 (0.0%) | 0 (0.0%) |
| Bachelor's Degree | 0 (0.0%) | 0 (0.0%) |
| Graduate Degree | 0 (0.0%) | 0 (0.0%) |
| Total | 0 (0.0%) | 0 (0.0%) |
Employment Characteristics in West Havre
Employment by Class of Employer in West Havre
Among the 67 employed individuals in West Havre, private company employees (27 | 40.3%), self-employed (incorporated) (18 | 26.9%), and not-for-profit organizations (15 | 22.4%) make up the most common classes of employment.
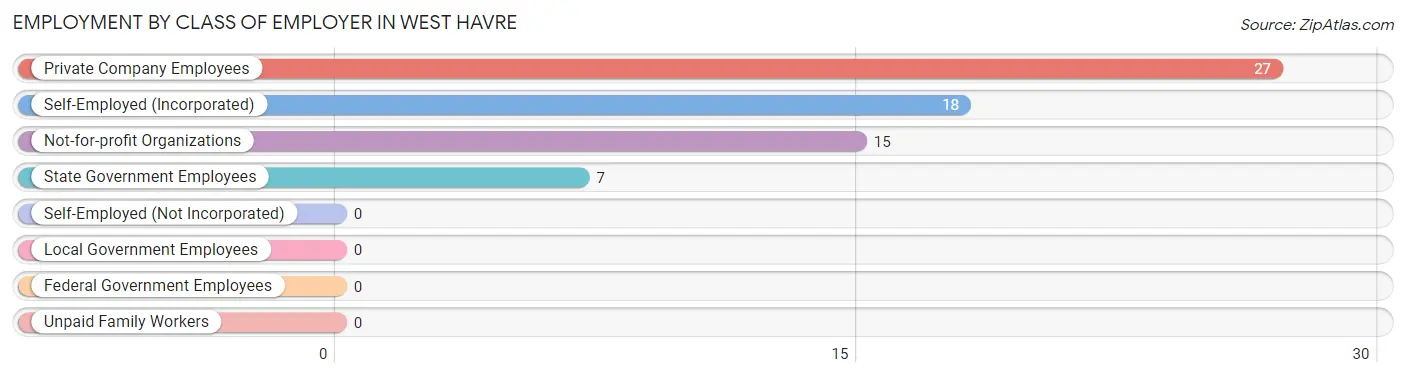
| Employer Class | # Employees | % Employees |
| Private Company Employees | 27 | 40.3% |
| Self-Employed (Incorporated) | 18 | 26.9% |
| Self-Employed (Not Incorporated) | 0 | 0.0% |
| Not-for-profit Organizations | 15 | 22.4% |
| Local Government Employees | 0 | 0.0% |
| State Government Employees | 7 | 10.4% |
| Federal Government Employees | 0 | 0.0% |
| Unpaid Family Workers | 0 | 0.0% |
| Total | 67 | 100.0% |
Employment Status by Age in West Havre
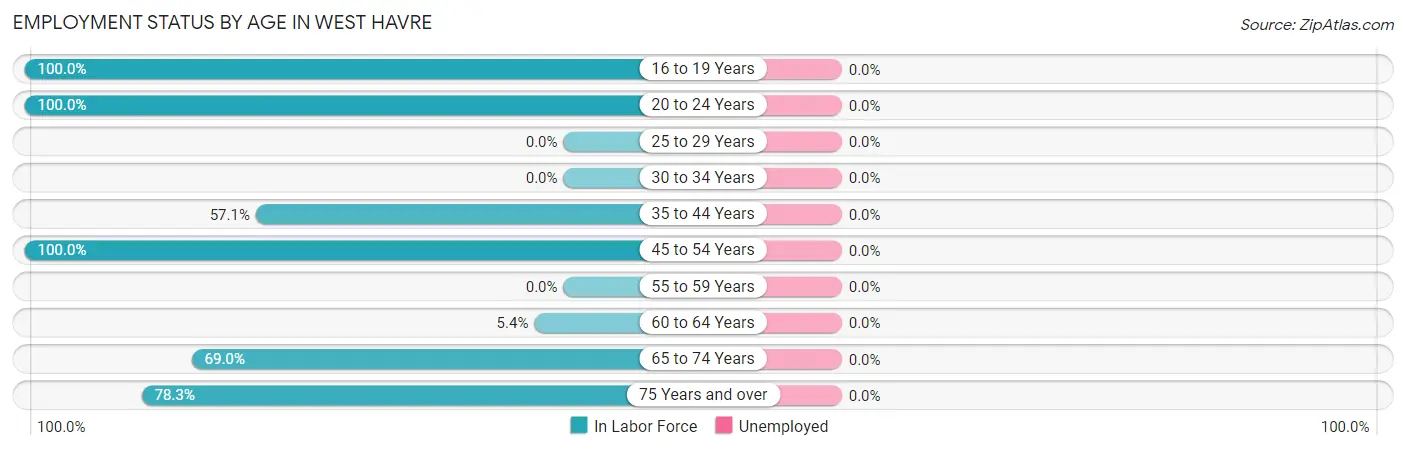
| Age Bracket | In Labor Force | Unemployed |
| 16 to 19 Years | 7 (100.0%) | 0 (0.0%) |
| 20 to 24 Years | 17 (100.0%) | 0 (0.0%) |
| 25 to 29 Years | 0 (0.0%) | 0 (0.0%) |
| 30 to 34 Years | 0 (0.0%) | 0 (0.0%) |
| 35 to 44 Years | 8 (57.1%) | 0 (0.0%) |
| 45 to 54 Years | 15 (100.0%) | 0 (0.0%) |
| 55 to 59 Years | 0 (0.0%) | 0 (0.0%) |
| 60 to 64 Years | 2 (5.4%) | 0 (0.0%) |
| 65 to 74 Years | 20 (69.0%) | 0 (0.0%) |
| 75 Years and over | 18 (78.3%) | 0 (0.0%) |
| Total | 87 (60.4%) | 0 (0.0%) |
Employment Status by Educational Attainment in West Havre
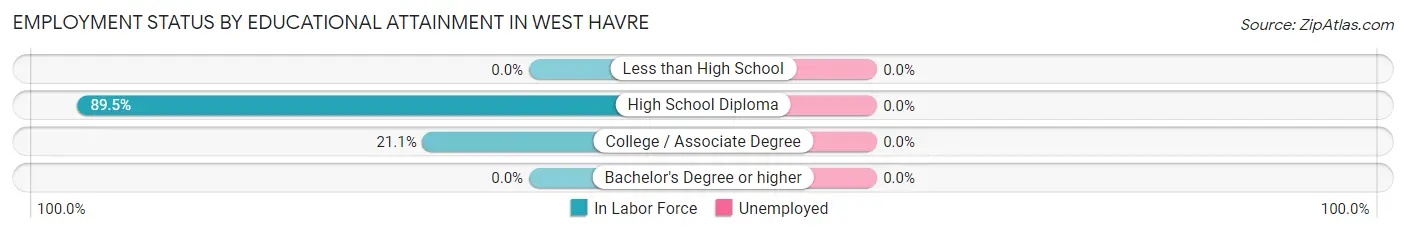
| Educational Attainment | In Labor Force | Unemployed |
| Less than High School | 0 (0.0%) | 0 (0.0%) |
| High School Diploma | 17 (89.5%) | 0 (0.0%) |
| College / Associate Degree | 8 (21.1%) | 0 (0.0%) |
| Bachelor's Degree or higher | 0 (0.0%) | 0 (0.0%) |
| Total | 25 (36.8%) | 0 (0.0%) |
Employment Occupations by Sex in West Havre
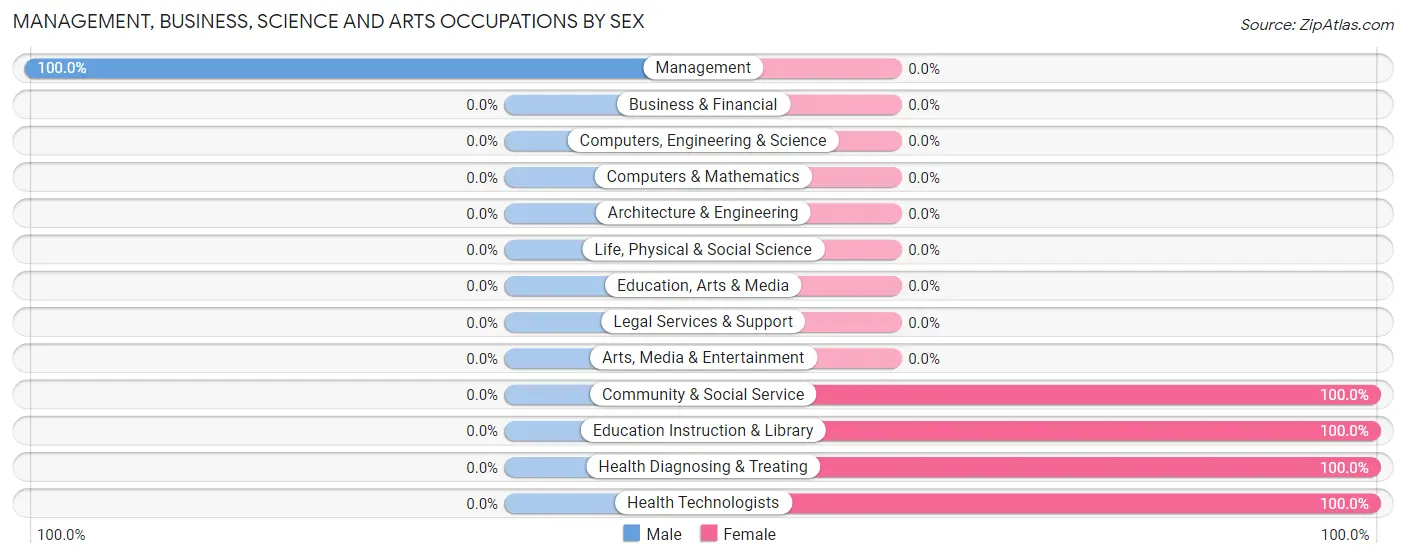
Management, Business, Science and Arts Occupations
The most common Management, Business, Science and Arts occupations in West Havre are Management (38 | 43.7%), Community & Social Service (15 | 17.2%), Education Instruction & Library (15 | 17.2%), Health Diagnosing & Treating (8 | 9.2%), and Health Technologists (8 | 9.2%).
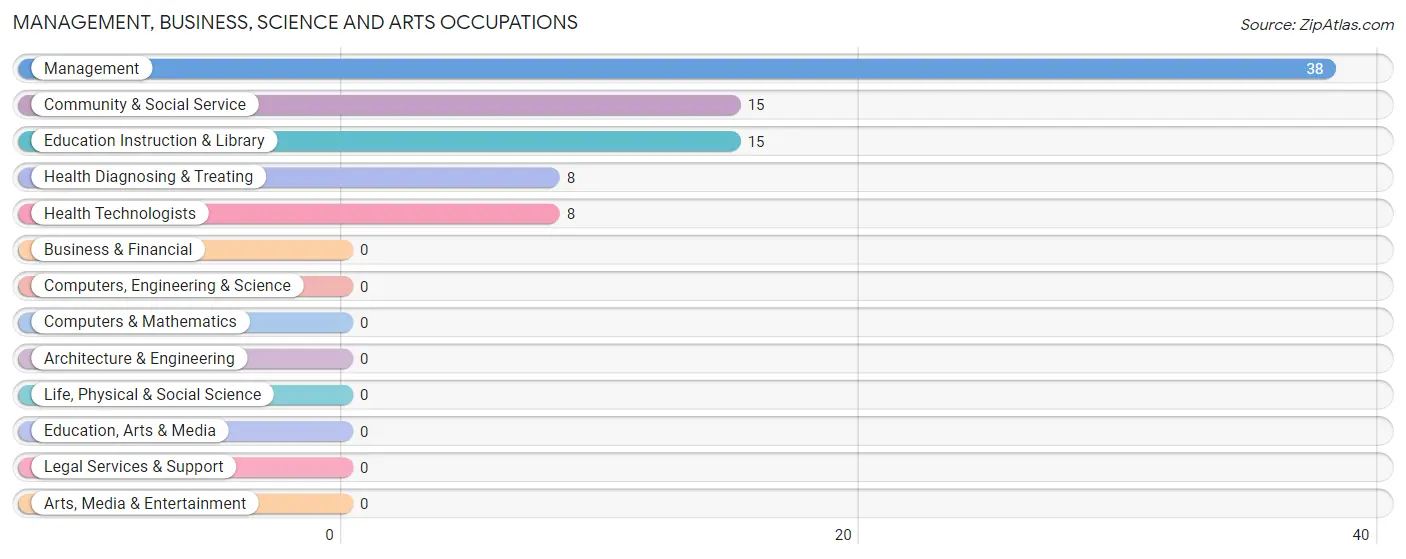
Management, Business, Science and Arts Occupations by Sex
| Occupation | Male | Female |
| Management | 38 (100.0%) | 0 (0.0%) |
| Business & Financial | 0 (0.0%) | 0 (0.0%) |
| Computers, Engineering & Science | 0 (0.0%) | 0 (0.0%) |
| Computers & Mathematics | 0 (0.0%) | 0 (0.0%) |
| Architecture & Engineering | 0 (0.0%) | 0 (0.0%) |
| Life, Physical & Social Science | 0 (0.0%) | 0 (0.0%) |
| Community & Social Service | 0 (0.0%) | 15 (100.0%) |
| Education, Arts & Media | 0 (0.0%) | 0 (0.0%) |
| Legal Services & Support | 0 (0.0%) | 0 (0.0%) |
| Education Instruction & Library | 0 (0.0%) | 15 (100.0%) |
| Arts, Media & Entertainment | 0 (0.0%) | 0 (0.0%) |
| Health Diagnosing & Treating | 0 (0.0%) | 8 (100.0%) |
| Health Technologists | 0 (0.0%) | 8 (100.0%) |
| Total (Category) | 38 (62.3%) | 23 (37.7%) |
| Total (Overall) | 50 (57.5%) | 37 (42.5%) |
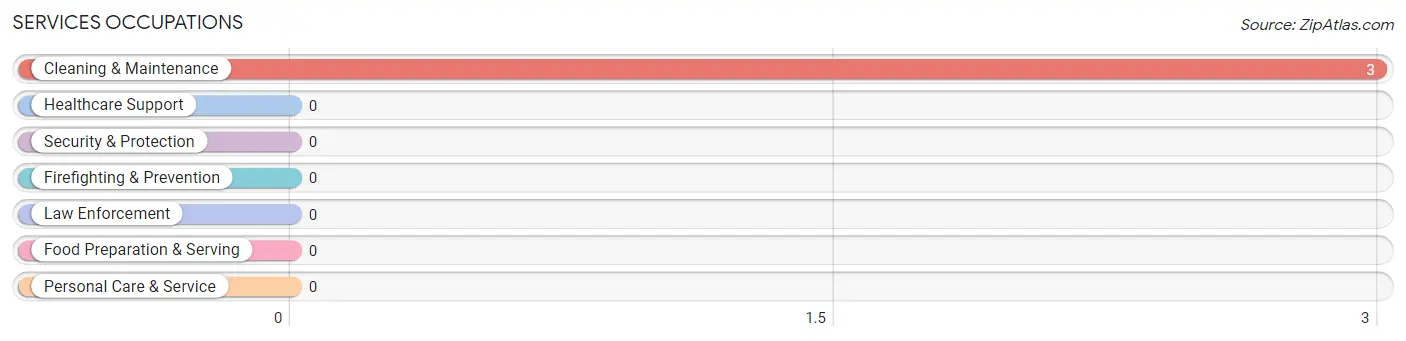
Services Occupations
The most common Services occupations in West Havre are , and Cleaning & Maintenance (3 | 3.5%).
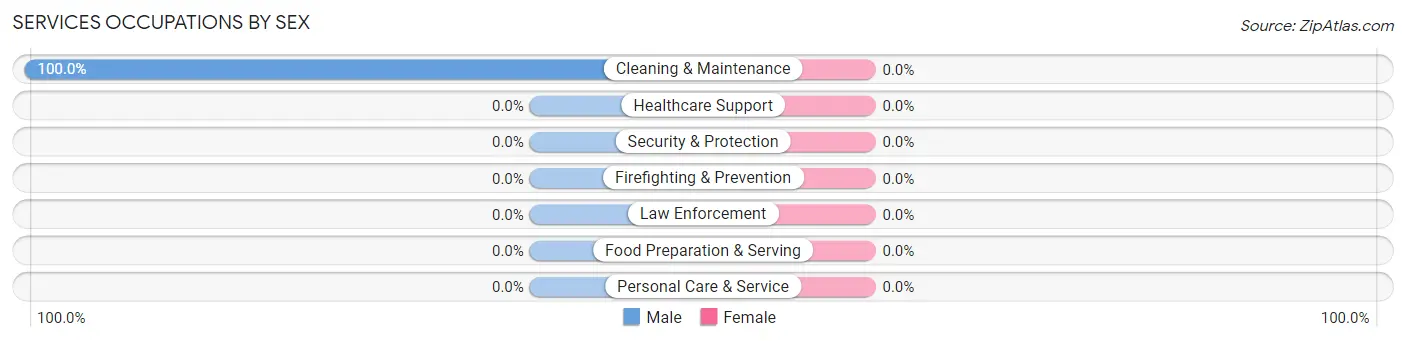
Services Occupations by Sex
| Occupation | Male | Female |
| Healthcare Support | 0 (0.0%) | 0 (0.0%) |
| Security & Protection | 0 (0.0%) | 0 (0.0%) |
| Firefighting & Prevention | 0 (0.0%) | 0 (0.0%) |
| Law Enforcement | 0 (0.0%) | 0 (0.0%) |
| Food Preparation & Serving | 0 (0.0%) | 0 (0.0%) |
| Cleaning & Maintenance | 3 (100.0%) | 0 (0.0%) |
| Personal Care & Service | 0 (0.0%) | 0 (0.0%) |
| Total (Category) | 3 (100.0%) | 0 (0.0%) |
| Total (Overall) | 50 (57.5%) | 37 (42.5%) |
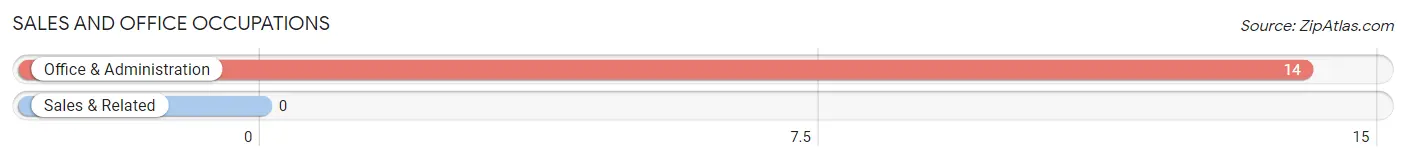
Sales and Office Occupations
The most common Sales and Office occupations in West Havre are , and Office & Administration (14 | 16.1%).
Sales and Office Occupations by Sex
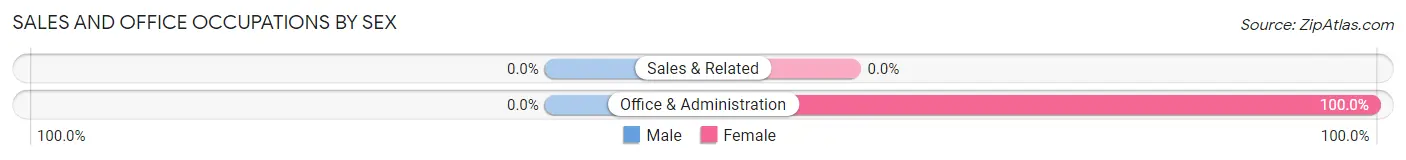
| Occupation | Male | Female |
| Sales & Related | 0 (0.0%) | 0 (0.0%) |
| Office & Administration | 0 (0.0%) | 14 (100.0%) |
| Total (Category) | 0 (0.0%) | 14 (100.0%) |
| Total (Overall) | 50 (57.5%) | 37 (42.5%) |
Natural Resources, Construction and Maintenance Occupations
The most common Natural Resources, Construction and Maintenance occupations in West Havre are Construction & Extraction (7 | 8.1%), and Installation, Maintenance & Repair (2 | 2.3%).
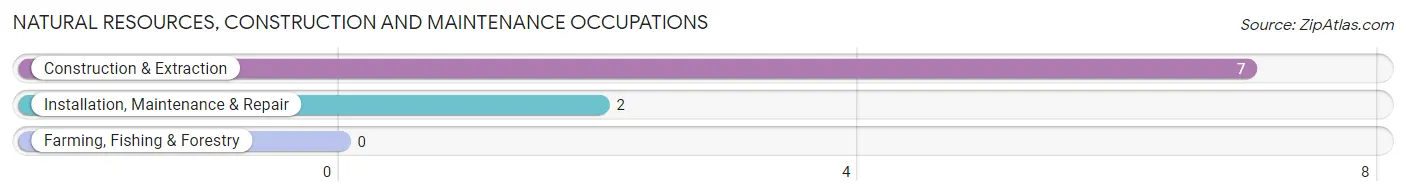
Natural Resources, Construction and Maintenance Occupations by Sex
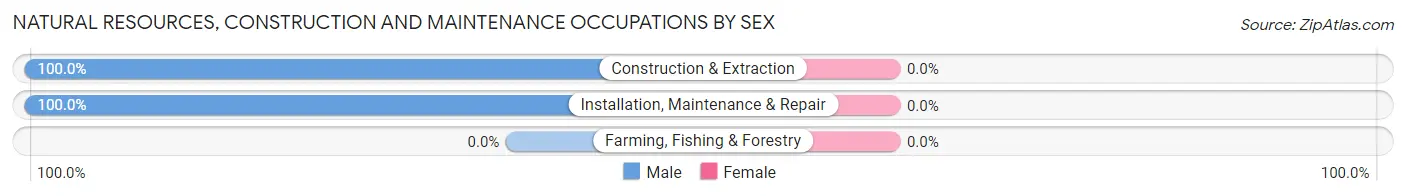
| Occupation | Male | Female |
| Farming, Fishing & Forestry | 0 (0.0%) | 0 (0.0%) |
| Construction & Extraction | 7 (100.0%) | 0 (0.0%) |
| Installation, Maintenance & Repair | 2 (100.0%) | 0 (0.0%) |
| Total (Category) | 9 (100.0%) | 0 (0.0%) |
| Total (Overall) | 50 (57.5%) | 37 (42.5%) |
Production, Transportation and Moving Occupations
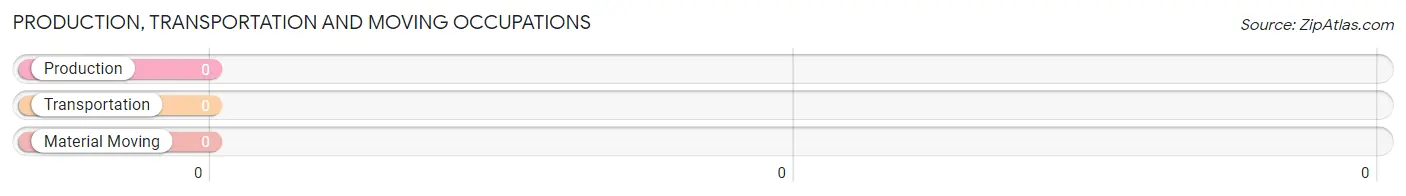
Production, Transportation and Moving Occupations by Sex
| Occupation | Male | Female |
| Production | 0 (0.0%) | 0 (0.0%) |
| Transportation | 0 (0.0%) | 0 (0.0%) |
| Material Moving | 0 (0.0%) | 0 (0.0%) |
| Total (Category) | 0 (0.0%) | 0 (0.0%) |
| Total (Overall) | 50 (57.5%) | 37 (42.5%) |
Employment Industries by Sex in West Havre
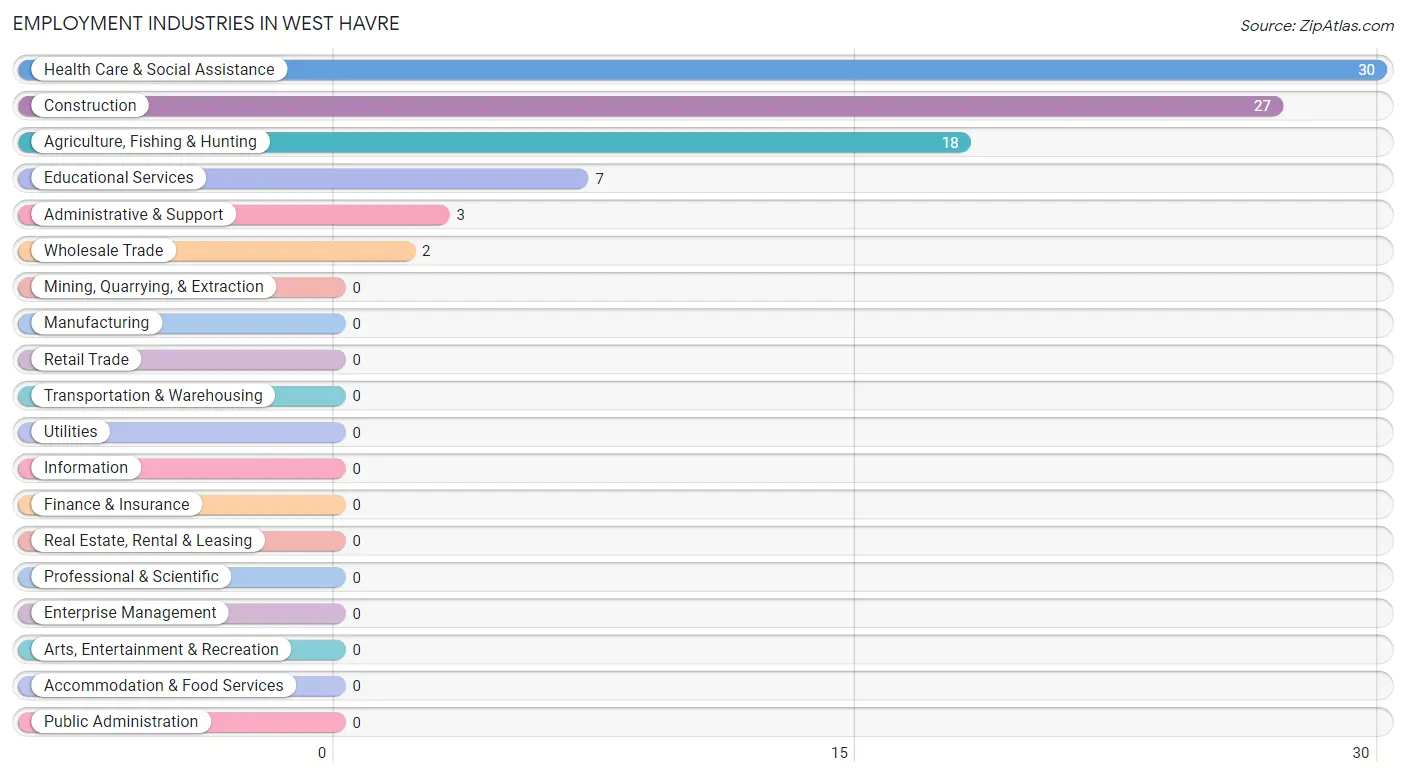
Employment Industries in West Havre
The major employment industries in West Havre include Health Care & Social Assistance (30 | 34.5%), Construction (27 | 31.0%), Agriculture, Fishing & Hunting (18 | 20.7%), Educational Services (7 | 8.1%), and Administrative & Support (3 | 3.5%).
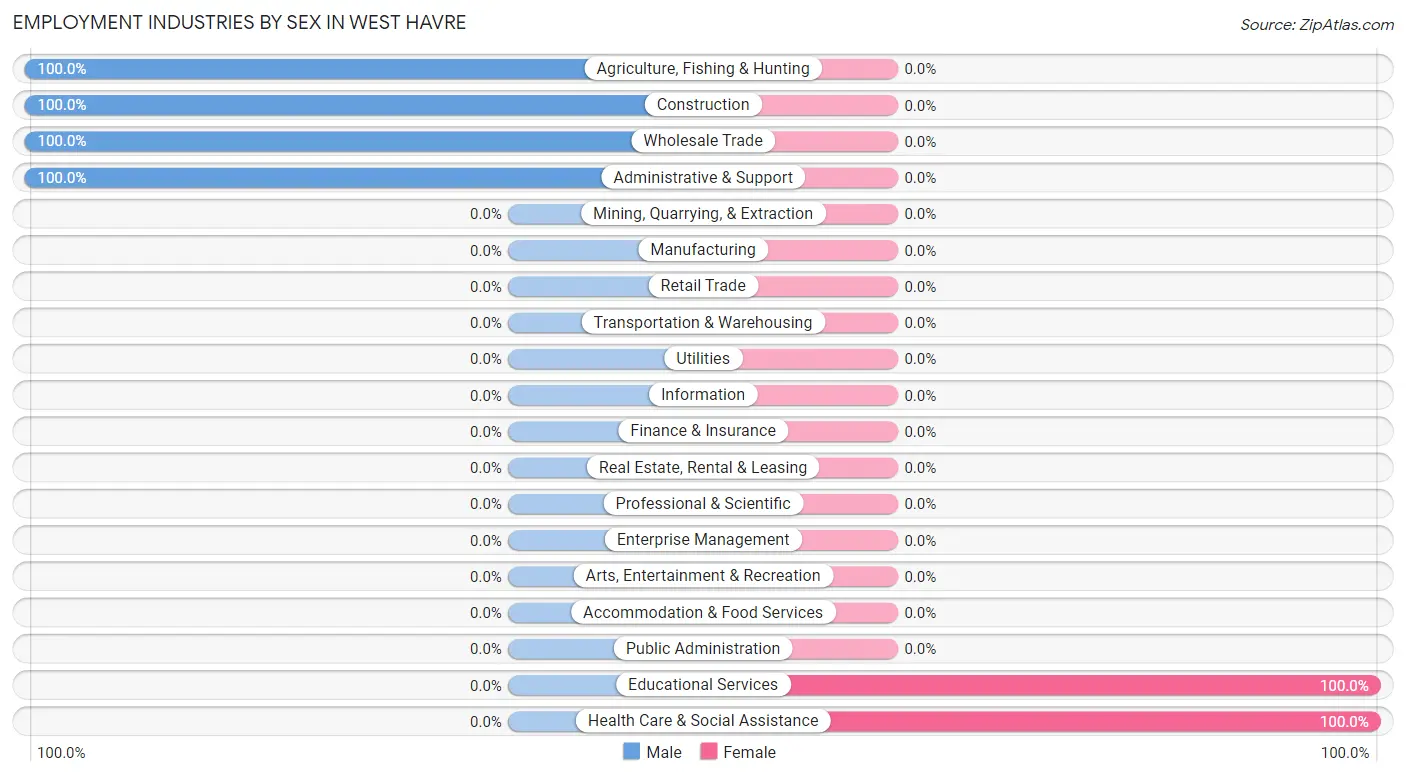
Employment Industries by Sex in West Havre
The West Havre industries that see more men than women are Agriculture, Fishing & Hunting (100.0%), Construction (100.0%), and Wholesale Trade (100.0%), whereas the industries that tend to have a higher number of women are Educational Services (100.0%), and Health Care & Social Assistance (100.0%).
| Industry | Male | Female |
| Agriculture, Fishing & Hunting | 18 (100.0%) | 0 (0.0%) |
| Mining, Quarrying, & Extraction | 0 (0.0%) | 0 (0.0%) |
| Construction | 27 (100.0%) | 0 (0.0%) |
| Manufacturing | 0 (0.0%) | 0 (0.0%) |
| Wholesale Trade | 2 (100.0%) | 0 (0.0%) |
| Retail Trade | 0 (0.0%) | 0 (0.0%) |
| Transportation & Warehousing | 0 (0.0%) | 0 (0.0%) |
| Utilities | 0 (0.0%) | 0 (0.0%) |
| Information | 0 (0.0%) | 0 (0.0%) |
| Finance & Insurance | 0 (0.0%) | 0 (0.0%) |
| Real Estate, Rental & Leasing | 0 (0.0%) | 0 (0.0%) |
| Professional & Scientific | 0 (0.0%) | 0 (0.0%) |
| Enterprise Management | 0 (0.0%) | 0 (0.0%) |
| Administrative & Support | 3 (100.0%) | 0 (0.0%) |
| Educational Services | 0 (0.0%) | 7 (100.0%) |
| Health Care & Social Assistance | 0 (0.0%) | 30 (100.0%) |
| Arts, Entertainment & Recreation | 0 (0.0%) | 0 (0.0%) |
| Accommodation & Food Services | 0 (0.0%) | 0 (0.0%) |
| Public Administration | 0 (0.0%) | 0 (0.0%) |
| Total | 50 (57.5%) | 37 (42.5%) |
Education in West Havre
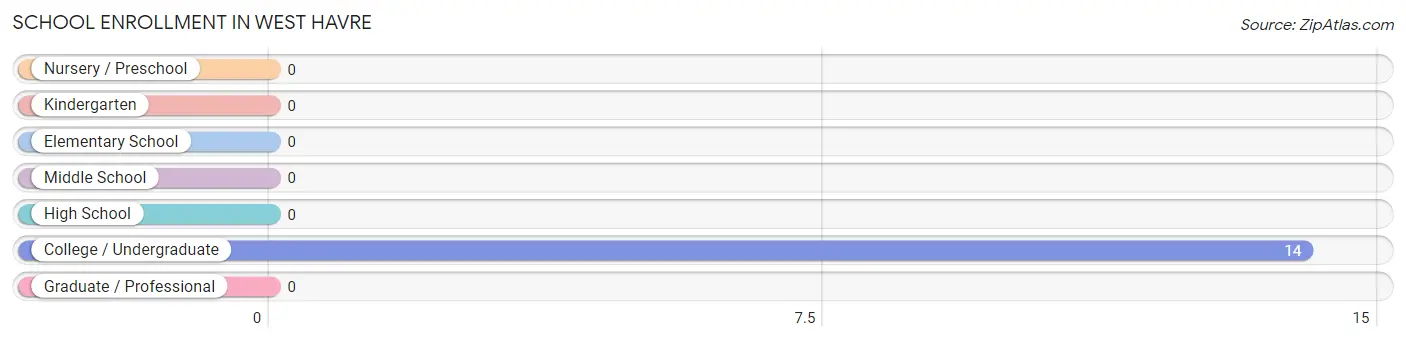
School Enrollment in West Havre
| School Level | # Students | % Students |
| Nursery / Preschool | 0 | 0.0% |
| Kindergarten | 0 | 0.0% |
| Elementary School | 0 | 0.0% |
| Middle School | 0 | 0.0% |
| High School | 0 | 0.0% |
| College / Undergraduate | 14 | 100.0% |
| Graduate / Professional | 0 | 0.0% |
| Total | 14 | 100.0% |
School Enrollment by Age by Funding Source in West Havre
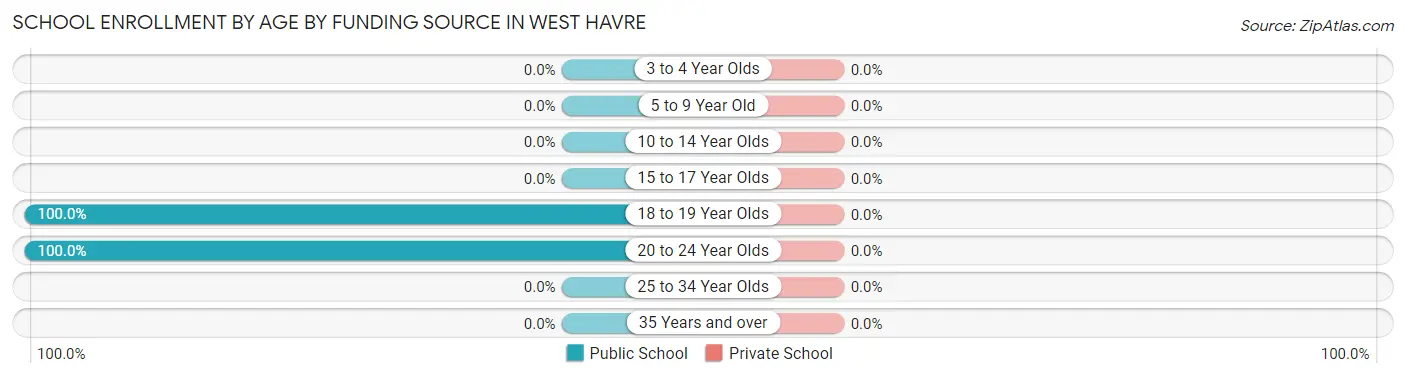
| Age Bracket | Public School | Private School |
| 3 to 4 Year Olds | 0 (0.0%) | 0 (0.0%) |
| 5 to 9 Year Old | 0 (0.0%) | 0 (0.0%) |
| 10 to 14 Year Olds | 0 (0.0%) | 0 (0.0%) |
| 15 to 17 Year Olds | 0 (0.0%) | 0 (0.0%) |
| 18 to 19 Year Olds | 7 (100.0%) | 0 (0.0%) |
| 20 to 24 Year Olds | 7 (100.0%) | 0 (0.0%) |
| 25 to 34 Year Olds | 0 (0.0%) | 0 (0.0%) |
| 35 Years and over | 0 (0.0%) | 0 (0.0%) |
| Total | 14 (100.0%) | 0 (0.0%) |
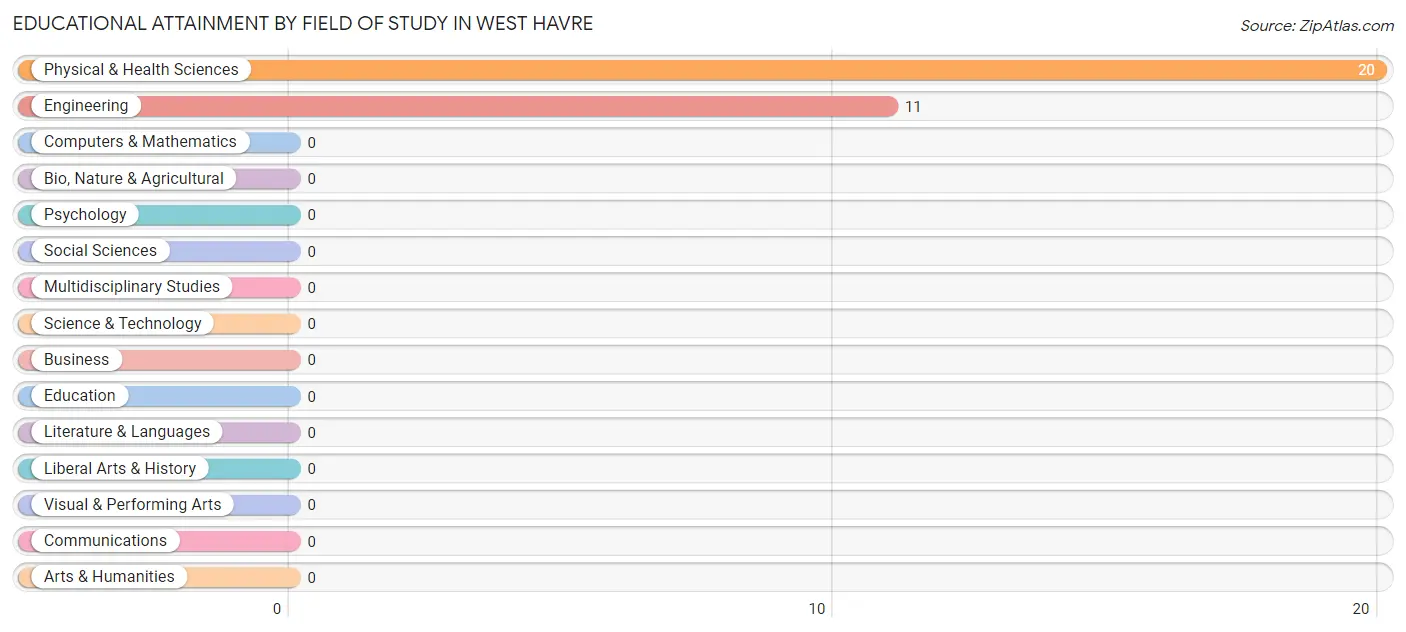
Educational Attainment by Field of Study in West Havre
Physical & health sciences (20 | 64.5%), and engineering (11 | 35.5%) are the most common fields of study among 31 individuals in West Havre who have obtained a bachelor's degree or higher.
| Field of Study | # Graduates | % Graduates |
| Computers & Mathematics | 0 | 0.0% |
| Bio, Nature & Agricultural | 0 | 0.0% |
| Physical & Health Sciences | 20 | 64.5% |
| Psychology | 0 | 0.0% |
| Social Sciences | 0 | 0.0% |
| Engineering | 11 | 35.5% |
| Multidisciplinary Studies | 0 | 0.0% |
| Science & Technology | 0 | 0.0% |
| Business | 0 | 0.0% |
| Education | 0 | 0.0% |
| Literature & Languages | 0 | 0.0% |
| Liberal Arts & History | 0 | 0.0% |
| Visual & Performing Arts | 0 | 0.0% |
| Communications | 0 | 0.0% |
| Arts & Humanities | 0 | 0.0% |
| Total | 31 | 100.0% |
Transportation & Commute in West Havre
Vehicle Availability by Sex in West Havre
The most prevalent vehicle ownership categories in West Havre are males with 4 vehicles (21, accounting for 70.0%) and females with 4 vehicles (22, making up 56.8%).
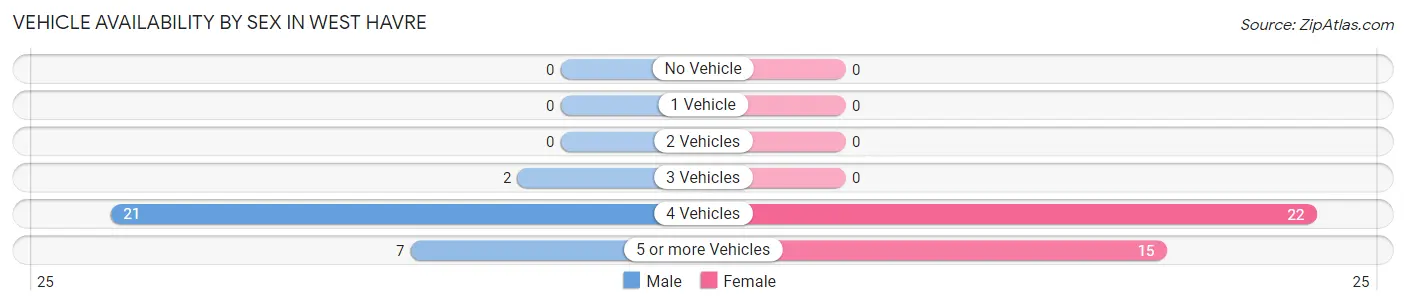
| Vehicles Available | Male | Female |
| No Vehicle | 0 (0.0%) | 0 (0.0%) |
| 1 Vehicle | 0 (0.0%) | 0 (0.0%) |
| 2 Vehicles | 0 (0.0%) | 0 (0.0%) |
| 3 Vehicles | 2 (6.7%) | 0 (0.0%) |
| 4 Vehicles | 21 (70.0%) | 22 (59.5%) |
| 5 or more Vehicles | 7 (23.3%) | 15 (40.5%) |
| Total | 30 (100.0%) | 37 (100.0%) |
Commute Time in West Havre
The most frequently occuring commute durations in West Havre are 10 to 14 minutes (29 commuters, 43.3%), 15 to 19 minutes (18 commuters, 26.9%), and 20 to 24 minutes (15 commuters, 22.4%).
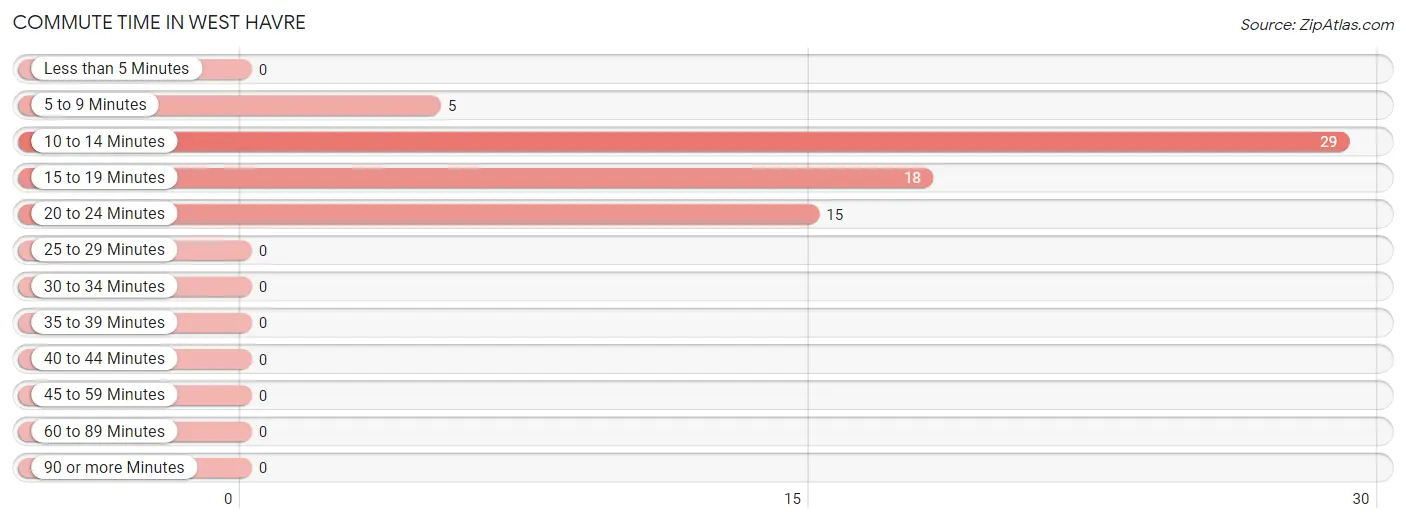
| Commute Time | # Commuters | % Commuters |
| Less than 5 Minutes | 0 | 0.0% |
| 5 to 9 Minutes | 5 | 7.5% |
| 10 to 14 Minutes | 29 | 43.3% |
| 15 to 19 Minutes | 18 | 26.9% |
| 20 to 24 Minutes | 15 | 22.4% |
| 25 to 29 Minutes | 0 | 0.0% |
| 30 to 34 Minutes | 0 | 0.0% |
| 35 to 39 Minutes | 0 | 0.0% |
| 40 to 44 Minutes | 0 | 0.0% |
| 45 to 59 Minutes | 0 | 0.0% |
| 60 to 89 Minutes | 0 | 0.0% |
| 90 or more Minutes | 0 | 0.0% |
Commute Time by Sex in West Havre
The most common commute times in West Havre are 15 to 19 minutes (18 commuters, 60.0%) for males and 10 to 14 minutes (22 commuters, 59.5%) for females.
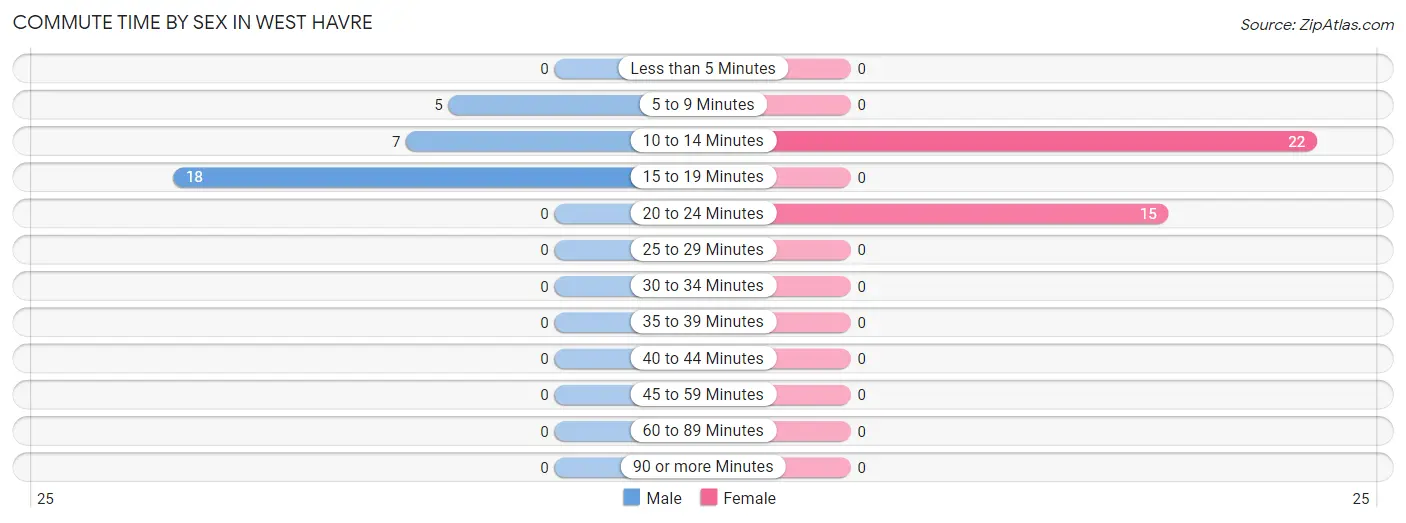
| Commute Time | Male | Female |
| Less than 5 Minutes | 0 (0.0%) | 0 (0.0%) |
| 5 to 9 Minutes | 5 (16.7%) | 0 (0.0%) |
| 10 to 14 Minutes | 7 (23.3%) | 22 (59.5%) |
| 15 to 19 Minutes | 18 (60.0%) | 0 (0.0%) |
| 20 to 24 Minutes | 0 (0.0%) | 15 (40.5%) |
| 25 to 29 Minutes | 0 (0.0%) | 0 (0.0%) |
| 30 to 34 Minutes | 0 (0.0%) | 0 (0.0%) |
| 35 to 39 Minutes | 0 (0.0%) | 0 (0.0%) |
| 40 to 44 Minutes | 0 (0.0%) | 0 (0.0%) |
| 45 to 59 Minutes | 0 (0.0%) | 0 (0.0%) |
| 60 to 89 Minutes | 0 (0.0%) | 0 (0.0%) |
| 90 or more Minutes | 0 (0.0%) | 0 (0.0%) |
Time of Departure to Work by Sex in West Havre
The most frequent times of departure to work in West Havre are 7:30 AM to 7:59 AM (23, 76.7%) for males and 12:00 PM to 3:59 PM (22, 59.5%) for females.
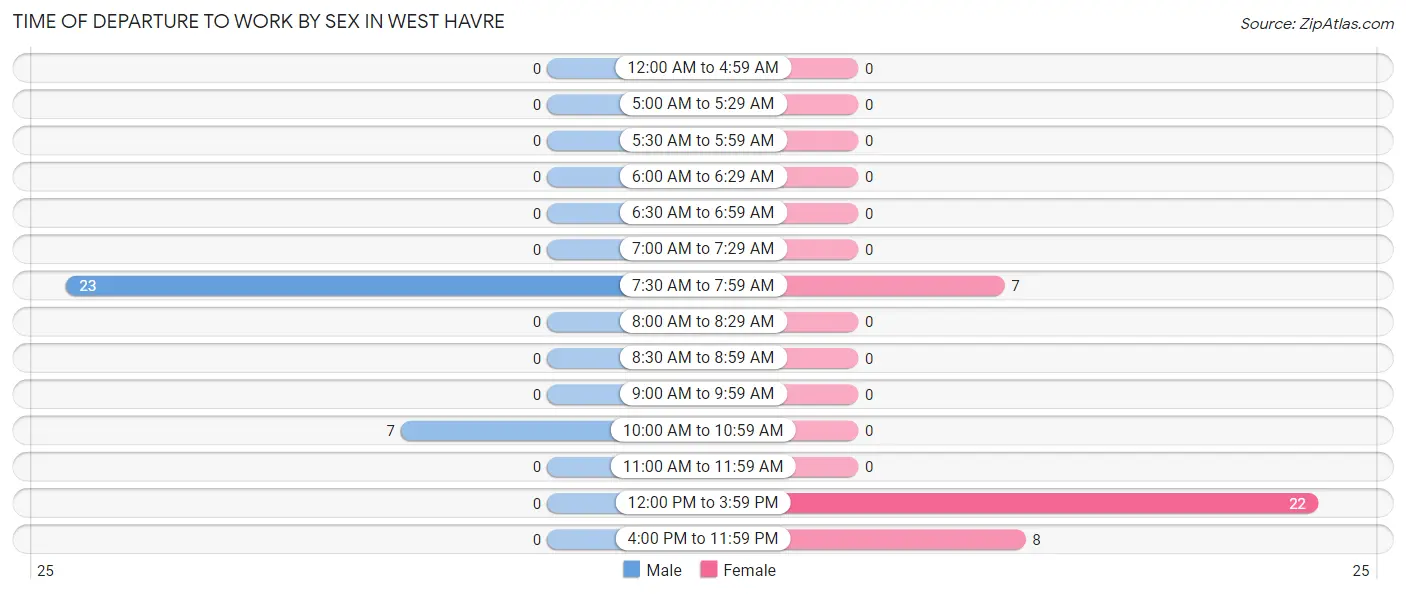
| Time of Departure | Male | Female |
| 12:00 AM to 4:59 AM | 0 (0.0%) | 0 (0.0%) |
| 5:00 AM to 5:29 AM | 0 (0.0%) | 0 (0.0%) |
| 5:30 AM to 5:59 AM | 0 (0.0%) | 0 (0.0%) |
| 6:00 AM to 6:29 AM | 0 (0.0%) | 0 (0.0%) |
| 6:30 AM to 6:59 AM | 0 (0.0%) | 0 (0.0%) |
| 7:00 AM to 7:29 AM | 0 (0.0%) | 0 (0.0%) |
| 7:30 AM to 7:59 AM | 23 (76.7%) | 7 (18.9%) |
| 8:00 AM to 8:29 AM | 0 (0.0%) | 0 (0.0%) |
| 8:30 AM to 8:59 AM | 0 (0.0%) | 0 (0.0%) |
| 9:00 AM to 9:59 AM | 0 (0.0%) | 0 (0.0%) |
| 10:00 AM to 10:59 AM | 7 (23.3%) | 0 (0.0%) |
| 11:00 AM to 11:59 AM | 0 (0.0%) | 0 (0.0%) |
| 12:00 PM to 3:59 PM | 0 (0.0%) | 22 (59.5%) |
| 4:00 PM to 11:59 PM | 0 (0.0%) | 8 (21.6%) |
| Total | 30 (100.0%) | 37 (100.0%) |
Housing Occupancy in West Havre
Occupancy by Ownership in West Havre
Of the total 73 dwellings in West Havre, owner-occupied units account for 68 (93.1%), while renter-occupied units make up 5 (6.9%).
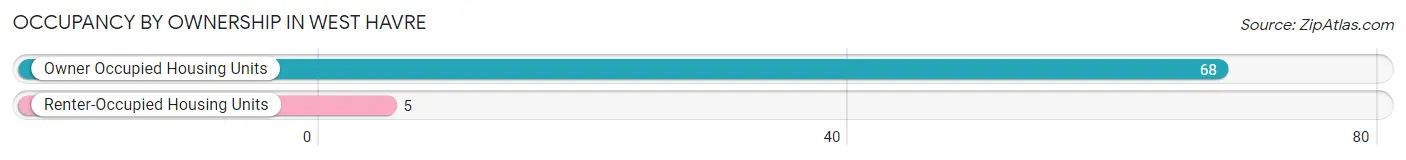
| Occupancy | # Housing Units | % Housing Units |
| Owner Occupied Housing Units | 68 | 93.1% |
| Renter-Occupied Housing Units | 5 | 6.9% |
| Total Occupied Housing Units | 73 | 100.0% |
Occupancy by Household Size in West Havre
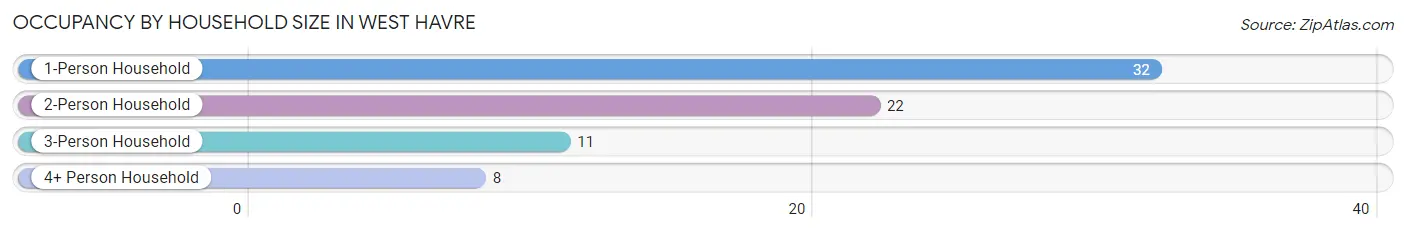
| Household Size | # Housing Units | % Housing Units |
| 1-Person Household | 32 | 43.8% |
| 2-Person Household | 22 | 30.1% |
| 3-Person Household | 11 | 15.1% |
| 4+ Person Household | 8 | 11.0% |
| Total Housing Units | 73 | 100.0% |
Occupancy by Ownership by Household Size in West Havre
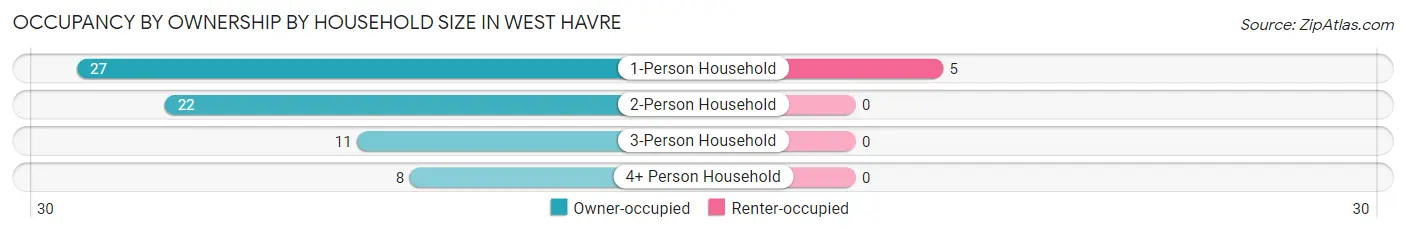
| Household Size | Owner-occupied | Renter-occupied |
| 1-Person Household | 27 (84.4%) | 5 (15.6%) |
| 2-Person Household | 22 (100.0%) | 0 (0.0%) |
| 3-Person Household | 11 (100.0%) | 0 (0.0%) |
| 4+ Person Household | 8 (100.0%) | 0 (0.0%) |
| Total Housing Units | 68 (93.1%) | 5 (6.9%) |
Occupancy by Educational Attainment in West Havre
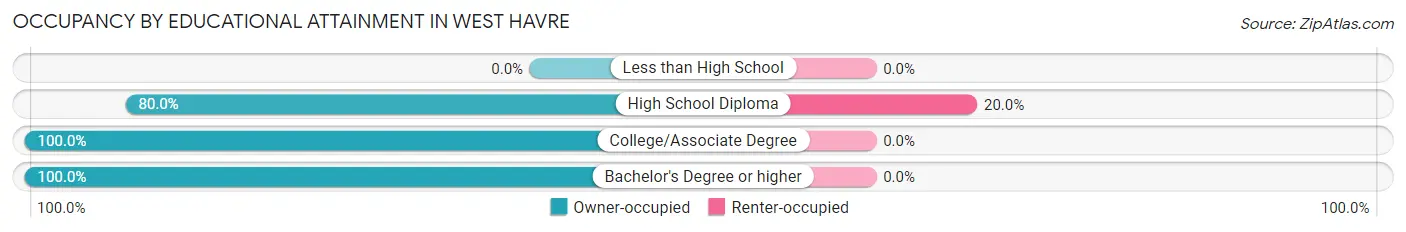
| Household Size | Owner-occupied | Renter-occupied |
| Less than High School | 0 (0.0%) | 0 (0.0%) |
| High School Diploma | 20 (80.0%) | 5 (20.0%) |
| College/Associate Degree | 17 (100.0%) | 0 (0.0%) |
| Bachelor's Degree or higher | 31 (100.0%) | 0 (0.0%) |
Occupancy by Age of Householder in West Havre
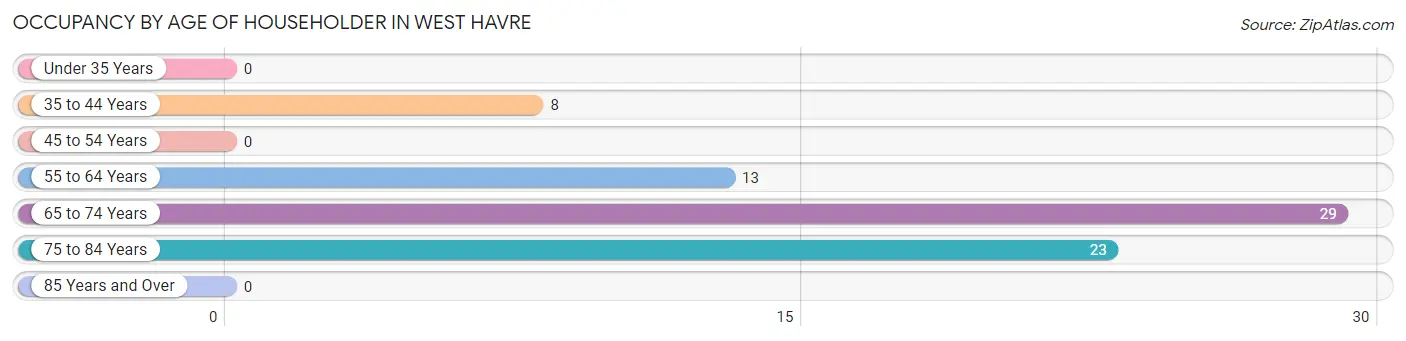
| Age Bracket | # Households | % Households |
| Under 35 Years | 0 | 0.0% |
| 35 to 44 Years | 8 | 11.0% |
| 45 to 54 Years | 0 | 0.0% |
| 55 to 64 Years | 13 | 17.8% |
| 65 to 74 Years | 29 | 39.7% |
| 75 to 84 Years | 23 | 31.5% |
| 85 Years and Over | 0 | 0.0% |
| Total | 73 | 100.0% |
Housing Finances in West Havre
Median Income by Occupancy in West Havre
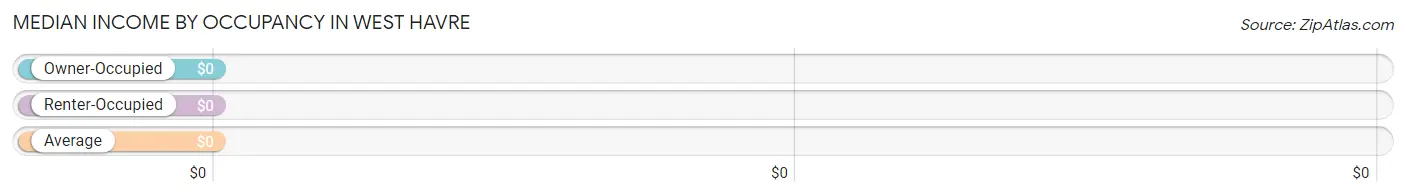
| Occupancy Type | # Households | Median Income |
| Owner-Occupied | 68 (93.1%) | $0 |
| Renter-Occupied | 5 (6.9%) | $0 |
| Average | 73 (100.0%) | $0 |
Occupancy by Householder Income Bracket in West Havre
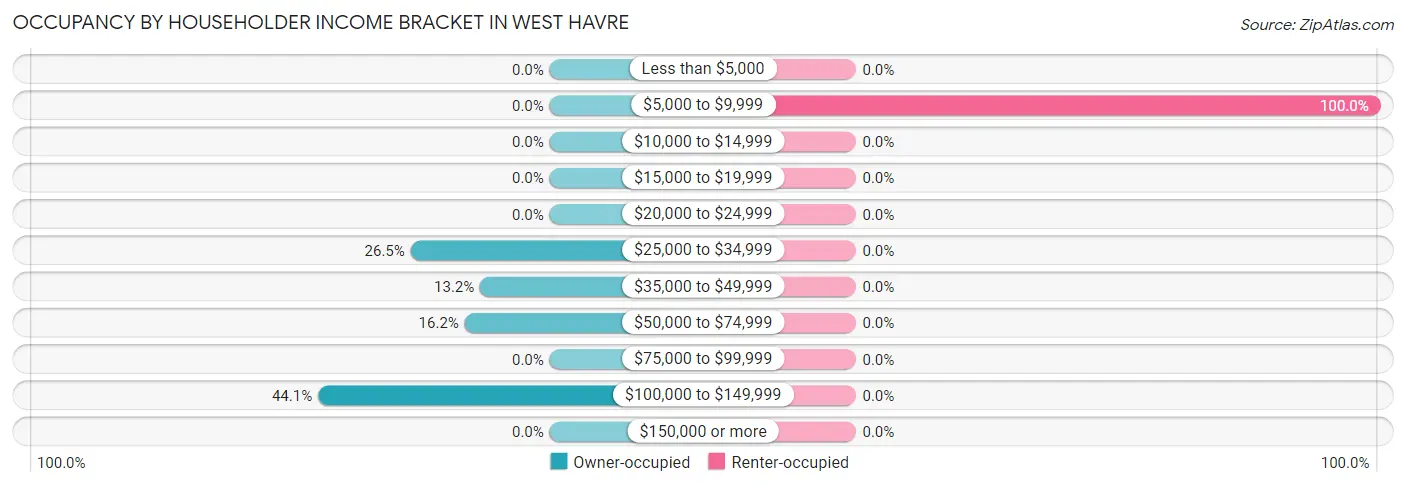
| Income Bracket | Owner-occupied | Renter-occupied |
| Less than $5,000 | 0 (0.0%) | 0 (0.0%) |
| $5,000 to $9,999 | 0 (0.0%) | 5 (100.0%) |
| $10,000 to $14,999 | 0 (0.0%) | 0 (0.0%) |
| $15,000 to $19,999 | 0 (0.0%) | 0 (0.0%) |
| $20,000 to $24,999 | 0 (0.0%) | 0 (0.0%) |
| $25,000 to $34,999 | 18 (26.5%) | 0 (0.0%) |
| $35,000 to $49,999 | 9 (13.2%) | 0 (0.0%) |
| $50,000 to $74,999 | 11 (16.2%) | 0 (0.0%) |
| $75,000 to $99,999 | 0 (0.0%) | 0 (0.0%) |
| $100,000 to $149,999 | 30 (44.1%) | 0 (0.0%) |
| $150,000 or more | 0 (0.0%) | 0 (0.0%) |
| Total | 68 (100.0%) | 5 (100.0%) |
Monthly Housing Cost Tiers in West Havre
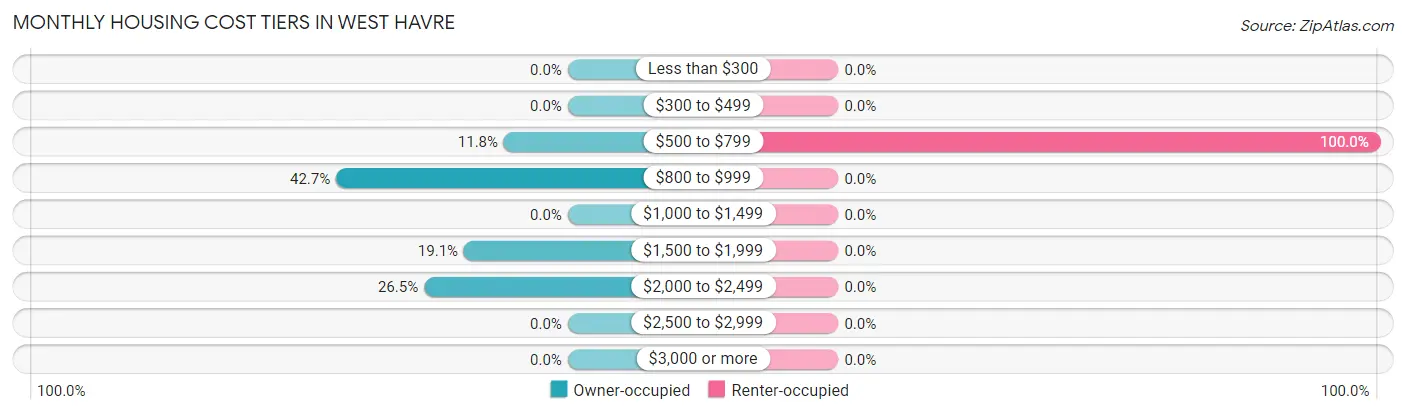
| Monthly Cost | Owner-occupied | Renter-occupied |
| Less than $300 | 0 (0.0%) | 0 (0.0%) |
| $300 to $499 | 0 (0.0%) | 0 (0.0%) |
| $500 to $799 | 8 (11.8%) | 5 (100.0%) |
| $800 to $999 | 29 (42.6%) | 0 (0.0%) |
| $1,000 to $1,499 | 0 (0.0%) | 0 (0.0%) |
| $1,500 to $1,999 | 13 (19.1%) | 0 (0.0%) |
| $2,000 to $2,499 | 18 (26.5%) | 0 (0.0%) |
| $2,500 to $2,999 | 0 (0.0%) | 0 (0.0%) |
| $3,000 or more | 0 (0.0%) | 0 (0.0%) |
| Total | 68 (100.0%) | 5 (100.0%) |
Physical Housing Characteristics in West Havre
Housing Structures in West Havre
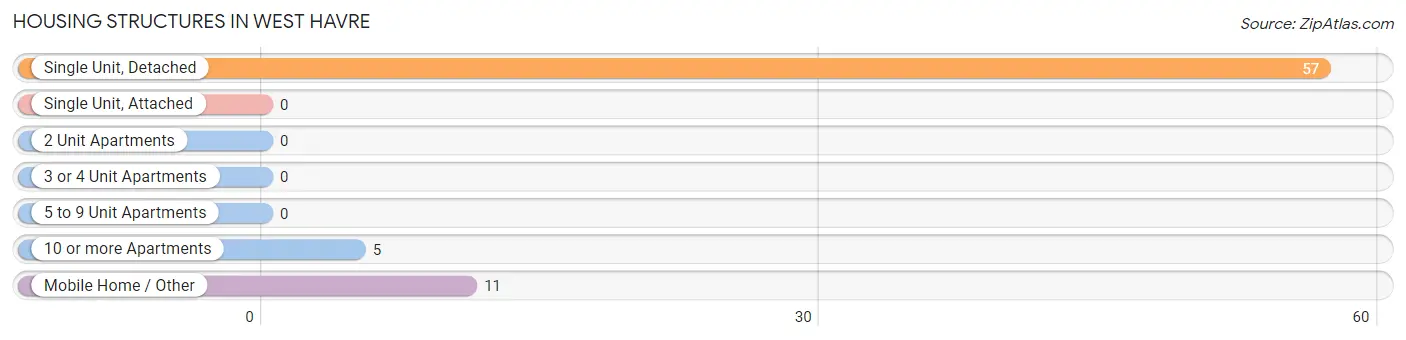
| Structure Type | # Housing Units | % Housing Units |
| Single Unit, Detached | 57 | 78.1% |
| Single Unit, Attached | 0 | 0.0% |
| 2 Unit Apartments | 0 | 0.0% |
| 3 or 4 Unit Apartments | 0 | 0.0% |
| 5 to 9 Unit Apartments | 0 | 0.0% |
| 10 or more Apartments | 5 | 6.9% |
| Mobile Home / Other | 11 | 15.1% |
| Total | 73 | 100.0% |
Housing Structures by Occupancy in West Havre
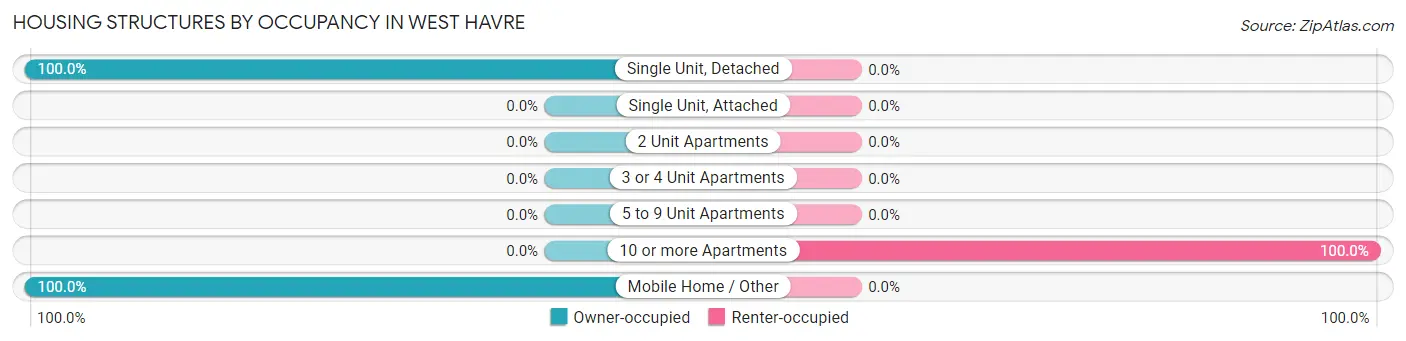
| Structure Type | Owner-occupied | Renter-occupied |
| Single Unit, Detached | 57 (100.0%) | 0 (0.0%) |
| Single Unit, Attached | 0 (0.0%) | 0 (0.0%) |
| 2 Unit Apartments | 0 (0.0%) | 0 (0.0%) |
| 3 or 4 Unit Apartments | 0 (0.0%) | 0 (0.0%) |
| 5 to 9 Unit Apartments | 0 (0.0%) | 0 (0.0%) |
| 10 or more Apartments | 0 (0.0%) | 5 (100.0%) |
| Mobile Home / Other | 11 (100.0%) | 0 (0.0%) |
| Total | 68 (93.1%) | 5 (6.9%) |
Housing Structures by Number of Rooms in West Havre
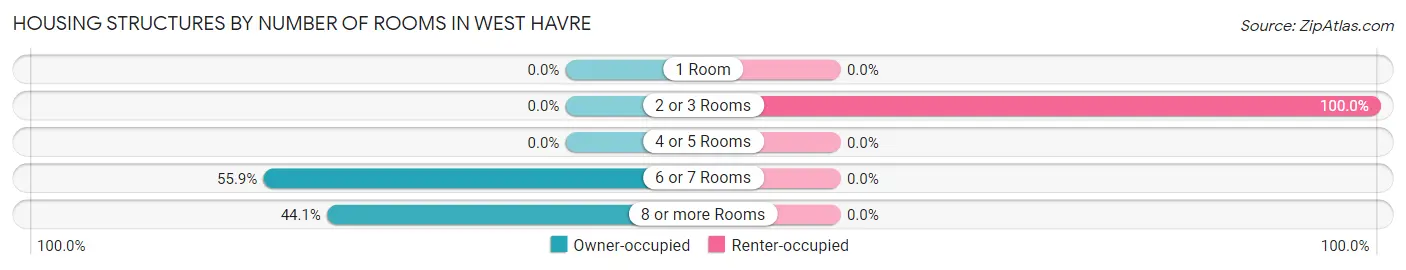
| Number of Rooms | Owner-occupied | Renter-occupied |
| 1 Room | 0 (0.0%) | 0 (0.0%) |
| 2 or 3 Rooms | 0 (0.0%) | 5 (100.0%) |
| 4 or 5 Rooms | 0 (0.0%) | 0 (0.0%) |
| 6 or 7 Rooms | 38 (55.9%) | 0 (0.0%) |
| 8 or more Rooms | 30 (44.1%) | 0 (0.0%) |
| Total | 68 (100.0%) | 5 (100.0%) |
Housing Structure by Heating Type in West Havre
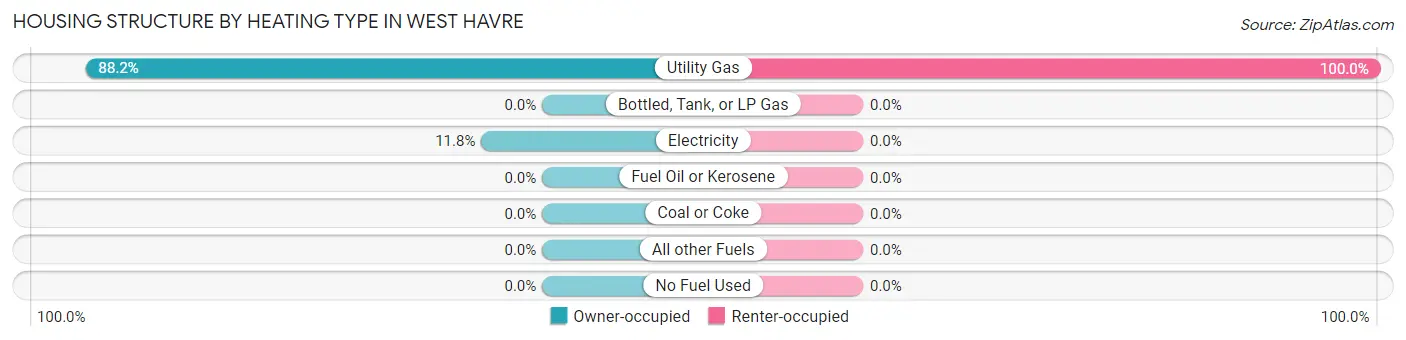
| Heating Type | Owner-occupied | Renter-occupied |
| Utility Gas | 60 (88.2%) | 5 (100.0%) |
| Bottled, Tank, or LP Gas | 0 (0.0%) | 0 (0.0%) |
| Electricity | 8 (11.8%) | 0 (0.0%) |
| Fuel Oil or Kerosene | 0 (0.0%) | 0 (0.0%) |
| Coal or Coke | 0 (0.0%) | 0 (0.0%) |
| All other Fuels | 0 (0.0%) | 0 (0.0%) |
| No Fuel Used | 0 (0.0%) | 0 (0.0%) |
| Total | 68 (100.0%) | 5 (100.0%) |
Household Vehicle Usage in West Havre
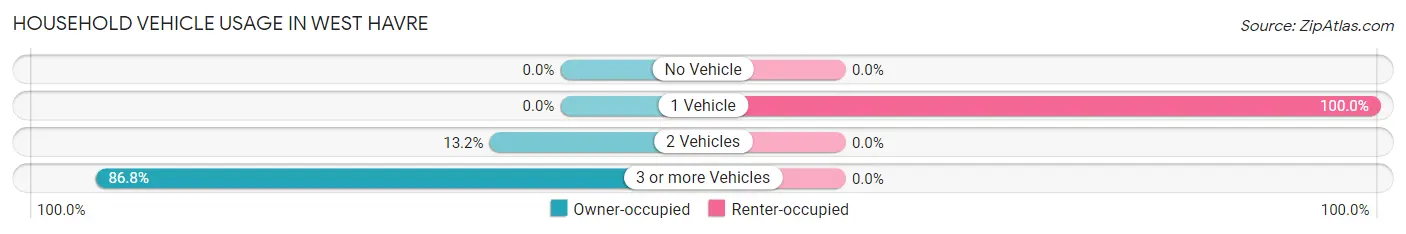
| Vehicles per Household | Owner-occupied | Renter-occupied |
| No Vehicle | 0 (0.0%) | 0 (0.0%) |
| 1 Vehicle | 0 (0.0%) | 5 (100.0%) |
| 2 Vehicles | 9 (13.2%) | 0 (0.0%) |
| 3 or more Vehicles | 59 (86.8%) | 0 (0.0%) |
| Total | 68 (100.0%) | 5 (100.0%) |
Real Estate & Mortgages in West Havre
Real Estate and Mortgage Overview in West Havre
| Characteristic | Without Mortgage | With Mortgage |
| Housing Units | 37 | 31 |
| Median Property Value | - | - |
| Median Household Income | $108,688 | $0 |
| Monthly Housing Costs | $936 | $0 |
| Real Estate Taxes | $3,525 | $11 |
Property Value by Mortgage Status in West Havre
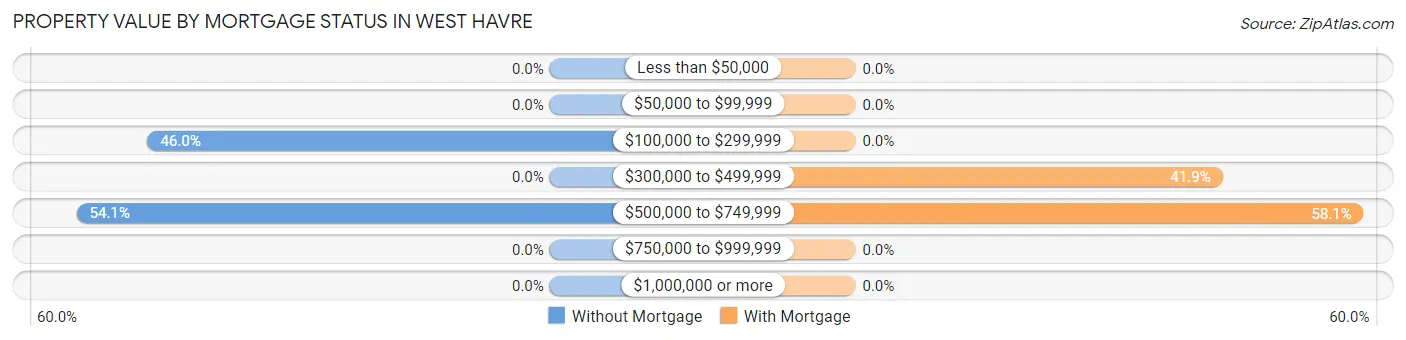
| Property Value | Without Mortgage | With Mortgage |
| Less than $50,000 | 0 (0.0%) | 0 (0.0%) |
| $50,000 to $99,999 | 0 (0.0%) | 0 (0.0%) |
| $100,000 to $299,999 | 17 (46.0%) | 0 (0.0%) |
| $300,000 to $499,999 | 0 (0.0%) | 13 (41.9%) |
| $500,000 to $749,999 | 20 (54.0%) | 18 (58.1%) |
| $750,000 to $999,999 | 0 (0.0%) | 0 (0.0%) |
| $1,000,000 or more | 0 (0.0%) | 0 (0.0%) |
| Total | 37 (100.0%) | 31 (100.0%) |
Household Income by Mortgage Status in West Havre
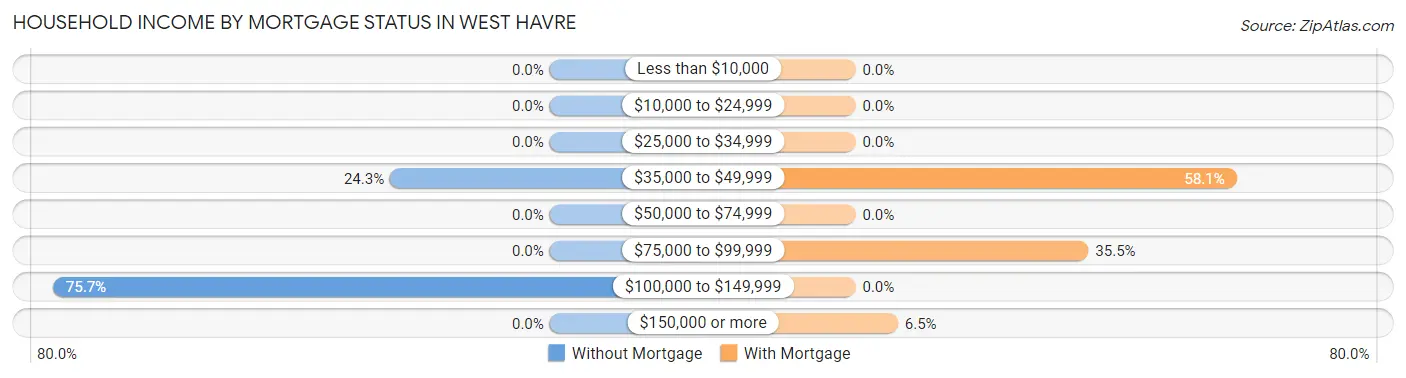
| Household Income | Without Mortgage | With Mortgage |
| Less than $10,000 | 0 (0.0%) | 0 (0.0%) |
| $10,000 to $24,999 | 0 (0.0%) | 0 (0.0%) |
| $25,000 to $34,999 | 0 (0.0%) | 0 (0.0%) |
| $35,000 to $49,999 | 9 (24.3%) | 18 (58.1%) |
| $50,000 to $74,999 | 0 (0.0%) | 0 (0.0%) |
| $75,000 to $99,999 | 0 (0.0%) | 11 (35.5%) |
| $100,000 to $149,999 | 28 (75.7%) | 0 (0.0%) |
| $150,000 or more | 0 (0.0%) | 2 (6.5%) |
| Total | 37 (100.0%) | 31 (100.0%) |
Property Value to Household Income Ratio in West Havre
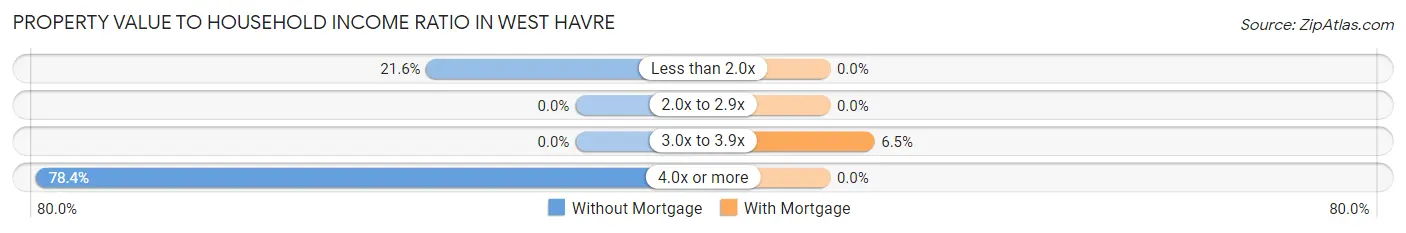
| Value-to-Income Ratio | Without Mortgage | With Mortgage |
| Less than 2.0x | 8 (21.6%) | 0 (0.0%) |
| 2.0x to 2.9x | 0 (0.0%) | 0 (0.0%) |
| 3.0x to 3.9x | 0 (0.0%) | 2 (6.5%) |
| 4.0x or more | 29 (78.4%) | 0 (0.0%) |
| Total | 37 (100.0%) | 31 (100.0%) |
Real Estate Taxes by Mortgage Status in West Havre
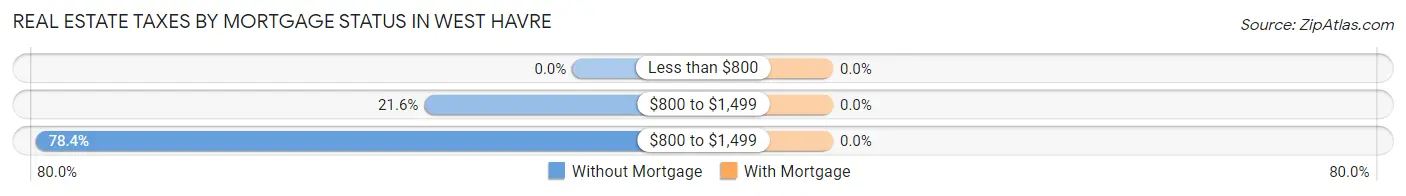
| Property Taxes | Without Mortgage | With Mortgage |
| Less than $800 | 0 (0.0%) | 0 (0.0%) |
| $800 to $1,499 | 8 (21.6%) | 0 (0.0%) |
| $800 to $1,499 | 29 (78.4%) | 0 (0.0%) |
| Total | 37 (100.0%) | 31 (100.0%) |
Health & Disability in West Havre
Health Insurance Coverage by Age in West Havre
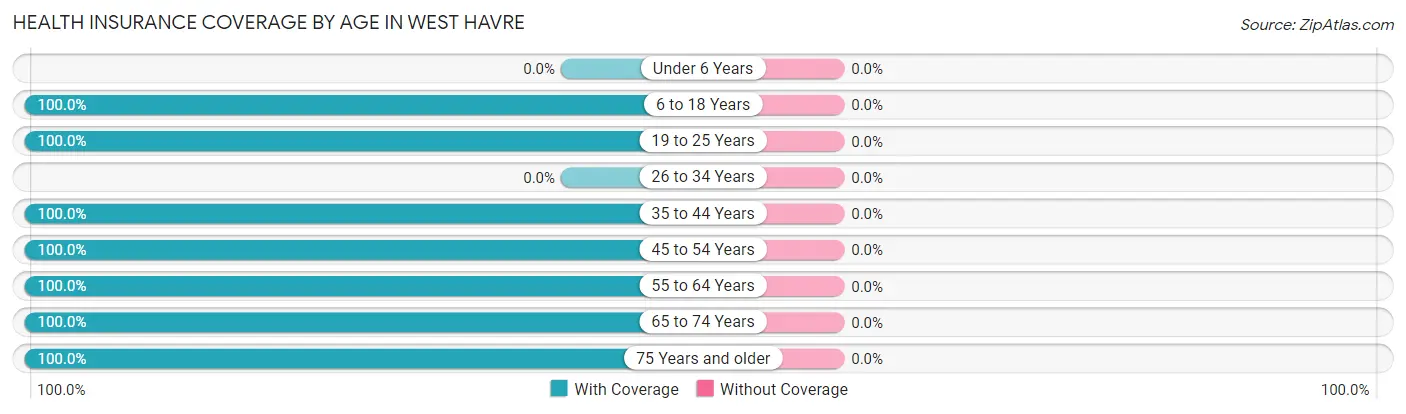
| Age Bracket | With Coverage | Without Coverage |
| Under 6 Years | 0 (0.0%) | 0 (0.0%) |
| 6 to 18 Years | 7 (100.0%) | 0 (0.0%) |
| 19 to 25 Years | 17 (100.0%) | 0 (0.0%) |
| 26 to 34 Years | 0 (0.0%) | 0 (0.0%) |
| 35 to 44 Years | 14 (100.0%) | 0 (0.0%) |
| 45 to 54 Years | 15 (100.0%) | 0 (0.0%) |
| 55 to 64 Years | 39 (100.0%) | 0 (0.0%) |
| 65 to 74 Years | 29 (100.0%) | 0 (0.0%) |
| 75 Years and older | 23 (100.0%) | 0 (0.0%) |
| Total | 144 (100.0%) | 0 (0.0%) |
Health Insurance Coverage by Citizenship Status in West Havre
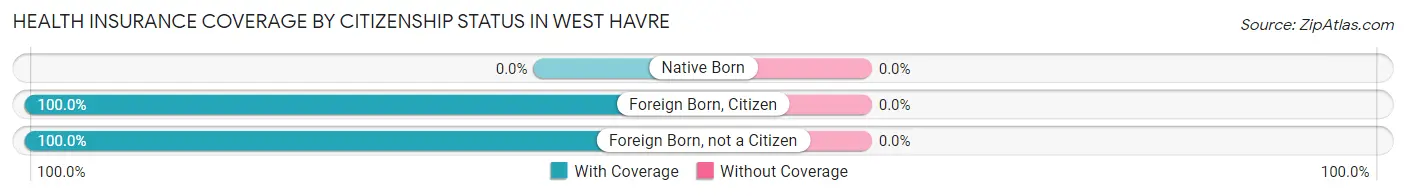
| Citizenship Status | With Coverage | Without Coverage |
| Native Born | 0 (0.0%) | 0 (0.0%) |
| Foreign Born, Citizen | 7 (100.0%) | 0 (0.0%) |
| Foreign Born, not a Citizen | 17 (100.0%) | 0 (0.0%) |
Health Insurance Coverage by Household Income in West Havre
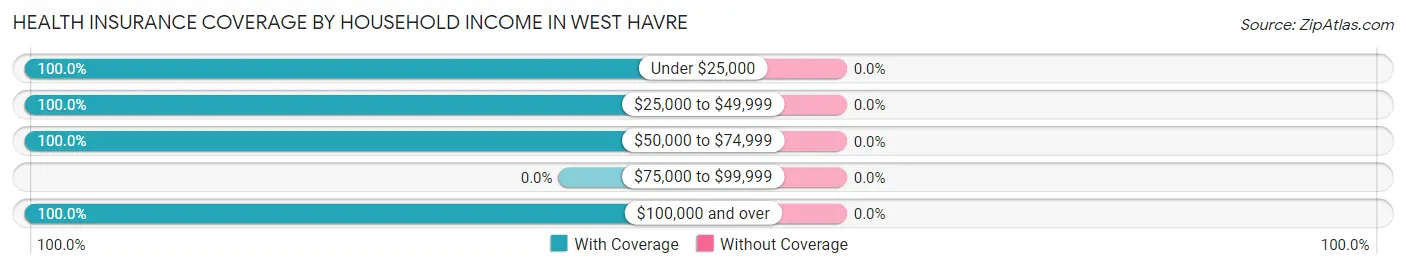
| Household Income | With Coverage | Without Coverage |
| Under $25,000 | 5 (100.0%) | 0 (0.0%) |
| $25,000 to $49,999 | 27 (100.0%) | 0 (0.0%) |
| $50,000 to $74,999 | 33 (100.0%) | 0 (0.0%) |
| $75,000 to $99,999 | 0 (0.0%) | 0 (0.0%) |
| $100,000 and over | 79 (100.0%) | 0 (0.0%) |
Public vs Private Health Insurance Coverage by Age in West Havre
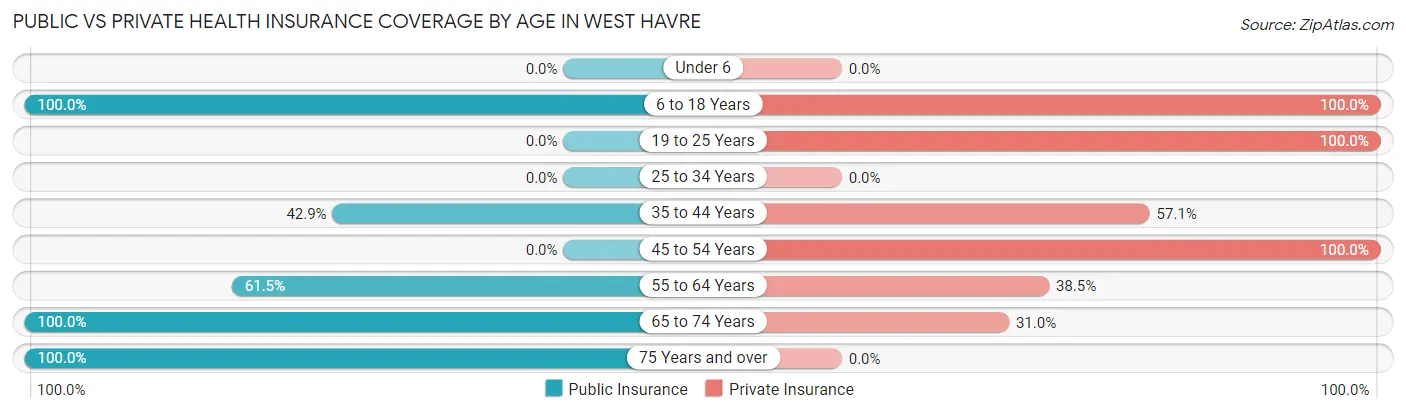
| Age Bracket | Public Insurance | Private Insurance |
| Under 6 | 0 (0.0%) | 0 (0.0%) |
| 6 to 18 Years | 7 (100.0%) | 7 (100.0%) |
| 19 to 25 Years | 0 (0.0%) | 17 (100.0%) |
| 25 to 34 Years | 0 (0.0%) | 0 (0.0%) |
| 35 to 44 Years | 6 (42.9%) | 8 (57.1%) |
| 45 to 54 Years | 0 (0.0%) | 15 (100.0%) |
| 55 to 64 Years | 24 (61.5%) | 15 (38.5%) |
| 65 to 74 Years | 29 (100.0%) | 9 (31.0%) |
| 75 Years and over | 23 (100.0%) | 0 (0.0%) |
| Total | 89 (61.8%) | 71 (49.3%) |
Disability Status by Sex by Age in West Havre
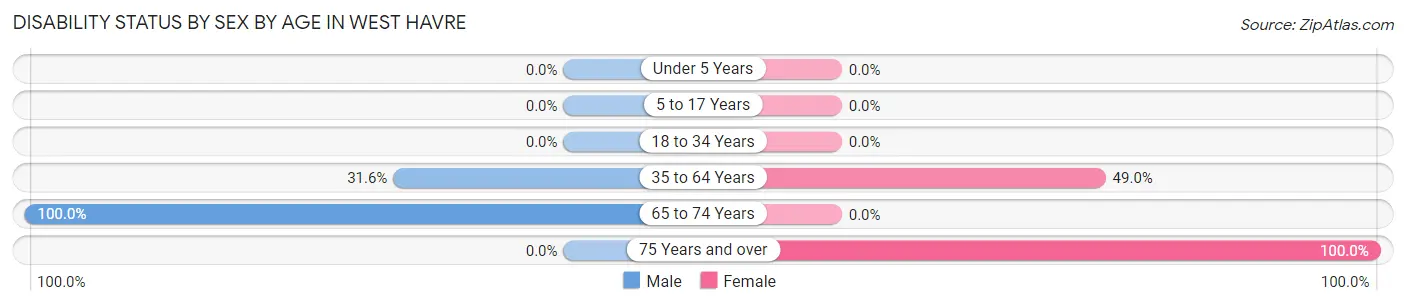
| Age Bracket | Male | Female |
| Under 5 Years | 0 (0.0%) | 0 (0.0%) |
| 5 to 17 Years | 0 (0.0%) | 0 (0.0%) |
| 18 to 34 Years | 0 (0.0%) | 0 (0.0%) |
| 35 to 64 Years | 6 (31.6%) | 24 (49.0%) |
| 65 to 74 Years | 20 (100.0%) | 0 (0.0%) |
| 75 Years and over | 0 (0.0%) | 5 (100.0%) |
Disability Class by Sex by Age in West Havre
Disability Class: Hearing Difficulty
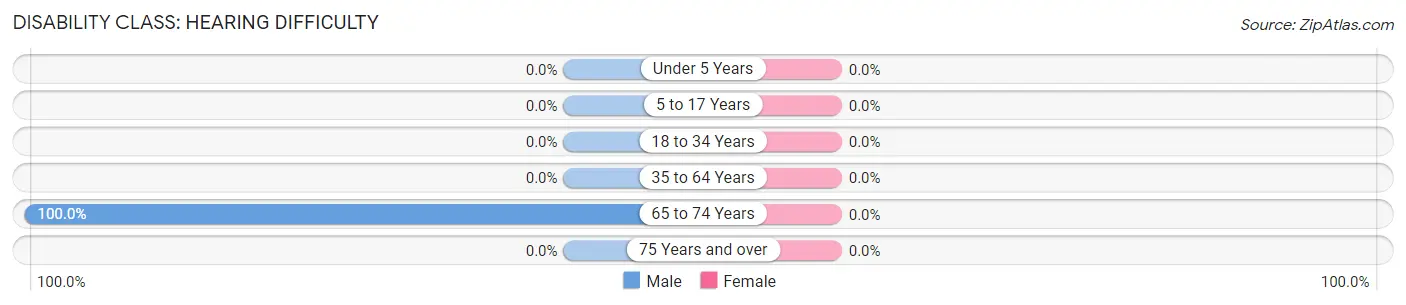
| Age Bracket | Male | Female |
| Under 5 Years | 0 (0.0%) | 0 (0.0%) |
| 5 to 17 Years | 0 (0.0%) | 0 (0.0%) |
| 18 to 34 Years | 0 (0.0%) | 0 (0.0%) |
| 35 to 64 Years | 0 (0.0%) | 0 (0.0%) |
| 65 to 74 Years | 20 (100.0%) | 0 (0.0%) |
| 75 Years and over | 0 (0.0%) | 0 (0.0%) |
Disability Class: Vision Difficulty
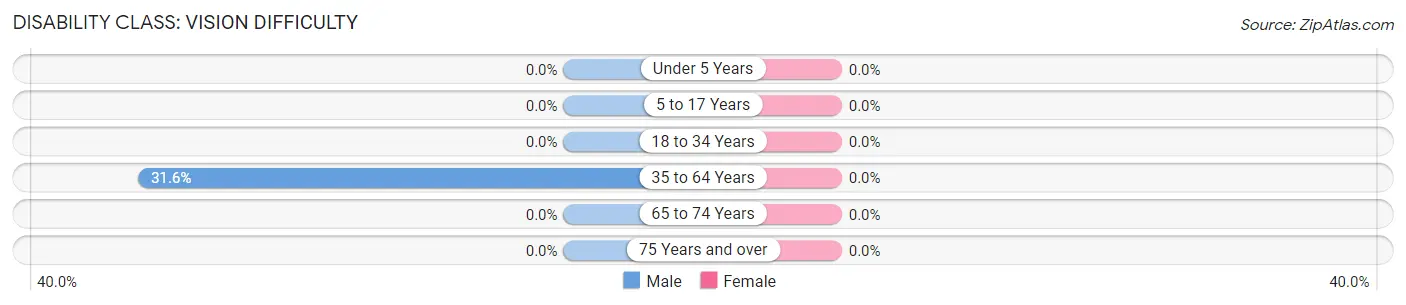
| Age Bracket | Male | Female |
| Under 5 Years | 0 (0.0%) | 0 (0.0%) |
| 5 to 17 Years | 0 (0.0%) | 0 (0.0%) |
| 18 to 34 Years | 0 (0.0%) | 0 (0.0%) |
| 35 to 64 Years | 6 (31.6%) | 0 (0.0%) |
| 65 to 74 Years | 0 (0.0%) | 0 (0.0%) |
| 75 Years and over | 0 (0.0%) | 0 (0.0%) |
Disability Class: Cognitive Difficulty
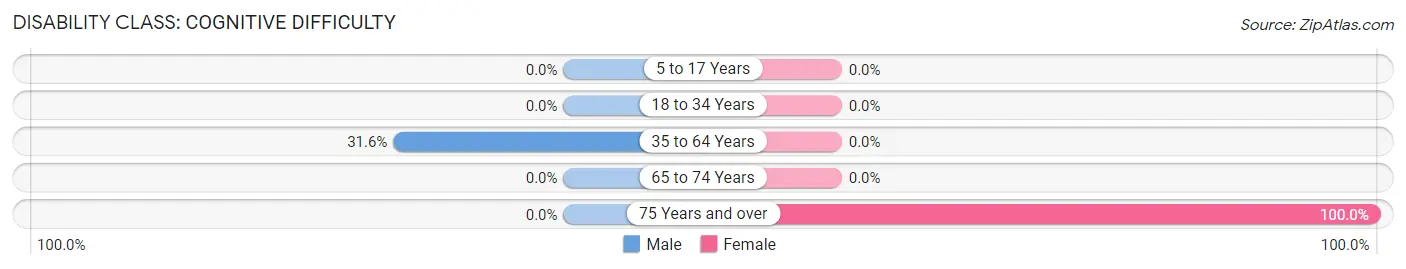
| Age Bracket | Male | Female |
| 5 to 17 Years | 0 (0.0%) | 0 (0.0%) |
| 18 to 34 Years | 0 (0.0%) | 0 (0.0%) |
| 35 to 64 Years | 6 (31.6%) | 0 (0.0%) |
| 65 to 74 Years | 0 (0.0%) | 0 (0.0%) |
| 75 Years and over | 0 (0.0%) | 5 (100.0%) |
Disability Class: Ambulatory Difficulty
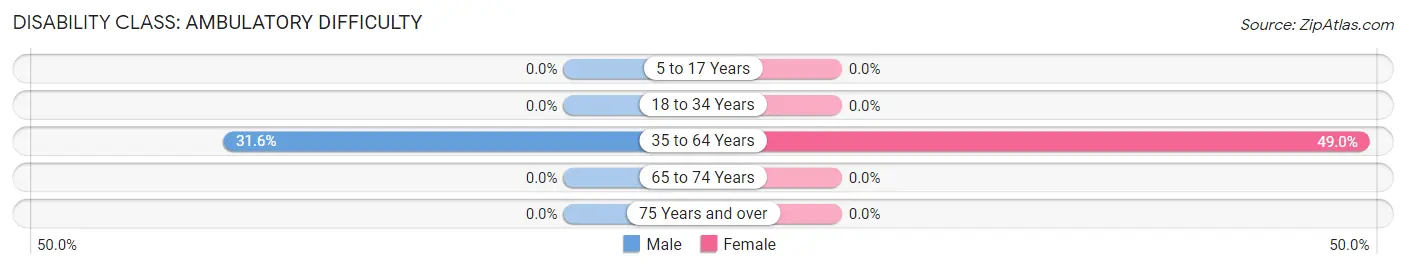
| Age Bracket | Male | Female |
| 5 to 17 Years | 0 (0.0%) | 0 (0.0%) |
| 18 to 34 Years | 0 (0.0%) | 0 (0.0%) |
| 35 to 64 Years | 6 (31.6%) | 24 (49.0%) |
| 65 to 74 Years | 0 (0.0%) | 0 (0.0%) |
| 75 Years and over | 0 (0.0%) | 0 (0.0%) |
Disability Class: Self-Care Difficulty
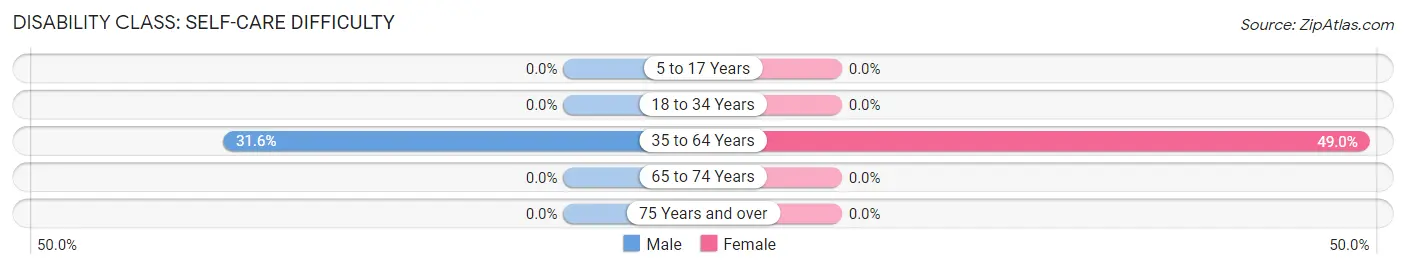
| Age Bracket | Male | Female |
| 5 to 17 Years | 0 (0.0%) | 0 (0.0%) |
| 18 to 34 Years | 0 (0.0%) | 0 (0.0%) |
| 35 to 64 Years | 6 (31.6%) | 24 (49.0%) |
| 65 to 74 Years | 0 (0.0%) | 0 (0.0%) |
| 75 Years and over | 0 (0.0%) | 0 (0.0%) |
Technology Access in West Havre
Computing Device Access in West Havre
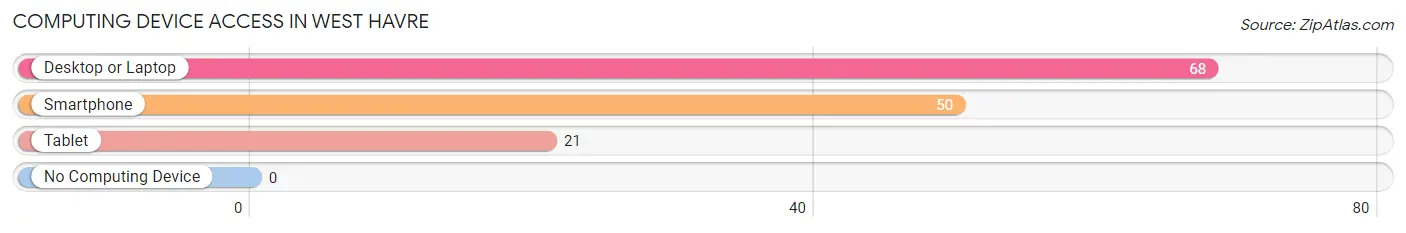
| Device Type | # Households | % Households |
| Desktop or Laptop | 68 | 93.1% |
| Smartphone | 50 | 68.5% |
| Tablet | 21 | 28.8% |
| No Computing Device | 0 | 0.0% |
| Total | 73 | 100.0% |
Internet Access in West Havre
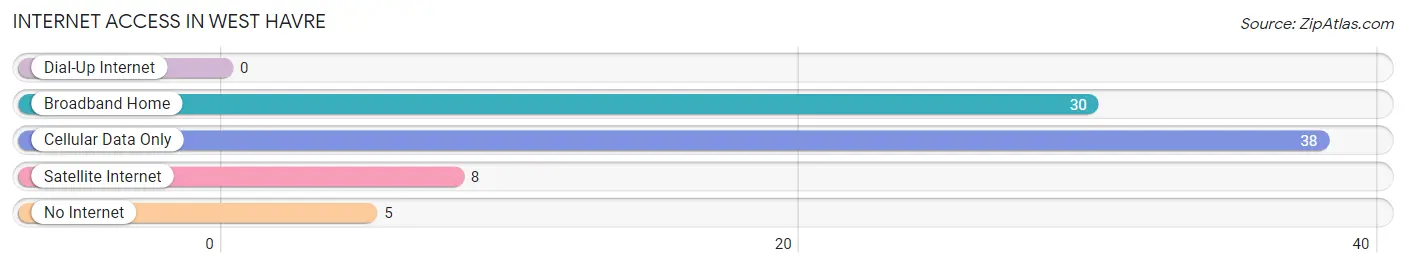
| Internet Type | # Households | % Households |
| Dial-Up Internet | 0 | 0.0% |
| Broadband Home | 30 | 41.1% |
| Cellular Data Only | 38 | 52.0% |
| Satellite Internet | 8 | 11.0% |
| No Internet | 5 | 6.9% |
| Total | 73 | 100.0% |
West Havre Summary
History
West Havre is a small town located in Hill County, Montana. It is situated on the banks of the Milk River, just south of the Canadian border. The town was founded in the late 1800s by homesteaders who were attracted to the area by its fertile soil and abundant water supply. The town was originally known as "Havre West" and was later shortened to West Havre.
The town was initially a farming community, but in the early 1900s, the Great Northern Railway built a line through the area, connecting it to the larger cities of Great Falls and Havre. This allowed for the development of a small commercial district, which included a hotel, a general store, and a post office.
In the 1920s, the town experienced a population boom as a result of the Great Northern Railway's expansion. This growth was further fueled by the discovery of oil in the area in the 1930s. The oil industry brought jobs and money to the town, and it quickly became a hub for the surrounding area.
Geography
West Havre is located in Hill County, Montana, on the banks of the Milk River. The town is situated in a valley surrounded by rolling hills and prairies. The area is known for its wide open spaces and stunning views of the Rocky Mountains.
The town is located approximately 25 miles south of the Canadian border and is about an hour's drive from the larger cities of Great Falls and Havre. The nearest airport is located in Great Falls, about an hour away.
Economy
West Havre's economy is largely based on agriculture and oil production. The town is home to several large farms, which produce a variety of crops, including wheat, barley, and hay. The area is also known for its cattle and sheep ranches.
The town is also home to several oil and gas companies, which have been operating in the area since the 1930s. These companies provide jobs and money to the local economy.
In addition to agriculture and oil production, West Havre is home to several small businesses, including restaurants, shops, and a hotel. The town also has a post office and a library.
Demographics
As of the 2010 census, West Havre had a population of 1,093. The town is predominantly white, with a small Hispanic population. The median household income is $41,250, and the median age is 44.
West Havre is a small, close-knit community. The town is known for its friendly atmosphere and its strong sense of community. Residents take pride in their town and are proud of its history and culture.
Common Questions
What is Per Capita Income in West Havre?
Per Capita income in West Havre is $36,919.
What is the Median Family Income in West Havre?
Median Family Income in West Havre is $108,688.
What is Inequality or Gini Index in West Havre?
Inequality or Gini Index in West Havre is 0.33.
What is the Total Population of West Havre?
Total Population of West Havre is 144.
What is the Total Male Population of West Havre?
Total Male Population of West Havre is 67.
What is the Total Female Population of West Havre?
Total Female Population of West Havre is 77.
What is the Ratio of Males per 100 Females in West Havre?
There are 87.01 Males per 100 Females in West Havre.
What is the Ratio of Females per 100 Males in West Havre?
There are 114.93 Females per 100 Males in West Havre.
What is the Median Population Age in West Havre?
Median Population Age in West Havre is 64.2 Years.
What is the Average Family Size in West Havre
Average Family Size in West Havre is 2.7 People.
What is the Average Household Size in West Havre
Average Household Size in West Havre is 2.0 People.
How Large is the Labor Force in West Havre?
There are 87 People in the Labor Forcein in West Havre.
What is the Percentage of People in the Labor Force in West Havre?
60.4% of People are in the Labor Force in West Havre.