Zip Codes with the Highest Percentage of Population with a Degree in Liberal Arts and History in Billings, MT
RELATED REPORTS & OPTIONS
Liberal Arts and History
Billings
Compare Zip Codes
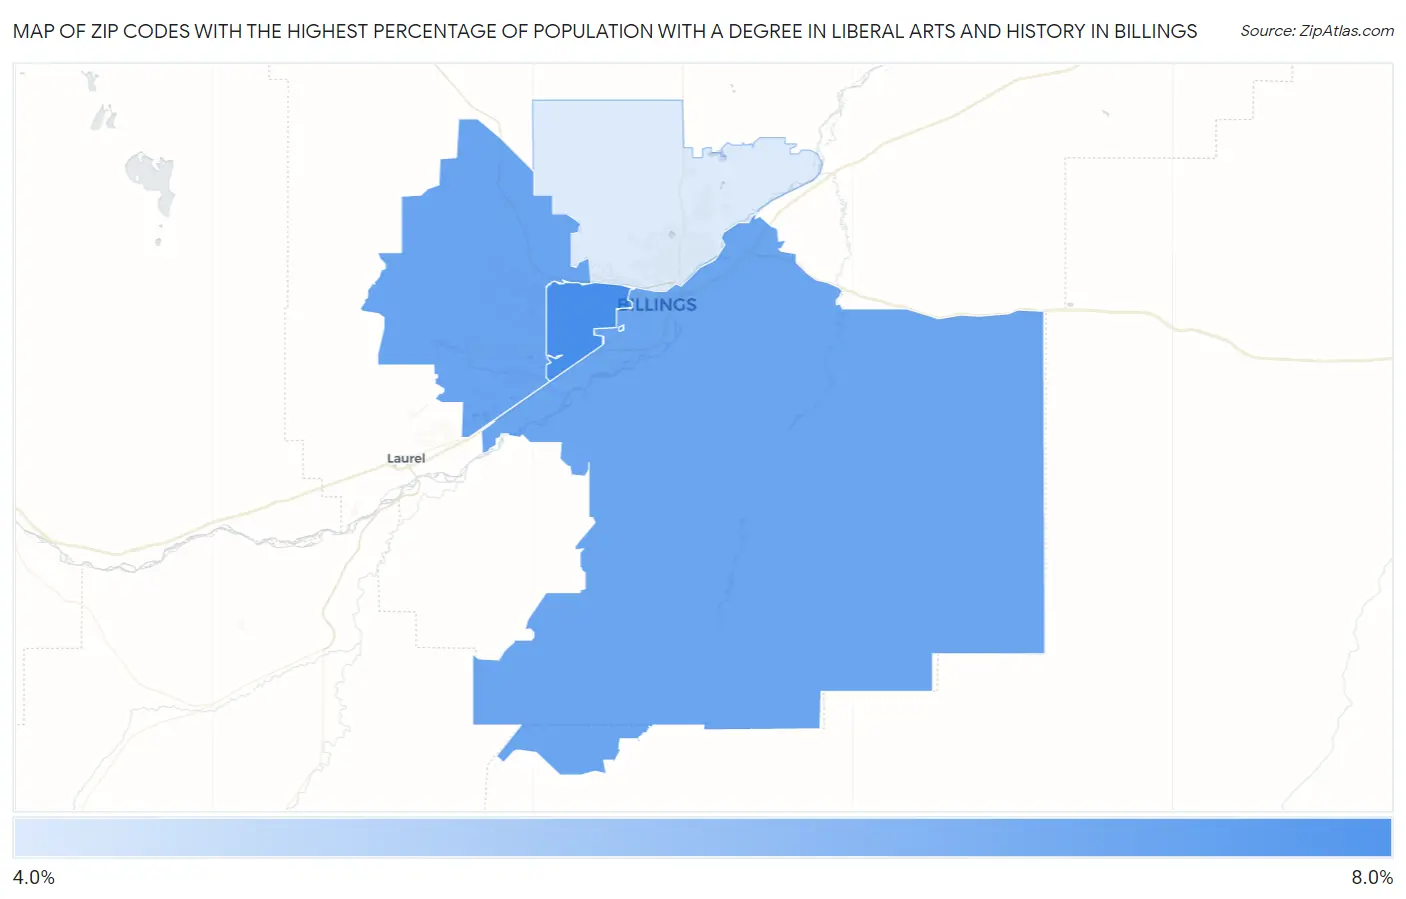
Map of Zip Codes with the Highest Percentage of Population with a Degree in Liberal Arts and History in Billings
4.1%
7.3%
Zip Codes with the Highest Percentage of Population with a Degree in Liberal Arts and History in Billings, MT
| Zip Code | % Graduates | vs State | vs National | |
| 1. | 59102 | 7.3% | 5.3%(+2.04)#65 | 4.9%(+2.46)#5,825 |
| 2. | 59106 | 6.6% | 5.3%(+1.30)#84 | 4.9%(+1.72)#7,165 |
| 3. | 59101 | 6.5% | 5.3%(+1.22)#86 | 4.9%(+1.64)#7,321 |
| 4. | 59105 | 4.1% | 5.3%(-1.22)#133 | 4.9%(-0.800)#14,505 |
1
Common Questions
What are the Top 3 Zip Codes with the Highest Percentage of Population with a Degree in Liberal Arts and History in Billings, MT?
Top 3 Zip Codes with the Highest Percentage of Population with a Degree in Liberal Arts and History in Billings, MT are:
What zip code has the Highest Percentage of Population with a Degree in Liberal Arts and History in Billings, MT?
59102 has the Highest Percentage of Population with a Degree in Liberal Arts and History in Billings, MT with 7.3%.
What is the Percentage of Population with a Degree in Liberal Arts and History in Billings, MT?
Percentage of Population with a Degree in Liberal Arts and History in Billings is 6.7%.
What is the Percentage of Population with a Degree in Liberal Arts and History in Montana?
Percentage of Population with a Degree in Liberal Arts and History in Montana is 5.3%.
What is the Percentage of Population with a Degree in Liberal Arts and History in the United States?
Percentage of Population with a Degree in Liberal Arts and History in the United States is 4.9%.