Zip Codes with the Highest Percentage of Population with a Degree in Liberal Arts and History in Montana
RELATED REPORTS & OPTIONS
Liberal Arts and History
Montana
Compare Zip Codes
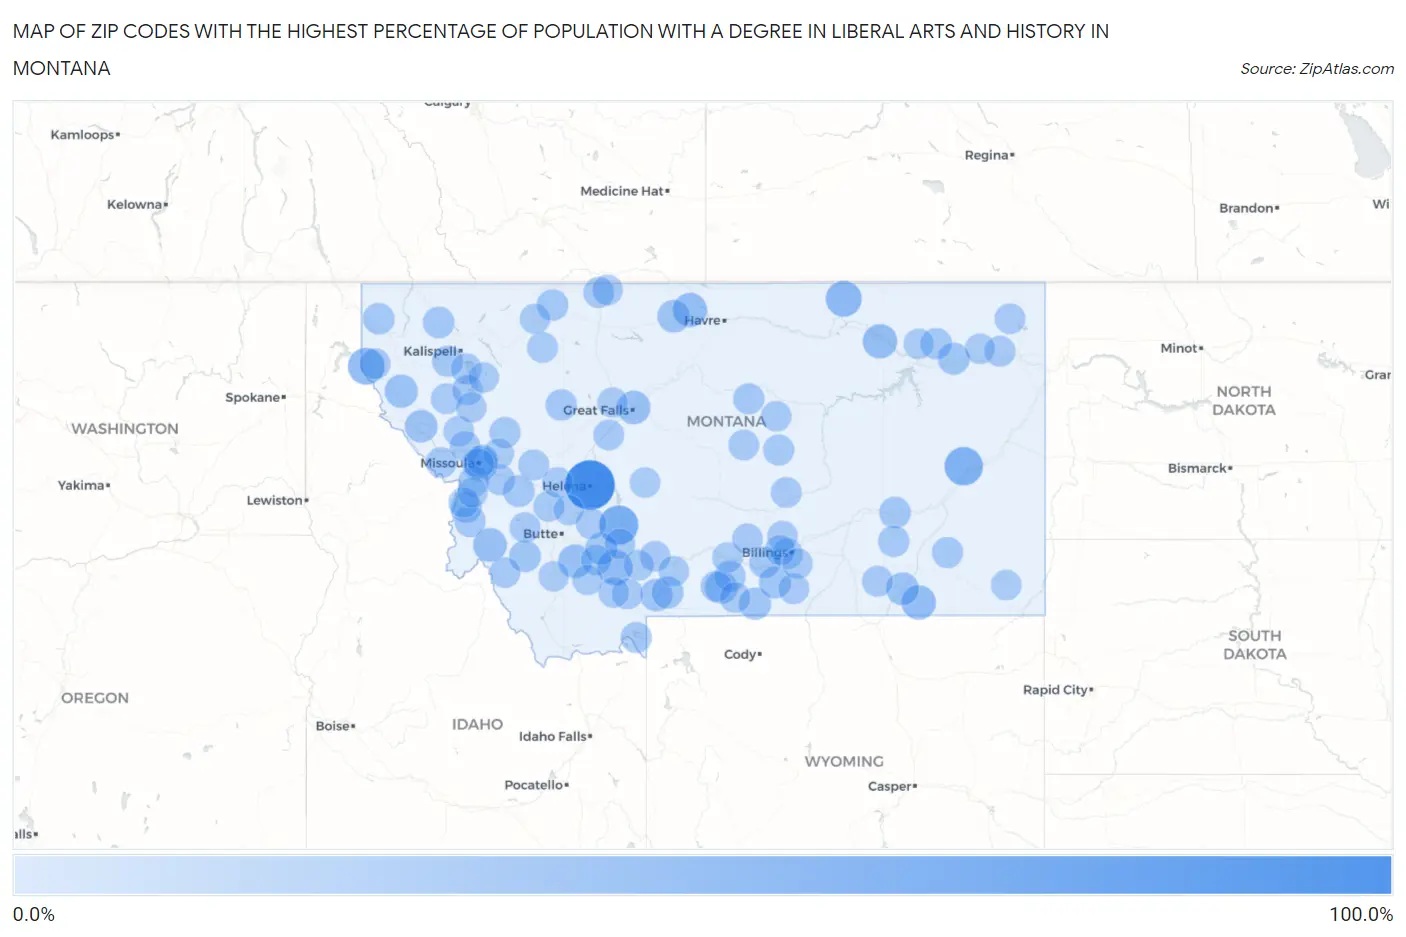
Map of Zip Codes with the Highest Percentage of Population with a Degree in Liberal Arts and History in Montana
0.0%
100.0%
Zip Codes with the Highest Percentage of Population with a Degree in Liberal Arts and History in Montana
| Zip Code | % Graduates | vs State | vs National | |
| 1. | 59625 | 100.0% | 5.3%(+94.7)#1 | 4.9%(+95.1)#36 |
| 2. | 59643 | 48.2% | 5.3%(+42.9)#2 | 4.9%(+43.4)#181 |
| 3. | 59349 | 43.8% | 5.3%(+38.5)#3 | 4.9%(+38.9)#210 |
| 4. | 59844 | 36.5% | 5.3%(+31.2)#4 | 4.9%(+31.6)#286 |
| 5. | 59544 | 32.4% | 5.3%(+27.1)#5 | 4.9%(+27.5)#373 |
| 6. | 59745 | 29.4% | 5.3%(+24.1)#6 | 4.9%(+24.5)#431 |
| 7. | 59812 | 27.3% | 5.3%(+22.0)#7 | 4.9%(+22.4)#489 |
| 8. | 59062 | 25.0% | 5.3%(+19.7)#8 | 4.9%(+20.1)#597 |
| 9. | 59273 | 25.0% | 5.3%(+19.7)#9 | 4.9%(+20.1)#599 |
| 10. | 59525 | 24.1% | 5.3%(+18.8)#10 | 4.9%(+19.3)#626 |
| 11. | 59871 | 21.8% | 5.3%(+16.5)#11 | 4.9%(+16.9)#746 |
| 12. | 59751 | 21.5% | 5.3%(+16.2)#12 | 4.9%(+16.6)#767 |
| 13. | 59414 | 20.7% | 5.3%(+15.4)#13 | 4.9%(+15.8)#815 |
| 14. | 59873 | 19.6% | 5.3%(+14.3)#14 | 4.9%(+14.7)#895 |
| 15. | 59012 | 18.2% | 5.3%(+12.9)#15 | 4.9%(+13.3)#1,020 |
| 16. | 59540 | 17.0% | 5.3%(+11.7)#16 | 4.9%(+12.1)#1,133 |
| 17. | 59866 | 16.8% | 5.3%(+11.5)#17 | 4.9%(+11.9)#1,151 |
| 18. | 59028 | 16.1% | 5.3%(+10.8)#18 | 4.9%(+11.2)#1,250 |
| 19. | 59027 | 16.0% | 5.3%(+10.7)#19 | 4.9%(+11.1)#1,257 |
| 20. | 59007 | 14.7% | 5.3%(+9.41)#20 | 4.9%(+9.83)#1,479 |
| 21. | 59065 | 14.3% | 5.3%(+8.99)#21 | 4.9%(+9.41)#1,587 |
| 22. | 59029 | 14.0% | 5.3%(+8.69)#22 | 4.9%(+9.11)#1,640 |
| 23. | 59201 | 13.7% | 5.3%(+8.43)#23 | 4.9%(+8.85)#1,705 |
| 24. | 59721 | 13.3% | 5.3%(+8.04)#24 | 4.9%(+8.46)#1,817 |
| 25. | 59762 | 12.5% | 5.3%(+7.21)#25 | 4.9%(+7.63)#2,053 |
| 26. | 59837 | 12.2% | 5.3%(+6.95)#26 | 4.9%(+7.37)#2,123 |
| 27. | 59935 | 12.0% | 5.3%(+6.71)#27 | 4.9%(+7.13)#2,204 |
| 28. | 59427 | 11.7% | 5.3%(+6.39)#28 | 4.9%(+6.81)#2,306 |
| 29. | 59927 | 11.6% | 5.3%(+6.27)#29 | 4.9%(+6.69)#2,342 |
| 30. | 59225 | 11.4% | 5.3%(+6.14)#30 | 4.9%(+6.56)#2,383 |
| 31. | 59327 | 11.4% | 5.3%(+6.07)#31 | 4.9%(+6.49)#2,423 |
| 32. | 59063 | 11.2% | 5.3%(+5.92)#32 | 4.9%(+6.34)#2,468 |
| 33. | 59410 | 11.1% | 5.3%(+5.82)#33 | 4.9%(+6.24)#2,506 |
| 34. | 59840 | 10.0% | 5.3%(+4.73)#34 | 4.9%(+5.15)#3,091 |
| 35. | 59841 | 10.0% | 5.3%(+4.71)#35 | 4.9%(+5.13)#3,110 |
| 36. | 59323 | 10.0% | 5.3%(+4.68)#36 | 4.9%(+5.10)#3,131 |
| 37. | 59001 | 9.8% | 5.3%(+4.56)#37 | 4.9%(+4.98)#3,201 |
| 38. | 59351 | 9.5% | 5.3%(+4.23)#38 | 4.9%(+4.65)#3,443 |
| 39. | 59489 | 9.4% | 5.3%(+4.14)#39 | 4.9%(+4.56)#3,506 |
| 40. | 59032 | 9.4% | 5.3%(+4.08)#40 | 4.9%(+4.50)#3,542 |
| 41. | 59868 | 9.1% | 5.3%(+3.82)#41 | 4.9%(+4.24)#3,743 |
| 42. | 59061 | 9.0% | 5.3%(+3.70)#42 | 4.9%(+4.12)#3,871 |
| 43. | 59482 | 8.6% | 5.3%(+3.32)#43 | 4.9%(+3.74)#4,226 |
| 44. | 59920 | 8.6% | 5.3%(+3.31)#44 | 4.9%(+3.73)#4,230 |
| 45. | 59758 | 8.6% | 5.3%(+3.27)#45 | 4.9%(+3.69)#4,282 |
| 46. | 59213 | 8.5% | 5.3%(+3.24)#46 | 4.9%(+3.66)#4,301 |
| 47. | 59843 | 8.5% | 5.3%(+3.22)#47 | 4.9%(+3.64)#4,326 |
| 48. | 59016 | 8.3% | 5.3%(+3.04)#48 | 4.9%(+3.46)#4,517 |
| 49. | 59716 | 8.2% | 5.3%(+2.92)#49 | 4.9%(+3.34)#4,649 |
| 50. | 59853 | 8.2% | 5.3%(+2.90)#50 | 4.9%(+3.32)#4,669 |
| 51. | 59820 | 8.1% | 5.3%(+2.84)#51 | 4.9%(+3.26)#4,748 |
| 52. | 59833 | 8.1% | 5.3%(+2.78)#52 | 4.9%(+3.20)#4,815 |
| 53. | 59722 | 8.0% | 5.3%(+2.72)#53 | 4.9%(+3.14)#4,882 |
| 54. | 59448 | 8.0% | 5.3%(+2.71)#54 | 4.9%(+3.13)#4,898 |
| 55. | 59922 | 8.0% | 5.3%(+2.67)#55 | 4.9%(+3.09)#4,939 |
| 56. | 59072 | 7.9% | 5.3%(+2.64)#56 | 4.9%(+3.06)#4,991 |
| 57. | 59421 | 7.9% | 5.3%(+2.61)#57 | 4.9%(+3.03)#5,026 |
| 58. | 59066 | 7.9% | 5.3%(+2.60)#58 | 4.9%(+3.02)#5,043 |
| 59. | 59845 | 7.8% | 5.3%(+2.55)#59 | 4.9%(+2.97)#5,104 |
| 60. | 59457 | 7.7% | 5.3%(+2.39)#60 | 4.9%(+2.81)#5,339 |
| 61. | 59715 | 7.5% | 5.3%(+2.24)#61 | 4.9%(+2.66)#5,539 |
| 62. | 59258 | 7.4% | 5.3%(+2.12)#62 | 4.9%(+2.54)#5,734 |
| 63. | 59484 | 7.4% | 5.3%(+2.12)#63 | 4.9%(+2.54)#5,736 |
| 64. | 59632 | 7.4% | 5.3%(+2.09)#64 | 4.9%(+2.51)#5,765 |
| 65. | 59102 | 7.3% | 5.3%(+2.04)#65 | 4.9%(+2.46)#5,825 |
| 66. | 59069 | 7.2% | 5.3%(+1.95)#66 | 4.9%(+2.37)#5,974 |
| 67. | 59471 | 7.1% | 5.3%(+1.85)#67 | 4.9%(+2.27)#6,166 |
| 68. | 59067 | 7.1% | 5.3%(+1.85)#68 | 4.9%(+2.27)#6,170 |
| 69. | 59713 | 7.1% | 5.3%(+1.85)#69 | 4.9%(+2.27)#6,171 |
| 70. | 59002 | 7.1% | 5.3%(+1.85)#70 | 4.9%(+2.27)#6,173 |
| 71. | 59729 | 7.1% | 5.3%(+1.83)#71 | 4.9%(+2.25)#6,199 |
| 72. | 59711 | 7.1% | 5.3%(+1.78)#72 | 4.9%(+2.20)#6,269 |
| 73. | 59860 | 7.0% | 5.3%(+1.74)#73 | 4.9%(+2.16)#6,335 |
| 74. | 59825 | 7.0% | 5.3%(+1.73)#74 | 4.9%(+2.15)#6,361 |
| 75. | 59068 | 7.0% | 5.3%(+1.70)#75 | 4.9%(+2.12)#6,397 |
| 76. | 59831 | 7.0% | 5.3%(+1.68)#76 | 4.9%(+2.10)#6,432 |
| 77. | 59761 | 6.9% | 5.3%(+1.65)#77 | 4.9%(+2.07)#6,487 |
| 78. | 59047 | 6.8% | 5.3%(+1.46)#78 | 4.9%(+1.88)#6,822 |
| 79. | 59875 | 6.7% | 5.3%(+1.43)#79 | 4.9%(+1.85)#6,885 |
| 80. | 59834 | 6.7% | 5.3%(+1.43)#80 | 4.9%(+1.85)#6,890 |
| 81. | 59752 | 6.7% | 5.3%(+1.42)#81 | 4.9%(+1.84)#6,910 |
| 82. | 59332 | 6.7% | 5.3%(+1.37)#82 | 4.9%(+1.79)#7,034 |
| 83. | 59802 | 6.6% | 5.3%(+1.32)#83 | 4.9%(+1.74)#7,127 |
| 84. | 59106 | 6.6% | 5.3%(+1.30)#84 | 4.9%(+1.72)#7,165 |
| 85. | 59255 | 6.5% | 5.3%(+1.25)#85 | 4.9%(+1.67)#7,258 |
| 86. | 59101 | 6.5% | 5.3%(+1.22)#86 | 4.9%(+1.64)#7,321 |
| 87. | 59823 | 6.5% | 5.3%(+1.20)#87 | 4.9%(+1.62)#7,359 |
| 88. | 59718 | 6.5% | 5.3%(+1.19)#88 | 4.9%(+1.61)#7,374 |
| 89. | 59248 | 6.4% | 5.3%(+1.07)#89 | 4.9%(+1.49)#7,638 |
| 90. | 59417 | 6.3% | 5.3%(+0.973)#90 | 4.9%(+1.39)#7,863 |
| 91. | 59747 | 6.2% | 5.3%(+0.958)#91 | 4.9%(+1.38)#7,916 |
| 92. | 59645 | 6.1% | 5.3%(+0.780)#92 | 4.9%(+1.20)#8,338 |
| 93. | 59864 | 6.0% | 5.3%(+0.743)#93 | 4.9%(+1.16)#8,426 |
| 94. | 59911 | 6.0% | 5.3%(+0.732)#94 | 4.9%(+1.15)#8,455 |
| 95. | 59732 | 6.0% | 5.3%(+0.708)#95 | 4.9%(+1.13)#8,521 |
| 96. | 59631 | 5.8% | 5.3%(+0.541)#96 | 4.9%(+0.961)#8,956 |
| 97. | 59801 | 5.8% | 5.3%(+0.524)#97 | 4.9%(+0.943)#9,001 |
| 98. | 59487 | 5.7% | 5.3%(+0.446)#98 | 4.9%(+0.866)#9,194 |
| 99. | 59870 | 5.7% | 5.3%(+0.436)#99 | 4.9%(+0.856)#9,224 |
| 100. | 59749 | 5.7% | 5.3%(+0.434)#100 | 4.9%(+0.854)#9,229 |
Common Questions
What are the Top 10 Zip Codes with the Highest Percentage of Population with a Degree in Liberal Arts and History in Montana?
Top 10 Zip Codes with the Highest Percentage of Population with a Degree in Liberal Arts and History in Montana are:
What zip code has the Highest Percentage of Population with a Degree in Liberal Arts and History in Montana?
59625 has the Highest Percentage of Population with a Degree in Liberal Arts and History in Montana with 100.0%.
What is the Percentage of Population with a Degree in Liberal Arts and History in the State of Montana?
Percentage of Population with a Degree in Liberal Arts and History in Montana is 5.3%.
What is the Percentage of Population with a Degree in Liberal Arts and History in the United States?
Percentage of Population with a Degree in Liberal Arts and History in the United States is 4.9%.