Zip Codes with the Highest Percentage of Population with a Degree in Liberal Arts and History in Missoula, MT
RELATED REPORTS & OPTIONS
Liberal Arts and History
Missoula
Compare Zip Codes
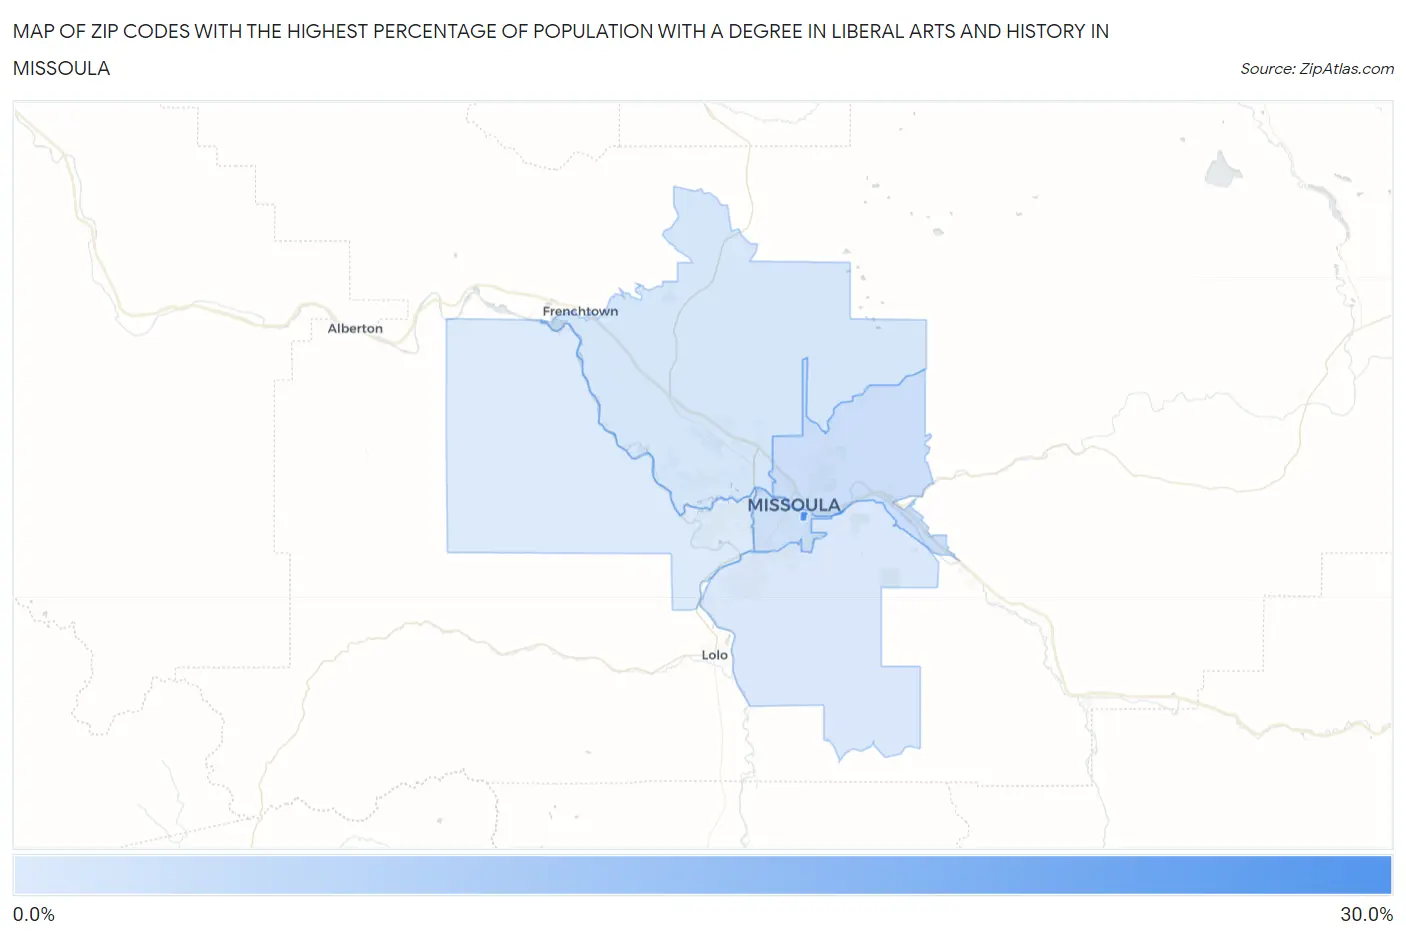
Map of Zip Codes with the Highest Percentage of Population with a Degree in Liberal Arts and History in Missoula
3.8%
27.3%
Zip Codes with the Highest Percentage of Population with a Degree in Liberal Arts and History in Missoula, MT
| Zip Code | % Graduates | vs State | vs National | |
| 1. | 59812 | 27.3% | 5.3%(+22.0)#7 | 4.9%(+22.4)#489 |
| 2. | 59802 | 6.6% | 5.3%(+1.32)#83 | 4.9%(+1.74)#7,127 |
| 3. | 59801 | 5.8% | 5.3%(+0.524)#97 | 4.9%(+0.943)#9,001 |
| 4. | 59808 | 4.8% | 5.3%(-0.522)#117 | 4.9%(-0.102)#12,067 |
| 5. | 59803 | 4.3% | 5.3%(-0.989)#130 | 4.9%(-0.569)#13,624 |
| 6. | 59804 | 3.8% | 5.3%(-1.46)#139 | 4.9%(-1.04)#15,419 |
1
Common Questions
What are the Top 5 Zip Codes with the Highest Percentage of Population with a Degree in Liberal Arts and History in Missoula, MT?
Top 5 Zip Codes with the Highest Percentage of Population with a Degree in Liberal Arts and History in Missoula, MT are:
What zip code has the Highest Percentage of Population with a Degree in Liberal Arts and History in Missoula, MT?
59812 has the Highest Percentage of Population with a Degree in Liberal Arts and History in Missoula, MT with 27.3%.
What is the Percentage of Population with a Degree in Liberal Arts and History in Missoula, MT?
Percentage of Population with a Degree in Liberal Arts and History in Missoula is 5.5%.
What is the Percentage of Population with a Degree in Liberal Arts and History in Montana?
Percentage of Population with a Degree in Liberal Arts and History in Montana is 5.3%.
What is the Percentage of Population with a Degree in Liberal Arts and History in the United States?
Percentage of Population with a Degree in Liberal Arts and History in the United States is 4.9%.