Zip Codes with the Highest Percentage of Population Employed in Farming, Fishing & Forestry in Nampa, ID
RELATED REPORTS & OPTIONS
Farming, Fishing & Forestry
Nampa
Compare Zip Codes
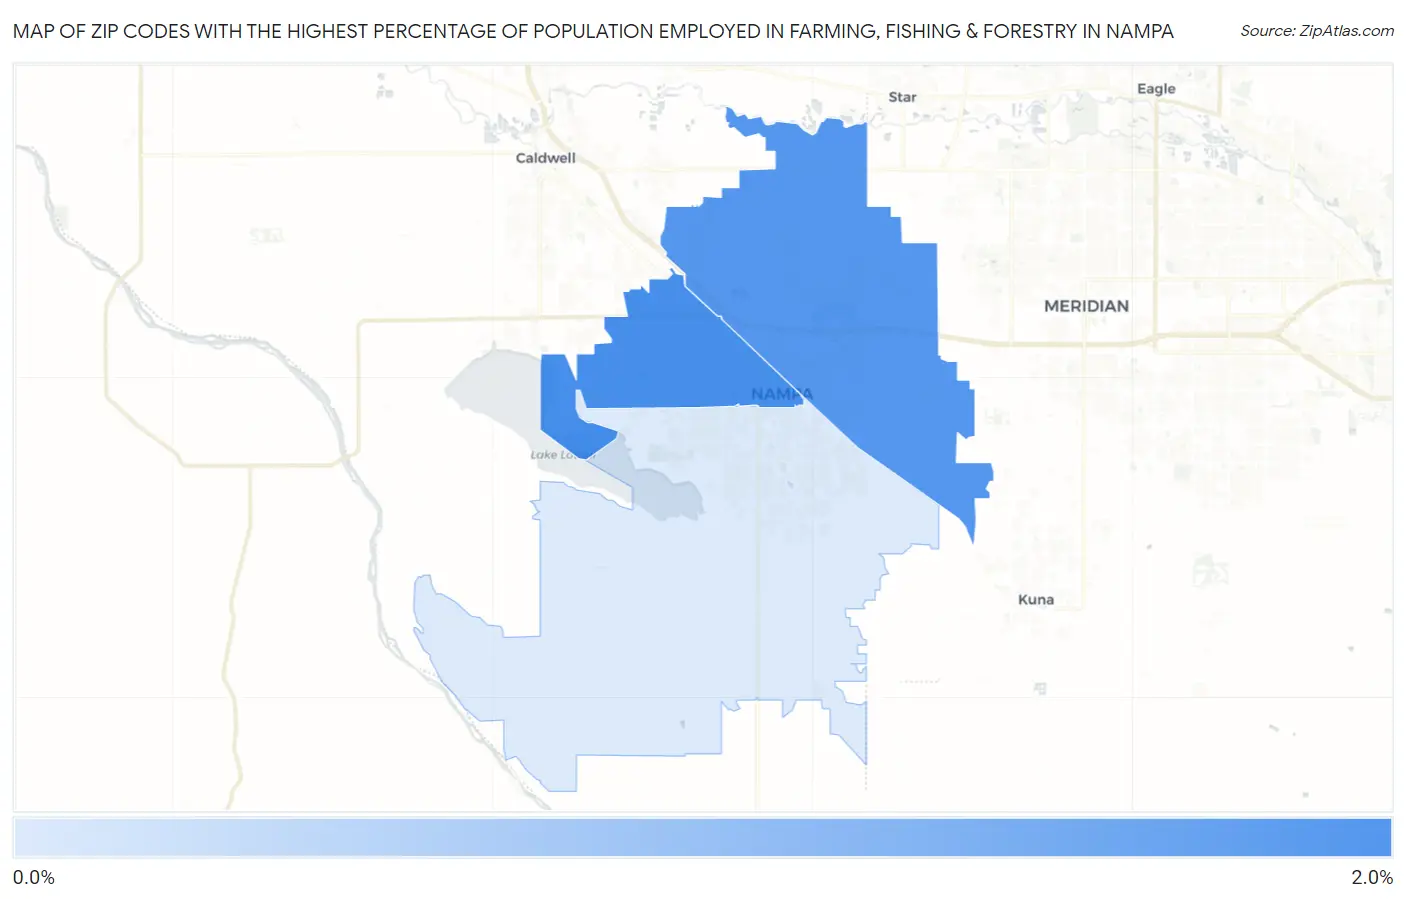
Map of Zip Codes with the Highest Percentage of Population Employed in Farming, Fishing & Forestry in Nampa
0.92%
1.6%
Zip Codes with the Highest Percentage of Population Employed in Farming, Fishing & Forestry in Nampa, ID
| Zip Code | % Employed | vs State | vs National | |
| 1. | 83651 | 1.6% | 2.0%(-0.371)#131 | 0.61%(+1.01)#7,534 |
| 2. | 83687 | 1.6% | 2.0%(-0.435)#133 | 0.61%(+0.946)#7,737 |
| 3. | 83686 | 0.92% | 2.0%(-1.06)#153 | 0.61%(+0.317)#10,112 |
1
Common Questions
What are the Top Zip Codes with the Highest Percentage of Population Employed in Farming, Fishing & Forestry in Nampa, ID?
Top Zip Codes with the Highest Percentage of Population Employed in Farming, Fishing & Forestry in Nampa, ID are:
What zip code has the Highest Percentage of Population Employed in Farming, Fishing & Forestry in Nampa, ID?
83651 has the Highest Percentage of Population Employed in Farming, Fishing & Forestry in Nampa, ID with 1.6%.
What is the Percentage of Population Employed in Farming, Fishing & Forestry in Nampa, ID?
Percentage of Population Employed in Farming, Fishing & Forestry in Nampa is 1.0%.
What is the Percentage of Population Employed in Farming, Fishing & Forestry in Idaho?
Percentage of Population Employed in Farming, Fishing & Forestry in Idaho is 2.0%.
What is the Percentage of Population Employed in Farming, Fishing & Forestry in the United States?
Percentage of Population Employed in Farming, Fishing & Forestry in the United States is 0.61%.