South Brooksville, FL Map & Demographics
South Brooksville Map
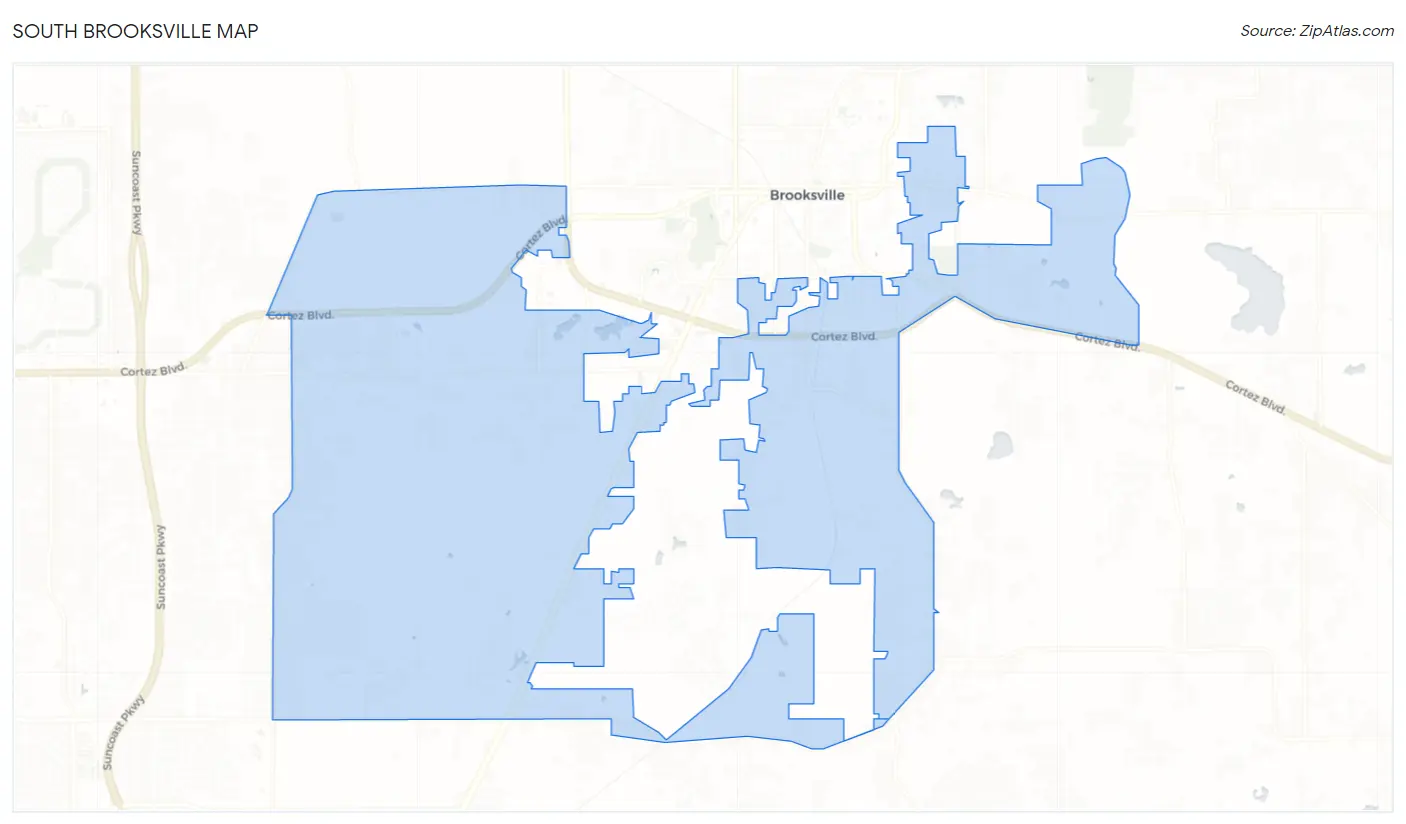
South Brooksville Overview
$26,551
PER CAPITA INCOME
$64,028
AVG FAMILY INCOME
$55,594
AVG HOUSEHOLD INCOME
47.8%
WAGE / INCOME GAP [ % ]
52.2¢/ $1
WAGE / INCOME GAP [ $ ]
0.39
INEQUALITY / GINI INDEX
4,577
TOTAL POPULATION
1,854
MALE POPULATION
2,723
FEMALE POPULATION
68.09
MALES / 100 FEMALES
146.87
FEMALES / 100 MALES
53.7
MEDIAN AGE
2.9
AVG FAMILY SIZE
2.3
AVG HOUSEHOLD SIZE
1,920
LABOR FORCE [ PEOPLE ]
50.9%
PERCENT IN LABOR FORCE
3.5%
UNEMPLOYMENT RATE
Income in South Brooksville
Income Overview in South Brooksville
Per Capita Income in South Brooksville is $26,551, while median incomes of families and households are $64,028 and $55,594 respectively.
| Characteristic | Number | Measure |
| Per Capita Income | 4,577 | $26,551 |
| Median Family Income | 1,240 | $64,028 |
| Mean Family Income | 1,240 | $75,799 |
| Median Household Income | 1,981 | $55,594 |
| Mean Household Income | 1,981 | $60,137 |
| Income Deficit | 1,240 | $0 |
| Wage / Income Gap (%) | 4,577 | 47.76% |
| Wage / Income Gap ($) | 4,577 | 52.24¢ per $1 |
| Gini / Inequality Index | 4,577 | 0.39 |
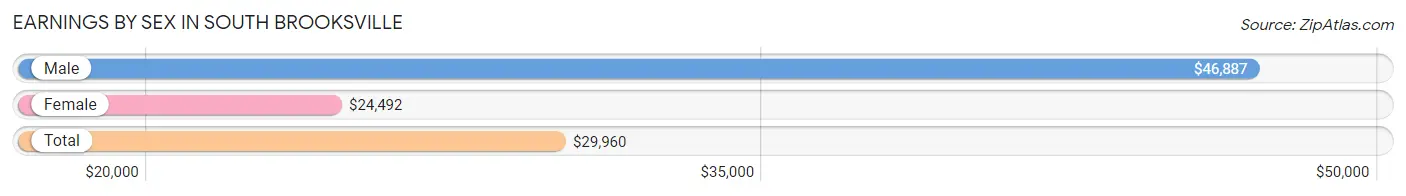
Earnings by Sex in South Brooksville
Average Earnings in South Brooksville are $29,960, $46,887 for men and $24,492 for women, a difference of 47.8%.
| Sex | Number | Average Earnings |
| Male | 905 (45.2%) | $46,887 |
| Female | 1,099 (54.8%) | $24,492 |
| Total | 2,004 (100.0%) | $29,960 |
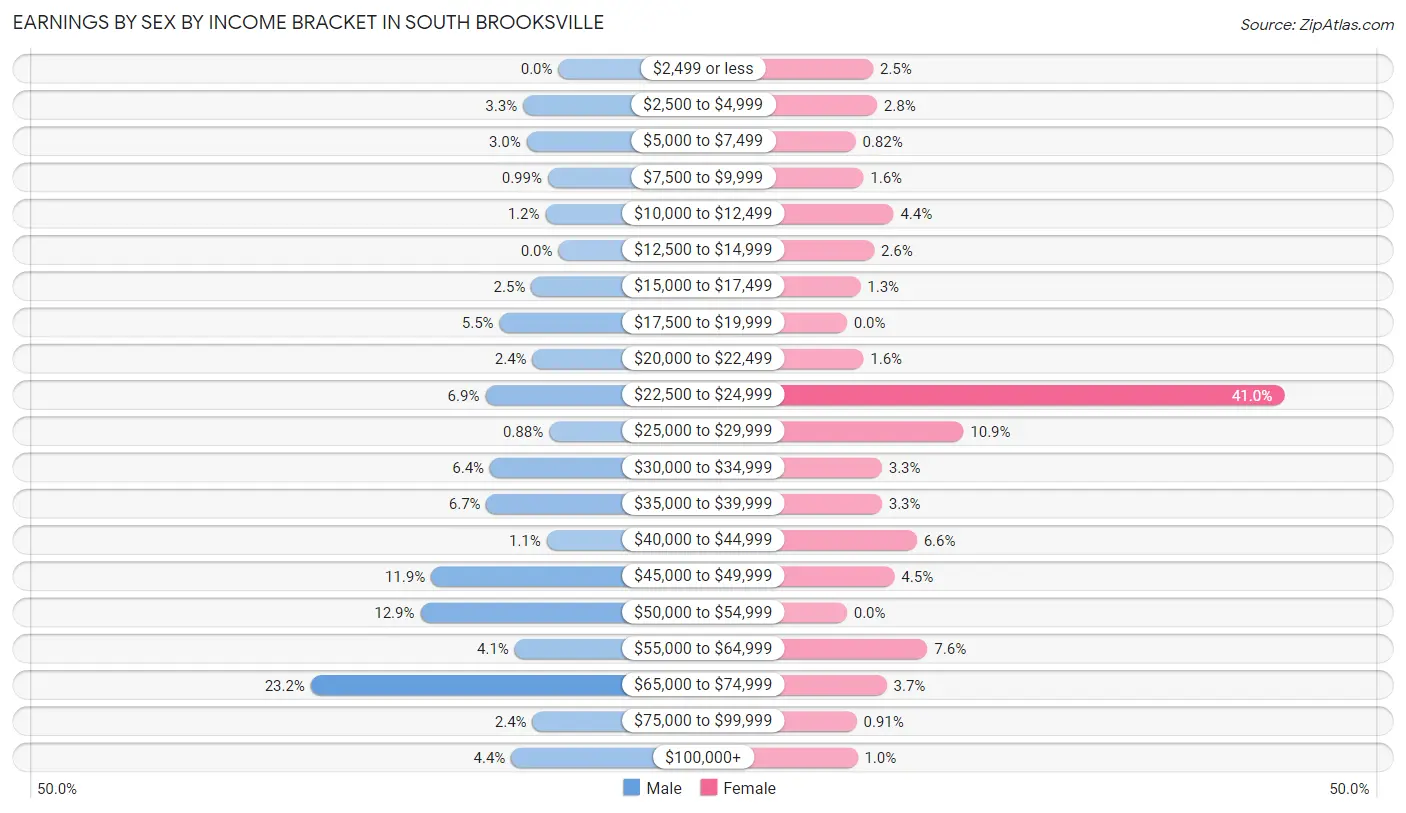
Earnings by Sex by Income Bracket in South Brooksville
The most common earnings brackets in South Brooksville are $65,000 to $74,999 for men (210 | 23.2%) and $22,500 to $24,999 for women (450 | 40.9%).
| Income | Male | Female |
| $2,499 or less | 0 (0.0%) | 27 (2.5%) |
| $2,500 to $4,999 | 30 (3.3%) | 31 (2.8%) |
| $5,000 to $7,499 | 27 (3.0%) | 9 (0.8%) |
| $7,500 to $9,999 | 9 (1.0%) | 17 (1.5%) |
| $10,000 to $12,499 | 11 (1.2%) | 48 (4.4%) |
| $12,500 to $14,999 | 0 (0.0%) | 28 (2.5%) |
| $15,000 to $17,499 | 23 (2.5%) | 14 (1.3%) |
| $17,500 to $19,999 | 50 (5.5%) | 0 (0.0%) |
| $20,000 to $22,499 | 22 (2.4%) | 17 (1.5%) |
| $22,500 to $24,999 | 62 (6.9%) | 450 (40.9%) |
| $25,000 to $29,999 | 8 (0.9%) | 120 (10.9%) |
| $30,000 to $34,999 | 58 (6.4%) | 36 (3.3%) |
| $35,000 to $39,999 | 61 (6.7%) | 36 (3.3%) |
| $40,000 to $44,999 | 10 (1.1%) | 72 (6.6%) |
| $45,000 to $49,999 | 108 (11.9%) | 49 (4.5%) |
| $50,000 to $54,999 | 117 (12.9%) | 0 (0.0%) |
| $55,000 to $64,999 | 37 (4.1%) | 83 (7.5%) |
| $65,000 to $74,999 | 210 (23.2%) | 41 (3.7%) |
| $75,000 to $99,999 | 22 (2.4%) | 10 (0.9%) |
| $100,000+ | 40 (4.4%) | 11 (1.0%) |
| Total | 905 (100.0%) | 1,099 (100.0%) |
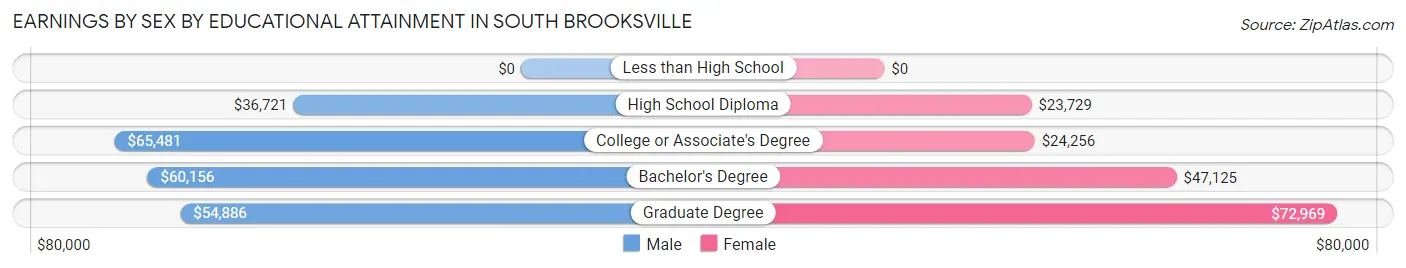
Earnings by Sex by Educational Attainment in South Brooksville
Average earnings in South Brooksville are $52,596 for men and $24,567 for women, a difference of 53.3%. Men with an educational attainment of college or associate's degree enjoy the highest average annual earnings of $65,481, while those with high school diploma education earn the least with $36,721. Women with an educational attainment of graduate degree earn the most with the average annual earnings of $72,969, while those with high school diploma education have the smallest earnings of $23,729.
| Educational Attainment | Male Income | Female Income |
| Less than High School | - | - |
| High School Diploma | $36,721 | $23,729 |
| College or Associate's Degree | $65,481 | $24,256 |
| Bachelor's Degree | $60,156 | $47,125 |
| Graduate Degree | $54,886 | $72,969 |
| Total | $52,596 | $24,567 |
Family Income in South Brooksville
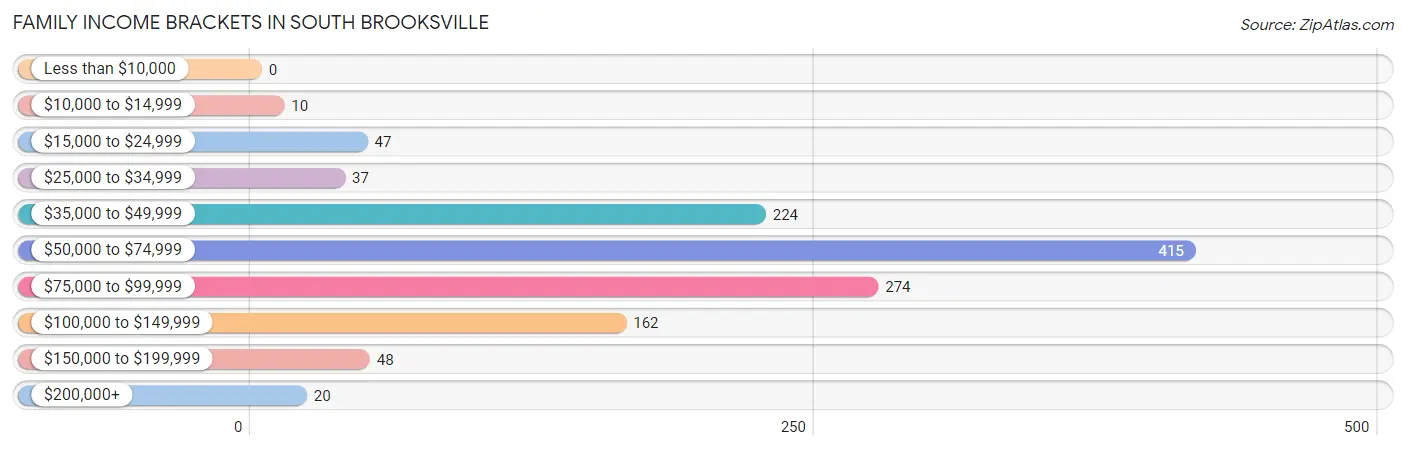
Family Income Brackets in South Brooksville
According to the South Brooksville family income data, there are 415 families falling into the $50,000 to $74,999 income range, which is the most common income bracket and makes up 33.5% of all families.
| Income Bracket | # Families | % Families |
| Less than $10,000 | 0 | 0.0% |
| $10,000 to $14,999 | 10 | 0.8% |
| $15,000 to $24,999 | 47 | 3.8% |
| $25,000 to $34,999 | 37 | 3.0% |
| $35,000 to $49,999 | 224 | 18.1% |
| $50,000 to $74,999 | 415 | 33.5% |
| $75,000 to $99,999 | 274 | 22.1% |
| $100,000 to $149,999 | 162 | 13.1% |
| $150,000 to $199,999 | 48 | 3.9% |
| $200,000+ | 20 | 1.6% |
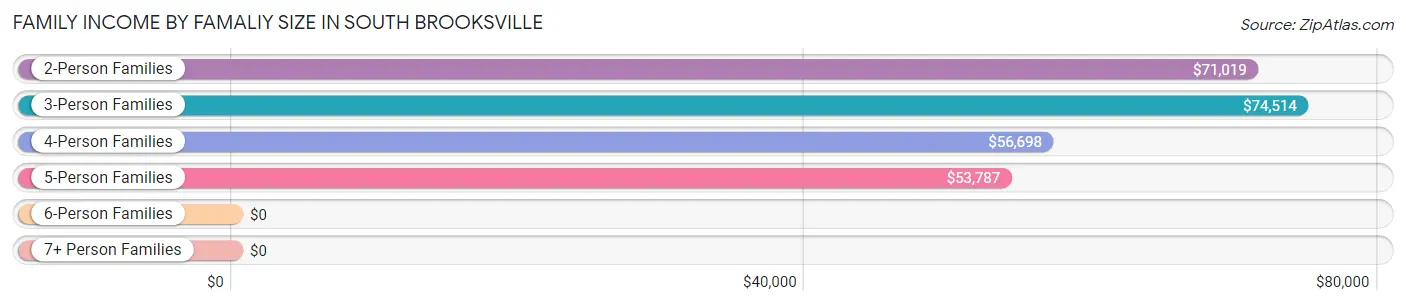
Family Income by Famaliy Size in South Brooksville
3-person families (305 | 24.6%) account for the highest median family income in South Brooksville with $74,514 per family, while 2-person families (562 | 45.3%) have the highest median income of $35,510 per family member.
| Income Bracket | # Families | Median Income |
| 2-Person Families | 562 (45.3%) | $71,019 |
| 3-Person Families | 305 (24.6%) | $74,514 |
| 4-Person Families | 312 (25.2%) | $56,698 |
| 5-Person Families | 61 (4.9%) | $53,787 |
| 6-Person Families | 0 (0.0%) | $0 |
| 7+ Person Families | 0 (0.0%) | $0 |
| Total | 1,240 (100.0%) | $64,028 |
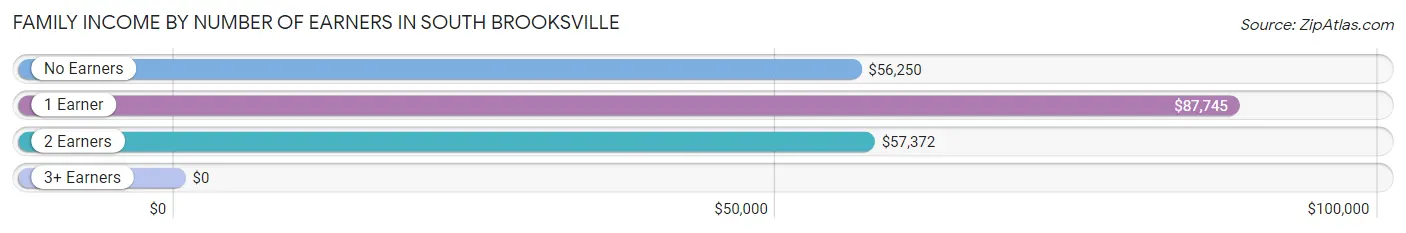
Family Income by Number of Earners in South Brooksville
| Number of Earners | # Families | Median Income |
| No Earners | 306 (24.7%) | $56,250 |
| 1 Earner | 368 (29.7%) | $87,745 |
| 2 Earners | 548 (44.2%) | $57,372 |
| 3+ Earners | 18 (1.5%) | $0 |
| Total | 1,240 (100.0%) | $64,028 |
Household Income in South Brooksville
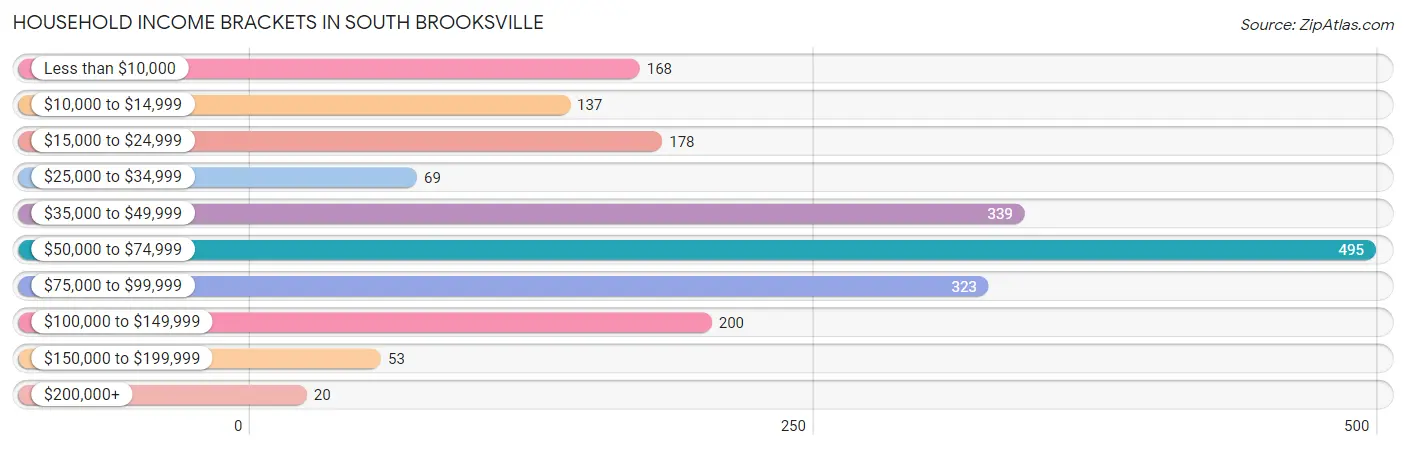
Household Income Brackets in South Brooksville
With 495 households falling in the category, the $50,000 to $74,999 income range is the most frequent in South Brooksville, accounting for 25.0% of all households. In contrast, only 20 households (1.0%) fall into the $200,000+ income bracket, making it the least populous group.
| Income Bracket | # Households | % Households |
| Less than $10,000 | 168 | 8.5% |
| $10,000 to $14,999 | 137 | 6.9% |
| $15,000 to $24,999 | 178 | 9.0% |
| $25,000 to $34,999 | 69 | 3.5% |
| $35,000 to $49,999 | 339 | 17.1% |
| $50,000 to $74,999 | 495 | 25.0% |
| $75,000 to $99,999 | 323 | 16.3% |
| $100,000 to $149,999 | 200 | 10.1% |
| $150,000 to $199,999 | 53 | 2.7% |
| $200,000+ | 20 | 1.0% |
Household Income by Householder Age in South Brooksville
The median household income in South Brooksville is $55,594, with the highest median household income of $68,250 found in the 45 to 64 years age bracket for the primary householder. A total of 674 households (34.0%) fall into this category. Meanwhile, the 15 to 24 years age bracket for the primary householder has the lowest median household income of $0, with 27 households (1.4%) in this group.
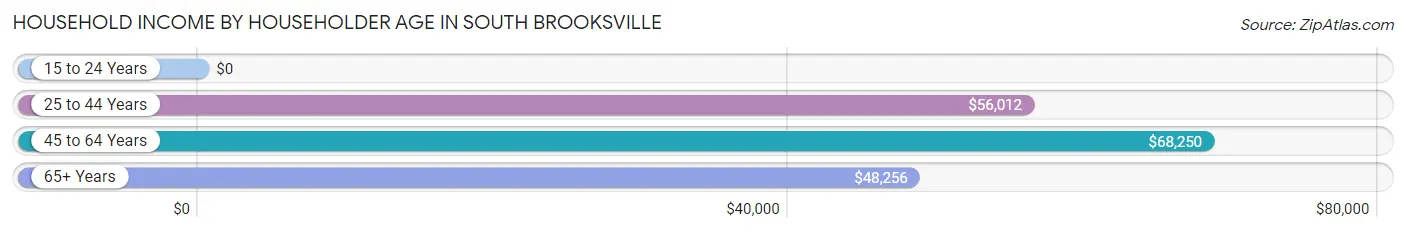
| Income Bracket | # Households | Median Income |
| 15 to 24 Years | 27 (1.4%) | $0 |
| 25 to 44 Years | 532 (26.9%) | $56,012 |
| 45 to 64 Years | 674 (34.0%) | $68,250 |
| 65+ Years | 748 (37.8%) | $48,256 |
| Total | 1,981 (100.0%) | $55,594 |
Poverty in South Brooksville
Income Below Poverty by Sex and Age in South Brooksville
With 11.6% poverty level for males and 10.3% for females among the residents of South Brooksville, 6 to 11 year old males and 18 to 24 year old females are the most vulnerable to poverty, with 24 males (64.9%) and 57 females (48.7%) in their respective age groups living below the poverty level.
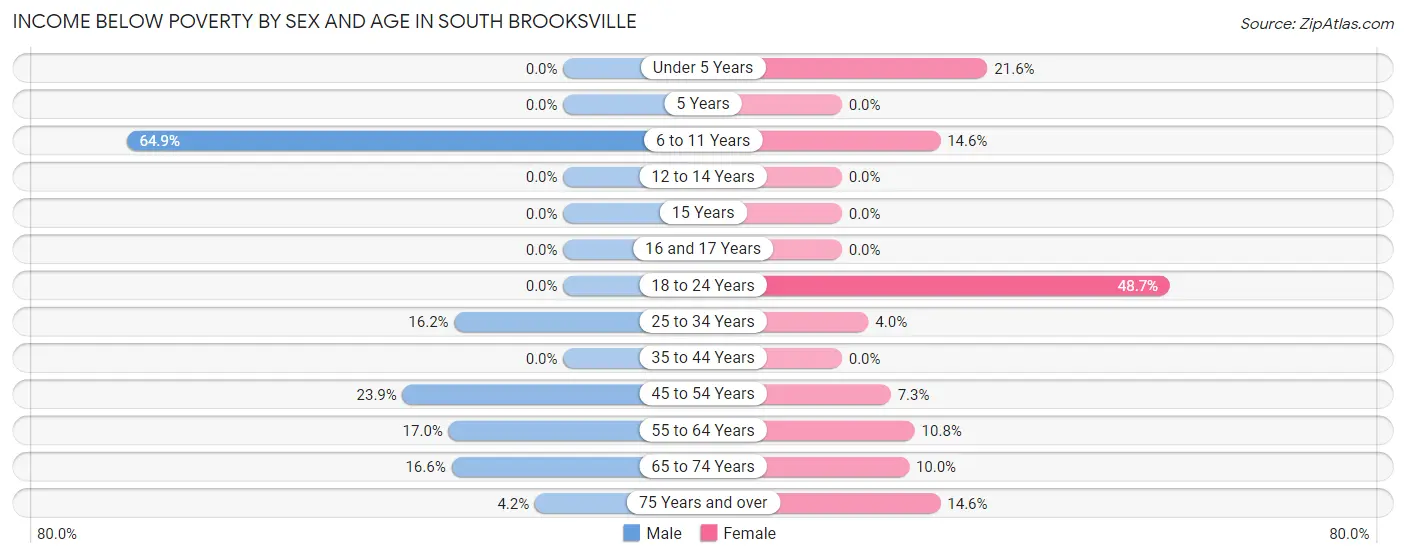
| Age Bracket | Male | Female |
| Under 5 Years | 0 (0.0%) | 16 (21.6%) |
| 5 Years | 0 (0.0%) | 0 (0.0%) |
| 6 to 11 Years | 24 (64.9%) | 13 (14.6%) |
| 12 to 14 Years | 0 (0.0%) | 0 (0.0%) |
| 15 Years | 0 (0.0%) | 0 (0.0%) |
| 16 and 17 Years | 0 (0.0%) | 0 (0.0%) |
| 18 to 24 Years | 0 (0.0%) | 57 (48.7%) |
| 25 to 34 Years | 28 (16.2%) | 13 (4.0%) |
| 35 to 44 Years | 0 (0.0%) | 0 (0.0%) |
| 45 to 54 Years | 58 (23.9%) | 17 (7.3%) |
| 55 to 64 Years | 47 (17.0%) | 70 (10.8%) |
| 65 to 74 Years | 46 (16.6%) | 30 (10.0%) |
| 75 Years and over | 12 (4.2%) | 65 (14.6%) |
| Total | 215 (11.6%) | 281 (10.3%) |
Income Above Poverty by Sex and Age in South Brooksville
According to the poverty statistics in South Brooksville, males aged under 5 years and females aged 12 to 14 years are the age groups that are most secure financially, with 100.0% of males and 100.0% of females in these age groups living above the poverty line.
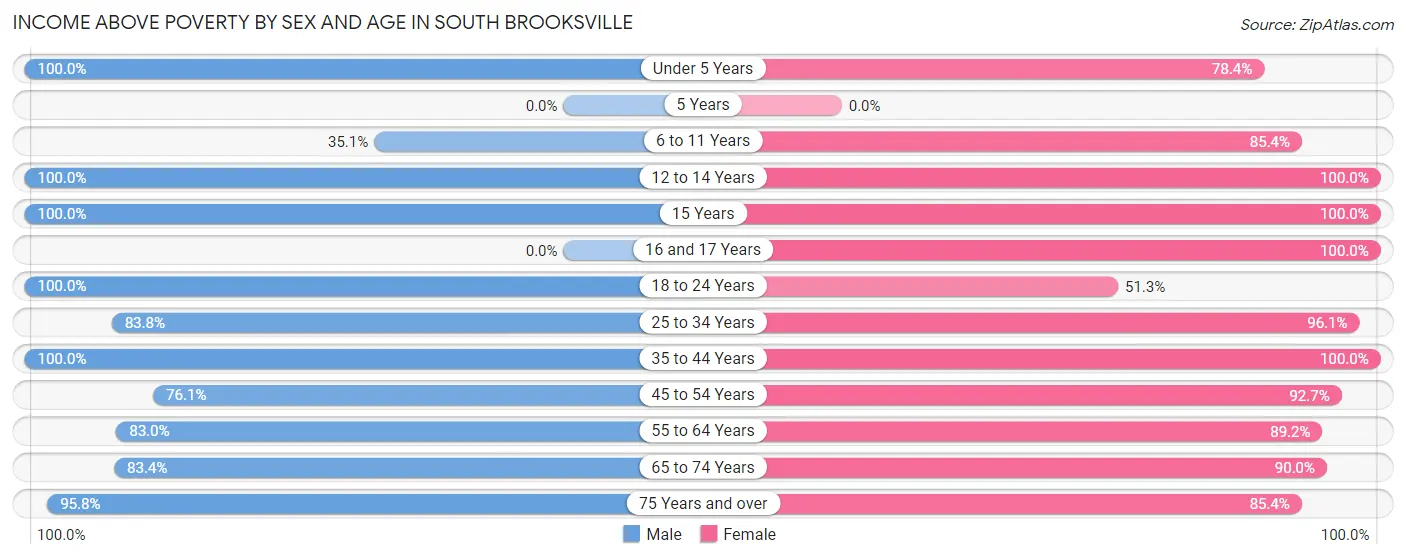
| Age Bracket | Male | Female |
| Under 5 Years | 10 (100.0%) | 58 (78.4%) |
| 5 Years | 0 (0.0%) | 0 (0.0%) |
| 6 to 11 Years | 13 (35.1%) | 76 (85.4%) |
| 12 to 14 Years | 202 (100.0%) | 270 (100.0%) |
| 15 Years | 107 (100.0%) | 16 (100.0%) |
| 16 and 17 Years | 0 (0.0%) | 70 (100.0%) |
| 18 to 24 Years | 62 (100.0%) | 60 (51.3%) |
| 25 to 34 Years | 145 (83.8%) | 316 (96.1%) |
| 35 to 44 Years | 181 (100.0%) | 132 (100.0%) |
| 45 to 54 Years | 185 (76.1%) | 217 (92.7%) |
| 55 to 64 Years | 229 (83.0%) | 577 (89.2%) |
| 65 to 74 Years | 231 (83.4%) | 271 (90.0%) |
| 75 Years and over | 274 (95.8%) | 379 (85.4%) |
| Total | 1,639 (88.4%) | 2,442 (89.7%) |
Income Below Poverty Among Married-Couple Families in South Brooksville
The poverty statistics for married-couple families in South Brooksville show that 1.6% or 13 of the total 822 families live below the poverty line. Families with 3 or 4 children have the highest poverty rate of 21.3%, comprising of 13 families. On the other hand, families with no children have the lowest poverty rate of 0.0%, which includes 0 families.
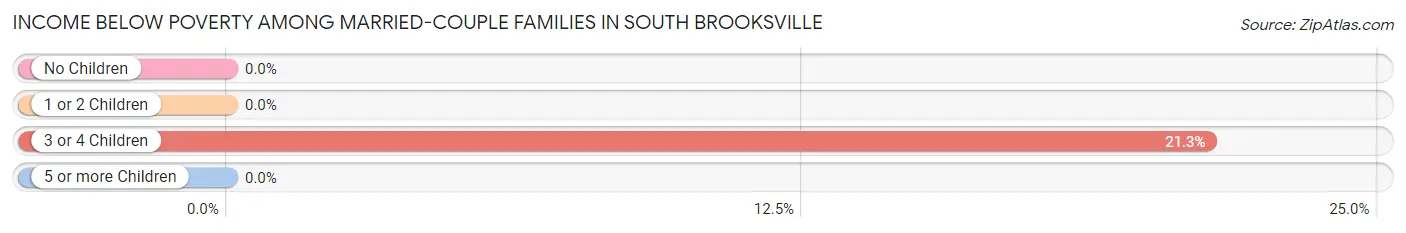
| Children | Above Poverty | Below Poverty |
| No Children | 639 (100.0%) | 0 (0.0%) |
| 1 or 2 Children | 122 (100.0%) | 0 (0.0%) |
| 3 or 4 Children | 48 (78.7%) | 13 (21.3%) |
| 5 or more Children | 0 (0.0%) | 0 (0.0%) |
| Total | 809 (98.4%) | 13 (1.6%) |
Income Below Poverty Among Single-Parent Households in South Brooksville
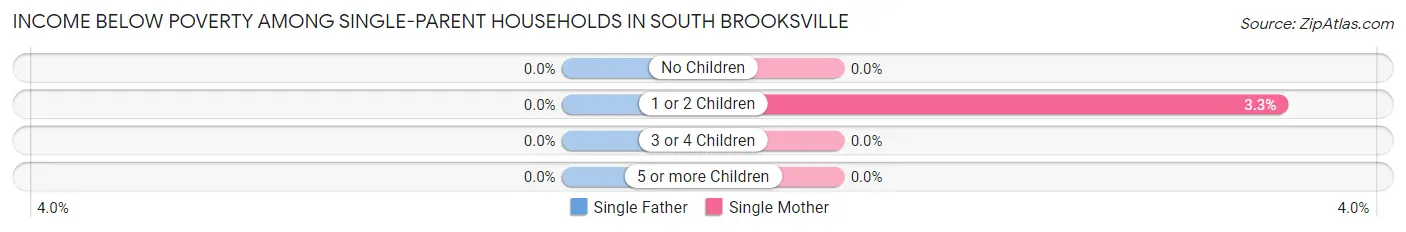
| Children | Single Father | Single Mother |
| No Children | 0 (0.0%) | 0 (0.0%) |
| 1 or 2 Children | 0 (0.0%) | 10 (3.3%) |
| 3 or 4 Children | 0 (0.0%) | 0 (0.0%) |
| 5 or more Children | 0 (0.0%) | 0 (0.0%) |
| Total | 0 (0.0%) | 10 (2.5%) |
Income Below Poverty Among Married-Couple vs Single-Parent Households in South Brooksville
The poverty data for South Brooksville shows that 13 of the married-couple family households (1.6%) and 10 of the single-parent households (2.4%) are living below the poverty level. Within the married-couple family households, those with 3 or 4 children have the highest poverty rate, with 13 households (21.3%) falling below the poverty line. Among the single-parent households, those with 1 or 2 children have the highest poverty rate, with 10 household (3.3%) living below poverty.
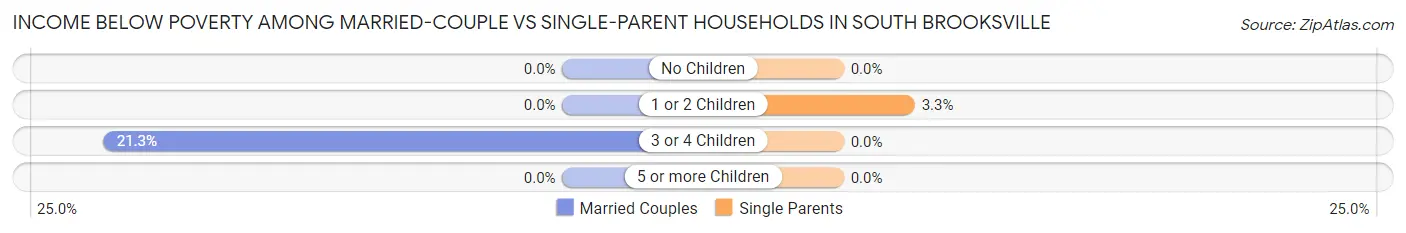
| Children | Married-Couple Families | Single-Parent Households |
| No Children | 0 (0.0%) | 0 (0.0%) |
| 1 or 2 Children | 0 (0.0%) | 10 (3.3%) |
| 3 or 4 Children | 13 (21.3%) | 0 (0.0%) |
| 5 or more Children | 0 (0.0%) | 0 (0.0%) |
| Total | 13 (1.6%) | 10 (2.4%) |
Race in South Brooksville
The most populous races in South Brooksville are White / Caucasian (4,134 | 90.3%), Black / African American (256 | 5.6%), and Two or more Races (144 | 3.2%).
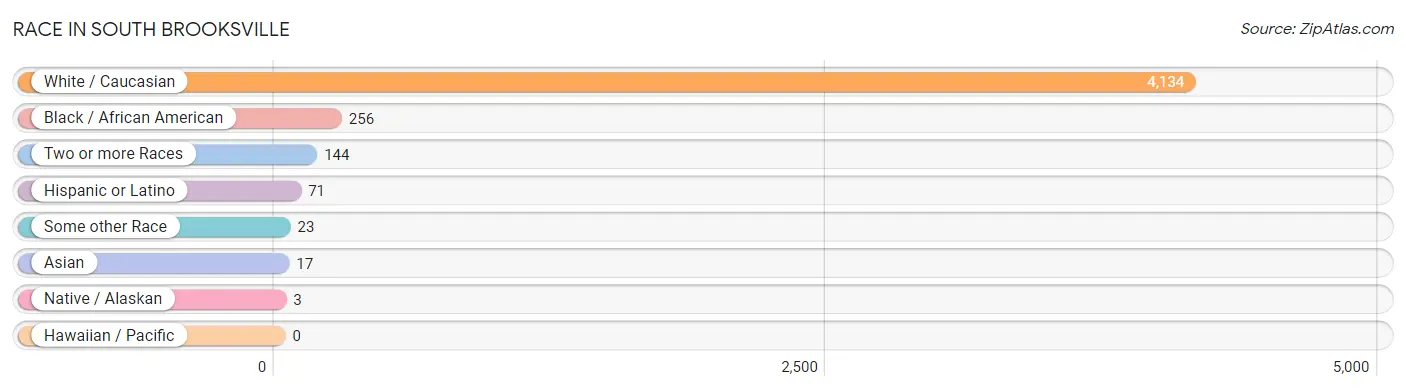
| Race | # Population | % Population |
| Asian | 17 | 0.4% |
| Black / African American | 256 | 5.6% |
| Hawaiian / Pacific | 0 | 0.0% |
| Hispanic or Latino | 71 | 1.5% |
| Native / Alaskan | 3 | 0.1% |
| White / Caucasian | 4,134 | 90.3% |
| Two or more Races | 144 | 3.2% |
| Some other Race | 23 | 0.5% |
| Total | 4,577 | 100.0% |
Ancestry in South Brooksville
The most populous ancestries reported in South Brooksville are German (1,701 | 37.2%), English (720 | 15.7%), Irish (487 | 10.6%), Italian (363 | 7.9%), and American (307 | 6.7%), together accounting for 78.2% of all South Brooksville residents.
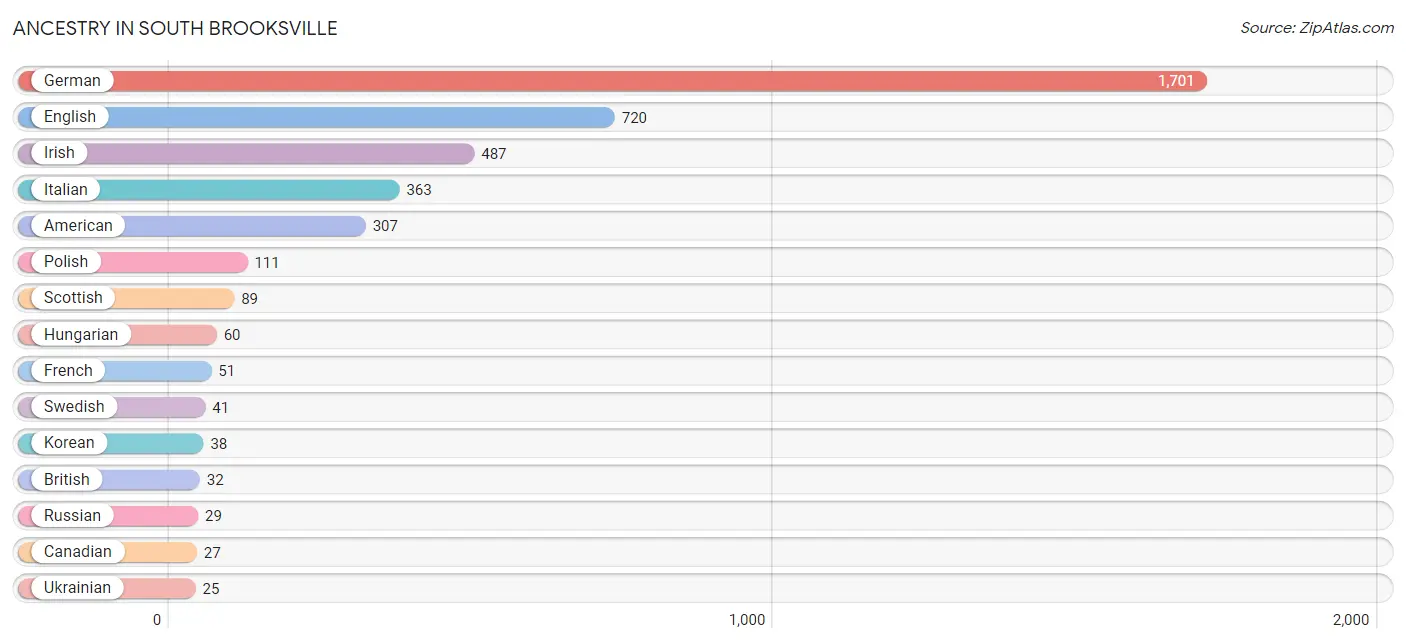
| Ancestry | # Population | % Population |
| American | 307 | 6.7% |
| Bhutanese | 10 | 0.2% |
| British | 32 | 0.7% |
| Burmese | 2 | 0.0% |
| Canadian | 27 | 0.6% |
| Cherokee | 10 | 0.2% |
| Croatian | 14 | 0.3% |
| Cuban | 18 | 0.4% |
| Czech | 16 | 0.4% |
| Czechoslovakian | 8 | 0.2% |
| Dutch | 16 | 0.4% |
| English | 720 | 15.7% |
| French | 51 | 1.1% |
| French Canadian | 11 | 0.2% |
| German | 1,701 | 37.2% |
| Hungarian | 60 | 1.3% |
| Irish | 487 | 10.6% |
| Italian | 363 | 7.9% |
| Korean | 38 | 0.8% |
| Norwegian | 16 | 0.4% |
| Polish | 111 | 2.4% |
| Puerto Rican | 23 | 0.5% |
| Russian | 29 | 0.6% |
| Scotch-Irish | 19 | 0.4% |
| Scottish | 89 | 1.9% |
| Slovak | 8 | 0.2% |
| Swedish | 41 | 0.9% |
| Ukrainian | 25 | 0.5% |
| Welsh | 15 | 0.3% | View All 29 Rows |
Immigrants in South Brooksville
The most numerous immigrant groups reported in South Brooksville came from Canada (36 | 0.8%), Asia (17 | 0.4%), Europe (15 | 0.3%), Northern Europe (15 | 0.3%), and Philippines (15 | 0.3%), together accounting for 2.2% of all South Brooksville residents.
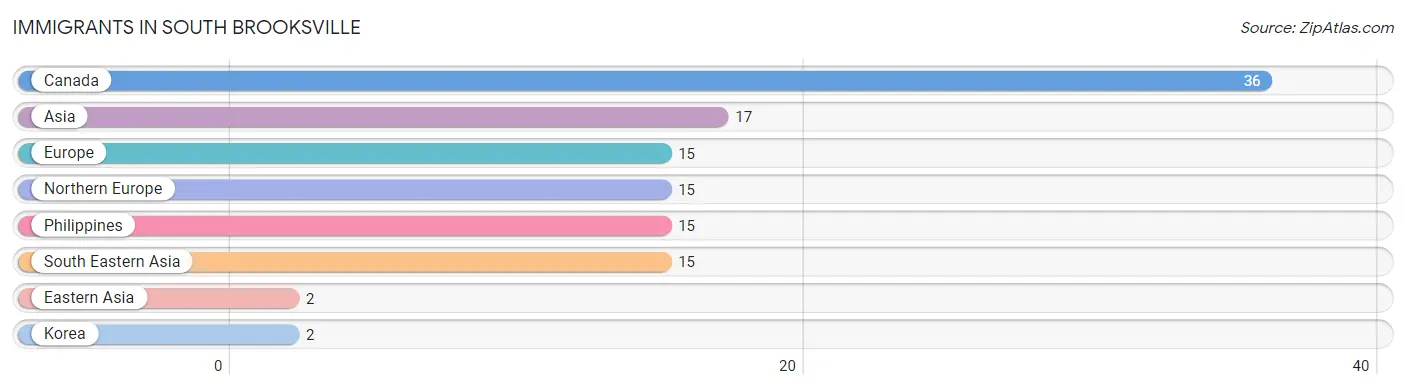
| Immigration Origin | # Population | % Population |
| Asia | 17 | 0.4% |
| Canada | 36 | 0.8% |
| Eastern Asia | 2 | 0.0% |
| Europe | 15 | 0.3% |
| Korea | 2 | 0.0% |
| Northern Europe | 15 | 0.3% |
| Philippines | 15 | 0.3% |
| South Eastern Asia | 15 | 0.3% | View All 8 Rows |
Sex and Age in South Brooksville
Sex and Age in South Brooksville
The most populous age groups in South Brooksville are 10 to 14 Years (213 | 11.5%) for men and 55 to 59 Years (434 | 15.9%) for women.
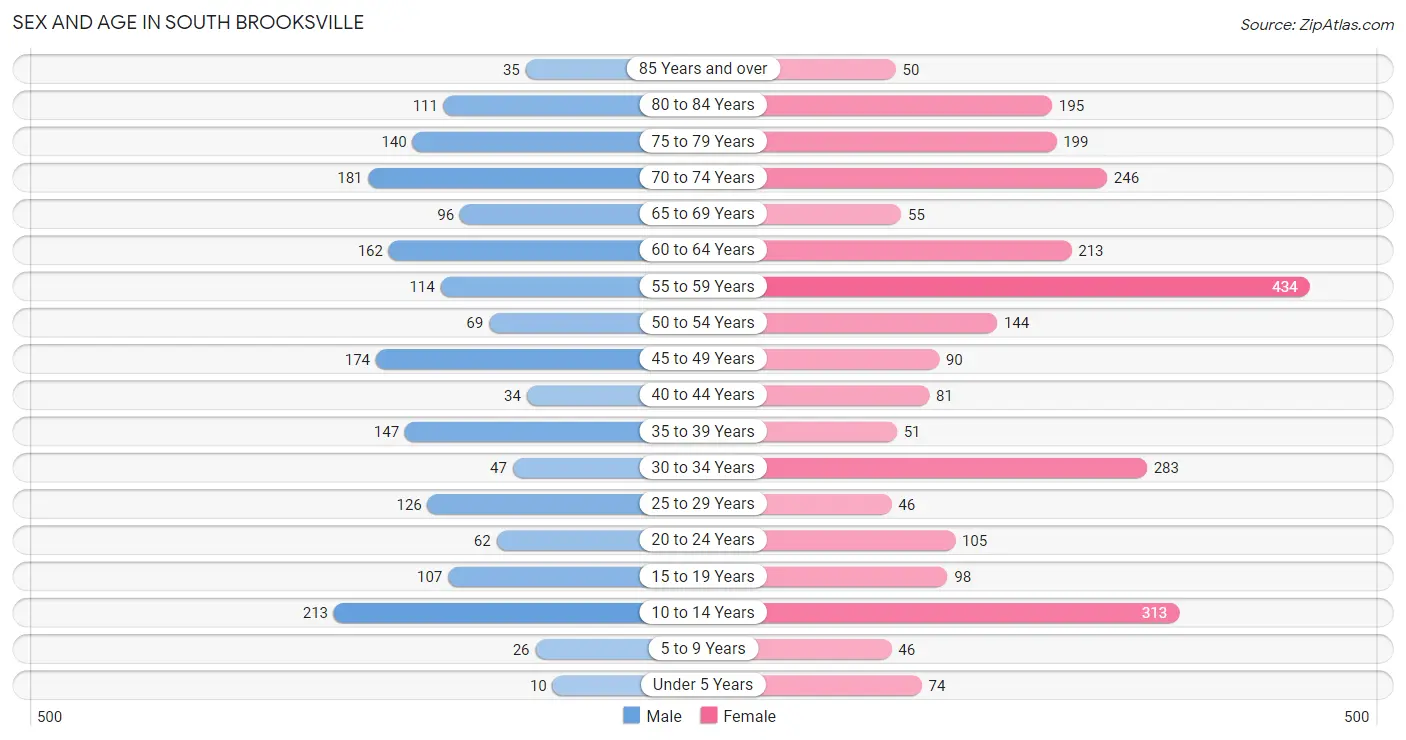
| Age Bracket | Male | Female |
| Under 5 Years | 10 (0.5%) | 74 (2.7%) |
| 5 to 9 Years | 26 (1.4%) | 46 (1.7%) |
| 10 to 14 Years | 213 (11.5%) | 313 (11.5%) |
| 15 to 19 Years | 107 (5.8%) | 98 (3.6%) |
| 20 to 24 Years | 62 (3.3%) | 105 (3.9%) |
| 25 to 29 Years | 126 (6.8%) | 46 (1.7%) |
| 30 to 34 Years | 47 (2.5%) | 283 (10.4%) |
| 35 to 39 Years | 147 (7.9%) | 51 (1.9%) |
| 40 to 44 Years | 34 (1.8%) | 81 (3.0%) |
| 45 to 49 Years | 174 (9.4%) | 90 (3.3%) |
| 50 to 54 Years | 69 (3.7%) | 144 (5.3%) |
| 55 to 59 Years | 114 (6.1%) | 434 (15.9%) |
| 60 to 64 Years | 162 (8.7%) | 213 (7.8%) |
| 65 to 69 Years | 96 (5.2%) | 55 (2.0%) |
| 70 to 74 Years | 181 (9.8%) | 246 (9.0%) |
| 75 to 79 Years | 140 (7.5%) | 199 (7.3%) |
| 80 to 84 Years | 111 (6.0%) | 195 (7.2%) |
| 85 Years and over | 35 (1.9%) | 50 (1.8%) |
| Total | 1,854 (100.0%) | 2,723 (100.0%) |
Families and Households in South Brooksville
Median Family Size in South Brooksville
The median family size in South Brooksville is 2.92 persons per family, with single female/mother families (392 | 31.6%) accounting for the largest median family size of 3.29 persons per family. On the other hand, married-couple families (822 | 66.3%) represent the smallest median family size with 2.74 persons per family.
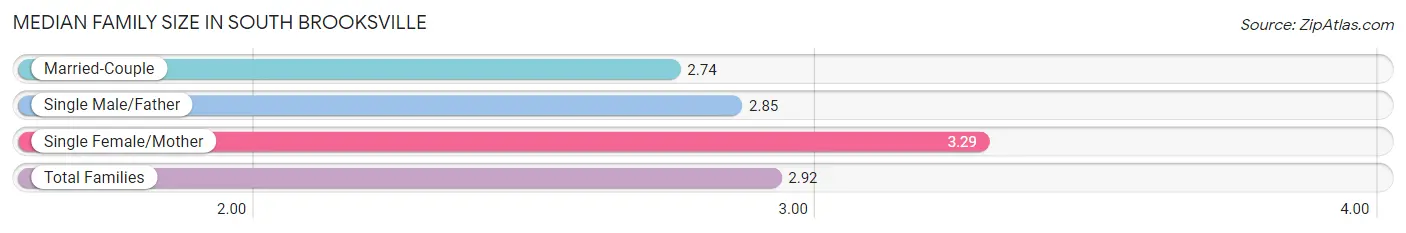
| Family Type | # Families | Family Size |
| Married-Couple | 822 (66.3%) | 2.74 |
| Single Male/Father | 26 (2.1%) | 2.85 |
| Single Female/Mother | 392 (31.6%) | 3.29 |
| Total Families | 1,240 (100.0%) | 2.92 |
Median Household Size in South Brooksville
The median household size in South Brooksville is 2.30 persons per household, with single male/father households (26 | 1.3%) accounting for the largest median household size of 3.62 persons per household. non-family households (741 | 37.4%) represent the smallest median household size with 1.21 persons per household.
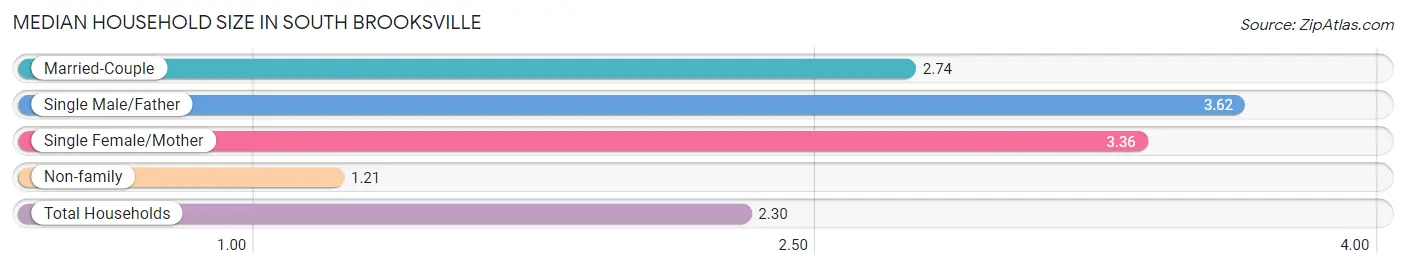
| Household Type | # Households | Household Size |
| Married-Couple | 822 (41.5%) | 2.74 |
| Single Male/Father | 26 (1.3%) | 3.62 |
| Single Female/Mother | 392 (19.8%) | 3.36 |
| Non-family | 741 (37.4%) | 1.21 |
| Total Households | 1,981 (100.0%) | 2.30 |
Household Size by Marriage Status in South Brooksville
Out of a total of 1,981 households in South Brooksville, 1,240 (62.6%) are family households, while 741 (37.4%) are nonfamily households. The most numerous type of family households are 2-person households, comprising 555, and the most common type of nonfamily households are 1-person households, comprising 601.
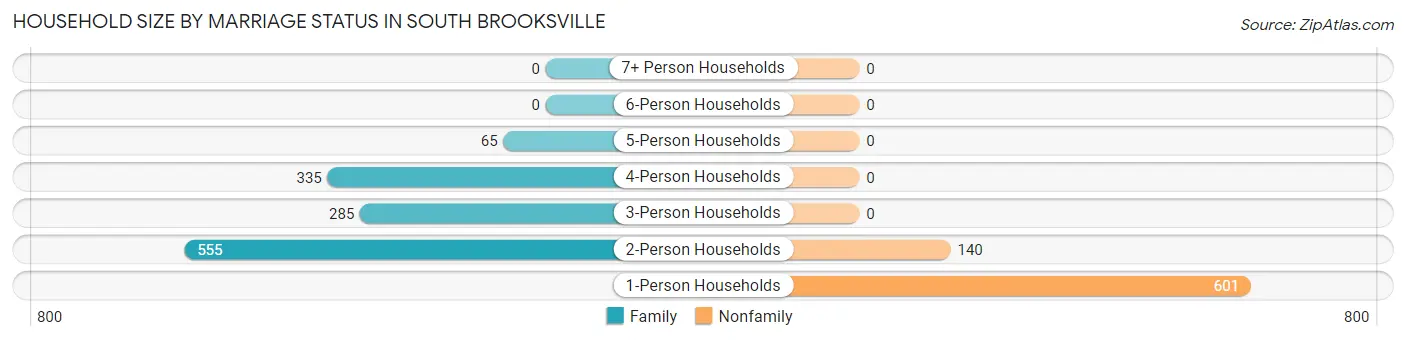
| Household Size | Family Households | Nonfamily Households |
| 1-Person Households | - | 601 (30.3%) |
| 2-Person Households | 555 (28.0%) | 140 (7.1%) |
| 3-Person Households | 285 (14.4%) | 0 (0.0%) |
| 4-Person Households | 335 (16.9%) | 0 (0.0%) |
| 5-Person Households | 65 (3.3%) | 0 (0.0%) |
| 6-Person Households | 0 (0.0%) | 0 (0.0%) |
| 7+ Person Households | 0 (0.0%) | 0 (0.0%) |
| Total | 1,240 (62.6%) | 741 (37.4%) |
Female Fertility in South Brooksville
Fertility by Age in South Brooksville
Average fertility rate in South Brooksville is 35.0 births per 1,000 women. Women in the age bracket of 20 to 34 years have the highest fertility rate with 62.0 births per 1,000 women. Women in the age bracket of 20 to 34 years acount for 100.0% of all women with births.
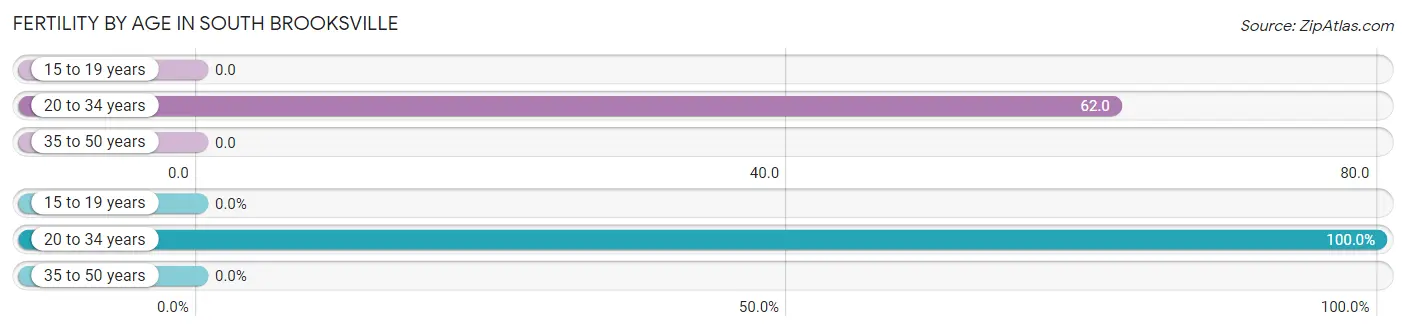
| Age Bracket | Women with Births | Births / 1,000 Women |
| 15 to 19 years | 0 (0.0%) | 0.0 |
| 20 to 34 years | 27 (100.0%) | 62.0 |
| 35 to 50 years | 0 (0.0%) | 0.0 |
| Total | 27 (100.0%) | 35.0 |
Fertility by Age by Marriage Status in South Brooksville
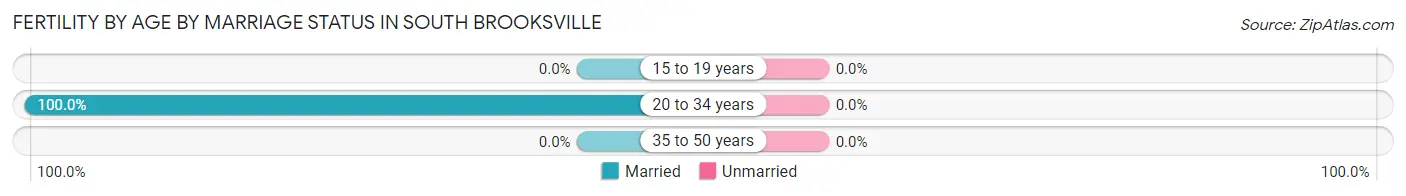
| Age Bracket | Married | Unmarried |
| 15 to 19 years | 0 (0.0%) | 0 (0.0%) |
| 20 to 34 years | 27 (100.0%) | 0 (0.0%) |
| 35 to 50 years | 0 (0.0%) | 0 (0.0%) |
| Total | 27 (100.0%) | 0 (0.0%) |
Fertility by Education in South Brooksville
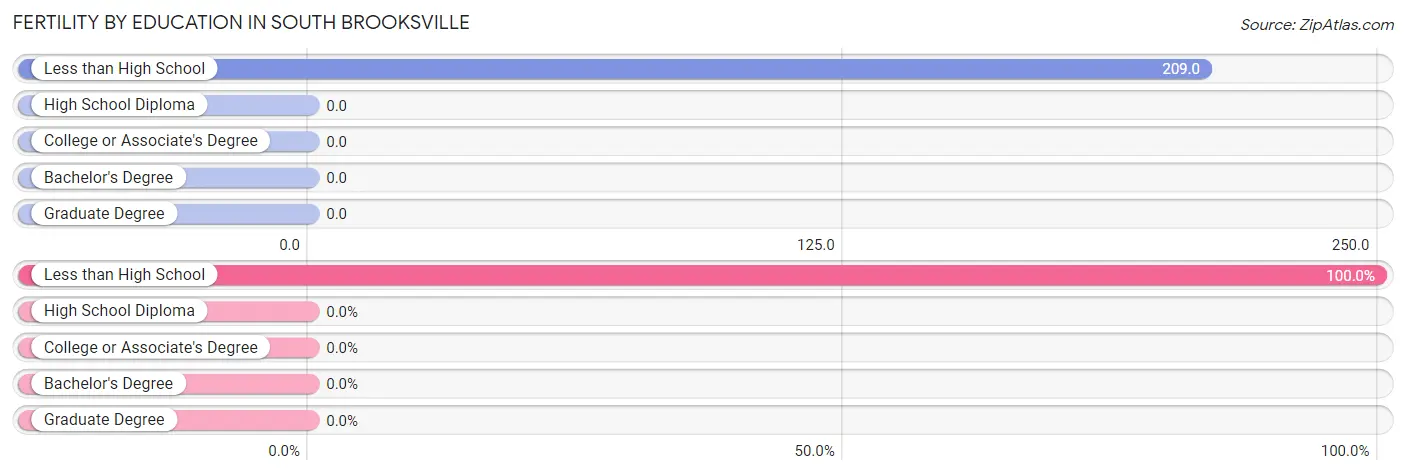
| Educational Attainment | Women with Births | Births / 1,000 Women |
| Less than High School | 27 (100.0%) | 209.0 |
| High School Diploma | 0 (0.0%) | 0.0 |
| College or Associate's Degree | 0 (0.0%) | 0.0 |
| Bachelor's Degree | 0 (0.0%) | 0.0 |
| Graduate Degree | 0 (0.0%) | 0.0 |
| Total | 27 (100.0%) | 35.0 |
Fertility by Education by Marriage Status in South Brooksville
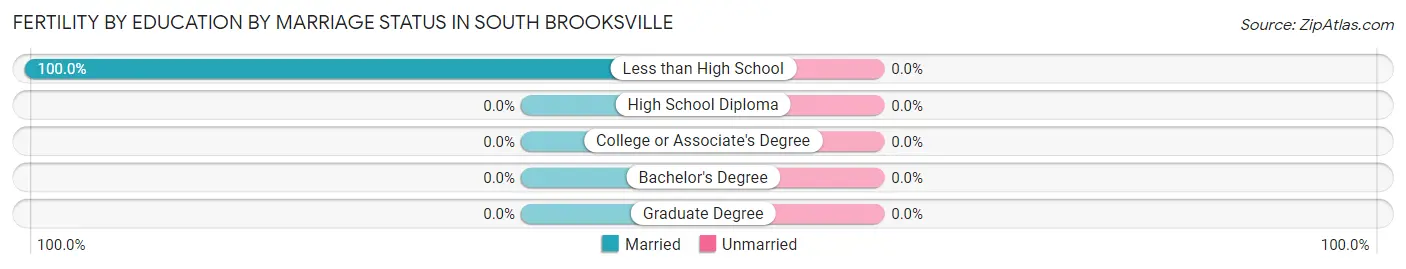
| Educational Attainment | Married | Unmarried |
| Less than High School | 27 (100.0%) | 0 (0.0%) |
| High School Diploma | 0 (0.0%) | 0 (0.0%) |
| College or Associate's Degree | 0 (0.0%) | 0 (0.0%) |
| Bachelor's Degree | 0 (0.0%) | 0 (0.0%) |
| Graduate Degree | 0 (0.0%) | 0 (0.0%) |
| Total | 27 (100.0%) | 0 (0.0%) |
Employment Characteristics in South Brooksville
Employment by Class of Employer in South Brooksville
Among the 1,840 employed individuals in South Brooksville, private company employees (1,362 | 74.0%), local government employees (215 | 11.7%), and not-for-profit organizations (121 | 6.6%) make up the most common classes of employment.
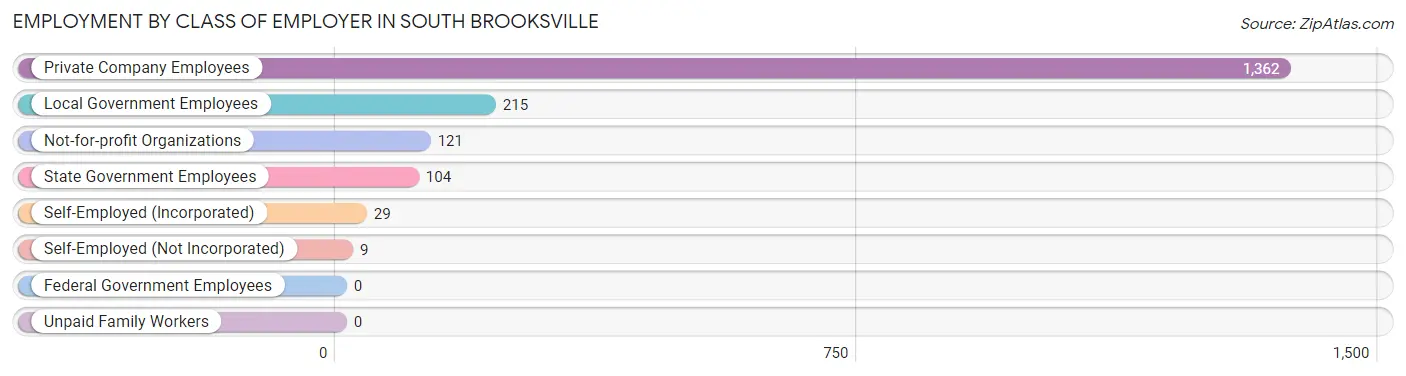
| Employer Class | # Employees | % Employees |
| Private Company Employees | 1,362 | 74.0% |
| Self-Employed (Incorporated) | 29 | 1.6% |
| Self-Employed (Not Incorporated) | 9 | 0.5% |
| Not-for-profit Organizations | 121 | 6.6% |
| Local Government Employees | 215 | 11.7% |
| State Government Employees | 104 | 5.7% |
| Federal Government Employees | 0 | 0.0% |
| Unpaid Family Workers | 0 | 0.0% |
| Total | 1,840 | 100.0% |
Employment Status by Age in South Brooksville
According to the labor force statistics for South Brooksville, out of the total population over 16 years of age (3,772), 50.9% or 1,920 individuals are in the labor force, with 3.5% or 67 of them unemployed. The age group with the highest labor force participation rate is 30 to 34 years, with 95.5% or 315 individuals in the labor force. Within the labor force, the 55 to 59 years age range has the highest percentage of unemployed individuals, with 7.8% or 29 of them being unemployed.
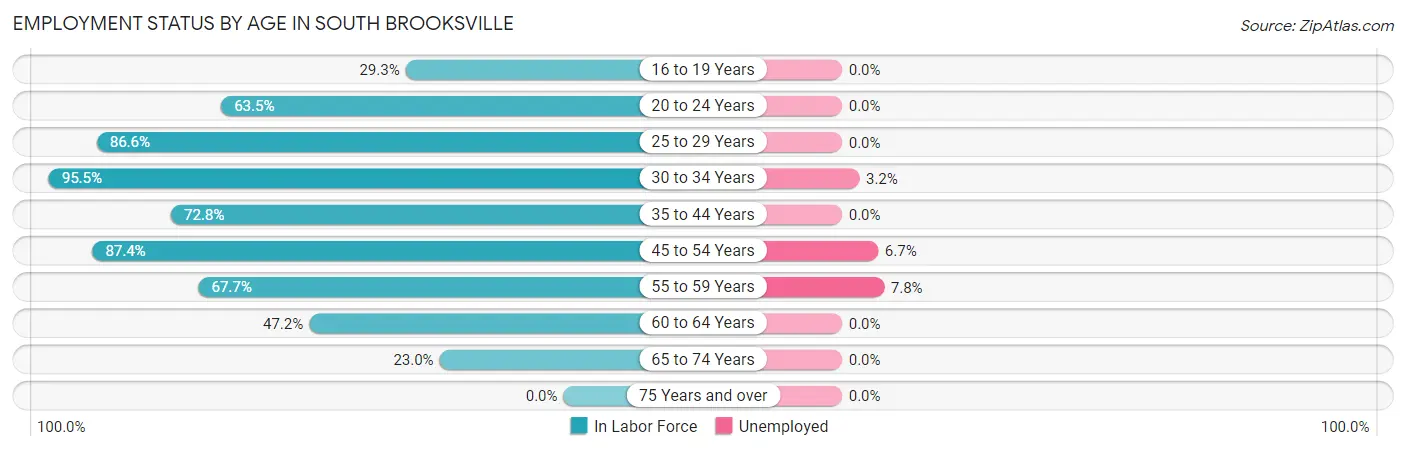
| Age Bracket | In Labor Force | Unemployed |
| 16 to 19 Years | 24 (29.3%) | 0 (0.0%) |
| 20 to 24 Years | 106 (63.5%) | 0 (0.0%) |
| 25 to 29 Years | 149 (86.6%) | 0 (0.0%) |
| 30 to 34 Years | 315 (95.5%) | 10 (3.2%) |
| 35 to 44 Years | 228 (72.8%) | 0 (0.0%) |
| 45 to 54 Years | 417 (87.4%) | 28 (6.7%) |
| 55 to 59 Years | 371 (67.7%) | 29 (7.8%) |
| 60 to 64 Years | 177 (47.2%) | 0 (0.0%) |
| 65 to 74 Years | 133 (23.0%) | 0 (0.0%) |
| 75 Years and over | 0 (0.0%) | 0 (0.0%) |
| Total | 1,920 (50.9%) | 67 (3.5%) |
Employment Status by Educational Attainment in South Brooksville
According to labor force statistics for South Brooksville, 74.8% of individuals (1,657) out of the total population between 25 and 64 years of age (2,215) are in the labor force, with 4.0% or 66 of them being unemployed. The group with the highest labor force participation rate are those with the educational attainment of bachelor's degree or higher, with 93.2% or 423 individuals in the labor force. Within the labor force, individuals with college / associate degree education have the highest percentage of unemployment, with 6.1% or 39 of them being unemployed.
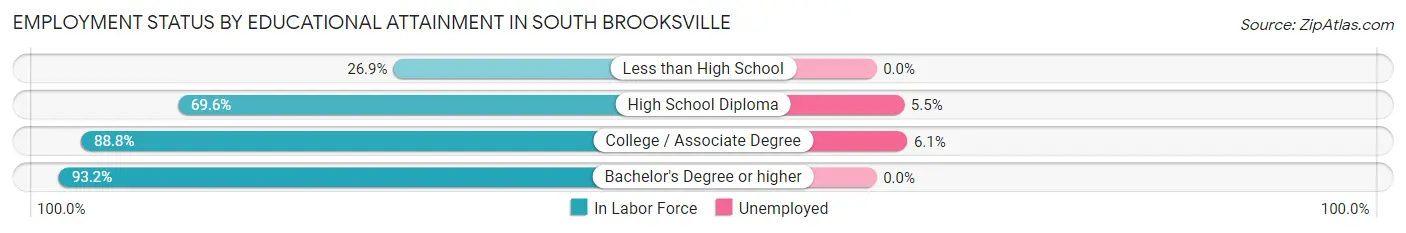
| Educational Attainment | In Labor Force | Unemployed |
| Less than High School | 82 (26.9%) | 0 (0.0%) |
| High School Diploma | 510 (69.6%) | 40 (5.5%) |
| College / Associate Degree | 642 (88.8%) | 44 (6.1%) |
| Bachelor's Degree or higher | 423 (93.2%) | 0 (0.0%) |
| Total | 1,657 (74.8%) | 89 (4.0%) |
Employment Occupations by Sex in South Brooksville
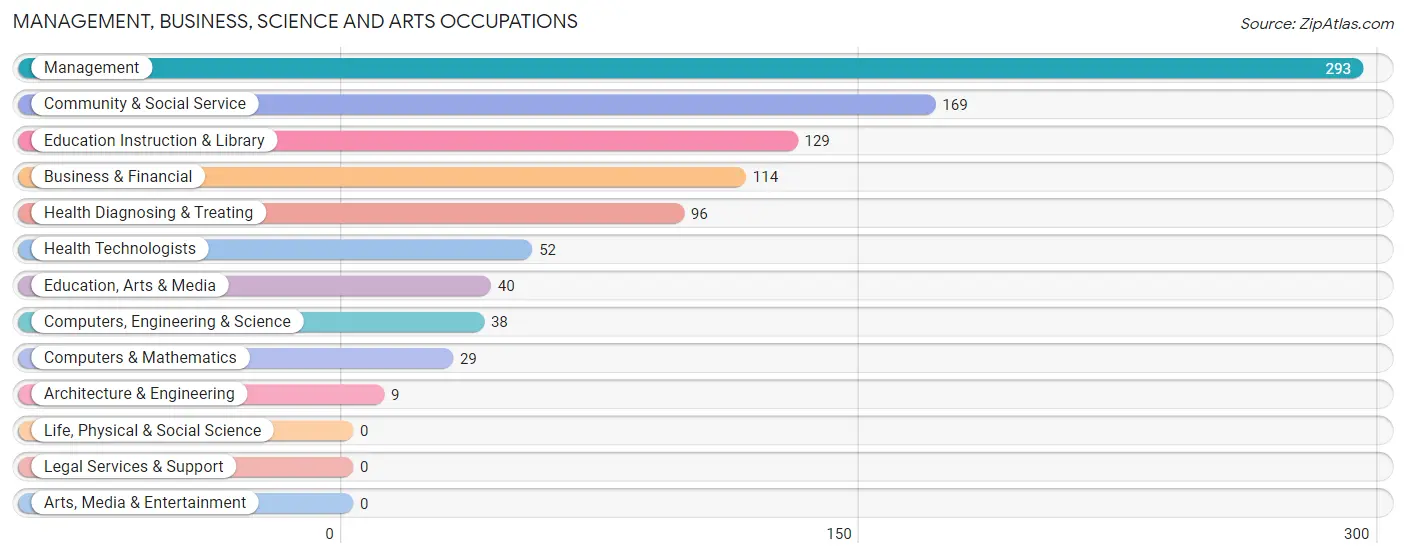
Management, Business, Science and Arts Occupations
The most common Management, Business, Science and Arts occupations in South Brooksville are Management (293 | 15.8%), Community & Social Service (169 | 9.1%), Education Instruction & Library (129 | 7.0%), Business & Financial (114 | 6.1%), and Health Diagnosing & Treating (96 | 5.2%).
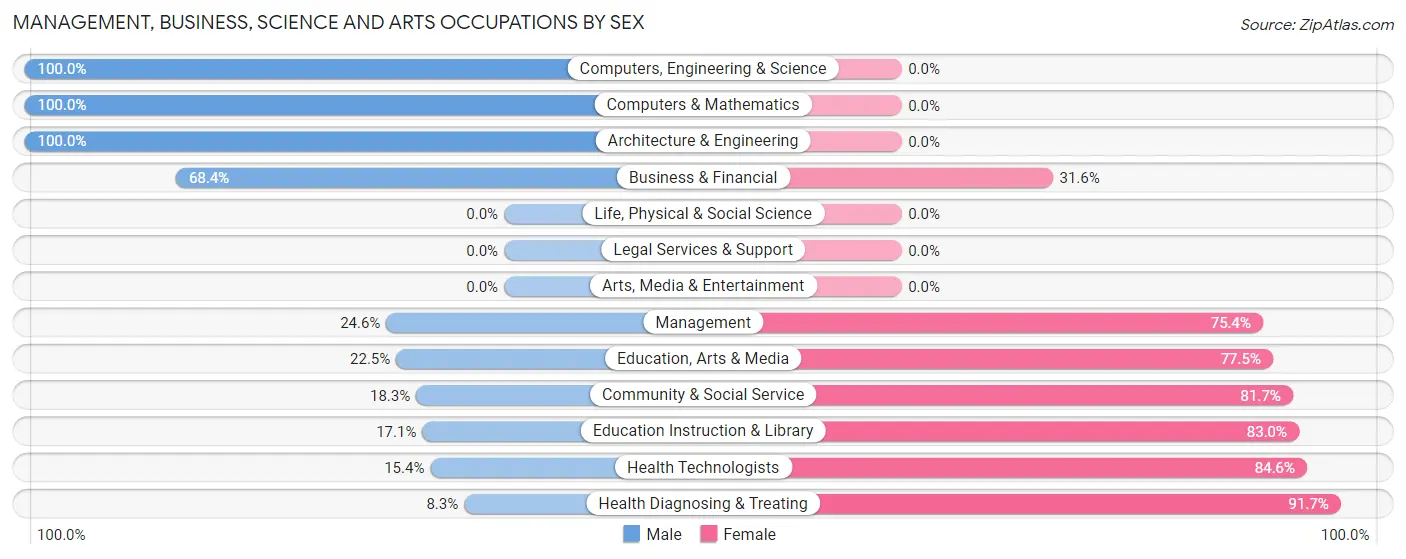
Management, Business, Science and Arts Occupations by Sex
Within the Management, Business, Science and Arts occupations in South Brooksville, the most male-oriented occupations are Computers, Engineering & Science (100.0%), Computers & Mathematics (100.0%), and Architecture & Engineering (100.0%), while the most female-oriented occupations are Health Diagnosing & Treating (91.7%), Health Technologists (84.6%), and Education Instruction & Library (83.0%).
| Occupation | Male | Female |
| Management | 72 (24.6%) | 221 (75.4%) |
| Business & Financial | 78 (68.4%) | 36 (31.6%) |
| Computers, Engineering & Science | 38 (100.0%) | 0 (0.0%) |
| Computers & Mathematics | 29 (100.0%) | 0 (0.0%) |
| Architecture & Engineering | 9 (100.0%) | 0 (0.0%) |
| Life, Physical & Social Science | 0 (0.0%) | 0 (0.0%) |
| Community & Social Service | 31 (18.3%) | 138 (81.7%) |
| Education, Arts & Media | 9 (22.5%) | 31 (77.5%) |
| Legal Services & Support | 0 (0.0%) | 0 (0.0%) |
| Education Instruction & Library | 22 (17.1%) | 107 (83.0%) |
| Arts, Media & Entertainment | 0 (0.0%) | 0 (0.0%) |
| Health Diagnosing & Treating | 8 (8.3%) | 88 (91.7%) |
| Health Technologists | 8 (15.4%) | 44 (84.6%) |
| Total (Category) | 227 (32.0%) | 483 (68.0%) |
| Total (Overall) | 840 (45.3%) | 1,013 (54.7%) |
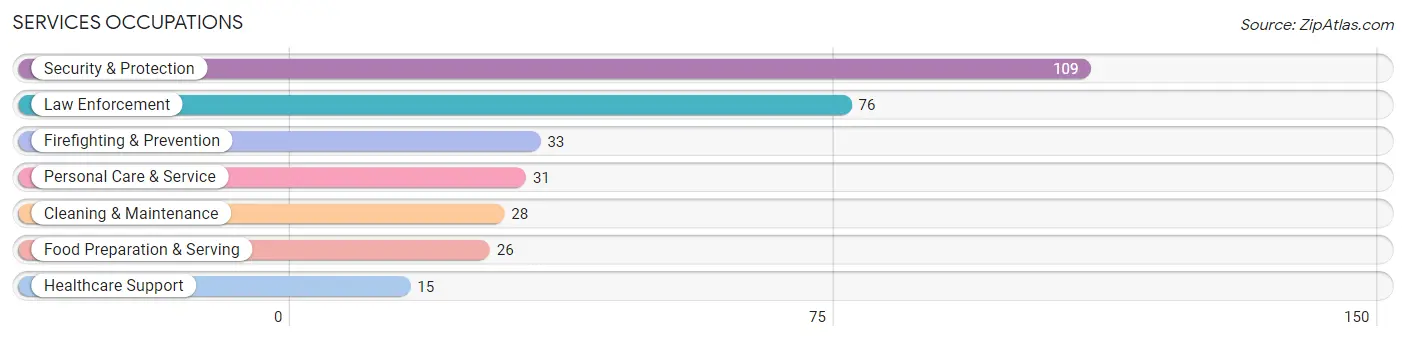
Services Occupations
The most common Services occupations in South Brooksville are Security & Protection (109 | 5.9%), Law Enforcement (76 | 4.1%), Firefighting & Prevention (33 | 1.8%), Personal Care & Service (31 | 1.7%), and Cleaning & Maintenance (28 | 1.5%).
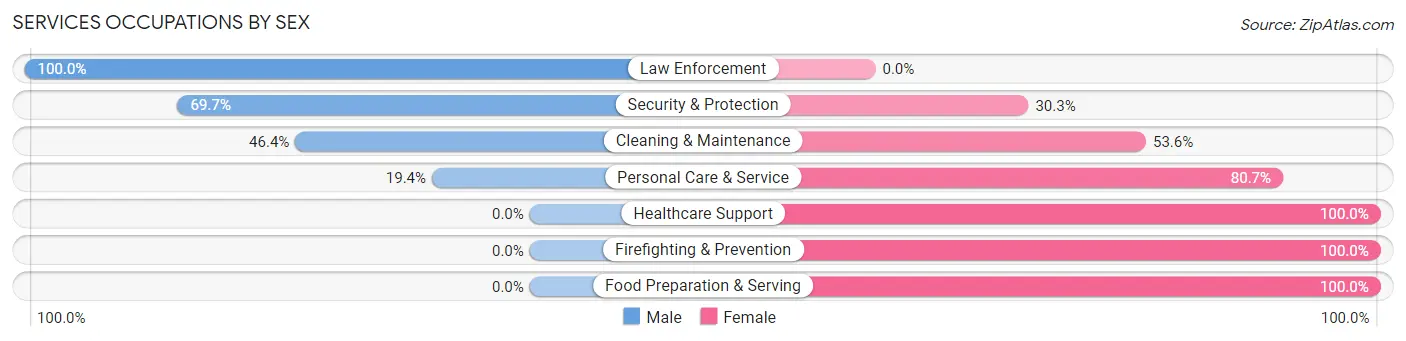
Services Occupations by Sex
Within the Services occupations in South Brooksville, the most male-oriented occupations are Law Enforcement (100.0%), Security & Protection (69.7%), and Cleaning & Maintenance (46.4%), while the most female-oriented occupations are Healthcare Support (100.0%), Firefighting & Prevention (100.0%), and Food Preparation & Serving (100.0%).
| Occupation | Male | Female |
| Healthcare Support | 0 (0.0%) | 15 (100.0%) |
| Security & Protection | 76 (69.7%) | 33 (30.3%) |
| Firefighting & Prevention | 0 (0.0%) | 33 (100.0%) |
| Law Enforcement | 76 (100.0%) | 0 (0.0%) |
| Food Preparation & Serving | 0 (0.0%) | 26 (100.0%) |
| Cleaning & Maintenance | 13 (46.4%) | 15 (53.6%) |
| Personal Care & Service | 6 (19.4%) | 25 (80.6%) |
| Total (Category) | 95 (45.5%) | 114 (54.5%) |
| Total (Overall) | 840 (45.3%) | 1,013 (54.7%) |
Sales and Office Occupations
The most common Sales and Office occupations in South Brooksville are Office & Administration (205 | 11.1%), and Sales & Related (182 | 9.8%).
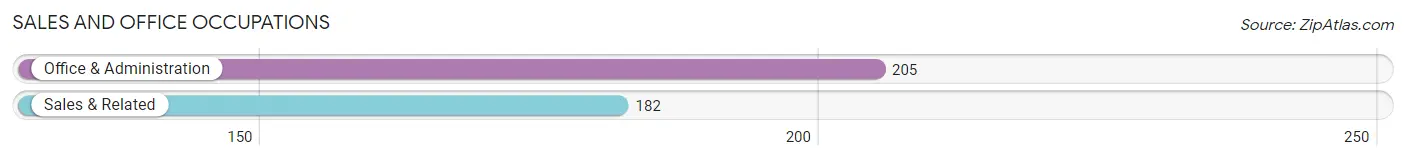
Sales and Office Occupations by Sex
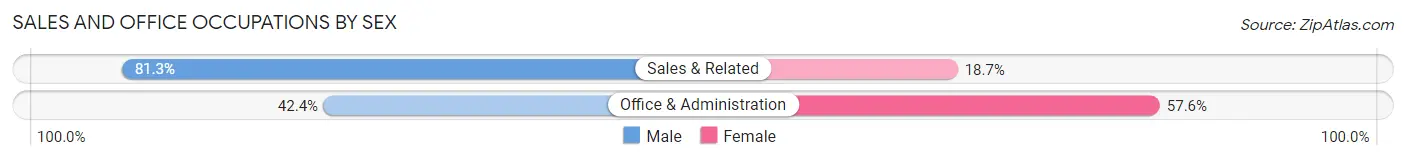
| Occupation | Male | Female |
| Sales & Related | 148 (81.3%) | 34 (18.7%) |
| Office & Administration | 87 (42.4%) | 118 (57.6%) |
| Total (Category) | 235 (60.7%) | 152 (39.3%) |
| Total (Overall) | 840 (45.3%) | 1,013 (54.7%) |
Natural Resources, Construction and Maintenance Occupations
The most common Natural Resources, Construction and Maintenance occupations in South Brooksville are , and Construction & Extraction (184 | 9.9%).
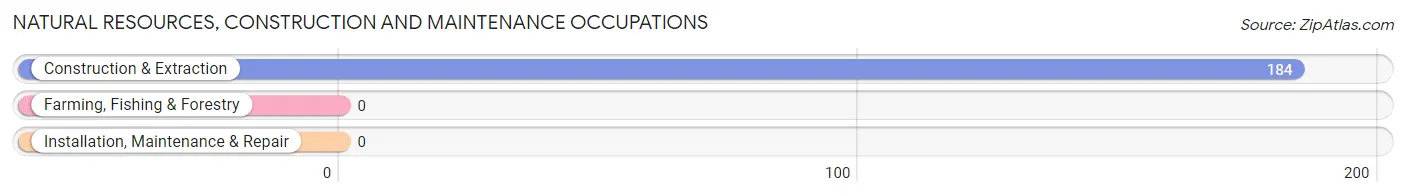
Natural Resources, Construction and Maintenance Occupations by Sex
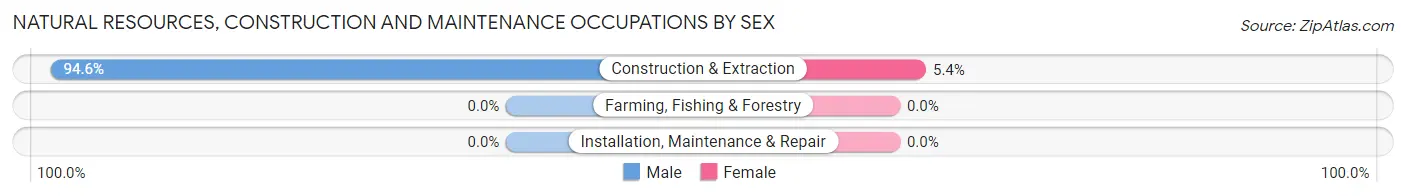
| Occupation | Male | Female |
| Farming, Fishing & Forestry | 0 (0.0%) | 0 (0.0%) |
| Construction & Extraction | 174 (94.6%) | 10 (5.4%) |
| Installation, Maintenance & Repair | 0 (0.0%) | 0 (0.0%) |
| Total (Category) | 174 (94.6%) | 10 (5.4%) |
| Total (Overall) | 840 (45.3%) | 1,013 (54.7%) |
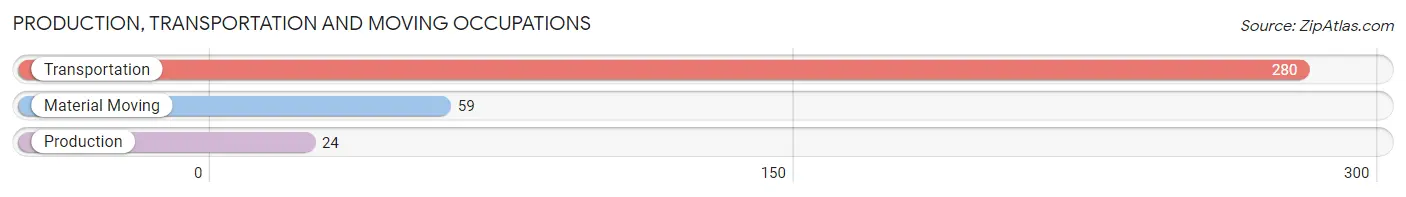
Production, Transportation and Moving Occupations
The most common Production, Transportation and Moving occupations in South Brooksville are Transportation (280 | 15.1%), Material Moving (59 | 3.2%), and Production (24 | 1.3%).
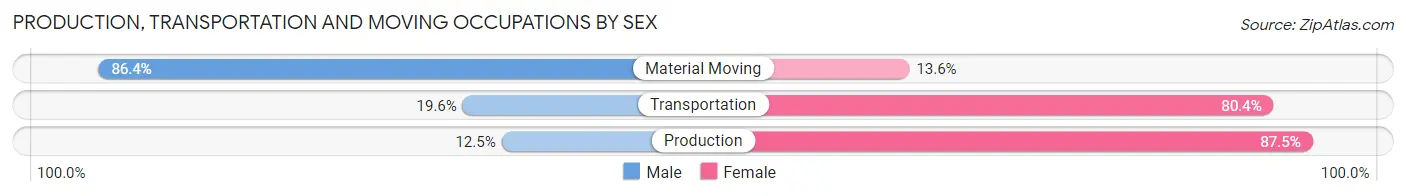
Production, Transportation and Moving Occupations by Sex
| Occupation | Male | Female |
| Production | 3 (12.5%) | 21 (87.5%) |
| Transportation | 55 (19.6%) | 225 (80.4%) |
| Material Moving | 51 (86.4%) | 8 (13.6%) |
| Total (Category) | 109 (30.0%) | 254 (70.0%) |
| Total (Overall) | 840 (45.3%) | 1,013 (54.7%) |
Employment Industries by Sex in South Brooksville
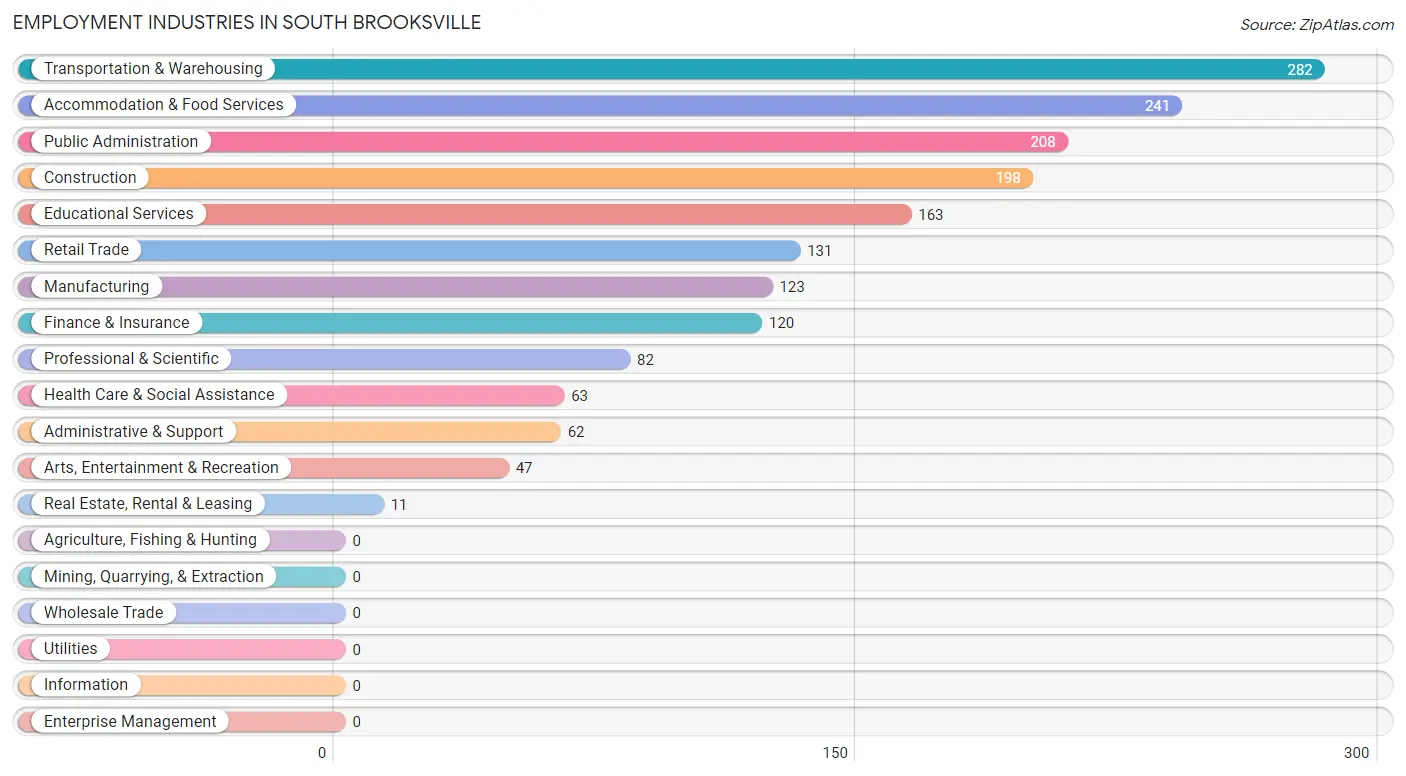
Employment Industries in South Brooksville
The major employment industries in South Brooksville include Transportation & Warehousing (282 | 15.2%), Accommodation & Food Services (241 | 13.0%), Public Administration (208 | 11.2%), Construction (198 | 10.7%), and Educational Services (163 | 8.8%).
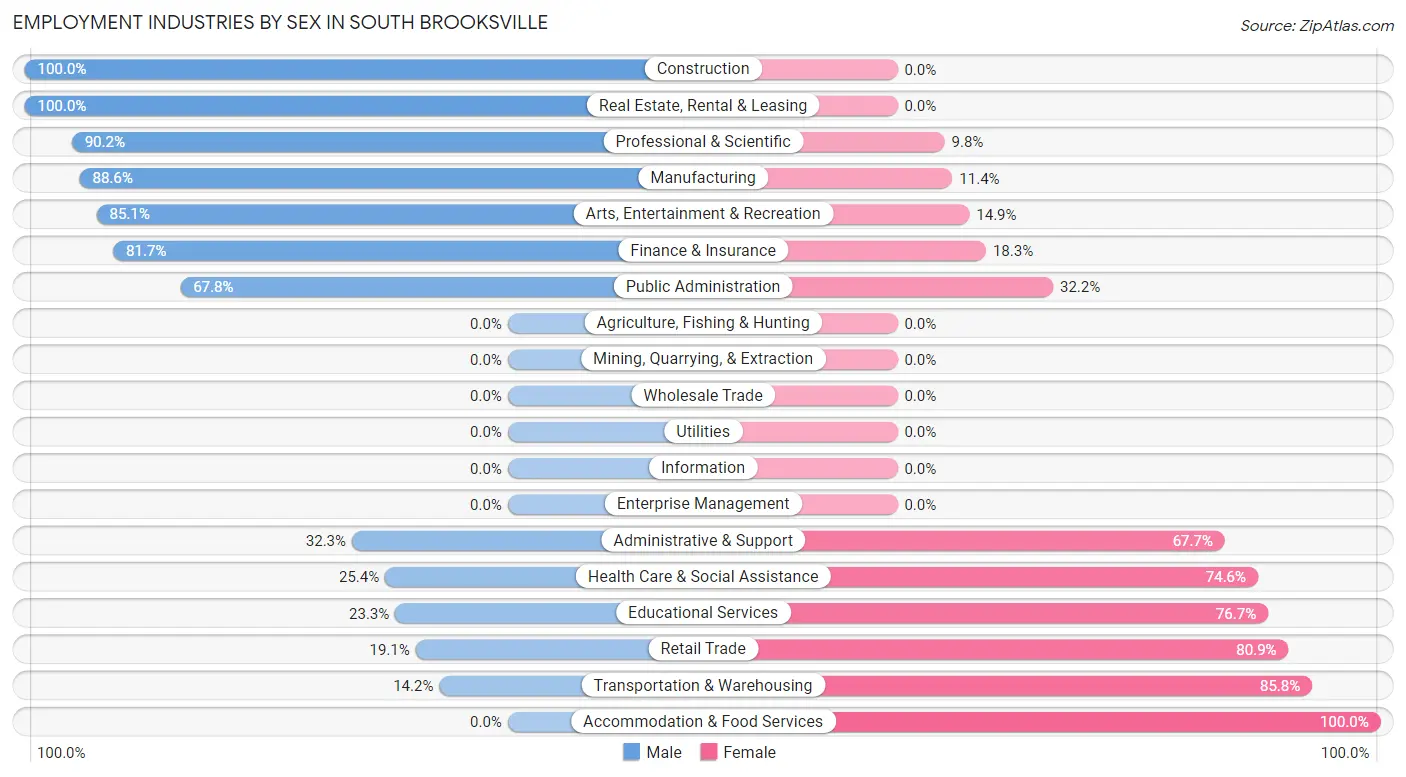
Employment Industries by Sex in South Brooksville
The South Brooksville industries that see more men than women are Construction (100.0%), Real Estate, Rental & Leasing (100.0%), and Professional & Scientific (90.2%), whereas the industries that tend to have a higher number of women are Accommodation & Food Services (100.0%), Transportation & Warehousing (85.8%), and Retail Trade (80.9%).
| Industry | Male | Female |
| Agriculture, Fishing & Hunting | 0 (0.0%) | 0 (0.0%) |
| Mining, Quarrying, & Extraction | 0 (0.0%) | 0 (0.0%) |
| Construction | 198 (100.0%) | 0 (0.0%) |
| Manufacturing | 109 (88.6%) | 14 (11.4%) |
| Wholesale Trade | 0 (0.0%) | 0 (0.0%) |
| Retail Trade | 25 (19.1%) | 106 (80.9%) |
| Transportation & Warehousing | 40 (14.2%) | 242 (85.8%) |
| Utilities | 0 (0.0%) | 0 (0.0%) |
| Information | 0 (0.0%) | 0 (0.0%) |
| Finance & Insurance | 98 (81.7%) | 22 (18.3%) |
| Real Estate, Rental & Leasing | 11 (100.0%) | 0 (0.0%) |
| Professional & Scientific | 74 (90.2%) | 8 (9.8%) |
| Enterprise Management | 0 (0.0%) | 0 (0.0%) |
| Administrative & Support | 20 (32.3%) | 42 (67.7%) |
| Educational Services | 38 (23.3%) | 125 (76.7%) |
| Health Care & Social Assistance | 16 (25.4%) | 47 (74.6%) |
| Arts, Entertainment & Recreation | 40 (85.1%) | 7 (14.9%) |
| Accommodation & Food Services | 0 (0.0%) | 241 (100.0%) |
| Public Administration | 141 (67.8%) | 67 (32.2%) |
| Total | 840 (45.3%) | 1,013 (54.7%) |
Education in South Brooksville
School Enrollment in South Brooksville
The most common levels of schooling among the 876 students in South Brooksville are high school (396 | 45.2%), elementary school (253 | 28.9%), and middle school (136 | 15.5%).
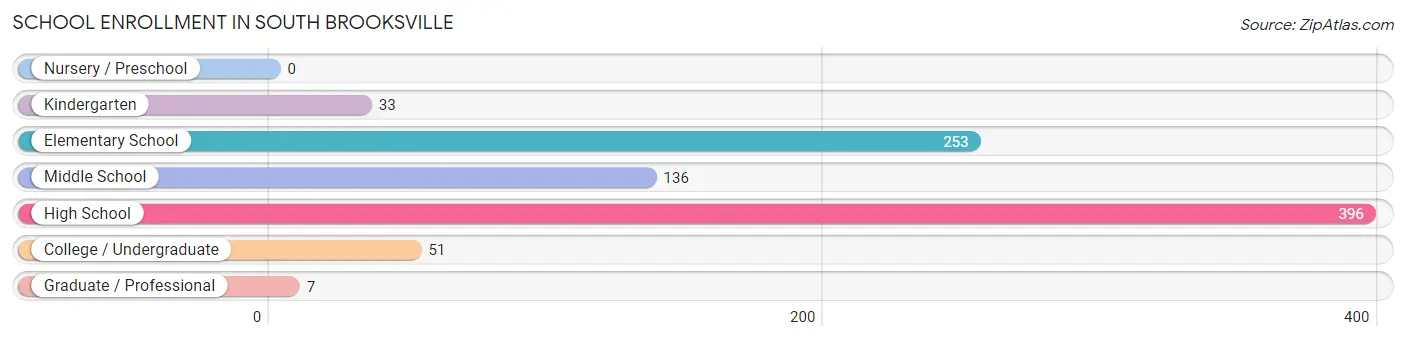
| School Level | # Students | % Students |
| Nursery / Preschool | 0 | 0.0% |
| Kindergarten | 33 | 3.8% |
| Elementary School | 253 | 28.9% |
| Middle School | 136 | 15.5% |
| High School | 396 | 45.2% |
| College / Undergraduate | 51 | 5.8% |
| Graduate / Professional | 7 | 0.8% |
| Total | 876 | 100.0% |
School Enrollment by Age by Funding Source in South Brooksville
Out of a total of 876 students who are enrolled in schools in South Brooksville, 86 (9.8%) attend a private institution, while the remaining 790 (90.2%) are enrolled in public schools. The age group of 35 years and over has the highest likelihood of being enrolled in private schools, with 7 (100.0% in the age bracket) enrolled. Conversely, the age group of 15 to 17 year olds has the lowest likelihood of being enrolled in a private school, with 193 (100.0% in the age bracket) attending a public institution.
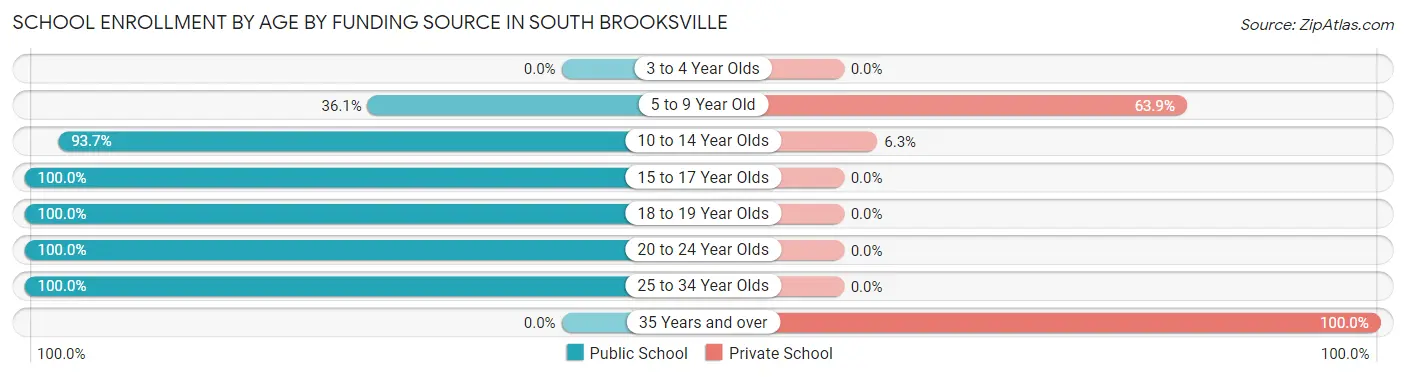
| Age Bracket | Public School | Private School |
| 3 to 4 Year Olds | 0 (0.0%) | 0 (0.0%) |
| 5 to 9 Year Old | 26 (36.1%) | 46 (63.9%) |
| 10 to 14 Year Olds | 493 (93.7%) | 33 (6.3%) |
| 15 to 17 Year Olds | 193 (100.0%) | 0 (0.0%) |
| 18 to 19 Year Olds | 12 (100.0%) | 0 (0.0%) |
| 20 to 24 Year Olds | 57 (100.0%) | 0 (0.0%) |
| 25 to 34 Year Olds | 9 (100.0%) | 0 (0.0%) |
| 35 Years and over | 0 (0.0%) | 7 (100.0%) |
| Total | 790 (90.2%) | 86 (9.8%) |
Educational Attainment by Field of Study in South Brooksville
Education (213 | 24.8%), arts & humanities (152 | 17.7%), business (88 | 10.2%), liberal arts & history (85 | 9.9%), and computers & mathematics (65 | 7.6%) are the most common fields of study among 859 individuals in South Brooksville who have obtained a bachelor's degree or higher.
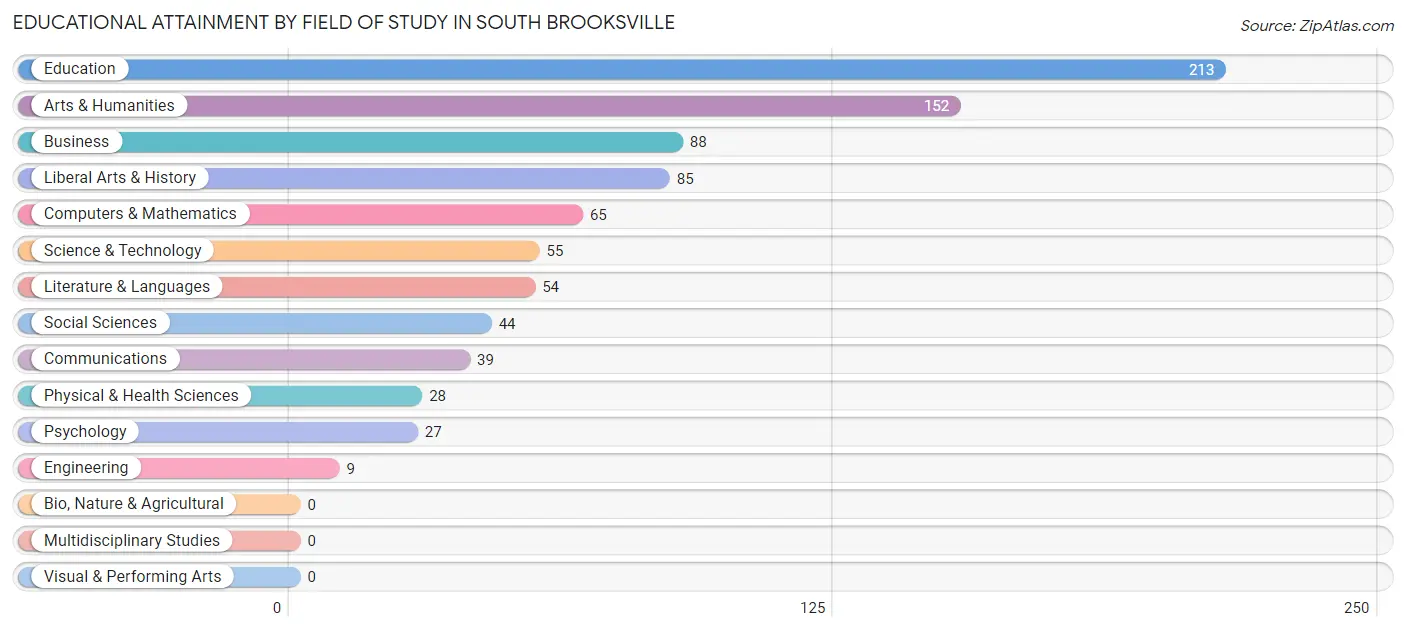
| Field of Study | # Graduates | % Graduates |
| Computers & Mathematics | 65 | 7.6% |
| Bio, Nature & Agricultural | 0 | 0.0% |
| Physical & Health Sciences | 28 | 3.3% |
| Psychology | 27 | 3.1% |
| Social Sciences | 44 | 5.1% |
| Engineering | 9 | 1.1% |
| Multidisciplinary Studies | 0 | 0.0% |
| Science & Technology | 55 | 6.4% |
| Business | 88 | 10.2% |
| Education | 213 | 24.8% |
| Literature & Languages | 54 | 6.3% |
| Liberal Arts & History | 85 | 9.9% |
| Visual & Performing Arts | 0 | 0.0% |
| Communications | 39 | 4.5% |
| Arts & Humanities | 152 | 17.7% |
| Total | 859 | 100.0% |
Transportation & Commute in South Brooksville
Vehicle Availability by Sex in South Brooksville
The most prevalent vehicle ownership categories in South Brooksville are males with 2 vehicles (369, accounting for 44.5%) and females with 2 vehicles (236, making up 36.6%).
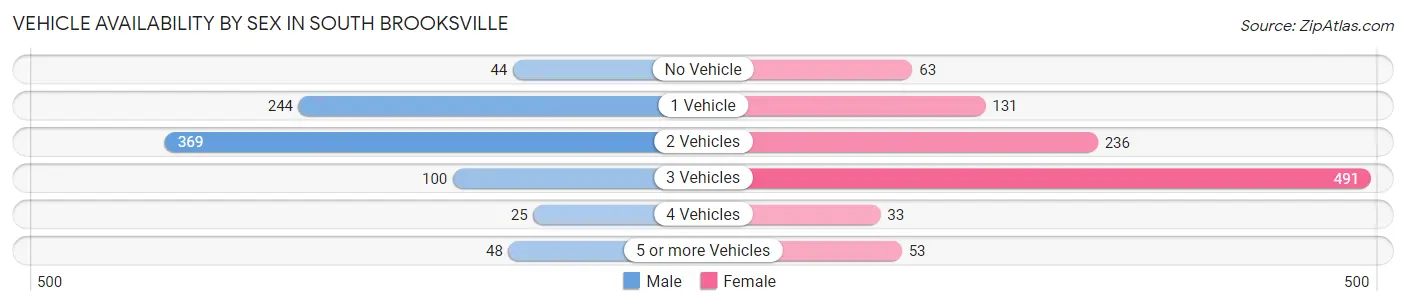
| Vehicles Available | Male | Female |
| No Vehicle | 44 (5.3%) | 63 (6.3%) |
| 1 Vehicle | 244 (29.4%) | 131 (13.0%) |
| 2 Vehicles | 369 (44.5%) | 236 (23.4%) |
| 3 Vehicles | 100 (12.0%) | 491 (48.8%) |
| 4 Vehicles | 25 (3.0%) | 33 (3.3%) |
| 5 or more Vehicles | 48 (5.8%) | 53 (5.3%) |
| Total | 830 (100.0%) | 1,007 (100.0%) |
Commute Time in South Brooksville
The most frequently occuring commute durations in South Brooksville are 10 to 14 minutes (376 commuters, 21.8%), 5 to 9 minutes (355 commuters, 20.6%), and 60 to 89 minutes (237 commuters, 13.7%).
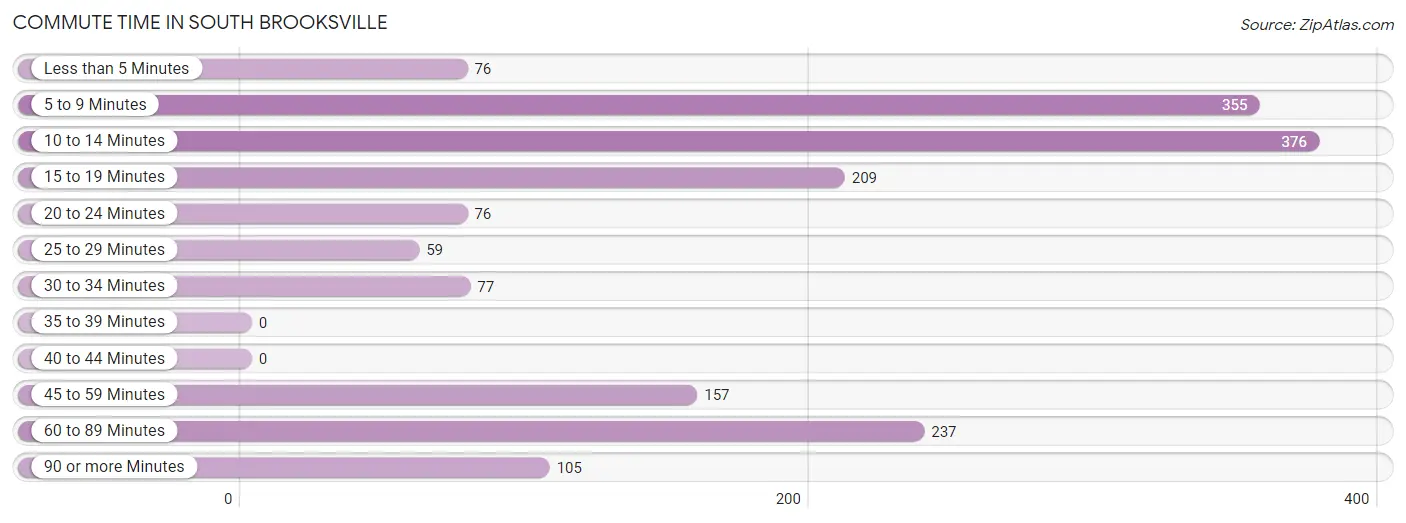
| Commute Time | # Commuters | % Commuters |
| Less than 5 Minutes | 76 | 4.4% |
| 5 to 9 Minutes | 355 | 20.6% |
| 10 to 14 Minutes | 376 | 21.8% |
| 15 to 19 Minutes | 209 | 12.1% |
| 20 to 24 Minutes | 76 | 4.4% |
| 25 to 29 Minutes | 59 | 3.4% |
| 30 to 34 Minutes | 77 | 4.5% |
| 35 to 39 Minutes | 0 | 0.0% |
| 40 to 44 Minutes | 0 | 0.0% |
| 45 to 59 Minutes | 157 | 9.1% |
| 60 to 89 Minutes | 237 | 13.7% |
| 90 or more Minutes | 105 | 6.1% |
Commute Time by Sex in South Brooksville
The most common commute times in South Brooksville are 60 to 89 minutes (209 commuters, 27.0%) for males and 5 to 9 minutes (289 commuters, 30.4%) for females.
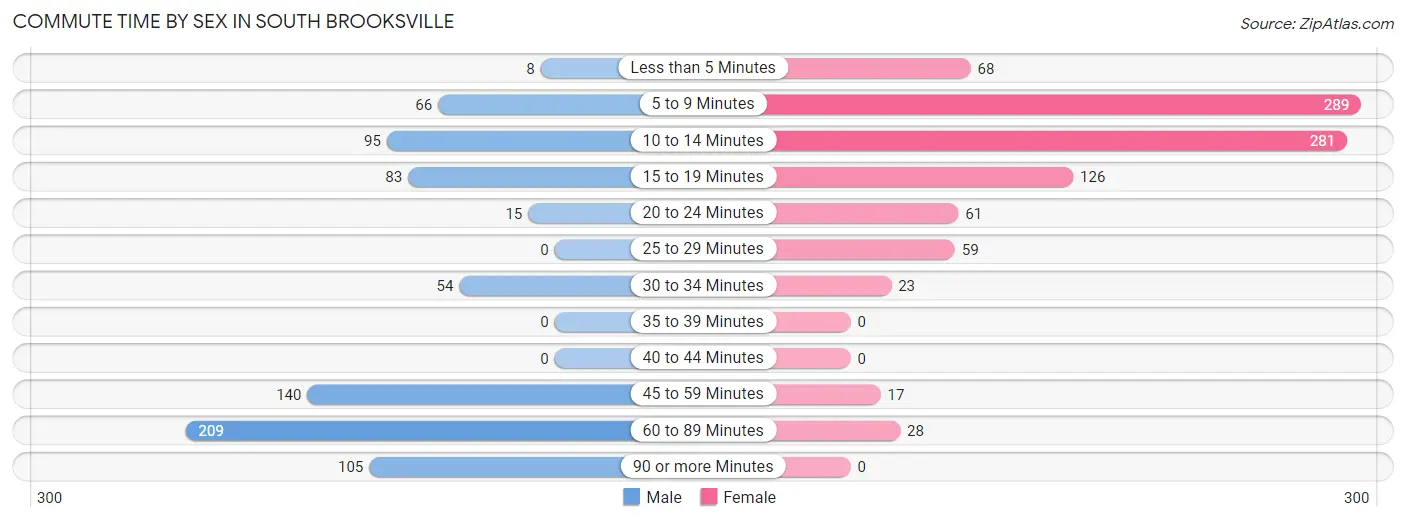
| Commute Time | Male | Female |
| Less than 5 Minutes | 8 (1.0%) | 68 (7.1%) |
| 5 to 9 Minutes | 66 (8.5%) | 289 (30.4%) |
| 10 to 14 Minutes | 95 (12.3%) | 281 (29.5%) |
| 15 to 19 Minutes | 83 (10.7%) | 126 (13.2%) |
| 20 to 24 Minutes | 15 (1.9%) | 61 (6.4%) |
| 25 to 29 Minutes | 0 (0.0%) | 59 (6.2%) |
| 30 to 34 Minutes | 54 (7.0%) | 23 (2.4%) |
| 35 to 39 Minutes | 0 (0.0%) | 0 (0.0%) |
| 40 to 44 Minutes | 0 (0.0%) | 0 (0.0%) |
| 45 to 59 Minutes | 140 (18.1%) | 17 (1.8%) |
| 60 to 89 Minutes | 209 (27.0%) | 28 (2.9%) |
| 90 or more Minutes | 105 (13.6%) | 0 (0.0%) |
Time of Departure to Work by Sex in South Brooksville
The most frequent times of departure to work in South Brooksville are 5:00 AM to 5:29 AM (130, 16.8%) for males and 10:00 AM to 10:59 AM (225, 23.6%) for females.
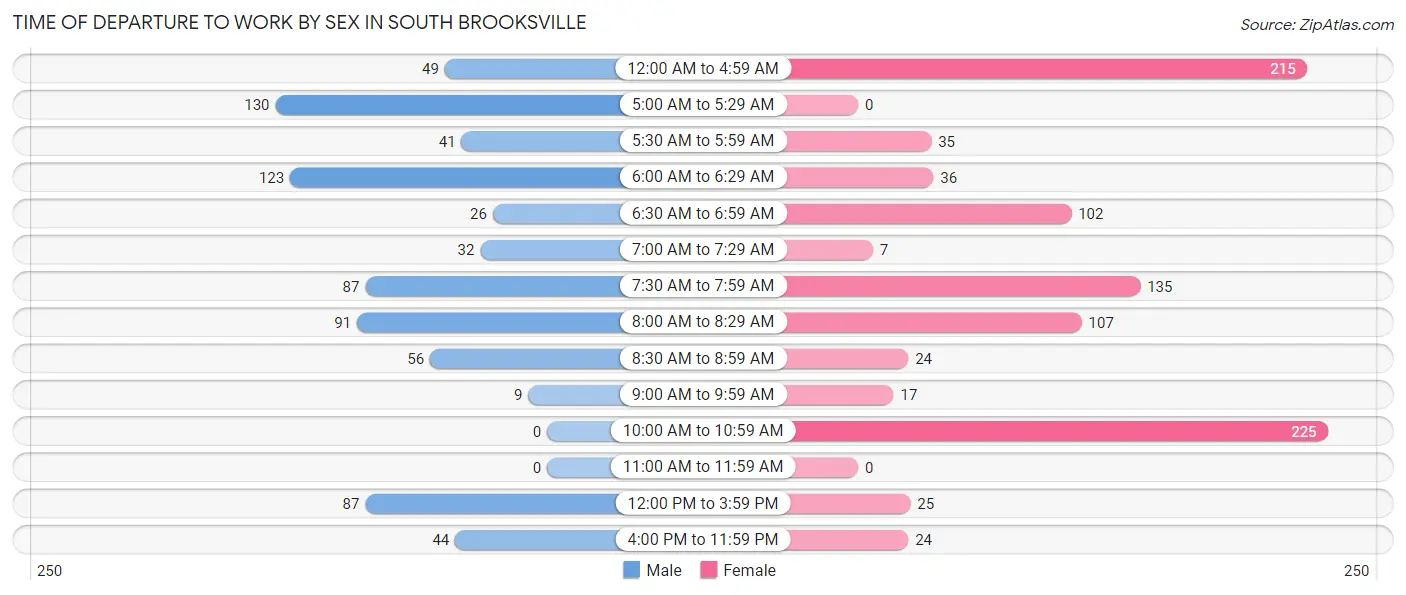
| Time of Departure | Male | Female |
| 12:00 AM to 4:59 AM | 49 (6.3%) | 215 (22.6%) |
| 5:00 AM to 5:29 AM | 130 (16.8%) | 0 (0.0%) |
| 5:30 AM to 5:59 AM | 41 (5.3%) | 35 (3.7%) |
| 6:00 AM to 6:29 AM | 123 (15.9%) | 36 (3.8%) |
| 6:30 AM to 6:59 AM | 26 (3.4%) | 102 (10.7%) |
| 7:00 AM to 7:29 AM | 32 (4.1%) | 7 (0.7%) |
| 7:30 AM to 7:59 AM | 87 (11.2%) | 135 (14.2%) |
| 8:00 AM to 8:29 AM | 91 (11.7%) | 107 (11.2%) |
| 8:30 AM to 8:59 AM | 56 (7.2%) | 24 (2.5%) |
| 9:00 AM to 9:59 AM | 9 (1.2%) | 17 (1.8%) |
| 10:00 AM to 10:59 AM | 0 (0.0%) | 225 (23.6%) |
| 11:00 AM to 11:59 AM | 0 (0.0%) | 0 (0.0%) |
| 12:00 PM to 3:59 PM | 87 (11.2%) | 25 (2.6%) |
| 4:00 PM to 11:59 PM | 44 (5.7%) | 24 (2.5%) |
| Total | 775 (100.0%) | 952 (100.0%) |
Housing Occupancy in South Brooksville
Occupancy by Ownership in South Brooksville
Of the total 1,981 dwellings in South Brooksville, owner-occupied units account for 1,318 (66.5%), while renter-occupied units make up 663 (33.5%).
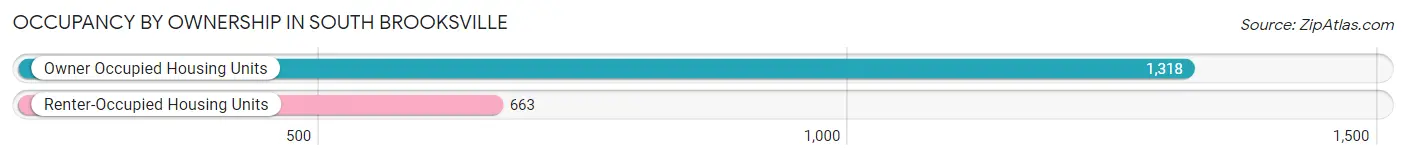
| Occupancy | # Housing Units | % Housing Units |
| Owner Occupied Housing Units | 1,318 | 66.5% |
| Renter-Occupied Housing Units | 663 | 33.5% |
| Total Occupied Housing Units | 1,981 | 100.0% |
Occupancy by Household Size in South Brooksville
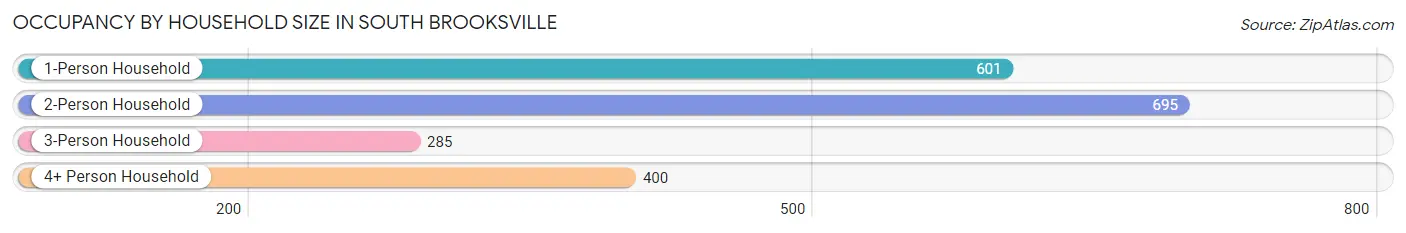
| Household Size | # Housing Units | % Housing Units |
| 1-Person Household | 601 | 30.3% |
| 2-Person Household | 695 | 35.1% |
| 3-Person Household | 285 | 14.4% |
| 4+ Person Household | 400 | 20.2% |
| Total Housing Units | 1,981 | 100.0% |
Occupancy by Ownership by Household Size in South Brooksville
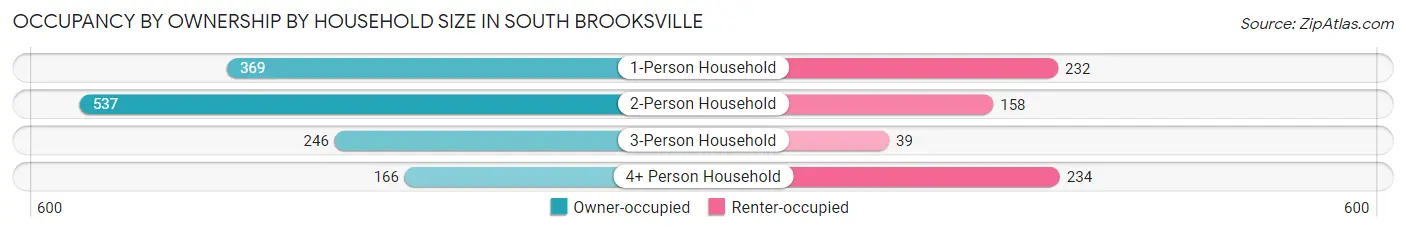
| Household Size | Owner-occupied | Renter-occupied |
| 1-Person Household | 369 (61.4%) | 232 (38.6%) |
| 2-Person Household | 537 (77.3%) | 158 (22.7%) |
| 3-Person Household | 246 (86.3%) | 39 (13.7%) |
| 4+ Person Household | 166 (41.5%) | 234 (58.5%) |
| Total Housing Units | 1,318 (66.5%) | 663 (33.5%) |
Occupancy by Educational Attainment in South Brooksville
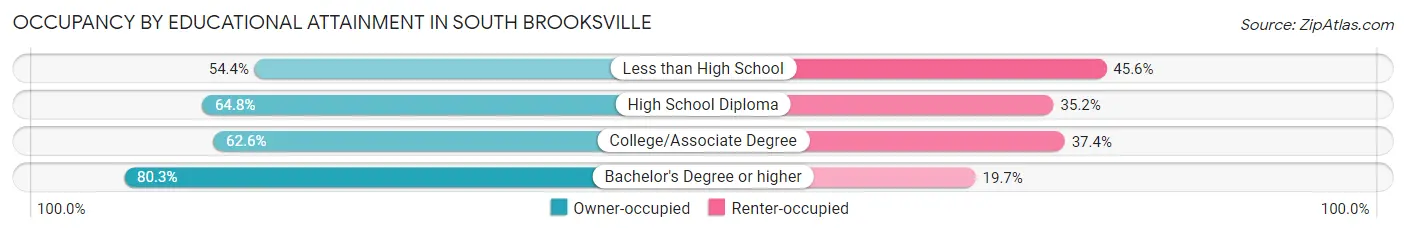
| Household Size | Owner-occupied | Renter-occupied |
| Less than High School | 131 (54.4%) | 110 (45.6%) |
| High School Diploma | 234 (64.8%) | 127 (35.2%) |
| College/Associate Degree | 546 (62.6%) | 326 (37.4%) |
| Bachelor's Degree or higher | 407 (80.3%) | 100 (19.7%) |
Occupancy by Age of Householder in South Brooksville
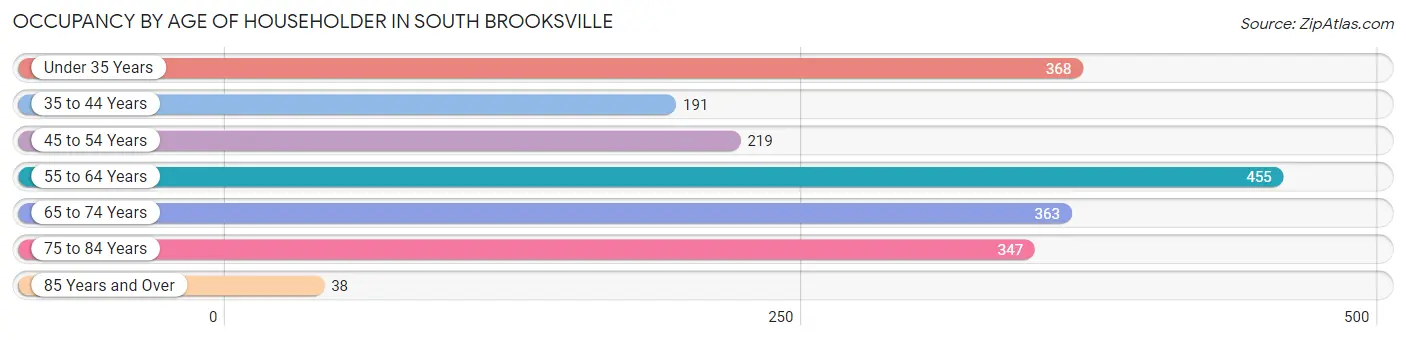
| Age Bracket | # Households | % Households |
| Under 35 Years | 368 | 18.6% |
| 35 to 44 Years | 191 | 9.6% |
| 45 to 54 Years | 219 | 11.1% |
| 55 to 64 Years | 455 | 23.0% |
| 65 to 74 Years | 363 | 18.3% |
| 75 to 84 Years | 347 | 17.5% |
| 85 Years and Over | 38 | 1.9% |
| Total | 1,981 | 100.0% |
Housing Finances in South Brooksville
Median Income by Occupancy in South Brooksville
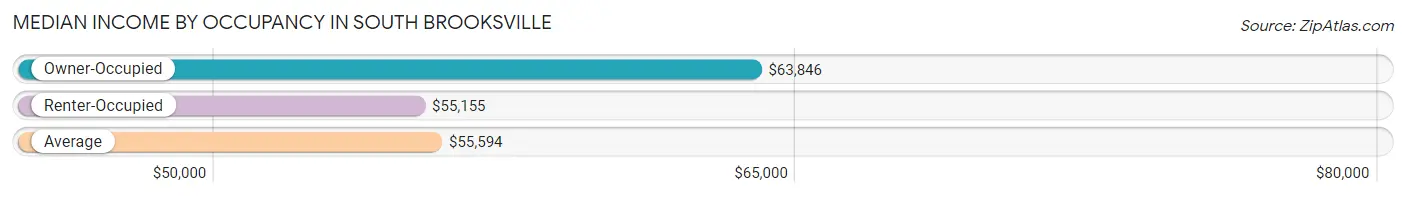
| Occupancy Type | # Households | Median Income |
| Owner-Occupied | 1,318 (66.5%) | $63,846 |
| Renter-Occupied | 663 (33.5%) | $55,155 |
| Average | 1,981 (100.0%) | $55,594 |
Occupancy by Householder Income Bracket in South Brooksville
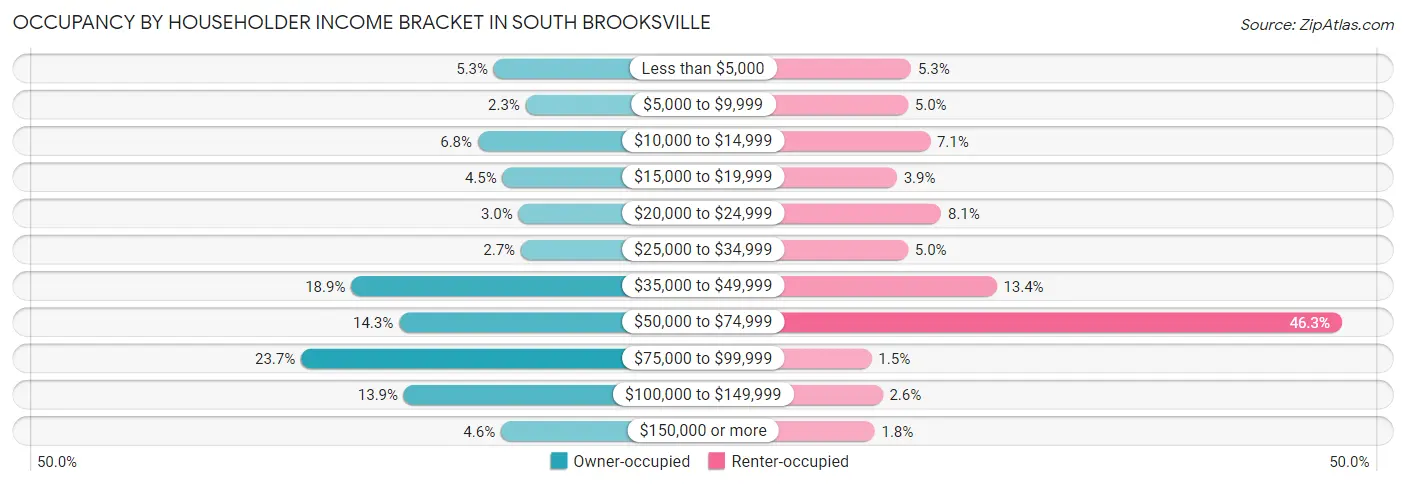
| Income Bracket | Owner-occupied | Renter-occupied |
| Less than $5,000 | 70 (5.3%) | 35 (5.3%) |
| $5,000 to $9,999 | 30 (2.3%) | 33 (5.0%) |
| $10,000 to $14,999 | 90 (6.8%) | 47 (7.1%) |
| $15,000 to $19,999 | 59 (4.5%) | 26 (3.9%) |
| $20,000 to $24,999 | 39 (3.0%) | 54 (8.1%) |
| $25,000 to $34,999 | 36 (2.7%) | 33 (5.0%) |
| $35,000 to $49,999 | 249 (18.9%) | 89 (13.4%) |
| $50,000 to $74,999 | 189 (14.3%) | 307 (46.3%) |
| $75,000 to $99,999 | 312 (23.7%) | 10 (1.5%) |
| $100,000 to $149,999 | 183 (13.9%) | 17 (2.6%) |
| $150,000 or more | 61 (4.6%) | 12 (1.8%) |
| Total | 1,318 (100.0%) | 663 (100.0%) |
Monthly Housing Cost Tiers in South Brooksville
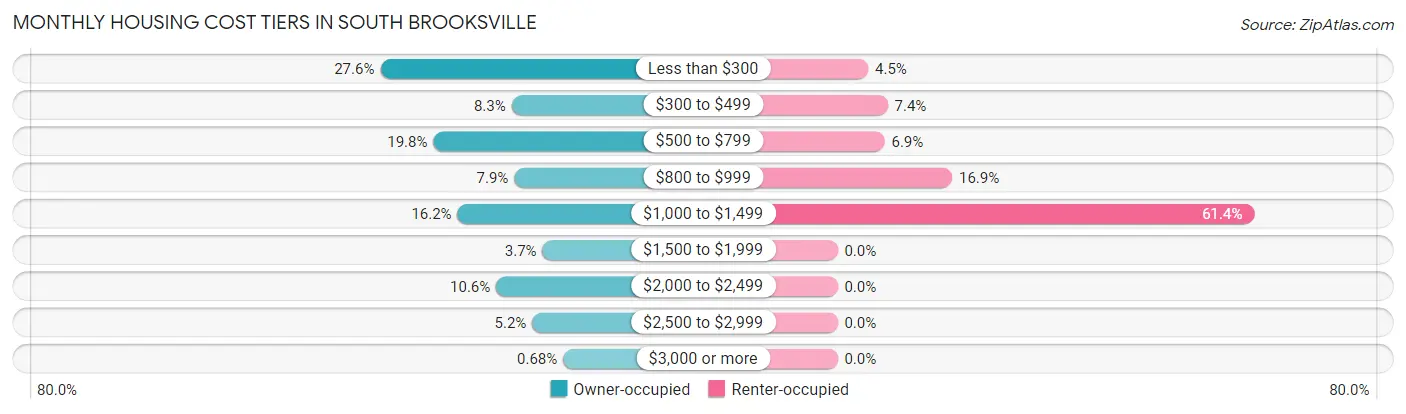
| Monthly Cost | Owner-occupied | Renter-occupied |
| Less than $300 | 364 (27.6%) | 30 (4.5%) |
| $300 to $499 | 109 (8.3%) | 49 (7.4%) |
| $500 to $799 | 261 (19.8%) | 46 (6.9%) |
| $800 to $999 | 104 (7.9%) | 112 (16.9%) |
| $1,000 to $1,499 | 214 (16.2%) | 407 (61.4%) |
| $1,500 to $1,999 | 49 (3.7%) | 0 (0.0%) |
| $2,000 to $2,499 | 139 (10.5%) | 0 (0.0%) |
| $2,500 to $2,999 | 69 (5.2%) | 0 (0.0%) |
| $3,000 or more | 9 (0.7%) | 0 (0.0%) |
| Total | 1,318 (100.0%) | 663 (100.0%) |
Physical Housing Characteristics in South Brooksville
Housing Structures in South Brooksville
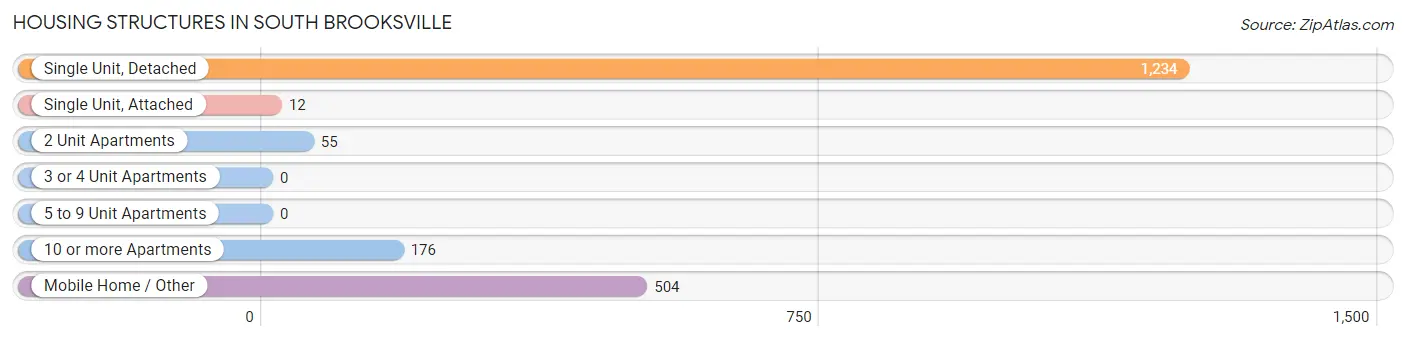
| Structure Type | # Housing Units | % Housing Units |
| Single Unit, Detached | 1,234 | 62.3% |
| Single Unit, Attached | 12 | 0.6% |
| 2 Unit Apartments | 55 | 2.8% |
| 3 or 4 Unit Apartments | 0 | 0.0% |
| 5 to 9 Unit Apartments | 0 | 0.0% |
| 10 or more Apartments | 176 | 8.9% |
| Mobile Home / Other | 504 | 25.4% |
| Total | 1,981 | 100.0% |
Housing Structures by Occupancy in South Brooksville
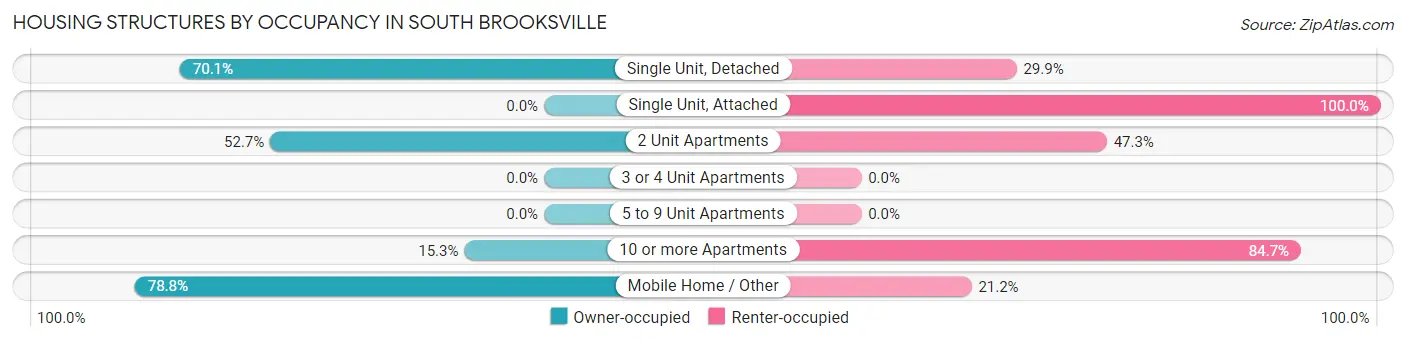
| Structure Type | Owner-occupied | Renter-occupied |
| Single Unit, Detached | 865 (70.1%) | 369 (29.9%) |
| Single Unit, Attached | 0 (0.0%) | 12 (100.0%) |
| 2 Unit Apartments | 29 (52.7%) | 26 (47.3%) |
| 3 or 4 Unit Apartments | 0 (0.0%) | 0 (0.0%) |
| 5 to 9 Unit Apartments | 0 (0.0%) | 0 (0.0%) |
| 10 or more Apartments | 27 (15.3%) | 149 (84.7%) |
| Mobile Home / Other | 397 (78.8%) | 107 (21.2%) |
| Total | 1,318 (66.5%) | 663 (33.5%) |
Housing Structures by Number of Rooms in South Brooksville
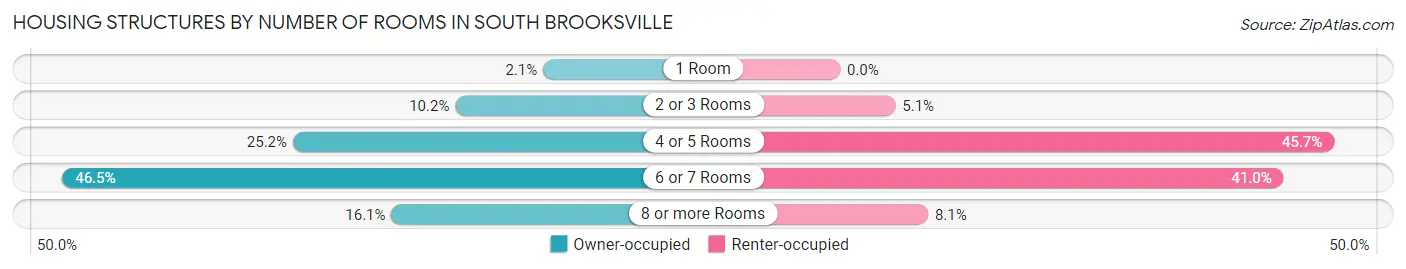
| Number of Rooms | Owner-occupied | Renter-occupied |
| 1 Room | 27 (2.1%) | 0 (0.0%) |
| 2 or 3 Rooms | 134 (10.2%) | 34 (5.1%) |
| 4 or 5 Rooms | 332 (25.2%) | 303 (45.7%) |
| 6 or 7 Rooms | 613 (46.5%) | 272 (41.0%) |
| 8 or more Rooms | 212 (16.1%) | 54 (8.1%) |
| Total | 1,318 (100.0%) | 663 (100.0%) |
Housing Structure by Heating Type in South Brooksville
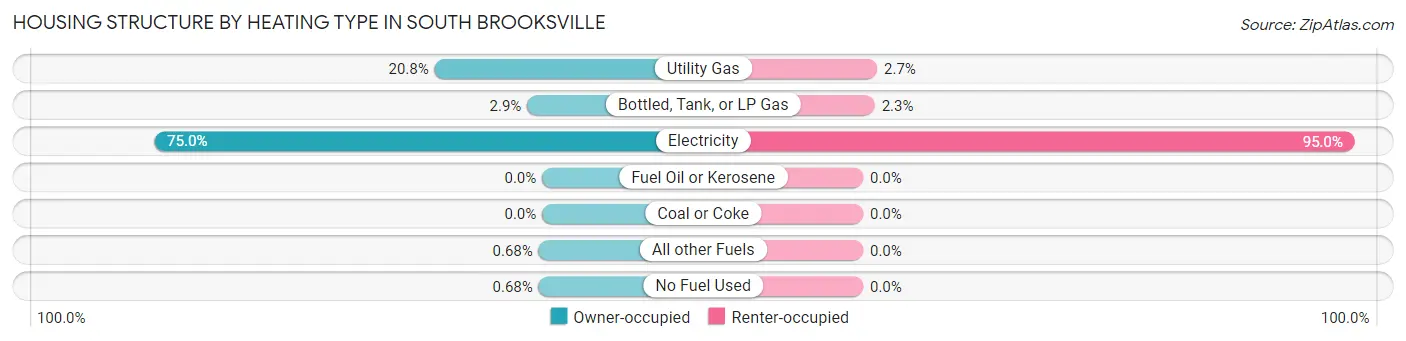
| Heating Type | Owner-occupied | Renter-occupied |
| Utility Gas | 274 (20.8%) | 18 (2.7%) |
| Bottled, Tank, or LP Gas | 38 (2.9%) | 15 (2.3%) |
| Electricity | 988 (75.0%) | 630 (95.0%) |
| Fuel Oil or Kerosene | 0 (0.0%) | 0 (0.0%) |
| Coal or Coke | 0 (0.0%) | 0 (0.0%) |
| All other Fuels | 9 (0.7%) | 0 (0.0%) |
| No Fuel Used | 9 (0.7%) | 0 (0.0%) |
| Total | 1,318 (100.0%) | 663 (100.0%) |
Household Vehicle Usage in South Brooksville
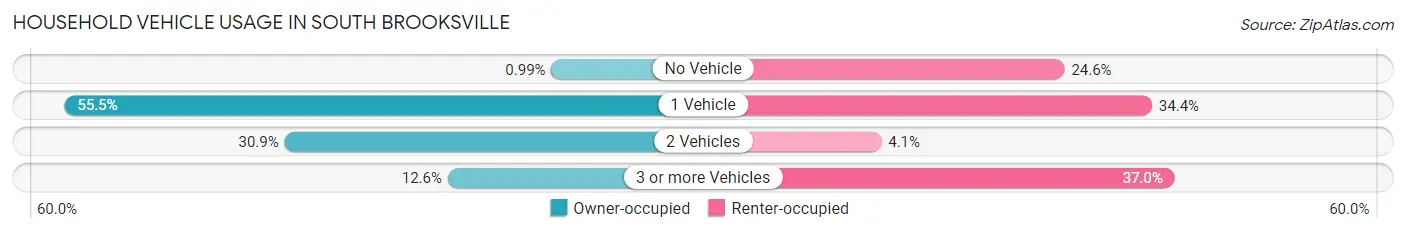
| Vehicles per Household | Owner-occupied | Renter-occupied |
| No Vehicle | 13 (1.0%) | 163 (24.6%) |
| 1 Vehicle | 732 (55.5%) | 228 (34.4%) |
| 2 Vehicles | 407 (30.9%) | 27 (4.1%) |
| 3 or more Vehicles | 166 (12.6%) | 245 (36.9%) |
| Total | 1,318 (100.0%) | 663 (100.0%) |
Real Estate & Mortgages in South Brooksville
Real Estate and Mortgage Overview in South Brooksville
| Characteristic | Without Mortgage | With Mortgage |
| Housing Units | 774 | 544 |
| Median Property Value | $86,300 | $286,500 |
| Median Household Income | $44,955 | $61 |
| Monthly Housing Costs | $352 | $9 |
| Real Estate Taxes | $1,185 | $10 |
Property Value by Mortgage Status in South Brooksville
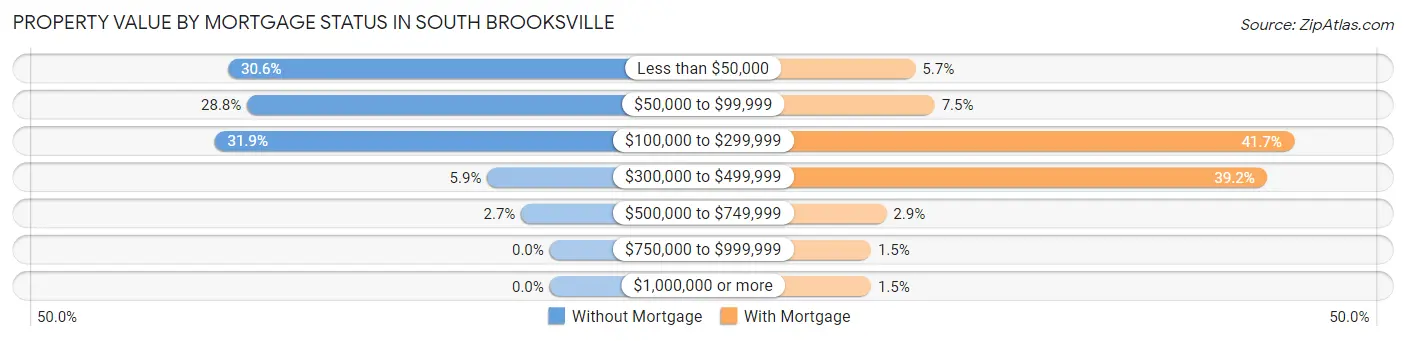
| Property Value | Without Mortgage | With Mortgage |
| Less than $50,000 | 237 (30.6%) | 31 (5.7%) |
| $50,000 to $99,999 | 223 (28.8%) | 41 (7.5%) |
| $100,000 to $299,999 | 247 (31.9%) | 227 (41.7%) |
| $300,000 to $499,999 | 46 (5.9%) | 213 (39.2%) |
| $500,000 to $749,999 | 21 (2.7%) | 16 (2.9%) |
| $750,000 to $999,999 | 0 (0.0%) | 8 (1.5%) |
| $1,000,000 or more | 0 (0.0%) | 8 (1.5%) |
| Total | 774 (100.0%) | 544 (100.0%) |
Household Income by Mortgage Status in South Brooksville
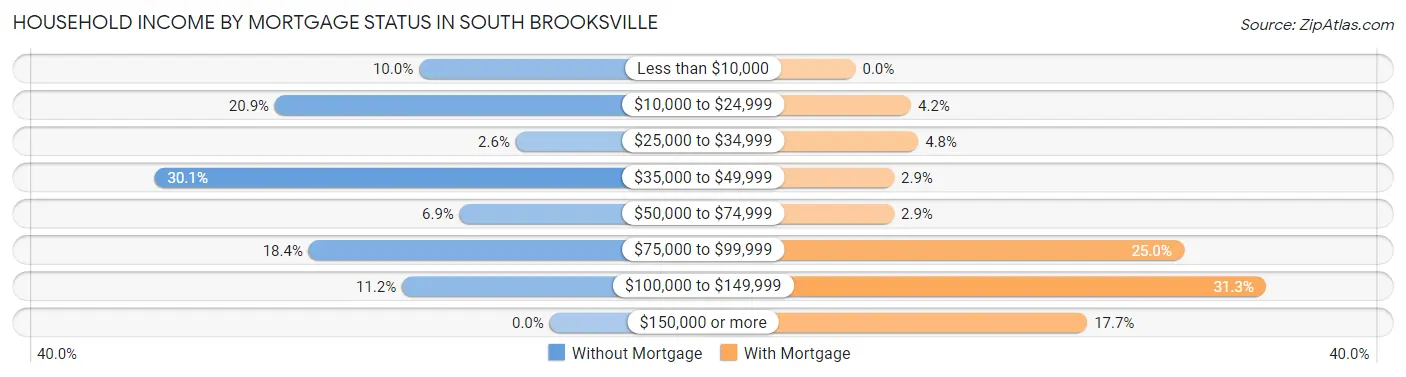
| Household Income | Without Mortgage | With Mortgage |
| Less than $10,000 | 77 (10.0%) | 0 (0.0%) |
| $10,000 to $24,999 | 162 (20.9%) | 23 (4.2%) |
| $25,000 to $34,999 | 20 (2.6%) | 26 (4.8%) |
| $35,000 to $49,999 | 233 (30.1%) | 16 (2.9%) |
| $50,000 to $74,999 | 53 (6.9%) | 16 (2.9%) |
| $75,000 to $99,999 | 142 (18.3%) | 136 (25.0%) |
| $100,000 to $149,999 | 87 (11.2%) | 170 (31.2%) |
| $150,000 or more | 0 (0.0%) | 96 (17.6%) |
| Total | 774 (100.0%) | 544 (100.0%) |
Property Value to Household Income Ratio in South Brooksville
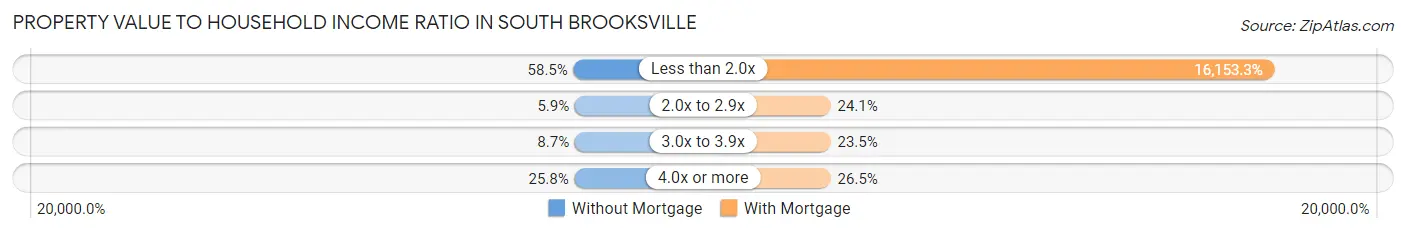
| Value-to-Income Ratio | Without Mortgage | With Mortgage |
| Less than 2.0x | 453 (58.5%) | 87,874 (16,153.3%) |
| 2.0x to 2.9x | 46 (5.9%) | 131 (24.1%) |
| 3.0x to 3.9x | 67 (8.7%) | 128 (23.5%) |
| 4.0x or more | 200 (25.8%) | 144 (26.5%) |
| Total | 774 (100.0%) | 544 (100.0%) |
Real Estate Taxes by Mortgage Status in South Brooksville
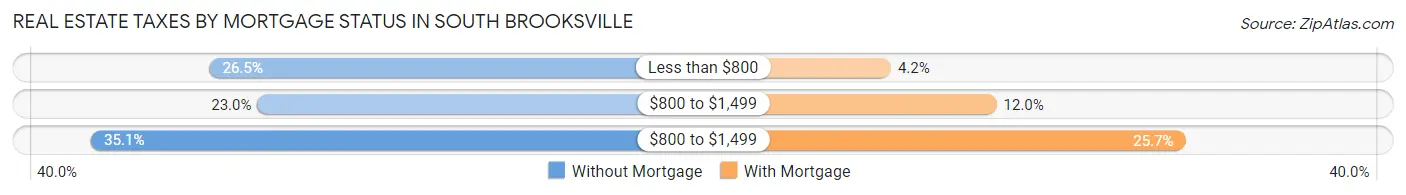
| Property Taxes | Without Mortgage | With Mortgage |
| Less than $800 | 205 (26.5%) | 23 (4.2%) |
| $800 to $1,499 | 178 (23.0%) | 65 (11.9%) |
| $800 to $1,499 | 272 (35.1%) | 140 (25.7%) |
| Total | 774 (100.0%) | 544 (100.0%) |
Health & Disability in South Brooksville
Health Insurance Coverage by Age in South Brooksville
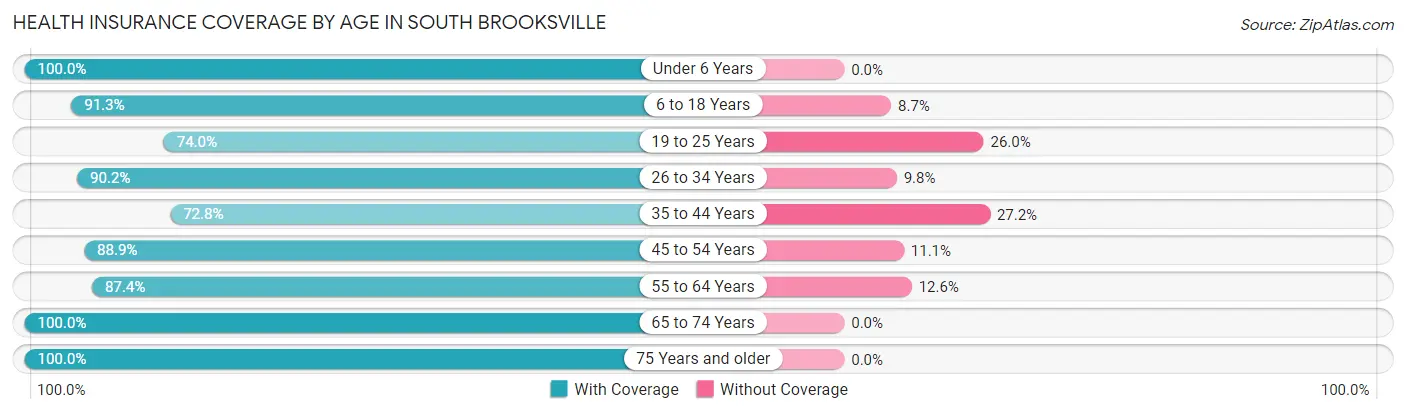
| Age Bracket | With Coverage | Without Coverage |
| Under 6 Years | 84 (100.0%) | 0 (0.0%) |
| 6 to 18 Years | 722 (91.3%) | 69 (8.7%) |
| 19 to 25 Years | 171 (74.0%) | 60 (26.0%) |
| 26 to 34 Years | 406 (90.2%) | 44 (9.8%) |
| 35 to 44 Years | 228 (72.8%) | 85 (27.2%) |
| 45 to 54 Years | 424 (88.9%) | 53 (11.1%) |
| 55 to 64 Years | 807 (87.4%) | 116 (12.6%) |
| 65 to 74 Years | 578 (100.0%) | 0 (0.0%) |
| 75 Years and older | 730 (100.0%) | 0 (0.0%) |
| Total | 4,150 (90.7%) | 427 (9.3%) |
Health Insurance Coverage by Citizenship Status in South Brooksville
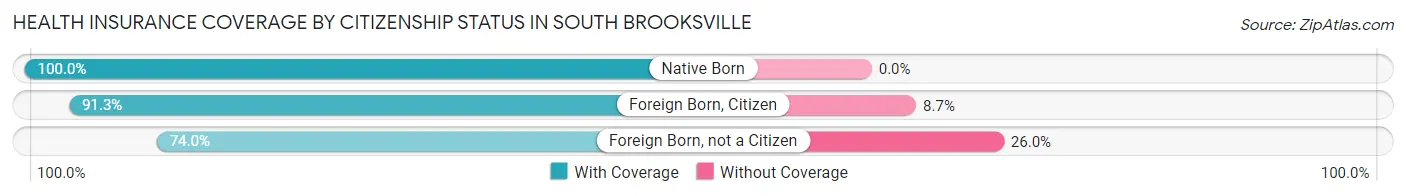
| Citizenship Status | With Coverage | Without Coverage |
| Native Born | 84 (100.0%) | 0 (0.0%) |
| Foreign Born, Citizen | 722 (91.3%) | 69 (8.7%) |
| Foreign Born, not a Citizen | 171 (74.0%) | 60 (26.0%) |
Health Insurance Coverage by Household Income in South Brooksville
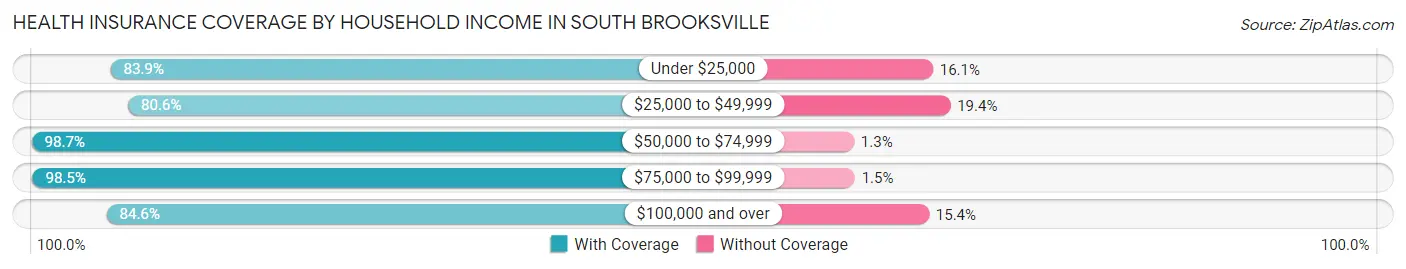
| Household Income | With Coverage | Without Coverage |
| Under $25,000 | 552 (83.9%) | 106 (16.1%) |
| $25,000 to $49,999 | 620 (80.6%) | 149 (19.4%) |
| $50,000 to $74,999 | 1,487 (98.7%) | 20 (1.3%) |
| $75,000 to $99,999 | 727 (98.5%) | 11 (1.5%) |
| $100,000 and over | 749 (84.6%) | 136 (15.4%) |
Public vs Private Health Insurance Coverage by Age in South Brooksville
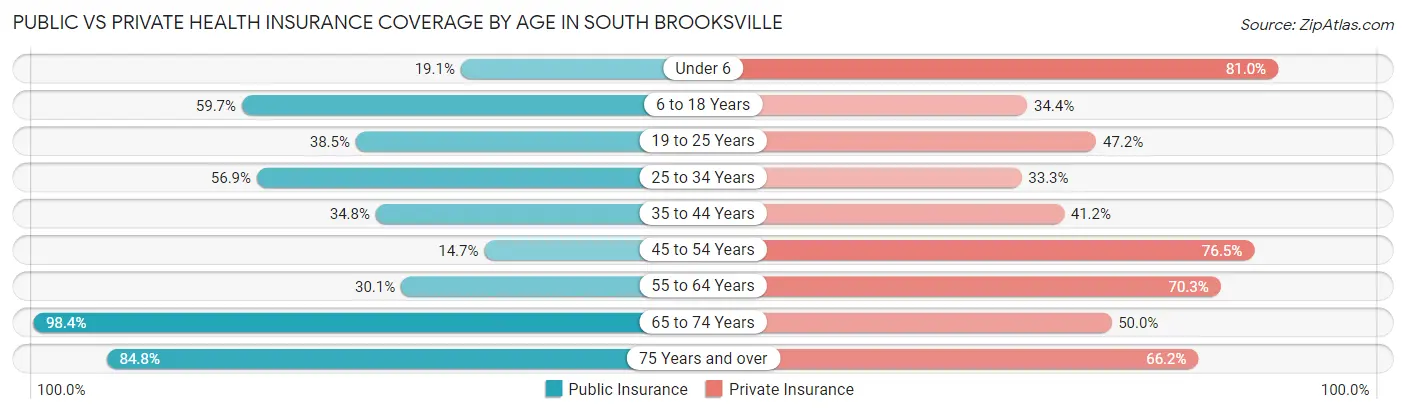
| Age Bracket | Public Insurance | Private Insurance |
| Under 6 | 16 (19.1%) | 68 (80.9%) |
| 6 to 18 Years | 472 (59.7%) | 272 (34.4%) |
| 19 to 25 Years | 89 (38.5%) | 109 (47.2%) |
| 25 to 34 Years | 256 (56.9%) | 150 (33.3%) |
| 35 to 44 Years | 109 (34.8%) | 129 (41.2%) |
| 45 to 54 Years | 70 (14.7%) | 365 (76.5%) |
| 55 to 64 Years | 278 (30.1%) | 649 (70.3%) |
| 65 to 74 Years | 569 (98.4%) | 289 (50.0%) |
| 75 Years and over | 619 (84.8%) | 483 (66.2%) |
| Total | 2,478 (54.1%) | 2,514 (54.9%) |
Disability Status by Sex by Age in South Brooksville
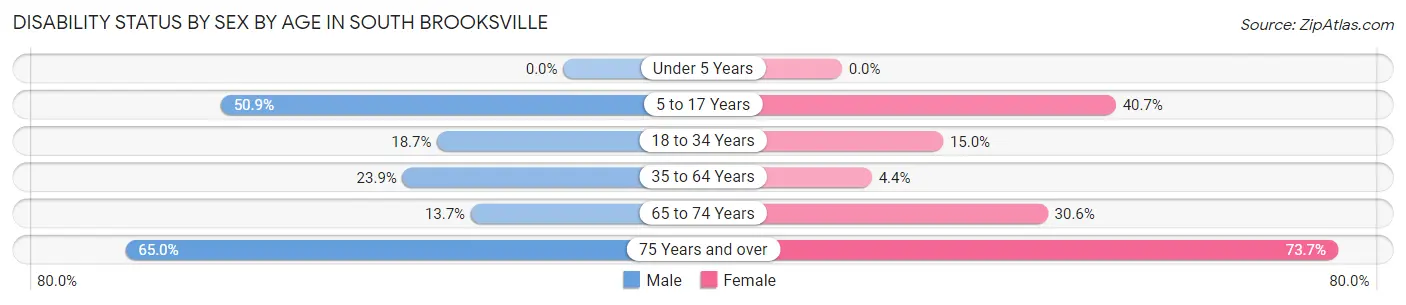
| Age Bracket | Male | Female |
| Under 5 Years | 0 (0.0%) | 0 (0.0%) |
| 5 to 17 Years | 176 (50.9%) | 181 (40.7%) |
| 18 to 34 Years | 44 (18.7%) | 67 (15.0%) |
| 35 to 64 Years | 167 (23.9%) | 45 (4.4%) |
| 65 to 74 Years | 38 (13.7%) | 92 (30.6%) |
| 75 Years and over | 186 (65.0%) | 327 (73.7%) |
Disability Class by Sex by Age in South Brooksville
Disability Class: Hearing Difficulty
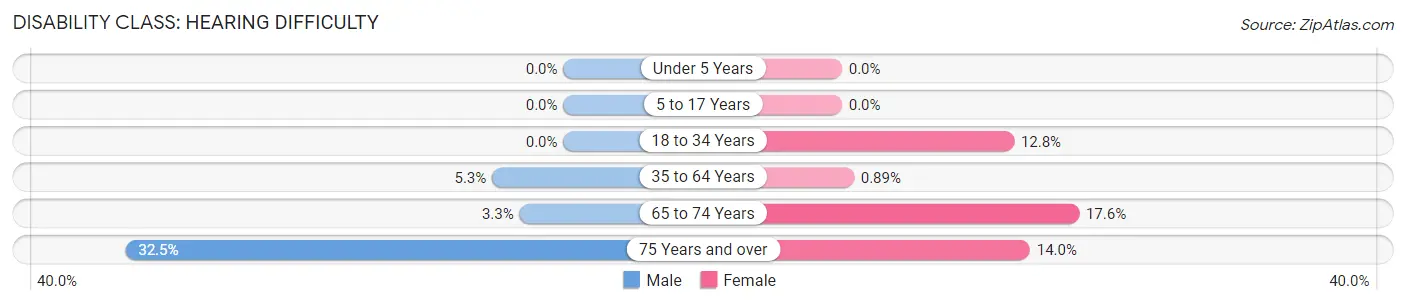
| Age Bracket | Male | Female |
| Under 5 Years | 0 (0.0%) | 0 (0.0%) |
| 5 to 17 Years | 0 (0.0%) | 0 (0.0%) |
| 18 to 34 Years | 0 (0.0%) | 57 (12.8%) |
| 35 to 64 Years | 37 (5.3%) | 9 (0.9%) |
| 65 to 74 Years | 9 (3.3%) | 53 (17.6%) |
| 75 Years and over | 93 (32.5%) | 62 (14.0%) |
Disability Class: Vision Difficulty
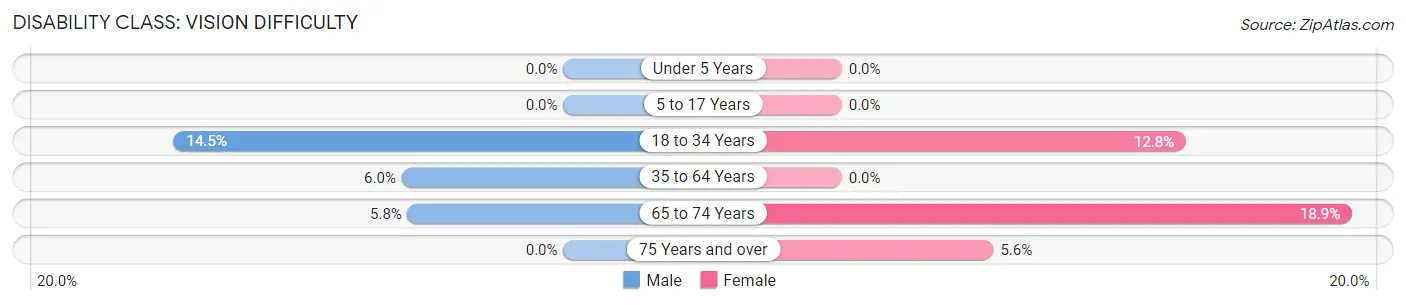
| Age Bracket | Male | Female |
| Under 5 Years | 0 (0.0%) | 0 (0.0%) |
| 5 to 17 Years | 0 (0.0%) | 0 (0.0%) |
| 18 to 34 Years | 34 (14.5%) | 57 (12.8%) |
| 35 to 64 Years | 42 (6.0%) | 0 (0.0%) |
| 65 to 74 Years | 16 (5.8%) | 57 (18.9%) |
| 75 Years and over | 0 (0.0%) | 25 (5.6%) |
Disability Class: Cognitive Difficulty
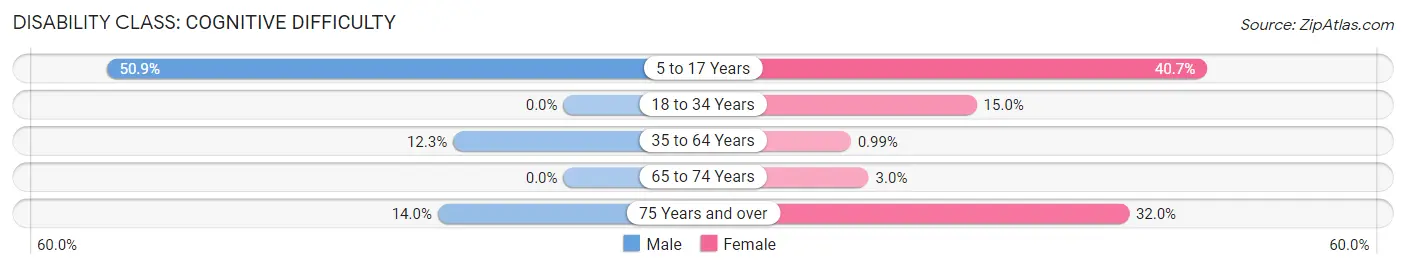
| Age Bracket | Male | Female |
| 5 to 17 Years | 176 (50.9%) | 181 (40.7%) |
| 18 to 34 Years | 0 (0.0%) | 67 (15.0%) |
| 35 to 64 Years | 86 (12.3%) | 10 (1.0%) |
| 65 to 74 Years | 0 (0.0%) | 9 (3.0%) |
| 75 Years and over | 40 (14.0%) | 142 (32.0%) |
Disability Class: Ambulatory Difficulty
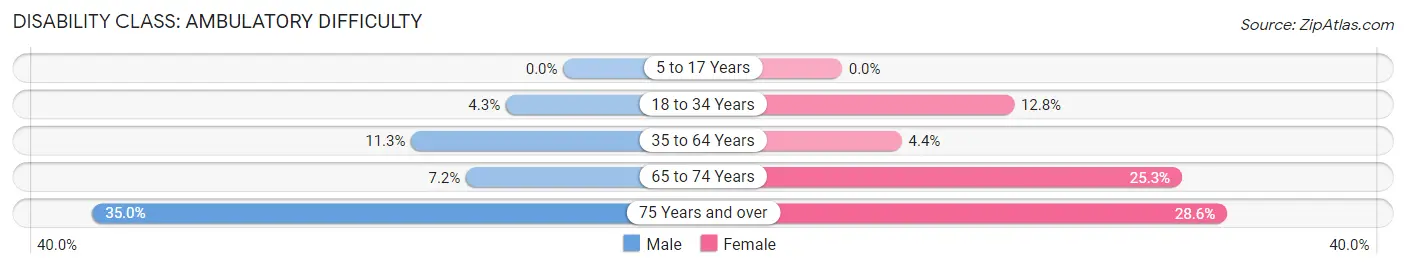
| Age Bracket | Male | Female |
| 5 to 17 Years | 0 (0.0%) | 0 (0.0%) |
| 18 to 34 Years | 10 (4.3%) | 57 (12.8%) |
| 35 to 64 Years | 79 (11.3%) | 45 (4.4%) |
| 65 to 74 Years | 20 (7.2%) | 76 (25.3%) |
| 75 Years and over | 100 (35.0%) | 127 (28.6%) |
Disability Class: Self-Care Difficulty
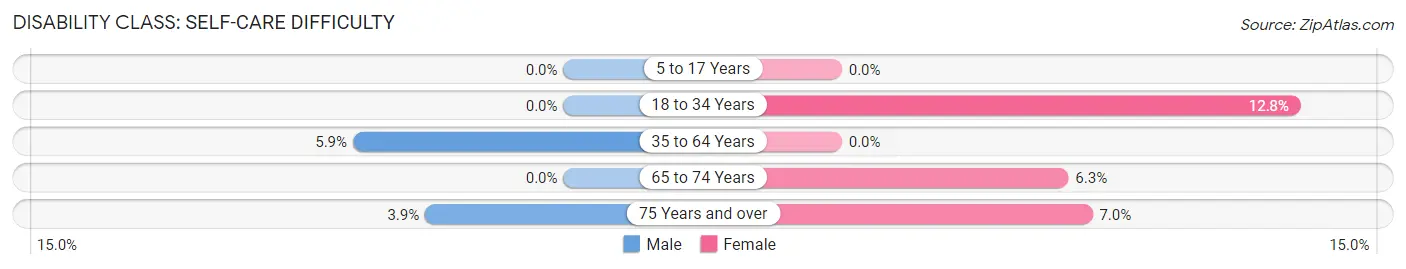
| Age Bracket | Male | Female |
| 5 to 17 Years | 0 (0.0%) | 0 (0.0%) |
| 18 to 34 Years | 0 (0.0%) | 57 (12.8%) |
| 35 to 64 Years | 41 (5.9%) | 0 (0.0%) |
| 65 to 74 Years | 0 (0.0%) | 19 (6.3%) |
| 75 Years and over | 11 (3.8%) | 31 (7.0%) |
Technology Access in South Brooksville
Computing Device Access in South Brooksville
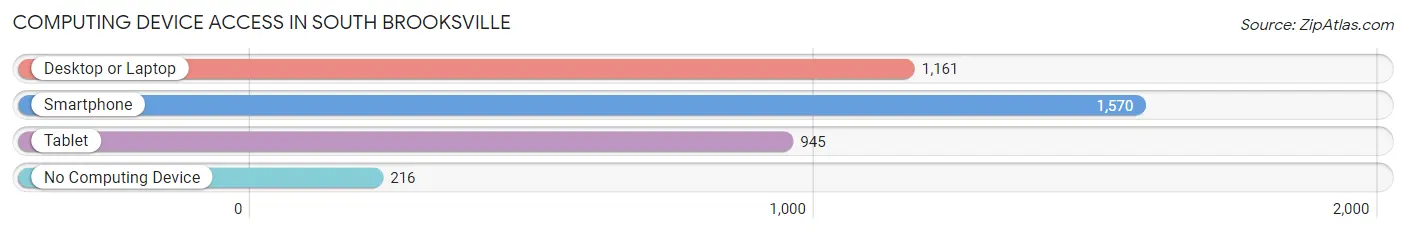
| Device Type | # Households | % Households |
| Desktop or Laptop | 1,161 | 58.6% |
| Smartphone | 1,570 | 79.2% |
| Tablet | 945 | 47.7% |
| No Computing Device | 216 | 10.9% |
| Total | 1,981 | 100.0% |
Internet Access in South Brooksville
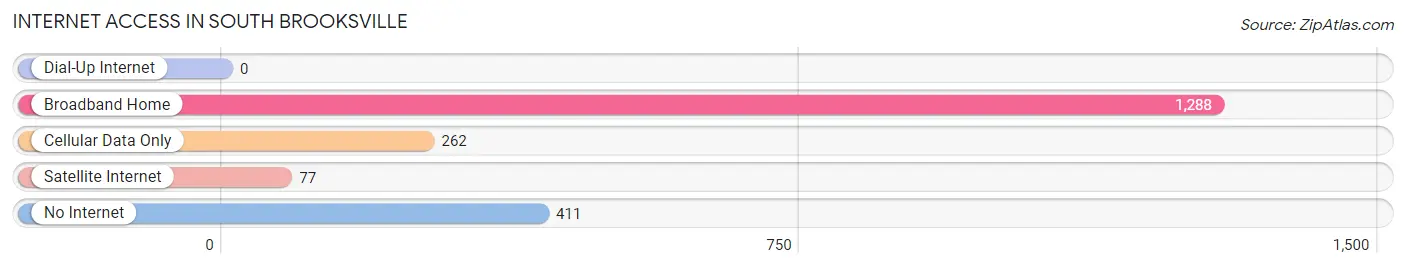
| Internet Type | # Households | % Households |
| Dial-Up Internet | 0 | 0.0% |
| Broadband Home | 1,288 | 65.0% |
| Cellular Data Only | 262 | 13.2% |
| Satellite Internet | 77 | 3.9% |
| No Internet | 411 | 20.7% |
| Total | 1,981 | 100.0% |
South Brooksville Summary
Brooksville, Florida is a small city located in Hernando County, Florida. It is the county seat of Hernando County and is located about 50 miles north of Tampa. The city has a population of approximately 8,000 people and is part of the Tampa-St. Petersburg-Clearwater Metropolitan Statistical Area.
History
The area that is now Brooksville was first settled in 1845 by John May, who established a trading post near the Withlacoochee River. The town was originally known as Melendez, but was later renamed in honor of Preston Brooks, a South Carolina congressman who had recently attacked Senator Charles Sumner on the floor of the U.S. Senate. The town was officially incorporated in 1880.
In the late 19th century, Brooksville was a major center for the production of phosphate, which was mined from the nearby Withlacoochee River. The phosphate industry was a major source of employment and economic growth for the city, and it continued to be a major industry until the mid-20th century.
Geography
Brooksville is located in the central part of Hernando County, about 50 miles north of Tampa. The city is situated on the western edge of the Withlacoochee River, which flows through the city and is a major source of recreation for the area. The city is surrounded by rolling hills and is home to several parks and nature preserves.
Economy
The economy of Brooksville is largely based on agriculture and tourism. The city is home to several farms and ranches, which produce a variety of crops, including citrus fruits, vegetables, and hay. The city is also home to several tourist attractions, including the Withlacoochee State Forest, the Chinsegut Hill Nature Center, and the Brooksville Historic District.
Demographics
As of the 2010 census, the population of Brooksville was 7,719. The racial makeup of the city was 79.2% White, 15.2% African American, 0.7% Native American, 0.7% Asian, 0.1% Pacific Islander, 2.2% from other races, and 2.0% from two or more races. Hispanic or Latino of any race were 8.3% of the population.
The median household income in Brooksville was $35,945, and the median family income was $41,919. The per capita income for the city was $19,945. About 17.2% of the population was below the poverty line.
Conclusion
Brooksville, Florida is a small city located in Hernando County, Florida. It is the county seat of Hernando County and is located about 50 miles north of Tampa. The city has a population of approximately 8,000 people and is part of the Tampa-St. Petersburg-Clearwater Metropolitan Statistical Area. The economy of Brooksville is largely based on agriculture and tourism, and the city is home to several farms and ranches, as well as several tourist attractions. The racial makeup of the city is 79.2% White, 15.2% African American, 0.7% Native American, 0.7% Asian, 0.1% Pacific Islander, 2.2% from other races, and 2.0% from two or more races. The median household income in Brooksville was $35,945, and the median family income was $41,919. About 17.2% of the population was below the poverty line.
Common Questions
What is Per Capita Income in South Brooksville?
Per Capita income in South Brooksville is $26,551.
What is the Median Family Income in South Brooksville?
Median Family Income in South Brooksville is $64,028.
What is the Median Household income in South Brooksville?
Median Household Income in South Brooksville is $55,594.
What is Income or Wage Gap in South Brooksville?
Income or Wage Gap in South Brooksville is 47.8%.
Women in South Brooksville earn 52.2 cents for every dollar earned by a man.
What is Inequality or Gini Index in South Brooksville?
Inequality or Gini Index in South Brooksville is 0.39.
What is the Total Population of South Brooksville?
Total Population of South Brooksville is 4,577.
What is the Total Male Population of South Brooksville?
Total Male Population of South Brooksville is 1,854.
What is the Total Female Population of South Brooksville?
Total Female Population of South Brooksville is 2,723.
What is the Ratio of Males per 100 Females in South Brooksville?
There are 68.09 Males per 100 Females in South Brooksville.
What is the Ratio of Females per 100 Males in South Brooksville?
There are 146.87 Females per 100 Males in South Brooksville.
What is the Median Population Age in South Brooksville?
Median Population Age in South Brooksville is 53.7 Years.
What is the Average Family Size in South Brooksville
Average Family Size in South Brooksville is 2.9 People.
What is the Average Household Size in South Brooksville
Average Household Size in South Brooksville is 2.3 People.
How Large is the Labor Force in South Brooksville?
There are 1,920 People in the Labor Forcein in South Brooksville.
What is the Percentage of People in the Labor Force in South Brooksville?
50.9% of People are in the Labor Force in South Brooksville.
What is the Unemployment Rate in South Brooksville?
Unemployment Rate in South Brooksville is 3.5%.