Zip Codes with the Highest Poverty Level Among Children Under the Age of 5 in Miami, FL

RELATED REPORTS & OPTIONS

Highest Poverty | Child 0-5
Population
Families and Households
Female Fertility
Female Fertility (Unmarried)
Race (Community Size)
Race (Percentage)
Ancestry (Community Size)
AfghanAfricanAlbanianAmericanApacheArabArgentineanArmenianAustralianAustrianBahamianBarbadianBasqueBelgianBelizeanBermudanBhutaneseBlackfeetBolivianBrazilianBritishBritish West IndianBulgarianBurmeseCanadianCelticCentral AmericanCentral American IndianCherokeeChickasawChileanChippewaChoctawColombianComancheCosta RicanCreekCroatianCubanCypriotCzechCzechoslovakianDanishDominicanDutchDutch West IndianEastern EuropeanEcuadorianEgyptianEnglishEstonianEthiopianEuropeanFilipinoFinnishFrenchFrench American IndianFrench CanadianGermanGreekGuamanian / ChamorroGuatemalanGuyaneseHaitianHonduranHungarianIcelanderIndian (Asian)IndonesianInupiatIranianIraqiIrishIroquoisIsraeliItalianJamaicanJapaneseJordanianKenyanKoreanLaotianLatvianLebaneseLithuanianMacedonianMalaysianMalteseMexicanMexican American IndianMongolianMoroccanNative HawaiianNavajoNew ZealanderNicaraguanNigerianNorthern EuropeanNorwegianPakistaniPalestinianPanamanianParaguayanPennsylvania GermanPeruvianPolishPortuguesePuerto RicanRomanianRussianSalvadoranSamoanScandinavianScotch-IrishScottishSeminoleSenegaleseSerbianSiouxSlavicSlovakSloveneSouth AfricanSouth AmericanSouth American IndianSpaniardSpanishSpanish AmericanSpanish American IndianSri LankanSubsaharan AfricanSudaneseSwedishSwissSyrianThaiTrinidadian and TobagonianTurkishU.S. Virgin IslanderUkrainianUruguayanVenezuelanVietnameseWelshWest IndianYugoslavianZimbabwean
Ancestry (Percentage)
AfghanAfricanAlbanianAmericanApacheArabArgentineanArmenianAustralianAustrianBahamianBarbadianBasqueBelgianBelizeanBermudanBhutaneseBlackfeetBolivianBrazilianBritishBritish West IndianBulgarianBurmeseCanadianCelticCentral AmericanCentral American IndianCherokeeChickasawChileanChippewaChoctawColombianComancheCosta RicanCreekCroatianCubanCypriotCzechCzechoslovakianDanishDominicanDutchDutch West IndianEastern EuropeanEcuadorianEgyptianEnglishEstonianEthiopianEuropeanFilipinoFinnishFrenchFrench American IndianFrench CanadianGermanGreekGuamanian / ChamorroGuatemalanGuyaneseHaitianHonduranHungarianIcelanderIndian (Asian)IndonesianInupiatIranianIraqiIrishIroquoisIsraeliItalianJamaicanJapaneseJordanianKenyanKoreanLaotianLatvianLebaneseLithuanianMacedonianMalaysianMalteseMexicanMexican American IndianMongolianMoroccanNative HawaiianNavajoNew ZealanderNicaraguanNigerianNorthern EuropeanNorwegianPakistaniPalestinianPanamanianParaguayanPennsylvania GermanPeruvianPolishPortuguesePuerto RicanRomanianRussianSalvadoranSamoanScandinavianScotch-IrishScottishSeminoleSenegaleseSerbianSiouxSlavicSlovakSloveneSouth AfricanSouth AmericanSouth American IndianSpaniardSpanishSpanish AmericanSpanish American IndianSri LankanSubsaharan AfricanSudaneseSwedishSwissSyrianThaiTrinidadian and TobagonianTurkishU.S. Virgin IslanderUkrainianUruguayanVenezuelanVietnameseWelshWest IndianYugoslavianZimbabwean
Immigrant Origin (Total)
AfghanistanAfricaAlbaniaArgentinaArmeniaAsiaAustraliaAustriaBahamasBangladeshBarbadosBelarusBelgiumBelizeBoliviaBosnia and HerzegovinaBrazilBulgariaBurma / MyanmarCambodiaCameroonCanadaCaribbeanCentral AmericaChileChinaColombiaCosta RicaCroatiaCubaCzechoslovakiaDenmarkDominicaDominican RepublicEastern AfricaEastern AsiaEastern EuropeEcuadorEgyptEl SalvadorEnglandEthiopiaEuropeFranceGermanyGreeceGrenadaGuatemalaGuyanaHaitiHondurasHong KongHungaryIndiaIndonesiaIranIraqIrelandIsraelItalyJamaicaJapanJordanKazakhstanKenyaKoreaKuwaitLaosLatin AmericaLatviaLebanonLithuaniaMalaysiaMexicoMiddle AfricaMoldovaMoroccoNepalNetherlandsNicaraguaNigeriaNorthern AfricaNorthern EuropeNorwayOceaniaPakistanPanamaPeruPhilippinesPolandPortugalRomaniaRussiaSaudi ArabiaScotlandSerbiaSingaporeSouth AfricaSouth AmericaSouth Central AsiaSouth Eastern AsiaSouthern EuropeSpainSri LankaSt. Vincent and the GrenadinesSudanSwedenSwitzerlandSyriaTaiwanThailandTrinidad and TobagoTurkeyUgandaUkraineUruguayUzbekistanVenezuelaVietnamWest IndiesWestern AfricaWestern AsiaWestern EuropeZaireZimbabwe
Immigrant Origin (Percentage)
AfghanistanAfricaAlbaniaArgentinaArmeniaAsiaAustraliaAustriaBahamasBangladeshBarbadosBelarusBelgiumBelizeBoliviaBosnia and HerzegovinaBrazilBulgariaBurma / MyanmarCambodiaCameroonCanadaCaribbeanCentral AmericaChileChinaColombiaCosta RicaCroatiaCubaCzechoslovakiaDenmarkDominicaDominican RepublicEastern AfricaEastern AsiaEastern EuropeEcuadorEgyptEl SalvadorEnglandEthiopiaEuropeFranceGermanyGreeceGrenadaGuatemalaGuyanaHaitiHondurasHong KongHungaryIndiaIndonesiaIranIraqIrelandIsraelItalyJamaicaJapanJordanKazakhstanKenyaKoreaKuwaitLaosLatin AmericaLatviaLebanonLithuaniaMalaysiaMexicoMiddle AfricaMoldovaMoroccoNepalNetherlandsNicaraguaNigeriaNorthern AfricaNorthern EuropeNorwayOceaniaPakistanPanamaPeruPhilippinesPolandPortugalRomaniaRussiaSaudi ArabiaScotlandSerbiaSingaporeSouth AfricaSouth AmericaSouth Central AsiaSouth Eastern AsiaSouthern EuropeSpainSri LankaSt. Vincent and the GrenadinesSudanSwedenSwitzerlandSyriaTaiwanThailandTrinidad and TobagoTurkeyUgandaUkraineUruguayUzbekistanVenezuelaVietnamWest IndiesWestern AfricaWestern AsiaWestern EuropeZaireZimbabwe
Income
Income (Families)
Income (Households)
Poverty
Poverty (Families)
Unemployment
Employment Occupations
Employment Industries
Employer Class
Commute Time
Commute Means
School Enrollment
Education by Degree Field
Occupancy
Finances
Physical Characteristics
Miami
States
Florida Cities
Altamonte SpringsApopkaArcadiaBoca RatonBoynton BeachBradentonBrandonBrooksvilleCape CoralCasselberryClearwaterClermontCocoaCoral SpringsCrestviewCrystal RiverDade CityDavenportDaytona BeachDeerfield BeachDefuniak SpringsDelandDelray BeachDeltonaDunnellonEdgewaterEnglewoodEustisFort LauderdaleFort MyersFort PierceFort Walton BeachGainesvilleGulf BreezeHialeahHolidayHollywoodHomesteadHomosassaHudsonInvernessJacksonvilleJupiterKissimmeeLake CityLake WalesLake WorthLakelandLand O LakesLargoLeesburgLehigh AcresLive OakLongwoodLutzMariannaMelbourneMerritt IslandMiamiMiami BeachMiltonNaplesNew Port RicheyNew Smyrna BeachNorth Fort MyersNorth PortOcalaOkeechobeeOpa LockaOrange ParkOrlandoOrmond BeachOviedoPalm BayPalm Beach GardensPalm CoastPalm HarborPanama CityPanama City BeachPensacolaPerryPinellas ParkPlant CityPompano BeachPort CharlottePort OrangePort Saint LuciePunta GordaQuincyRiverviewSaint AugustineSaint CloudSaint PetersburgSanfordSarasotaSebringSeminoleSpring HillStuartTallahasseeTampaTitusvilleValricoVeniceVero BeachWesley ChapelWest Palm BeachWewahitchkaWinter HavenWinter ParkZephyrhills
Compare Zip Codes
Comparison Subject

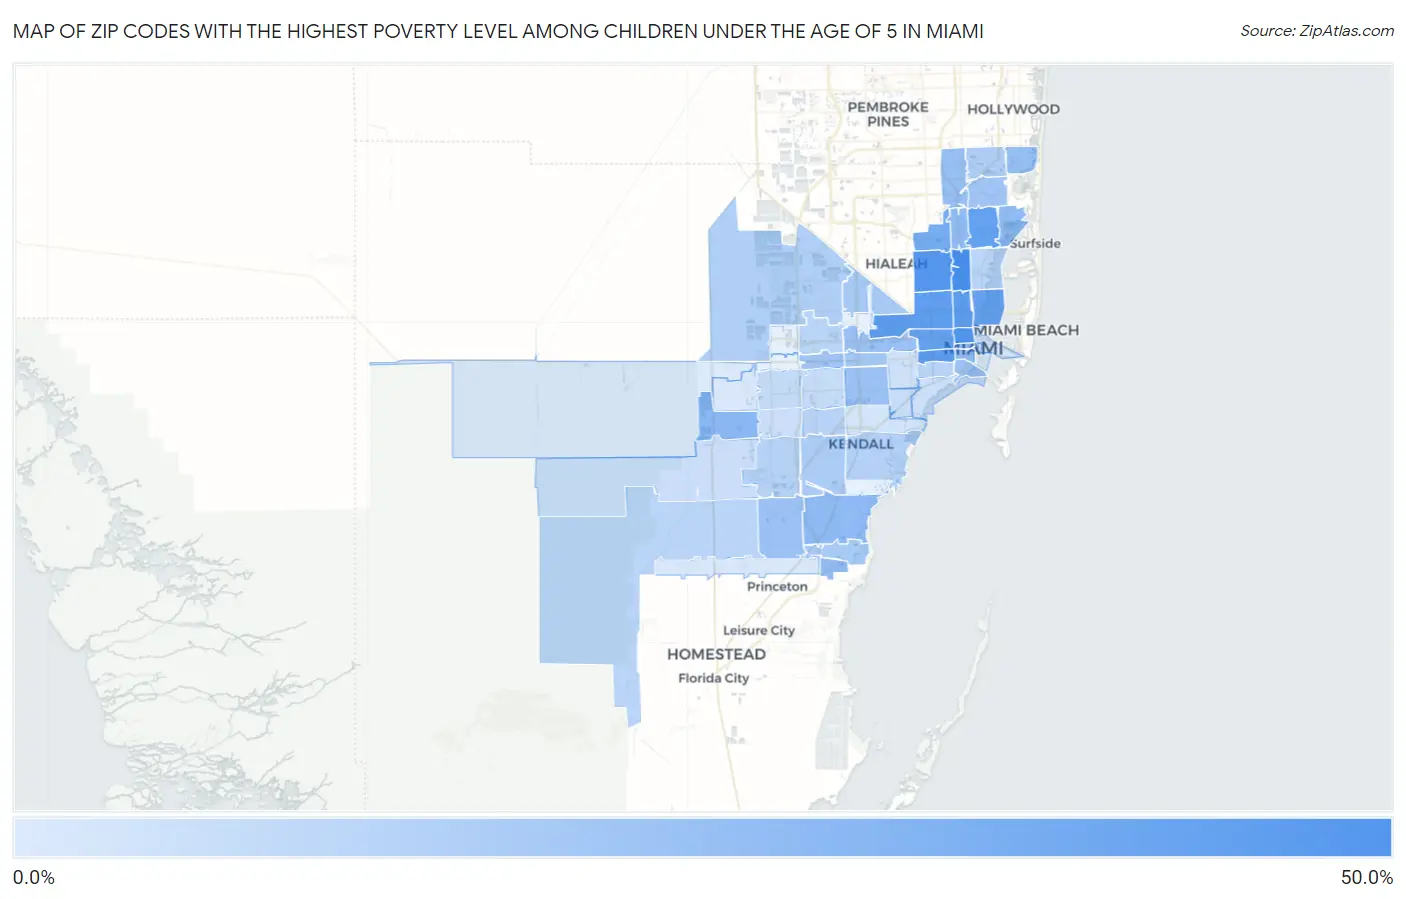
Map of Zip Codes with the Highest Poverty Level Among Children Under the Age of 5 in Miami

0.0%
50.0%
Zip Codes with the Highest Poverty Level Among Children Under the Age of 5 in Miami Map

Zip Codes with the Highest Poverty Level Among Children Under the Age of 5 in Miami, FL

Zip Code Child Poverty vs State vs National
1.3315048.7%19.3%(+29.4)#6418.1%(+30.6)#2,731
2.3313644.7%19.3%(+25.5)#8418.1%(+26.7)#3,217
3.3314743.9%19.3%(+24.6)#8818.1%(+25.8)#3,356
4.3312742.1%19.3%(+22.9)#10018.1%(+24.1)#3,632
5.3313541.2%19.3%(+21.9)#10818.1%(+23.1)#3,809
6.3314239.6%19.3%(+20.3)#12118.1%(+21.5)#4,111
7.3316138.6%19.3%(+19.3)#13218.1%(+20.5)#4,294
8.3312537.5%19.3%(+18.2)#14218.1%(+19.4)#4,487
9.3313737.2%19.3%(+18.0)#14418.1%(+19.2)#4,550
10.3316732.1%19.3%(+12.9)#19018.1%(+14.1)#5,813
11.3319325.3%19.3%(+6.05)#26418.1%(+7.25)#7,875
12.3315723.8%19.3%(+4.56)#28918.1%(+5.75)#8,426
13.3312823.4%19.3%(+4.10)#30018.1%(+5.29)#8,627
14.3316823.1%19.3%(+3.88)#30218.1%(+5.08)#8,715
15.3318123.1%19.3%(+3.85)#30418.1%(+5.04)#8,726
16.3313022.5%19.3%(+3.26)#31518.1%(+4.45)#8,957
17.3319022.0%19.3%(+2.79)#32818.1%(+3.99)#9,176
18.3316921.0%19.3%(+1.74)#34418.1%(+2.94)#9,598
19.3318020.8%19.3%(+1.56)#34618.1%(+2.76)#9,677
20.3312920.2%19.3%(+0.898)#35818.1%(+2.09)#9,957
21.3317719.4%19.3%(+0.188)#37318.1%(+1.38)#10,295
22.3312619.4%19.3%(+0.150)#37518.1%(+1.34)#10,306
23.3315519.1%19.3%(-0.161)#38718.1%(+1.03)#10,461
24.3316218.1%19.3%(-1.15)#41218.1%(+0.040)#10,916
25.3317417.9%19.3%(-1.34)#41818.1%(-0.152)#10,995
26.3314417.5%19.3%(-1.79)#43118.1%(-0.601)#11,210
27.3318915.8%19.3%(-3.49)#47118.1%(-2.30)#12,045
28.3316615.6%19.3%(-3.65)#47518.1%(-2.45)#12,122
29.3317614.4%19.3%(-4.89)#49618.1%(-3.70)#12,796
30.3317913.3%19.3%(-5.93)#52918.1%(-4.74)#13,452
31.3317813.0%19.3%(-6.27)#53918.1%(-5.08)#13,639
32.3315612.3%19.3%(-6.94)#55318.1%(-5.75)#14,033
33.3318611.7%19.3%(-7.59)#56818.1%(-6.40)#14,430
34.3314511.3%19.3%(-7.95)#57718.1%(-6.76)#14,642
35.3317310.9%19.3%(-8.33)#58718.1%(-7.14)#14,880
36.3318710.8%19.3%(-8.50)#59218.1%(-7.31)#14,974
37.3313810.6%19.3%(-8.66)#59618.1%(-7.47)#15,060
38.3317210.5%19.3%(-8.78)#60018.1%(-7.59)#15,131
39.331758.1%19.3%(-11.1)#66218.1%(-9.95)#16,684
40.331657.1%19.3%(-12.2)#69018.1%(-11.0)#17,349
41.331467.0%19.3%(-12.2)#69118.1%(-11.0)#17,358
42.331966.0%19.3%(-13.2)#72318.1%(-12.0)#18,046
43.331835.9%19.3%(-13.4)#72518.1%(-12.2)#18,137
44.331335.5%19.3%(-13.7)#73218.1%(-12.5)#18,412
45.331344.8%19.3%(-14.4)#74418.1%(-13.2)#18,891
46.331433.7%19.3%(-15.6)#76618.1%(-14.4)#19,752
47.331323.0%19.3%(-16.2)#77918.1%(-15.0)#20,161
48.331702.3%19.3%(-17.0)#78918.1%(-15.8)#20,644
49.331851.6%19.3%(-17.7)#80418.1%(-16.5)#21,101
50.331941.1%19.3%(-18.1)#81118.1%(-16.9)#21,319

Common Questions

What are the Top 10 Zip Codes with the Highest Poverty Level Among Children Under the Age of 5 in Miami, FL?
Top 10 Zip Codes with the Highest Poverty Level Among Children Under the Age of 5 in Miami, FL are:
#1
48.7%
#2
44.7%
#3
43.9%
#4
42.1%
#5
41.2%
#6
39.6%
#7
38.6%
#8
37.5%
#9
37.2%
#10
32.1%
What zip code has the Highest Poverty Level Among Children Under the Age of 5 in Miami, FL?
33150 has the Highest Poverty Level Among Children Under the Age of 5 in Miami, FL with 48.7%.
What is the Poverty Level Among Children Under the Age of 5 in Miami, FL?
Poverty Level Among Children Under the Age of 5 in Miami is 26.7%.
What is the Poverty Level Among Children Under the Age of 5 in Florida?
Poverty Level Among Children Under the Age of 5 in Florida is 19.3%.
What is the Poverty Level Among Children Under the Age of 5 in the United States?
Poverty Level Among Children Under the Age of 5 in the United States is 18.1%.