Zip Codes with the Highest Poverty Level Among Children Under the Age of 5 in Florida
RELATED REPORTS & OPTIONS
Highest Poverty | Child 0-5
Florida
Compare Zip Codes
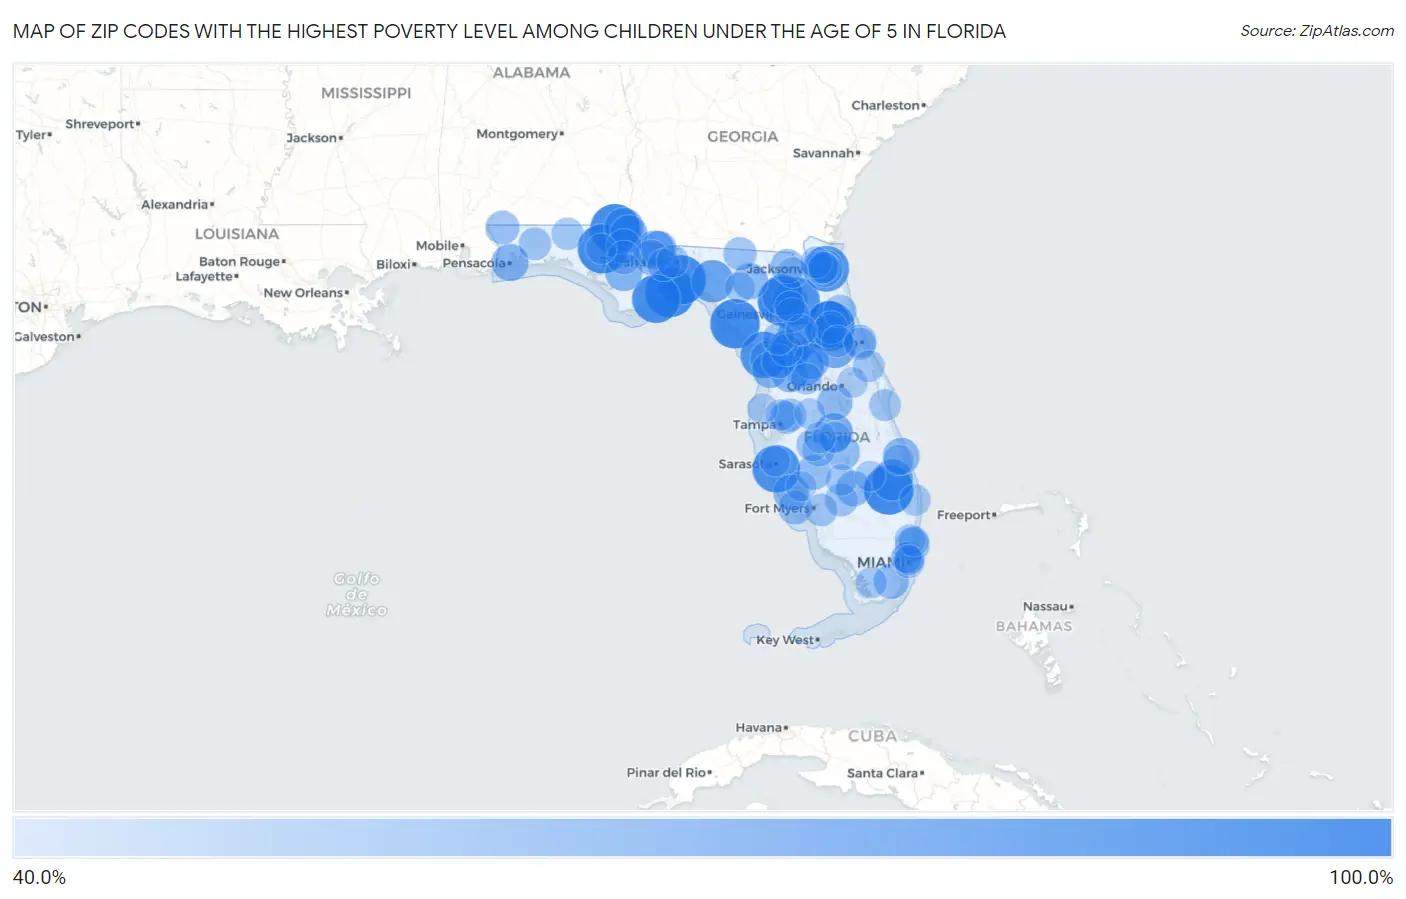
Map of Zip Codes with the Highest Poverty Level Among Children Under the Age of 5 in Florida
40.0%
100.0%
Zip Codes with the Highest Poverty Level Among Children Under the Age of 5 in Florida
| Zip Code | Child Poverty | vs State | vs National | |
| 1. | 32346 | 100.0% | 19.3%(+80.7)#1 | 18.1%(+81.9)#16 |
| 2. | 32157 | 100.0% | 19.3%(+80.7)#2 | 18.1%(+81.9)#106 |
| 3. | 32426 | 100.0% | 19.3%(+80.7)#3 | 18.1%(+81.9)#121 |
| 4. | 33438 | 100.0% | 19.3%(+80.7)#4 | 18.1%(+81.9)#189 |
| 5. | 32658 | 100.0% | 19.3%(+80.7)#5 | 18.1%(+81.9)#306 |
| 6. | 32648 | 100.0% | 19.3%(+80.7)#6 | 18.1%(+81.9)#327 |
| 7. | 32355 | 100.0% | 19.3%(+80.7)#7 | 18.1%(+81.9)#341 |
| 8. | 32463 | 100.0% | 19.3%(+80.7)#8 | 18.1%(+81.9)#455 |
| 9. | 32322 | 96.2% | 19.3%(+76.9)#9 | 18.1%(+78.1)#570 |
| 10. | 34242 | 94.0% | 19.3%(+74.7)#10 | 18.1%(+75.9)#592 |
| 11. | 32044 | 93.3% | 19.3%(+74.1)#11 | 18.1%(+75.3)#598 |
| 12. | 34498 | 90.9% | 19.3%(+71.7)#12 | 18.1%(+72.8)#626 |
| 13. | 32202 | 88.8% | 19.3%(+69.5)#13 | 18.1%(+70.7)#648 |
| 14. | 32181 | 81.3% | 19.3%(+62.1)#14 | 18.1%(+63.3)#783 |
| 15. | 32347 | 78.5% | 19.3%(+59.2)#15 | 18.1%(+60.4)#857 |
| 16. | 34475 | 77.6% | 19.3%(+58.4)#16 | 18.1%(+59.6)#885 |
| 17. | 34956 | 75.1% | 19.3%(+55.9)#17 | 18.1%(+57.1)#950 |
| 18. | 32697 | 75.0% | 19.3%(+55.7)#18 | 18.1%(+56.9)#974 |
| 19. | 34481 | 74.5% | 19.3%(+55.2)#19 | 18.1%(+56.4)#987 |
| 20. | 32102 | 74.1% | 19.3%(+54.8)#20 | 18.1%(+56.0)#1,004 |
| 21. | 34785 | 72.0% | 19.3%(+52.7)#21 | 18.1%(+53.9)#1,090 |
| 22. | 32445 | 68.5% | 19.3%(+49.3)#22 | 18.1%(+50.5)#1,211 |
| 23. | 32332 | 67.4% | 19.3%(+48.2)#23 | 18.1%(+49.4)#1,256 |
| 24. | 33827 | 66.1% | 19.3%(+46.8)#24 | 18.1%(+48.0)#1,338 |
| 25. | 32443 | 63.1% | 19.3%(+43.9)#25 | 18.1%(+45.1)#1,498 |
| 26. | 32449 | 63.0% | 19.3%(+43.8)#26 | 18.1%(+45.0)#1,501 |
| 27. | 32501 | 62.7% | 19.3%(+43.4)#27 | 18.1%(+44.6)#1,514 |
| 28. | 34436 | 62.2% | 19.3%(+42.9)#28 | 18.1%(+44.1)#1,550 |
| 29. | 34428 | 61.9% | 19.3%(+42.7)#29 | 18.1%(+43.9)#1,559 |
| 30. | 34950 | 61.1% | 19.3%(+41.8)#30 | 18.1%(+43.0)#1,623 |
| 31. | 34448 | 59.5% | 19.3%(+40.3)#31 | 18.1%(+41.4)#1,728 |
| 32. | 32159 | 59.5% | 19.3%(+40.2)#32 | 18.1%(+41.4)#1,732 |
| 33. | 32062 | 59.1% | 19.3%(+39.8)#33 | 18.1%(+41.0)#1,760 |
| 34. | 33947 | 58.8% | 19.3%(+39.6)#34 | 18.1%(+40.8)#1,778 |
| 35. | 32352 | 58.1% | 19.3%(+38.8)#35 | 18.1%(+40.0)#1,820 |
| 36. | 33848 | 57.0% | 19.3%(+37.7)#36 | 18.1%(+38.9)#1,908 |
| 37. | 33471 | 57.0% | 19.3%(+37.7)#37 | 18.1%(+38.9)#1,909 |
| 38. | 32351 | 56.7% | 19.3%(+37.5)#38 | 18.1%(+38.7)#1,931 |
| 39. | 33030 | 56.7% | 19.3%(+37.5)#39 | 18.1%(+38.6)#1,932 |
| 40. | 33870 | 55.8% | 19.3%(+36.6)#40 | 18.1%(+37.8)#2,000 |
| 41. | 32206 | 54.8% | 19.3%(+35.5)#41 | 18.1%(+36.7)#2,082 |
| 42. | 34266 | 54.7% | 19.3%(+35.5)#42 | 18.1%(+36.7)#2,087 |
| 43. | 32448 | 54.6% | 19.3%(+35.4)#43 | 18.1%(+36.6)#2,093 |
| 44. | 32641 | 54.5% | 19.3%(+35.3)#44 | 18.1%(+36.5)#2,103 |
| 45. | 32087 | 54.3% | 19.3%(+35.0)#45 | 18.1%(+36.2)#2,119 |
| 46. | 33004 | 54.1% | 19.3%(+34.9)#46 | 18.1%(+36.1)#2,132 |
| 47. | 32204 | 53.7% | 19.3%(+34.5)#47 | 18.1%(+35.7)#2,168 |
| 48. | 34465 | 53.7% | 19.3%(+34.5)#48 | 18.1%(+35.6)#2,173 |
| 49. | 33922 | 53.5% | 19.3%(+34.3)#49 | 18.1%(+35.5)#2,188 |
| 50. | 32421 | 52.6% | 19.3%(+33.4)#50 | 18.1%(+34.6)#2,285 |
| 51. | 32535 | 52.4% | 19.3%(+33.1)#51 | 18.1%(+34.3)#2,311 |
| 52. | 32139 | 51.6% | 19.3%(+32.4)#52 | 18.1%(+33.6)#2,372 |
| 53. | 32053 | 50.9% | 19.3%(+31.6)#53 | 18.1%(+32.8)#2,438 |
| 54. | 32117 | 50.3% | 19.3%(+31.1)#54 | 18.1%(+32.3)#2,495 |
| 55. | 32145 | 50.2% | 19.3%(+31.0)#55 | 18.1%(+32.2)#2,504 |
| 56. | 33873 | 50.1% | 19.3%(+30.8)#56 | 18.1%(+32.0)#2,512 |
| 57. | 32254 | 50.0% | 19.3%(+30.7)#57 | 18.1%(+31.9)#2,518 |
| 58. | 33592 | 49.8% | 19.3%(+30.5)#58 | 18.1%(+31.7)#2,623 |
| 59. | 33935 | 49.4% | 19.3%(+30.2)#59 | 18.1%(+31.4)#2,647 |
| 60. | 33637 | 49.2% | 19.3%(+29.9)#60 | 18.1%(+31.1)#2,671 |
| 61. | 32112 | 49.1% | 19.3%(+29.9)#61 | 18.1%(+31.1)#2,681 |
| 62. | 32564 | 49.1% | 19.3%(+29.8)#62 | 18.1%(+31.0)#2,683 |
| 63. | 33973 | 49.0% | 19.3%(+29.7)#63 | 18.1%(+30.9)#2,696 |
| 64. | 33150 | 48.7% | 19.3%(+29.4)#64 | 18.1%(+30.6)#2,731 |
| 65. | 32310 | 48.7% | 19.3%(+29.4)#65 | 18.1%(+30.6)#2,734 |
| 66. | 33834 | 48.6% | 19.3%(+29.4)#66 | 18.1%(+30.6)#2,739 |
| 67. | 34432 | 48.4% | 19.3%(+29.1)#67 | 18.1%(+30.3)#2,772 |
| 68. | 32433 | 47.9% | 19.3%(+28.6)#68 | 18.1%(+29.8)#2,819 |
| 69. | 32304 | 47.9% | 19.3%(+28.6)#69 | 18.1%(+29.8)#2,823 |
| 70. | 32114 | 47.7% | 19.3%(+28.5)#70 | 18.1%(+29.7)#2,843 |
| 71. | 32668 | 47.6% | 19.3%(+28.4)#71 | 18.1%(+29.6)#2,855 |
| 72. | 32180 | 46.8% | 19.3%(+27.6)#72 | 18.1%(+28.8)#2,942 |
| 73. | 32759 | 46.7% | 19.3%(+27.5)#73 | 18.1%(+28.7)#2,958 |
| 74. | 32925 | 46.7% | 19.3%(+27.5)#74 | 18.1%(+28.6)#2,960 |
| 75. | 33843 | 46.4% | 19.3%(+27.2)#75 | 18.1%(+28.4)#2,988 |
| 76. | 32219 | 46.1% | 19.3%(+26.9)#76 | 18.1%(+28.1)#3,040 |
| 77. | 33407 | 45.9% | 19.3%(+26.6)#77 | 18.1%(+27.8)#3,072 |
| 78. | 33960 | 45.5% | 19.3%(+26.2)#78 | 18.1%(+27.4)#3,117 |
| 79. | 33841 | 45.3% | 19.3%(+26.0)#79 | 18.1%(+27.2)#3,138 |
| 80. | 33034 | 45.2% | 19.3%(+25.9)#80 | 18.1%(+27.1)#3,157 |
| 81. | 32209 | 45.1% | 19.3%(+25.9)#81 | 18.1%(+27.1)#3,166 |
| 82. | 33613 | 45.1% | 19.3%(+25.8)#82 | 18.1%(+27.0)#3,175 |
| 83. | 33514 | 44.9% | 19.3%(+25.6)#83 | 18.1%(+26.8)#3,196 |
| 84. | 33136 | 44.7% | 19.3%(+25.5)#84 | 18.1%(+26.7)#3,217 |
| 85. | 33311 | 44.5% | 19.3%(+25.2)#85 | 18.1%(+26.4)#3,251 |
| 86. | 32113 | 44.3% | 19.3%(+25.1)#86 | 18.1%(+26.3)#3,290 |
| 87. | 33805 | 43.9% | 19.3%(+24.7)#87 | 18.1%(+25.9)#3,346 |
| 88. | 33147 | 43.9% | 19.3%(+24.6)#88 | 18.1%(+25.8)#3,356 |
| 89. | 32040 | 43.7% | 19.3%(+24.5)#89 | 18.1%(+25.7)#3,383 |
| 90. | 34981 | 43.6% | 19.3%(+24.3)#90 | 18.1%(+25.5)#3,400 |
| 91. | 32066 | 43.3% | 19.3%(+24.1)#91 | 18.1%(+25.2)#3,438 |
| 92. | 34974 | 43.0% | 19.3%(+23.8)#92 | 18.1%(+25.0)#3,478 |
| 93. | 32826 | 42.8% | 19.3%(+23.5)#93 | 18.1%(+24.7)#3,528 |
| 94. | 34234 | 42.5% | 19.3%(+23.3)#94 | 18.1%(+24.5)#3,562 |
| 95. | 34691 | 42.4% | 19.3%(+23.1)#95 | 18.1%(+24.3)#3,595 |
| 96. | 33952 | 42.4% | 19.3%(+23.1)#96 | 18.1%(+24.3)#3,600 |
| 97. | 32609 | 42.3% | 19.3%(+23.0)#97 | 18.1%(+24.2)#3,610 |
| 98. | 33316 | 42.3% | 19.3%(+23.0)#98 | 18.1%(+24.2)#3,614 |
| 99. | 32428 | 42.2% | 19.3%(+22.9)#99 | 18.1%(+24.1)#3,624 |
| 100. | 33127 | 42.1% | 19.3%(+22.9)#100 | 18.1%(+24.1)#3,632 |
Common Questions
What are the Top 10 Zip Codes with the Highest Poverty Level Among Children Under the Age of 5 in Florida?
Top 10 Zip Codes with the Highest Poverty Level Among Children Under the Age of 5 in Florida are:
What zip code has the Highest Poverty Level Among Children Under the Age of 5 in Florida?
32346 has the Highest Poverty Level Among Children Under the Age of 5 in Florida with 100.0%.
What is the Poverty Level Among Children Under the Age of 5 in the State of Florida?
Poverty Level Among Children Under the Age of 5 in Florida is 19.3%.
What is the Poverty Level Among Children Under the Age of 5 in the United States?
Poverty Level Among Children Under the Age of 5 in the United States is 18.1%.