Yup'ik vs Macedonian Disability Age 5 to 17
COMPARE
Yup'ik
Macedonian
Disability Age 5 to 17
Disability Age 5 to 17 Comparison
Yup'ik
Macedonians
4.8%
DISABILITY AGE 5 TO 17
100.0/ 100
METRIC RATING
21st/ 347
METRIC RANK
5.2%
DISABILITY AGE 5 TO 17
99.8/ 100
METRIC RATING
67th/ 347
METRIC RANK
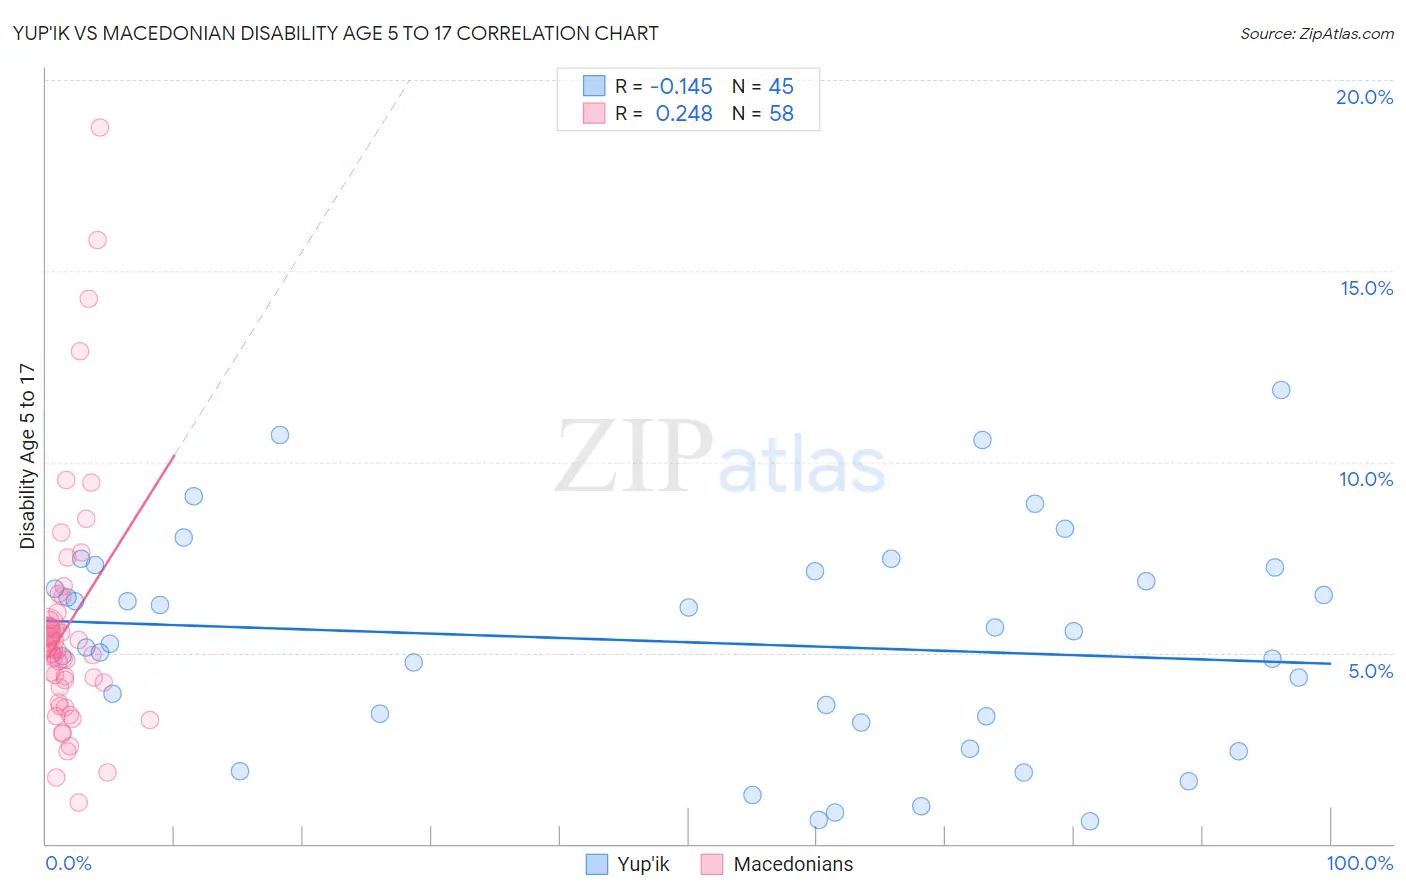
Yup'ik vs Macedonian Disability Age 5 to 17 Correlation Chart
The statistical analysis conducted on geographies consisting of 39,814,891 people shows a poor negative correlation between the proportion of Yup'ik and percentage of population with a disability between the ages 5 and 17 in the United States with a correlation coefficient (R) of -0.145 and weighted average of 4.8%. Similarly, the statistical analysis conducted on geographies consisting of 132,067,299 people shows a weak positive correlation between the proportion of Macedonians and percentage of population with a disability between the ages 5 and 17 in the United States with a correlation coefficient (R) of 0.248 and weighted average of 5.2%, a difference of 8.2%.
Disability Age 5 to 17 Correlation Summary
| Measurement | Yup'ik | Macedonian |
| Minimum | 0.58% | 1.1% |
| Maximum | 11.9% | 18.8% |
| Range | 11.3% | 17.7% |
| Mean | 5.3% | 5.7% |
| Median | 5.6% | 5.1% |
| Interquartile 25% (IQ1) | 3.3% | 4.1% |
| Interquartile 75% (IQ3) | 7.2% | 5.9% |
| Interquartile Range (IQR) | 3.9% | 1.8% |
| Standard Deviation (Sample) | 2.8% | 3.2% |
| Standard Deviation (Population) | 2.8% | 3.2% |
Similar Demographics by Disability Age 5 to 17
Demographics Similar to Yup'ik by Disability Age 5 to 17
In terms of disability age 5 to 17, the demographic groups most similar to Yup'ik are Burmese (4.8%, a difference of 0.22%), Asian (4.8%, a difference of 0.34%), Immigrants from Uzbekistan (4.8%, a difference of 0.60%), Immigrants from Bolivia (4.8%, a difference of 1.0%), and Immigrants from South Central Asia (4.7%, a difference of 1.1%).
| Demographics | Rating | Rank | Disability Age 5 to 17 |
| Immigrants | Korea | 100.0 /100 | #14 | Exceptional 4.7% |
| Chinese | 100.0 /100 | #15 | Exceptional 4.7% |
| Immigrants | Singapore | 100.0 /100 | #16 | Exceptional 4.7% |
| Arapaho | 100.0 /100 | #17 | Exceptional 4.7% |
| Immigrants | South Central Asia | 100.0 /100 | #18 | Exceptional 4.7% |
| Immigrants | Uzbekistan | 100.0 /100 | #19 | Exceptional 4.8% |
| Burmese | 100.0 /100 | #20 | Exceptional 4.8% |
| Yup'ik | 100.0 /100 | #21 | Exceptional 4.8% |
| Asians | 100.0 /100 | #22 | Exceptional 4.8% |
| Immigrants | Bolivia | 100.0 /100 | #23 | Exceptional 4.8% |
| Immigrants | Lebanon | 100.0 /100 | #24 | Exceptional 4.8% |
| Immigrants | Asia | 100.0 /100 | #25 | Exceptional 4.8% |
| Bhutanese | 100.0 /100 | #26 | Exceptional 4.9% |
| Taiwanese | 100.0 /100 | #27 | Exceptional 4.9% |
| Immigrants | Japan | 100.0 /100 | #28 | Exceptional 4.9% |
Demographics Similar to Macedonians by Disability Age 5 to 17
In terms of disability age 5 to 17, the demographic groups most similar to Macedonians are Palestinian (5.2%, a difference of 0.030%), Immigrants from Greece (5.2%, a difference of 0.070%), Immigrants from South Eastern Asia (5.2%, a difference of 0.080%), Immigrants from Bangladesh (5.2%, a difference of 0.11%), and Immigrants from Syria (5.2%, a difference of 0.14%).
| Demographics | Rating | Rank | Disability Age 5 to 17 |
| Immigrants | Eastern Europe | 99.9 /100 | #60 | Exceptional 5.1% |
| Immigrants | Switzerland | 99.8 /100 | #61 | Exceptional 5.2% |
| Immigrants | Ireland | 99.8 /100 | #62 | Exceptional 5.2% |
| Immigrants | Bangladesh | 99.8 /100 | #63 | Exceptional 5.2% |
| Immigrants | South Eastern Asia | 99.8 /100 | #64 | Exceptional 5.2% |
| Immigrants | Greece | 99.8 /100 | #65 | Exceptional 5.2% |
| Palestinians | 99.8 /100 | #66 | Exceptional 5.2% |
| Macedonians | 99.8 /100 | #67 | Exceptional 5.2% |
| Immigrants | Syria | 99.7 /100 | #68 | Exceptional 5.2% |
| Guyanese | 99.7 /100 | #69 | Exceptional 5.2% |
| Immigrants | Belgium | 99.7 /100 | #70 | Exceptional 5.2% |
| Jordanians | 99.7 /100 | #71 | Exceptional 5.2% |
| Immigrants | Vietnam | 99.7 /100 | #72 | Exceptional 5.2% |
| Immigrants | Czechoslovakia | 99.7 /100 | #73 | Exceptional 5.2% |
| Immigrants | Romania | 99.7 /100 | #74 | Exceptional 5.2% |