Pennsylvania German vs Latvian Disability Age 5 to 17
COMPARE
Pennsylvania German
Latvian
Disability Age 5 to 17
Disability Age 5 to 17 Comparison
Pennsylvania Germans
Latvians
6.6%
DISABILITY AGE 5 TO 17
0.0/ 100
METRIC RATING
328th/ 347
METRIC RANK
5.4%
DISABILITY AGE 5 TO 17
95.0/ 100
METRIC RATING
127th/ 347
METRIC RANK
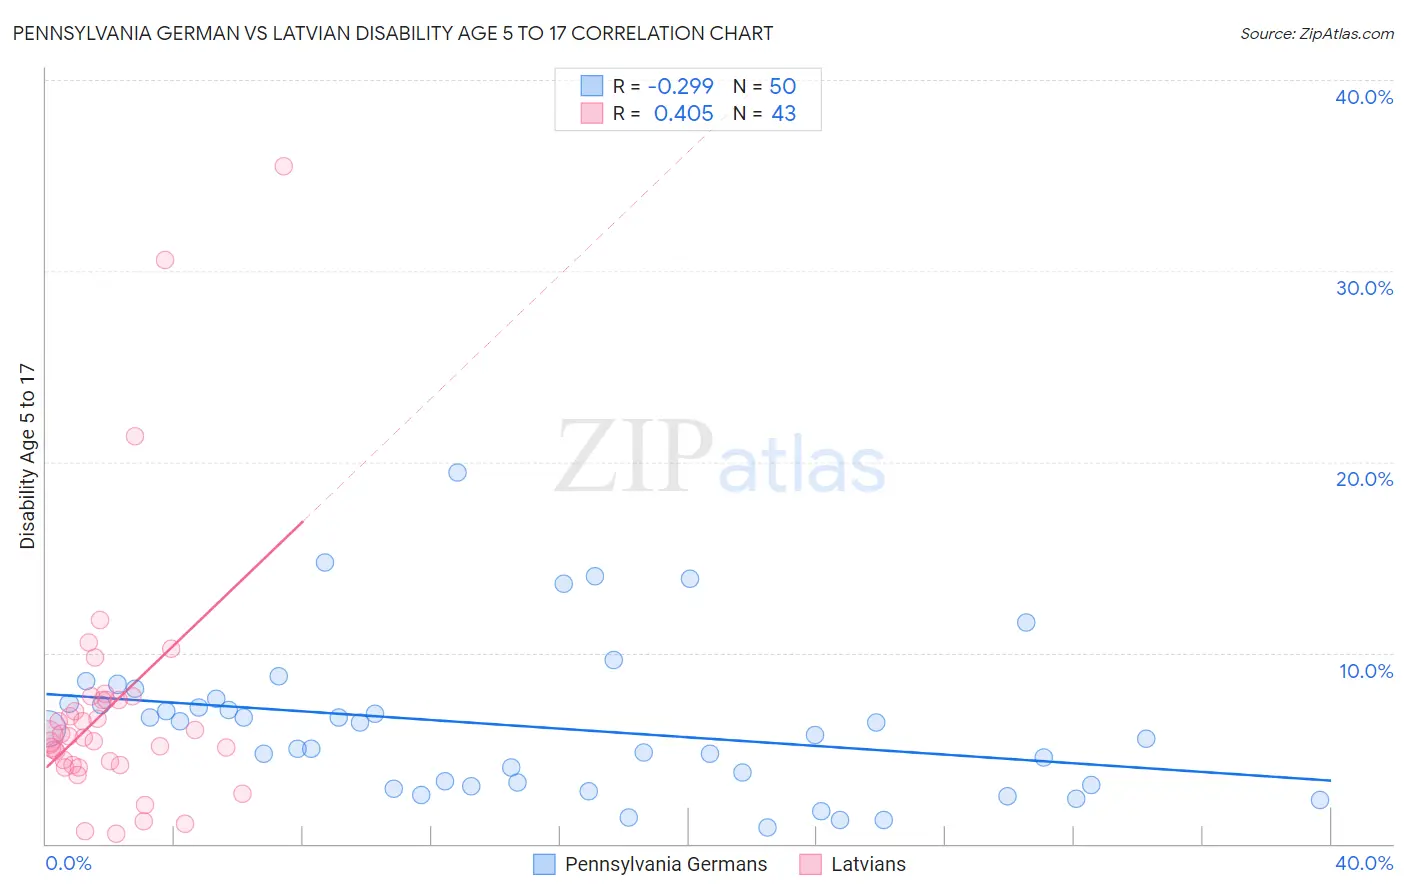
Pennsylvania German vs Latvian Disability Age 5 to 17 Correlation Chart
The statistical analysis conducted on geographies consisting of 232,166,833 people shows a weak negative correlation between the proportion of Pennsylvania Germans and percentage of population with a disability between the ages 5 and 17 in the United States with a correlation coefficient (R) of -0.299 and weighted average of 6.6%. Similarly, the statistical analysis conducted on geographies consisting of 219,260,682 people shows a moderate positive correlation between the proportion of Latvians and percentage of population with a disability between the ages 5 and 17 in the United States with a correlation coefficient (R) of 0.405 and weighted average of 5.4%, a difference of 21.9%.
Disability Age 5 to 17 Correlation Summary
| Measurement | Pennsylvania German | Latvian |
| Minimum | 0.86% | 0.51% |
| Maximum | 19.5% | 35.5% |
| Range | 18.6% | 35.0% |
| Mean | 6.2% | 7.2% |
| Median | 5.9% | 5.6% |
| Interquartile 25% (IQ1) | 3.1% | 4.1% |
| Interquartile 75% (IQ3) | 7.3% | 7.5% |
| Interquartile Range (IQR) | 4.3% | 3.4% |
| Standard Deviation (Sample) | 3.9% | 6.8% |
| Standard Deviation (Population) | 3.9% | 6.7% |
Similar Demographics by Disability Age 5 to 17
Demographics Similar to Pennsylvania Germans by Disability Age 5 to 17
In terms of disability age 5 to 17, the demographic groups most similar to Pennsylvania Germans are Blackfeet (6.6%, a difference of 0.17%), French American Indian (6.6%, a difference of 0.23%), Potawatomi (6.5%, a difference of 0.67%), American (6.5%, a difference of 0.81%), and Dominican (6.5%, a difference of 0.86%).
| Demographics | Rating | Rank | Disability Age 5 to 17 |
| Tohono O'odham | 0.0 /100 | #321 | Tragic 6.5% |
| Slovaks | 0.0 /100 | #322 | Tragic 6.5% |
| Osage | 0.0 /100 | #323 | Tragic 6.5% |
| Dominicans | 0.0 /100 | #324 | Tragic 6.5% |
| Americans | 0.0 /100 | #325 | Tragic 6.5% |
| Potawatomi | 0.0 /100 | #326 | Tragic 6.5% |
| French American Indians | 0.0 /100 | #327 | Tragic 6.6% |
| Pennsylvania Germans | 0.0 /100 | #328 | Tragic 6.6% |
| Blackfeet | 0.0 /100 | #329 | Tragic 6.6% |
| Dutch West Indians | 0.0 /100 | #330 | Tragic 6.7% |
| French Canadians | 0.0 /100 | #331 | Tragic 6.7% |
| Immigrants | Azores | 0.0 /100 | #332 | Tragic 6.7% |
| Blacks/African Americans | 0.0 /100 | #333 | Tragic 6.8% |
| Seminole | 0.0 /100 | #334 | Tragic 6.8% |
| Ottawa | 0.0 /100 | #335 | Tragic 6.8% |
Demographics Similar to Latvians by Disability Age 5 to 17
In terms of disability age 5 to 17, the demographic groups most similar to Latvians are New Zealander (5.4%, a difference of 0.0%), Immigrants from Chile (5.4%, a difference of 0.010%), Crow (5.4%, a difference of 0.030%), Immigrants from Venezuela (5.4%, a difference of 0.11%), and Immigrants from Ethiopia (5.4%, a difference of 0.16%).
| Demographics | Rating | Rank | Disability Age 5 to 17 |
| Immigrants | Immigrants | 97.0 /100 | #120 | Exceptional 5.4% |
| Maltese | 96.0 /100 | #121 | Exceptional 5.4% |
| Chileans | 95.8 /100 | #122 | Exceptional 5.4% |
| Immigrants | Ethiopia | 95.5 /100 | #123 | Exceptional 5.4% |
| Crow | 95.0 /100 | #124 | Exceptional 5.4% |
| Immigrants | Chile | 95.0 /100 | #125 | Exceptional 5.4% |
| New Zealanders | 95.0 /100 | #126 | Exceptional 5.4% |
| Latvians | 95.0 /100 | #127 | Exceptional 5.4% |
| Immigrants | Venezuela | 94.5 /100 | #128 | Exceptional 5.4% |
| Romanians | 94.1 /100 | #129 | Exceptional 5.4% |
| Immigrants | Bulgaria | 94.0 /100 | #130 | Exceptional 5.4% |
| Arabs | 92.9 /100 | #131 | Exceptional 5.4% |
| Immigrants | Colombia | 92.9 /100 | #132 | Exceptional 5.4% |
| Venezuelans | 92.7 /100 | #133 | Exceptional 5.4% |
| Yuman | 92.3 /100 | #134 | Exceptional 5.4% |