Pennsylvania German vs Lumbee Disability Age 5 to 17
COMPARE
Pennsylvania German
Lumbee
Disability Age 5 to 17
Disability Age 5 to 17 Comparison
Pennsylvania Germans
Lumbee
6.6%
DISABILITY AGE 5 TO 17
0.0/ 100
METRIC RATING
328th/ 347
METRIC RANK
6.2%
DISABILITY AGE 5 TO 17
0.0/ 100
METRIC RATING
298th/ 347
METRIC RANK
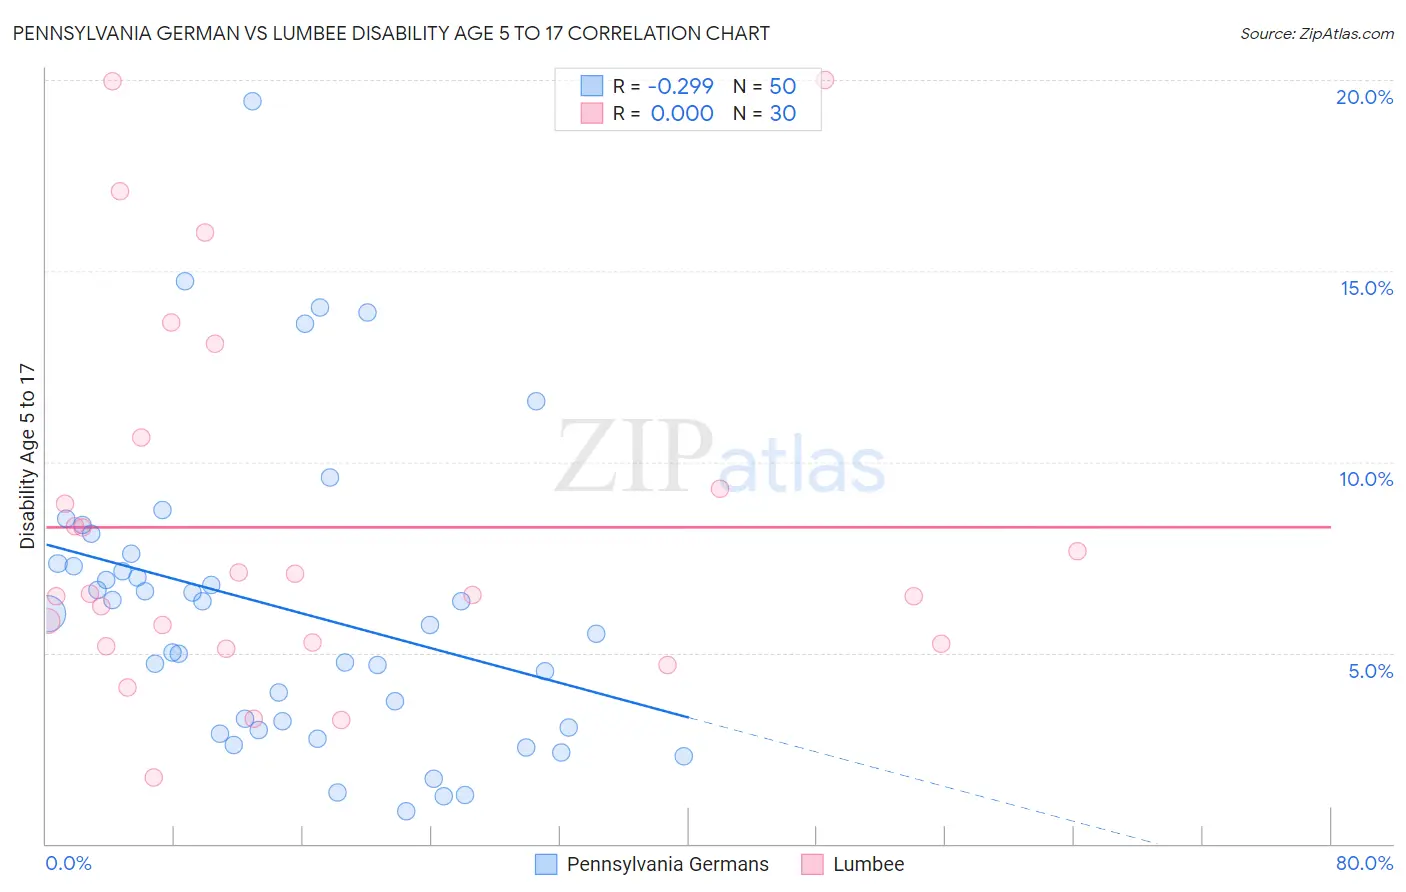
Pennsylvania German vs Lumbee Disability Age 5 to 17 Correlation Chart
The statistical analysis conducted on geographies consisting of 232,166,833 people shows a weak negative correlation between the proportion of Pennsylvania Germans and percentage of population with a disability between the ages 5 and 17 in the United States with a correlation coefficient (R) of -0.299 and weighted average of 6.6%. Similarly, the statistical analysis conducted on geographies consisting of 92,024,510 people shows no correlation between the proportion of Lumbee and percentage of population with a disability between the ages 5 and 17 in the United States with a correlation coefficient (R) of 0.000 and weighted average of 6.2%, a difference of 5.3%.
Disability Age 5 to 17 Correlation Summary
| Measurement | Pennsylvania German | Lumbee |
| Minimum | 0.86% | 1.7% |
| Maximum | 19.5% | 20.0% |
| Range | 18.6% | 18.3% |
| Mean | 6.2% | 8.3% |
| Median | 5.9% | 6.5% |
| Interquartile 25% (IQ1) | 3.1% | 5.2% |
| Interquartile 75% (IQ3) | 7.3% | 9.3% |
| Interquartile Range (IQR) | 4.3% | 4.1% |
| Standard Deviation (Sample) | 3.9% | 4.8% |
| Standard Deviation (Population) | 3.9% | 4.7% |
Similar Demographics by Disability Age 5 to 17
Demographics Similar to Pennsylvania Germans by Disability Age 5 to 17
In terms of disability age 5 to 17, the demographic groups most similar to Pennsylvania Germans are Blackfeet (6.6%, a difference of 0.17%), French American Indian (6.6%, a difference of 0.23%), Potawatomi (6.5%, a difference of 0.67%), American (6.5%, a difference of 0.81%), and Dominican (6.5%, a difference of 0.86%).
| Demographics | Rating | Rank | Disability Age 5 to 17 |
| Tohono O'odham | 0.0 /100 | #321 | Tragic 6.5% |
| Slovaks | 0.0 /100 | #322 | Tragic 6.5% |
| Osage | 0.0 /100 | #323 | Tragic 6.5% |
| Dominicans | 0.0 /100 | #324 | Tragic 6.5% |
| Americans | 0.0 /100 | #325 | Tragic 6.5% |
| Potawatomi | 0.0 /100 | #326 | Tragic 6.5% |
| French American Indians | 0.0 /100 | #327 | Tragic 6.6% |
| Pennsylvania Germans | 0.0 /100 | #328 | Tragic 6.6% |
| Blackfeet | 0.0 /100 | #329 | Tragic 6.6% |
| Dutch West Indians | 0.0 /100 | #330 | Tragic 6.7% |
| French Canadians | 0.0 /100 | #331 | Tragic 6.7% |
| Immigrants | Azores | 0.0 /100 | #332 | Tragic 6.7% |
| Blacks/African Americans | 0.0 /100 | #333 | Tragic 6.8% |
| Seminole | 0.0 /100 | #334 | Tragic 6.8% |
| Ottawa | 0.0 /100 | #335 | Tragic 6.8% |
Demographics Similar to Lumbee by Disability Age 5 to 17
In terms of disability age 5 to 17, the demographic groups most similar to Lumbee are Immigrants from Bahamas (6.2%, a difference of 0.070%), Welsh (6.3%, a difference of 0.15%), Spanish American (6.2%, a difference of 0.19%), Cree (6.2%, a difference of 0.22%), and Carpatho Rusyn (6.3%, a difference of 0.27%).
| Demographics | Rating | Rank | Disability Age 5 to 17 |
| Whites/Caucasians | 0.0 /100 | #291 | Tragic 6.2% |
| Immigrants | Senegal | 0.0 /100 | #292 | Tragic 6.2% |
| Central American Indians | 0.0 /100 | #293 | Tragic 6.2% |
| Irish | 0.0 /100 | #294 | Tragic 6.2% |
| Cree | 0.0 /100 | #295 | Tragic 6.2% |
| Spanish Americans | 0.0 /100 | #296 | Tragic 6.2% |
| Immigrants | Bahamas | 0.0 /100 | #297 | Tragic 6.2% |
| Lumbee | 0.0 /100 | #298 | Tragic 6.2% |
| Welsh | 0.0 /100 | #299 | Tragic 6.3% |
| Carpatho Rusyns | 0.0 /100 | #300 | Tragic 6.3% |
| U.S. Virgin Islanders | 0.0 /100 | #301 | Tragic 6.3% |
| Celtics | 0.0 /100 | #302 | Tragic 6.3% |
| Yakama | 0.0 /100 | #303 | Tragic 6.3% |
| Senegalese | 0.0 /100 | #304 | Tragic 6.3% |
| Natives/Alaskans | 0.0 /100 | #305 | Tragic 6.3% |