Pennsylvania German vs Immigrants from Guyana Disability Age 5 to 17
COMPARE
Pennsylvania German
Immigrants from Guyana
Disability Age 5 to 17
Disability Age 5 to 17 Comparison
Pennsylvania Germans
Immigrants from Guyana
6.6%
DISABILITY AGE 5 TO 17
0.0/ 100
METRIC RATING
328th/ 347
METRIC RANK
5.2%
DISABILITY AGE 5 TO 17
99.6/ 100
METRIC RATING
76th/ 347
METRIC RANK
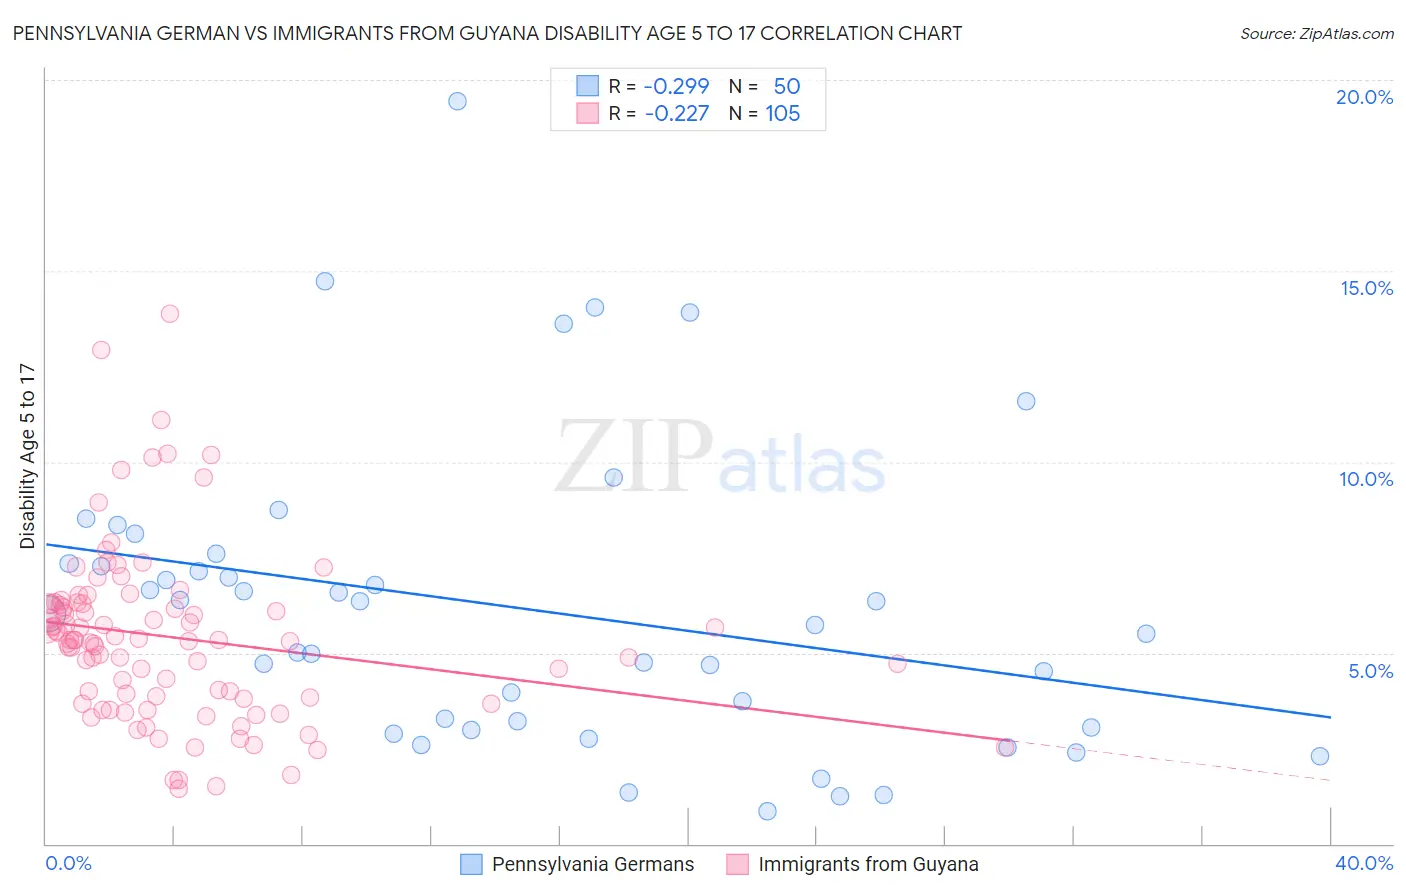
Pennsylvania German vs Immigrants from Guyana Disability Age 5 to 17 Correlation Chart
The statistical analysis conducted on geographies consisting of 232,166,833 people shows a weak negative correlation between the proportion of Pennsylvania Germans and percentage of population with a disability between the ages 5 and 17 in the United States with a correlation coefficient (R) of -0.299 and weighted average of 6.6%. Similarly, the statistical analysis conducted on geographies consisting of 183,069,872 people shows a weak negative correlation between the proportion of Immigrants from Guyana and percentage of population with a disability between the ages 5 and 17 in the United States with a correlation coefficient (R) of -0.227 and weighted average of 5.2%, a difference of 26.1%.
Disability Age 5 to 17 Correlation Summary
| Measurement | Pennsylvania German | Immigrants from Guyana |
| Minimum | 0.86% | 1.5% |
| Maximum | 19.5% | 13.9% |
| Range | 18.6% | 12.4% |
| Mean | 6.2% | 5.4% |
| Median | 5.9% | 5.3% |
| Interquartile 25% (IQ1) | 3.1% | 3.8% |
| Interquartile 75% (IQ3) | 7.3% | 6.3% |
| Interquartile Range (IQR) | 4.3% | 2.5% |
| Standard Deviation (Sample) | 3.9% | 2.3% |
| Standard Deviation (Population) | 3.9% | 2.2% |
Similar Demographics by Disability Age 5 to 17
Demographics Similar to Pennsylvania Germans by Disability Age 5 to 17
In terms of disability age 5 to 17, the demographic groups most similar to Pennsylvania Germans are Blackfeet (6.6%, a difference of 0.17%), French American Indian (6.6%, a difference of 0.23%), Potawatomi (6.5%, a difference of 0.67%), American (6.5%, a difference of 0.81%), and Dominican (6.5%, a difference of 0.86%).
| Demographics | Rating | Rank | Disability Age 5 to 17 |
| Tohono O'odham | 0.0 /100 | #321 | Tragic 6.5% |
| Slovaks | 0.0 /100 | #322 | Tragic 6.5% |
| Osage | 0.0 /100 | #323 | Tragic 6.5% |
| Dominicans | 0.0 /100 | #324 | Tragic 6.5% |
| Americans | 0.0 /100 | #325 | Tragic 6.5% |
| Potawatomi | 0.0 /100 | #326 | Tragic 6.5% |
| French American Indians | 0.0 /100 | #327 | Tragic 6.6% |
| Pennsylvania Germans | 0.0 /100 | #328 | Tragic 6.6% |
| Blackfeet | 0.0 /100 | #329 | Tragic 6.6% |
| Dutch West Indians | 0.0 /100 | #330 | Tragic 6.7% |
| French Canadians | 0.0 /100 | #331 | Tragic 6.7% |
| Immigrants | Azores | 0.0 /100 | #332 | Tragic 6.7% |
| Blacks/African Americans | 0.0 /100 | #333 | Tragic 6.8% |
| Seminole | 0.0 /100 | #334 | Tragic 6.8% |
| Ottawa | 0.0 /100 | #335 | Tragic 6.8% |
Demographics Similar to Immigrants from Guyana by Disability Age 5 to 17
In terms of disability age 5 to 17, the demographic groups most similar to Immigrants from Guyana are Immigrants from Kazakhstan (5.2%, a difference of 0.030%), Immigrants from Moldova (5.2%, a difference of 0.040%), Immigrants from Cuba (5.2%, a difference of 0.040%), Afghan (5.2%, a difference of 0.070%), and Sri Lankan (5.2%, a difference of 0.10%).
| Demographics | Rating | Rank | Disability Age 5 to 17 |
| Guyanese | 99.7 /100 | #69 | Exceptional 5.2% |
| Immigrants | Belgium | 99.7 /100 | #70 | Exceptional 5.2% |
| Jordanians | 99.7 /100 | #71 | Exceptional 5.2% |
| Immigrants | Vietnam | 99.7 /100 | #72 | Exceptional 5.2% |
| Immigrants | Czechoslovakia | 99.7 /100 | #73 | Exceptional 5.2% |
| Immigrants | Romania | 99.7 /100 | #74 | Exceptional 5.2% |
| Immigrants | Moldova | 99.6 /100 | #75 | Exceptional 5.2% |
| Immigrants | Guyana | 99.6 /100 | #76 | Exceptional 5.2% |
| Immigrants | Kazakhstan | 99.6 /100 | #77 | Exceptional 5.2% |
| Immigrants | Cuba | 99.6 /100 | #78 | Exceptional 5.2% |
| Afghans | 99.6 /100 | #79 | Exceptional 5.2% |
| Sri Lankans | 99.6 /100 | #80 | Exceptional 5.2% |
| Native Hawaiians | 99.6 /100 | #81 | Exceptional 5.2% |
| Immigrants | Sweden | 99.5 /100 | #82 | Exceptional 5.2% |
| Immigrants | France | 99.5 /100 | #83 | Exceptional 5.2% |