Pennsylvania German vs Immigrants from Kuwait Disability Age 5 to 17
COMPARE
Pennsylvania German
Immigrants from Kuwait
Disability Age 5 to 17
Disability Age 5 to 17 Comparison
Pennsylvania Germans
Immigrants from Kuwait
6.6%
DISABILITY AGE 5 TO 17
0.0/ 100
METRIC RATING
328th/ 347
METRIC RANK
5.3%
DISABILITY AGE 5 TO 17
99.4/ 100
METRIC RATING
90th/ 347
METRIC RANK
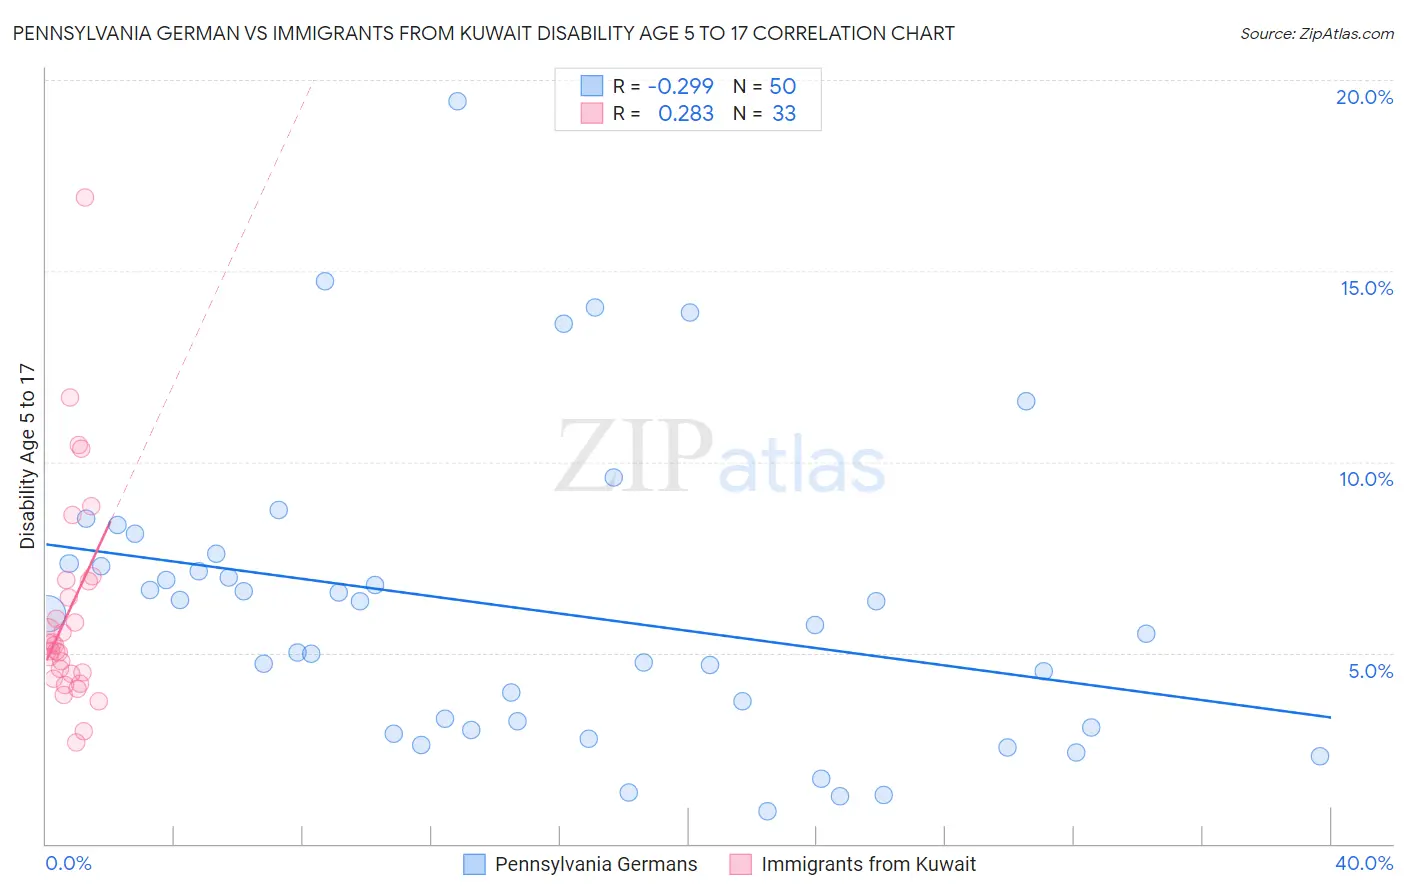
Pennsylvania German vs Immigrants from Kuwait Disability Age 5 to 17 Correlation Chart
The statistical analysis conducted on geographies consisting of 232,166,833 people shows a weak negative correlation between the proportion of Pennsylvania Germans and percentage of population with a disability between the ages 5 and 17 in the United States with a correlation coefficient (R) of -0.299 and weighted average of 6.6%. Similarly, the statistical analysis conducted on geographies consisting of 136,559,233 people shows a weak positive correlation between the proportion of Immigrants from Kuwait and percentage of population with a disability between the ages 5 and 17 in the United States with a correlation coefficient (R) of 0.283 and weighted average of 5.3%, a difference of 25.3%.
Disability Age 5 to 17 Correlation Summary
| Measurement | Pennsylvania German | Immigrants from Kuwait |
| Minimum | 0.86% | 2.7% |
| Maximum | 19.5% | 16.9% |
| Range | 18.6% | 14.3% |
| Mean | 6.2% | 6.1% |
| Median | 5.9% | 5.2% |
| Interquartile 25% (IQ1) | 3.1% | 4.4% |
| Interquartile 75% (IQ3) | 7.3% | 6.9% |
| Interquartile Range (IQR) | 4.3% | 2.5% |
| Standard Deviation (Sample) | 3.9% | 2.9% |
| Standard Deviation (Population) | 3.9% | 2.8% |
Similar Demographics by Disability Age 5 to 17
Demographics Similar to Pennsylvania Germans by Disability Age 5 to 17
In terms of disability age 5 to 17, the demographic groups most similar to Pennsylvania Germans are Blackfeet (6.6%, a difference of 0.17%), French American Indian (6.6%, a difference of 0.23%), Potawatomi (6.5%, a difference of 0.67%), American (6.5%, a difference of 0.81%), and Dominican (6.5%, a difference of 0.86%).
| Demographics | Rating | Rank | Disability Age 5 to 17 |
| Tohono O'odham | 0.0 /100 | #321 | Tragic 6.5% |
| Slovaks | 0.0 /100 | #322 | Tragic 6.5% |
| Osage | 0.0 /100 | #323 | Tragic 6.5% |
| Dominicans | 0.0 /100 | #324 | Tragic 6.5% |
| Americans | 0.0 /100 | #325 | Tragic 6.5% |
| Potawatomi | 0.0 /100 | #326 | Tragic 6.5% |
| French American Indians | 0.0 /100 | #327 | Tragic 6.6% |
| Pennsylvania Germans | 0.0 /100 | #328 | Tragic 6.6% |
| Blackfeet | 0.0 /100 | #329 | Tragic 6.6% |
| Dutch West Indians | 0.0 /100 | #330 | Tragic 6.7% |
| French Canadians | 0.0 /100 | #331 | Tragic 6.7% |
| Immigrants | Azores | 0.0 /100 | #332 | Tragic 6.7% |
| Blacks/African Americans | 0.0 /100 | #333 | Tragic 6.8% |
| Seminole | 0.0 /100 | #334 | Tragic 6.8% |
| Ottawa | 0.0 /100 | #335 | Tragic 6.8% |
Demographics Similar to Immigrants from Kuwait by Disability Age 5 to 17
In terms of disability age 5 to 17, the demographic groups most similar to Immigrants from Kuwait are Immigrants from Croatia (5.2%, a difference of 0.050%), Immigrants from Spain (5.2%, a difference of 0.050%), Eastern European (5.2%, a difference of 0.080%), Immigrants from St. Vincent and the Grenadines (5.2%, a difference of 0.13%), and Bulgarian (5.2%, a difference of 0.17%).
| Demographics | Rating | Rank | Disability Age 5 to 17 |
| Immigrants | France | 99.5 /100 | #83 | Exceptional 5.2% |
| Immigrants | Nicaragua | 99.5 /100 | #84 | Exceptional 5.2% |
| Bulgarians | 99.4 /100 | #85 | Exceptional 5.2% |
| Immigrants | St. Vincent and the Grenadines | 99.4 /100 | #86 | Exceptional 5.2% |
| Eastern Europeans | 99.4 /100 | #87 | Exceptional 5.2% |
| Immigrants | Croatia | 99.4 /100 | #88 | Exceptional 5.2% |
| Immigrants | Spain | 99.4 /100 | #89 | Exceptional 5.2% |
| Immigrants | Kuwait | 99.4 /100 | #90 | Exceptional 5.3% |
| Mongolians | 99.2 /100 | #91 | Exceptional 5.3% |
| Luxembourgers | 99.2 /100 | #92 | Exceptional 5.3% |
| Immigrants | Peru | 99.1 /100 | #93 | Exceptional 5.3% |
| Immigrants | Jordan | 99.1 /100 | #94 | Exceptional 5.3% |
| Immigrants | Grenada | 99.1 /100 | #95 | Exceptional 5.3% |
| Immigrants | El Salvador | 99.0 /100 | #96 | Exceptional 5.3% |
| Immigrants | Europe | 99.0 /100 | #97 | Exceptional 5.3% |