Pennsylvania German vs Marshallese Disability Age 5 to 17
COMPARE
Pennsylvania German
Marshallese
Disability Age 5 to 17
Disability Age 5 to 17 Comparison
Pennsylvania Germans
Marshallese
6.6%
DISABILITY AGE 5 TO 17
0.0/ 100
METRIC RATING
328th/ 347
METRIC RANK
5.7%
DISABILITY AGE 5 TO 17
28.1/ 100
METRIC RATING
188th/ 347
METRIC RANK
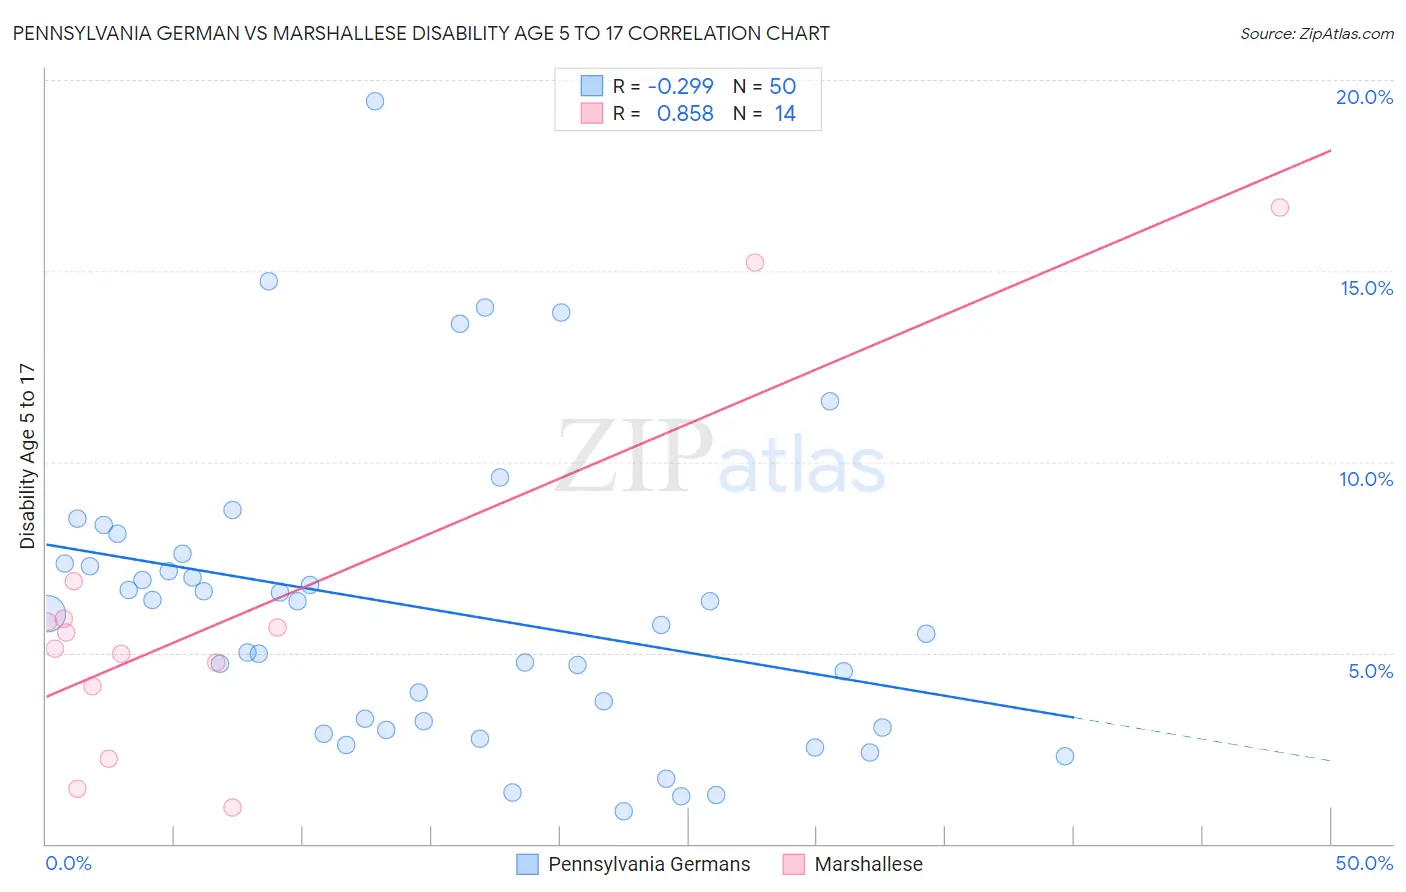
Pennsylvania German vs Marshallese Disability Age 5 to 17 Correlation Chart
The statistical analysis conducted on geographies consisting of 232,166,833 people shows a weak negative correlation between the proportion of Pennsylvania Germans and percentage of population with a disability between the ages 5 and 17 in the United States with a correlation coefficient (R) of -0.299 and weighted average of 6.6%. Similarly, the statistical analysis conducted on geographies consisting of 14,753,220 people shows a very strong positive correlation between the proportion of Marshallese and percentage of population with a disability between the ages 5 and 17 in the United States with a correlation coefficient (R) of 0.858 and weighted average of 5.7%, a difference of 16.2%.
Disability Age 5 to 17 Correlation Summary
| Measurement | Pennsylvania German | Marshallese |
| Minimum | 0.86% | 0.94% |
| Maximum | 19.5% | 16.7% |
| Range | 18.6% | 15.7% |
| Mean | 6.2% | 6.1% |
| Median | 5.9% | 5.3% |
| Interquartile 25% (IQ1) | 3.1% | 4.1% |
| Interquartile 75% (IQ3) | 7.3% | 5.9% |
| Interquartile Range (IQR) | 4.3% | 1.8% |
| Standard Deviation (Sample) | 3.9% | 4.5% |
| Standard Deviation (Population) | 3.9% | 4.4% |
Similar Demographics by Disability Age 5 to 17
Demographics Similar to Pennsylvania Germans by Disability Age 5 to 17
In terms of disability age 5 to 17, the demographic groups most similar to Pennsylvania Germans are Blackfeet (6.6%, a difference of 0.17%), French American Indian (6.6%, a difference of 0.23%), Potawatomi (6.5%, a difference of 0.67%), American (6.5%, a difference of 0.81%), and Dominican (6.5%, a difference of 0.86%).
| Demographics | Rating | Rank | Disability Age 5 to 17 |
| Tohono O'odham | 0.0 /100 | #321 | Tragic 6.5% |
| Slovaks | 0.0 /100 | #322 | Tragic 6.5% |
| Osage | 0.0 /100 | #323 | Tragic 6.5% |
| Dominicans | 0.0 /100 | #324 | Tragic 6.5% |
| Americans | 0.0 /100 | #325 | Tragic 6.5% |
| Potawatomi | 0.0 /100 | #326 | Tragic 6.5% |
| French American Indians | 0.0 /100 | #327 | Tragic 6.6% |
| Pennsylvania Germans | 0.0 /100 | #328 | Tragic 6.6% |
| Blackfeet | 0.0 /100 | #329 | Tragic 6.6% |
| Dutch West Indians | 0.0 /100 | #330 | Tragic 6.7% |
| French Canadians | 0.0 /100 | #331 | Tragic 6.7% |
| Immigrants | Azores | 0.0 /100 | #332 | Tragic 6.7% |
| Blacks/African Americans | 0.0 /100 | #333 | Tragic 6.8% |
| Seminole | 0.0 /100 | #334 | Tragic 6.8% |
| Ottawa | 0.0 /100 | #335 | Tragic 6.8% |
Demographics Similar to Marshallese by Disability Age 5 to 17
In terms of disability age 5 to 17, the demographic groups most similar to Marshallese are Pueblo (5.7%, a difference of 0.040%), Immigrants from Eastern Africa (5.7%, a difference of 0.050%), Danish (5.7%, a difference of 0.10%), Immigrants from Bosnia and Herzegovina (5.7%, a difference of 0.11%), and Immigrants from Thailand (5.7%, a difference of 0.12%).
| Demographics | Rating | Rank | Disability Age 5 to 17 |
| Immigrants | England | 36.4 /100 | #181 | Fair 5.6% |
| Mexican American Indians | 35.2 /100 | #182 | Fair 5.6% |
| Immigrants | Latin America | 34.3 /100 | #183 | Fair 5.6% |
| Syrians | 33.8 /100 | #184 | Fair 5.6% |
| Immigrants | Mexico | 33.7 /100 | #185 | Fair 5.6% |
| Fijians | 31.7 /100 | #186 | Fair 5.7% |
| Immigrants | Thailand | 30.2 /100 | #187 | Fair 5.7% |
| Marshallese | 28.1 /100 | #188 | Fair 5.7% |
| Pueblo | 27.5 /100 | #189 | Fair 5.7% |
| Immigrants | Eastern Africa | 27.3 /100 | #190 | Fair 5.7% |
| Danes | 26.5 /100 | #191 | Fair 5.7% |
| Immigrants | Bosnia and Herzegovina | 26.3 /100 | #192 | Fair 5.7% |
| Immigrants | Canada | 26.1 /100 | #193 | Fair 5.7% |
| Croatians | 23.6 /100 | #194 | Fair 5.7% |
| Immigrants | Nigeria | 23.4 /100 | #195 | Fair 5.7% |