Italian vs Immigrants from Sweden Disability Age 5 to 17
COMPARE
Italian
Immigrants from Sweden
Disability Age 5 to 17
Disability Age 5 to 17 Comparison
Italians
Immigrants from Sweden
5.9%
DISABILITY AGE 5 TO 17
1.2/ 100
METRIC RATING
255th/ 347
METRIC RANK
5.2%
DISABILITY AGE 5 TO 17
99.5/ 100
METRIC RATING
82nd/ 347
METRIC RANK
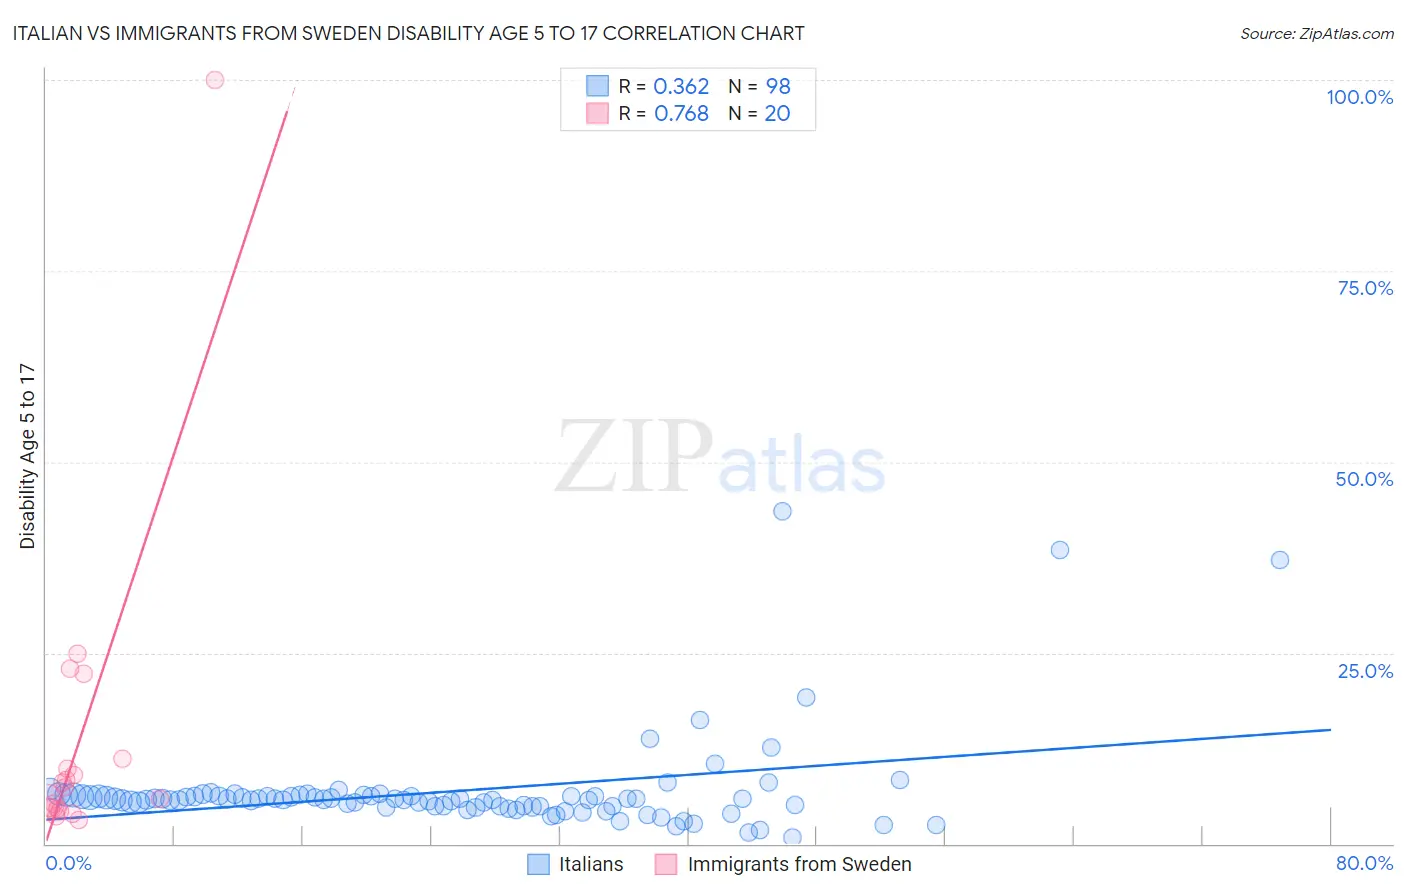
Italian vs Immigrants from Sweden Disability Age 5 to 17 Correlation Chart
The statistical analysis conducted on geographies consisting of 560,593,784 people shows a mild positive correlation between the proportion of Italians and percentage of population with a disability between the ages 5 and 17 in the United States with a correlation coefficient (R) of 0.362 and weighted average of 5.9%. Similarly, the statistical analysis conducted on geographies consisting of 163,789,898 people shows a strong positive correlation between the proportion of Immigrants from Sweden and percentage of population with a disability between the ages 5 and 17 in the United States with a correlation coefficient (R) of 0.768 and weighted average of 5.2%, a difference of 12.9%.
Disability Age 5 to 17 Correlation Summary
| Measurement | Italian | Immigrants from Sweden |
| Minimum | 0.89% | 3.1% |
| Maximum | 43.5% | 100.0% |
| Range | 42.6% | 96.9% |
| Mean | 6.9% | 13.5% |
| Median | 5.8% | 6.6% |
| Interquartile 25% (IQ1) | 4.9% | 4.7% |
| Interquartile 75% (IQ3) | 6.2% | 10.4% |
| Interquartile Range (IQR) | 1.3% | 5.8% |
| Standard Deviation (Sample) | 6.4% | 21.4% |
| Standard Deviation (Population) | 6.4% | 20.9% |
Similar Demographics by Disability Age 5 to 17
Demographics Similar to Italians by Disability Age 5 to 17
In terms of disability age 5 to 17, the demographic groups most similar to Italians are Barbadian (5.9%, a difference of 0.070%), Scandinavian (5.9%, a difference of 0.17%), Hopi (5.9%, a difference of 0.20%), Honduran (5.9%, a difference of 0.24%), and Immigrants from Cambodia (5.9%, a difference of 0.26%).
| Demographics | Rating | Rank | Disability Age 5 to 17 |
| British | 1.7 /100 | #248 | Tragic 5.9% |
| Immigrants | Ghana | 1.7 /100 | #249 | Tragic 5.9% |
| Poles | 1.5 /100 | #250 | Tragic 5.9% |
| Immigrants | Cambodia | 1.5 /100 | #251 | Tragic 5.9% |
| Hondurans | 1.5 /100 | #252 | Tragic 5.9% |
| Scandinavians | 1.4 /100 | #253 | Tragic 5.9% |
| Barbadians | 1.3 /100 | #254 | Tragic 5.9% |
| Italians | 1.2 /100 | #255 | Tragic 5.9% |
| Hopi | 1.0 /100 | #256 | Tragic 5.9% |
| Hispanics or Latinos | 1.0 /100 | #257 | Tragic 5.9% |
| Brazilians | 0.9 /100 | #258 | Tragic 5.9% |
| Slavs | 0.9 /100 | #259 | Tragic 5.9% |
| Somalis | 0.8 /100 | #260 | Tragic 5.9% |
| Immigrants | Middle Africa | 0.7 /100 | #261 | Tragic 5.9% |
| Immigrants | Western Africa | 0.7 /100 | #262 | Tragic 5.9% |
Demographics Similar to Immigrants from Sweden by Disability Age 5 to 17
In terms of disability age 5 to 17, the demographic groups most similar to Immigrants from Sweden are Immigrants from France (5.2%, a difference of 0.090%), Native Hawaiian (5.2%, a difference of 0.11%), Sri Lankan (5.2%, a difference of 0.15%), Immigrants from Nicaragua (5.2%, a difference of 0.16%), and Afghan (5.2%, a difference of 0.17%).
| Demographics | Rating | Rank | Disability Age 5 to 17 |
| Immigrants | Moldova | 99.6 /100 | #75 | Exceptional 5.2% |
| Immigrants | Guyana | 99.6 /100 | #76 | Exceptional 5.2% |
| Immigrants | Kazakhstan | 99.6 /100 | #77 | Exceptional 5.2% |
| Immigrants | Cuba | 99.6 /100 | #78 | Exceptional 5.2% |
| Afghans | 99.6 /100 | #79 | Exceptional 5.2% |
| Sri Lankans | 99.6 /100 | #80 | Exceptional 5.2% |
| Native Hawaiians | 99.6 /100 | #81 | Exceptional 5.2% |
| Immigrants | Sweden | 99.5 /100 | #82 | Exceptional 5.2% |
| Immigrants | France | 99.5 /100 | #83 | Exceptional 5.2% |
| Immigrants | Nicaragua | 99.5 /100 | #84 | Exceptional 5.2% |
| Bulgarians | 99.4 /100 | #85 | Exceptional 5.2% |
| Immigrants | St. Vincent and the Grenadines | 99.4 /100 | #86 | Exceptional 5.2% |
| Eastern Europeans | 99.4 /100 | #87 | Exceptional 5.2% |
| Immigrants | Croatia | 99.4 /100 | #88 | Exceptional 5.2% |
| Immigrants | Spain | 99.4 /100 | #89 | Exceptional 5.2% |