Immigrants from Poland vs Afghan Disability Age 5 to 17

COMPARE

Immigrants from Poland
Race
Ancestry
AfricanAlaska NativeAlaskan AthabascanAlbanianAleutAlsatianAmericanApacheArabArapahoArgentineanArmenianAssyrian/Chaldean/SyriacAustralianAustrianBahamianBangladeshiBarbadianBasqueBelgianBelizeanBermudanBhutaneseBlackfeetBolivianBrazilianBritishBritish West IndianBulgarianBurmeseCajunCambodianCanadianCape VerdeanCarpatho RusynCelticCentral AmericanCentral American IndianCherokeeCheyenneChickasawChileanChineseChippewaChoctawColombianColvilleComancheCosta RicanCreeCreekCroatianCrowCubanCypriotCzechCzechoslovakianDanishDelawareDominicanDutchDutch West IndianEastern EuropeanEcuadorianEgyptianEnglishEstonianEthiopianEuropeanFijianFilipinoFinnishFrenchFrench American IndianFrench CanadianGermanGerman RussianGhanaianGreekGuamanian/ChamorroGuatemalanGuyaneseHaitianHmongHonduranHopiHoumaHungarianIcelanderIndian (Asian)IndonesianInupiatIranianIraqiIrishIroquoisIsraeliItalianJamaicanJapaneseJordanianKenyanKiowaKoreanLaotianLatvianLebaneseLiberianLithuanianLumbeeLuxembourgerMacedonianMalaysianMalteseMarshalleseMenomineeMexicanMexican American IndianMongolianMoroccanNative HawaiianNavajoNepaleseNew ZealanderNicaraguanNigerianNorthern EuropeanNorwegianOkinawanOsageOttawaPaiutePakistaniPalestinianPanamanianParaguayanPennsylvania GermanPeruvianPimaPolishPortuguesePotawatomiPuebloPuerto RicanPuget Sound SalishRomanianRussianSalvadoranSamoanScandinavianScotch-IrishScottishSeminoleSenegaleseSerbianShoshoneSierra LeoneanSiouxSlavicSlovakSloveneSomaliSouth AfricanSouth AmericanSouth American IndianSoviet UnionSpaniardSpanishSpanish AmericanSpanish American IndianSri LankanSubsaharan AfricanSudaneseSwedishSwissSyrianTaiwaneseThaiTlingit-HaidaTohono O'OdhamTonganTrinidadian and TobagonianTsimshianTurkishU.S. Virgin IslanderUgandanUkrainianUruguayanUteVenezuelanVietnameseWelshWest IndianYakamaYaquiYugoslavianYumanYup'ikZimbabwean
Immigration
NonimmigrantsImmigrantsAfghanistanAfricaAlbaniaArgentinaArmeniaAsiaAustraliaAustriaBahamasBangladeshBarbadosBelarusBelgiumBelizeBoliviaBosnia and HerzegovinaBrazilBulgariaBurma/MyanmarCabo VerdeCambodiaCameroonCanadaCaribbeanCentral AmericaChileChinaColombiaCongoCosta RicaCroatiaCubaCzechoslovakiaDenmarkDominicaDominican RepublicEastern AfricaEastern AsiaEastern EuropeEcuadorEgyptEl SalvadorEnglandEritreaEthiopiaEuropeFijiFranceGermanyGhanaGreeceGrenadaGuatemalaGuyanaHaitiHondurasHong KongHungaryIndiaIndonesiaIranIraqIrelandIsraelItalyJamaicaJapanJordanKazakhstanKenyaKoreaKuwaitLaosLatin AmericaLatviaLebanonLiberiaLithuaniaMalaysiaMexicoMicronesiaMiddle AfricaMoldovaMoroccoNepalNetherlandsNicaraguaNigeriaNorth AmericaNorth MacedoniaNorthern AfricaNorthern EuropeNorwayOceaniaPakistanPanamaPeruPhilippinesPolandPortugalRomaniaRussiaSaudi ArabiaScotlandSenegalSerbiaSierra LeoneSingaporeSomaliaSouth AfricaSouth AmericaSouth Central AsiaSouth Eastern AsiaSouthern EuropeSpainSri LankaSt. Vincent and the GrenadinesSudanSwedenSwitzerlandSyriaTaiwanThailandTrinidad and TobagoTurkeyUgandaUkraineUruguayUzbekistanVenezuelaVietnamWest IndiesWestern AfricaWestern AsiaWestern EuropeYemenZaireZimbabweAzores
Afghan
Race
Ancestry
AfghanAfricanAlaska NativeAlaskan AthabascanAlbanianAleutAlsatianAmericanApacheArabArapahoArgentineanArmenianAssyrian/Chaldean/SyriacAustralianAustrianBahamianBangladeshiBarbadianBasqueBelgianBelizeanBermudanBhutaneseBlackfeetBolivianBrazilianBritishBritish West IndianBulgarianBurmeseCajunCambodianCanadianCape VerdeanCarpatho RusynCelticCentral AmericanCentral American IndianCherokeeCheyenneChickasawChileanChineseChippewaChoctawColombianColvilleComancheCosta RicanCreeCreekCroatianCrowCubanCypriotCzechCzechoslovakianDanishDelawareDominicanDutchDutch West IndianEastern EuropeanEcuadorianEgyptianEnglishEstonianEthiopianEuropeanFijianFilipinoFinnishFrenchFrench American IndianFrench CanadianGermanGerman RussianGhanaianGreekGuamanian/ChamorroGuatemalanGuyaneseHaitianHmongHonduranHopiHoumaHungarianIcelanderIndian (Asian)IndonesianInupiatIranianIraqiIrishIroquoisIsraeliItalianJamaicanJapaneseJordanianKenyanKiowaKoreanLaotianLatvianLebaneseLiberianLithuanianLumbeeLuxembourgerMacedonianMalaysianMalteseMarshalleseMenomineeMexicanMexican American IndianMongolianMoroccanNative HawaiianNavajoNepaleseNew ZealanderNicaraguanNigerianNorthern EuropeanNorwegianOkinawanOsageOttawaPaiutePakistaniPalestinianPanamanianParaguayanPennsylvania GermanPeruvianPimaPolishPortuguesePotawatomiPuebloPuerto RicanPuget Sound SalishRomanianRussianSalvadoranSamoanScandinavianScotch-IrishScottishSeminoleSenegaleseSerbianShoshoneSierra LeoneanSiouxSlavicSlovakSloveneSomaliSouth AfricanSouth AmericanSouth American IndianSoviet UnionSpaniardSpanishSpanish AmericanSpanish American IndianSri LankanSubsaharan AfricanSudaneseSwedishSwissSyrianTaiwaneseThaiTlingit-HaidaTohono O'OdhamTonganTrinidadian and TobagonianTsimshianTurkishU.S. Virgin IslanderUgandanUkrainianUruguayanUteVenezuelanVietnameseWelshWest IndianYakamaYaquiYugoslavianYumanYup'ikZimbabwean
Immigration
NonimmigrantsImmigrantsAfghanistanAfricaAlbaniaArgentinaArmeniaAsiaAustraliaAustriaBahamasBangladeshBarbadosBelarusBelgiumBelizeBoliviaBosnia and HerzegovinaBrazilBulgariaBurma/MyanmarCabo VerdeCambodiaCameroonCanadaCaribbeanCentral AmericaChileChinaColombiaCongoCosta RicaCroatiaCubaCzechoslovakiaDenmarkDominicaDominican RepublicEastern AfricaEastern AsiaEastern EuropeEcuadorEgyptEl SalvadorEnglandEritreaEthiopiaEuropeFijiFranceGermanyGhanaGreeceGrenadaGuatemalaGuyanaHaitiHondurasHong KongHungaryIndiaIndonesiaIranIraqIrelandIsraelItalyJamaicaJapanJordanKazakhstanKenyaKoreaKuwaitLaosLatin AmericaLatviaLebanonLiberiaLithuaniaMalaysiaMexicoMicronesiaMiddle AfricaMoldovaMoroccoNepalNetherlandsNicaraguaNigeriaNorth AmericaNorth MacedoniaNorthern AfricaNorthern EuropeNorwayOceaniaPakistanPanamaPeruPhilippinesPortugalRomaniaRussiaSaudi ArabiaScotlandSenegalSerbiaSierra LeoneSingaporeSomaliaSouth AfricaSouth AmericaSouth Central AsiaSouth Eastern AsiaSouthern EuropeSpainSri LankaSt. Vincent and the GrenadinesSudanSwedenSwitzerlandSyriaTaiwanThailandTrinidad and TobagoTurkeyUgandaUkraineUruguayUzbekistanVenezuelaVietnamWest IndiesWestern AfricaWestern AsiaWestern EuropeYemenZaireZimbabweAzores
Disability Age 5 to 17
Income
Poverty
Unemployment
Labor Participation
Family Structure
Vehicle Availability
Education Level
Disability

Disability Age 5 to 17 Comparison

Immigrants from Poland

Afghans

Exceptional
Exceptional
5.1%
DISABILITY AGE 5 TO 17
99.9/ 100
METRIC RATING
57th/ 347
METRIC RANK
5.2%
DISABILITY AGE 5 TO 17
99.6/ 100
METRIC RATING
79th/ 347
METRIC RANK

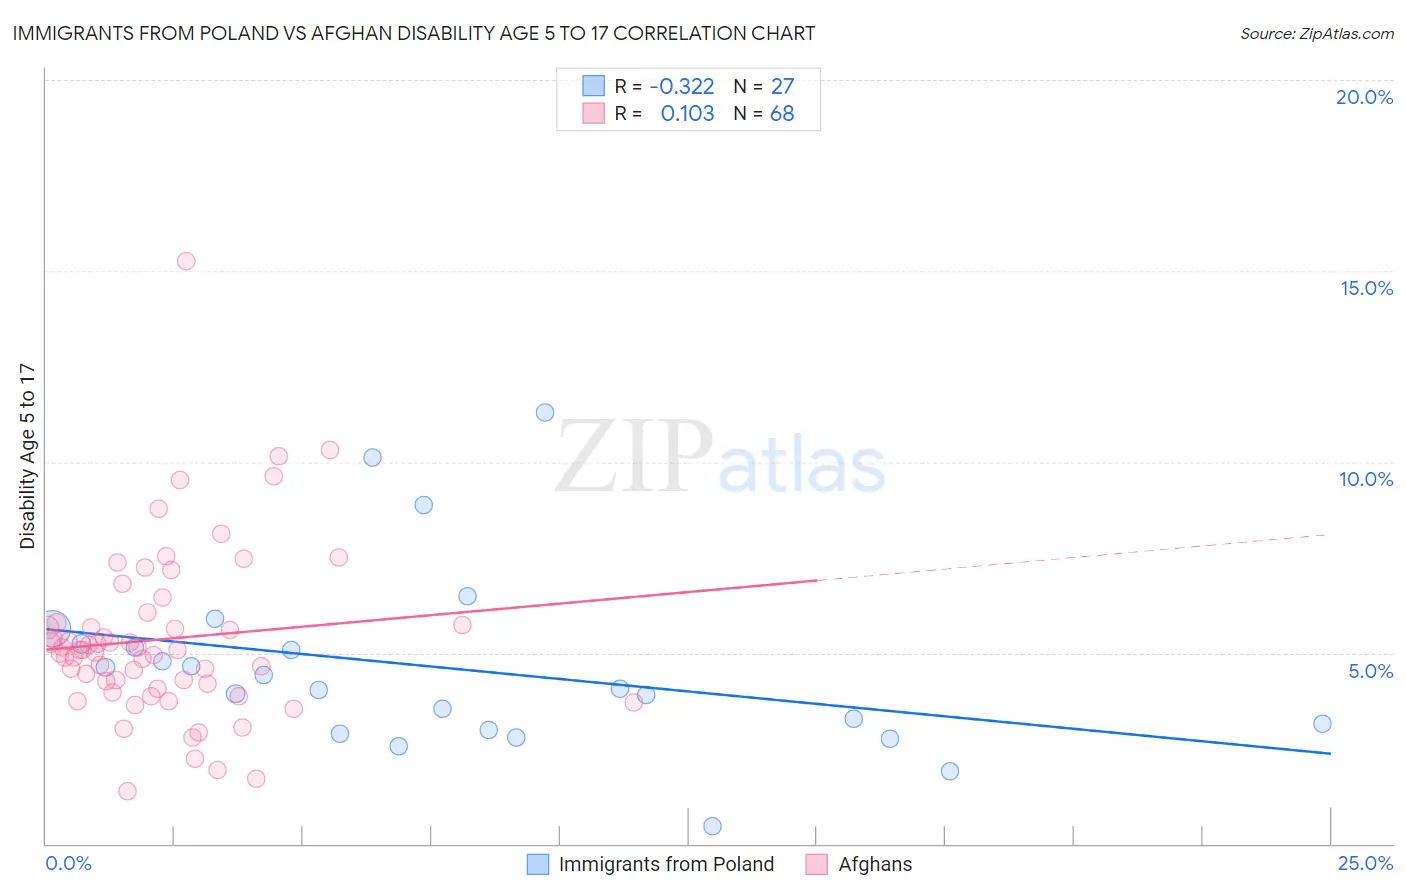
Immigrants from Poland vs Afghan Disability Age 5 to 17 Correlation Chart

The statistical analysis conducted on geographies consisting of 302,444,917 people shows a mild negative correlation between the proportion of Immigrants from Poland and percentage of population with a disability between the ages 5 and 17 in the United States with a correlation coefficient (R) of -0.322 and weighted average of 5.1%. Similarly, the statistical analysis conducted on geographies consisting of 148,469,527 people shows a poor positive correlation between the proportion of Afghans and percentage of population with a disability between the ages 5 and 17 in the United States with a correlation coefficient (R) of 0.103 and weighted average of 5.2%, a difference of 2.0%.
Immigrants from Poland vs Afghan Disability Age 5 to 17

Disability Age 5 to 17 Correlation Summary

MeasurementImmigrants from PolandAfghan
Minimum0.46%1.4%
Maximum11.3%15.2%
Range10.8%13.9%
Mean4.6%5.4%
Median4.1%5.1%
Interquartile 25% (IQ1)3.0%4.1%
Interquartile 75% (IQ3)5.2%5.8%
Interquartile Range (IQR)2.3%1.6%
Standard Deviation (Sample)2.4%2.2%
Standard Deviation (Population)2.3%2.2%

Similar Demographics by Disability Age 5 to 17

Demographics Similar to Immigrants from Poland by Disability Age 5 to 17

In terms of disability age 5 to 17, the demographic groups most similar to Immigrants from Poland are Immigrants from Ukraine (5.1%, a difference of 0.090%), Immigrants from Turkey (5.1%, a difference of 0.14%), Laotian (5.1%, a difference of 0.16%), Paraguayan (5.1%, a difference of 0.20%), and Immigrants from Lithuania (5.1%, a difference of 0.23%).
DemographicsRating | RankDisability Age 5 to 17
Argentineans
99.9
/100
|
#50
Exceptional
5.1%
Turks
99.9
/100
|
#51
Exceptional
5.1%
Immigrants | Fiji
99.9
/100
|
#52
Exceptional
5.1%
Immigrants | Lithuania
99.9
/100
|
#53
Exceptional
5.1%
Paraguayans
99.9
/100
|
#54
Exceptional
5.1%
Laotians
99.9
/100
|
#55
Exceptional
5.1%
Immigrants | Turkey
99.9
/100
|
#56
Exceptional
5.1%
Immigrants | Poland
99.9
/100
|
#57
Exceptional
5.1%
Immigrants | Ukraine
99.9
/100
|
#58
Exceptional
5.1%
Immigrants | North Macedonia
99.9
/100
|
#59
Exceptional
5.1%
Immigrants | Eastern Europe
99.9
/100
|
#60
Exceptional
5.1%
Immigrants | Switzerland
99.8
/100
|
#61
Exceptional
5.2%
Immigrants | Ireland
99.8
/100
|
#62
Exceptional
5.2%
Immigrants | Bangladesh
99.8
/100
|
#63
Exceptional
5.2%
Immigrants | South Eastern Asia
99.8
/100
|
#64
Exceptional
5.2%

Demographics Similar to Afghans by Disability Age 5 to 17

In terms of disability age 5 to 17, the demographic groups most similar to Afghans are Sri Lankan (5.2%, a difference of 0.020%), Immigrants from Cuba (5.2%, a difference of 0.040%), Immigrants from Kazakhstan (5.2%, a difference of 0.050%), Immigrants from Guyana (5.2%, a difference of 0.070%), and Native Hawaiian (5.2%, a difference of 0.070%).
DemographicsRating | RankDisability Age 5 to 17
Immigrants | Vietnam
99.7
/100
|
#72
Exceptional
5.2%
Immigrants | Czechoslovakia
99.7
/100
|
#73
Exceptional
5.2%
Immigrants | Romania
99.7
/100
|
#74
Exceptional
5.2%
Immigrants | Moldova
99.6
/100
|
#75
Exceptional
5.2%
Immigrants | Guyana
99.6
/100
|
#76
Exceptional
5.2%
Immigrants | Kazakhstan
99.6
/100
|
#77
Exceptional
5.2%
Immigrants | Cuba
99.6
/100
|
#78
Exceptional
5.2%
Afghans
99.6
/100
|
#79
Exceptional
5.2%
Sri Lankans
99.6
/100
|
#80
Exceptional
5.2%
Native Hawaiians
99.6
/100
|
#81
Exceptional
5.2%
Immigrants | Sweden
99.5
/100
|
#82
Exceptional
5.2%
Immigrants | France
99.5
/100
|
#83
Exceptional
5.2%
Immigrants | Nicaragua
99.5
/100
|
#84
Exceptional
5.2%
Bulgarians
99.4
/100
|
#85
Exceptional
5.2%
Immigrants | St. Vincent and the Grenadines
99.4
/100
|
#86
Exceptional
5.2%