Immigrants from Poland vs Immigrants from Kenya Disability Age 5 to 17
COMPARE
Immigrants from Poland
Immigrants from Kenya
Disability Age 5 to 17
Disability Age 5 to 17 Comparison
Immigrants from Poland
Immigrants from Kenya
5.1%
DISABILITY AGE 5 TO 17
99.9/ 100
METRIC RATING
57th/ 347
METRIC RANK
5.8%
DISABILITY AGE 5 TO 17
3.4/ 100
METRIC RATING
234th/ 347
METRIC RANK
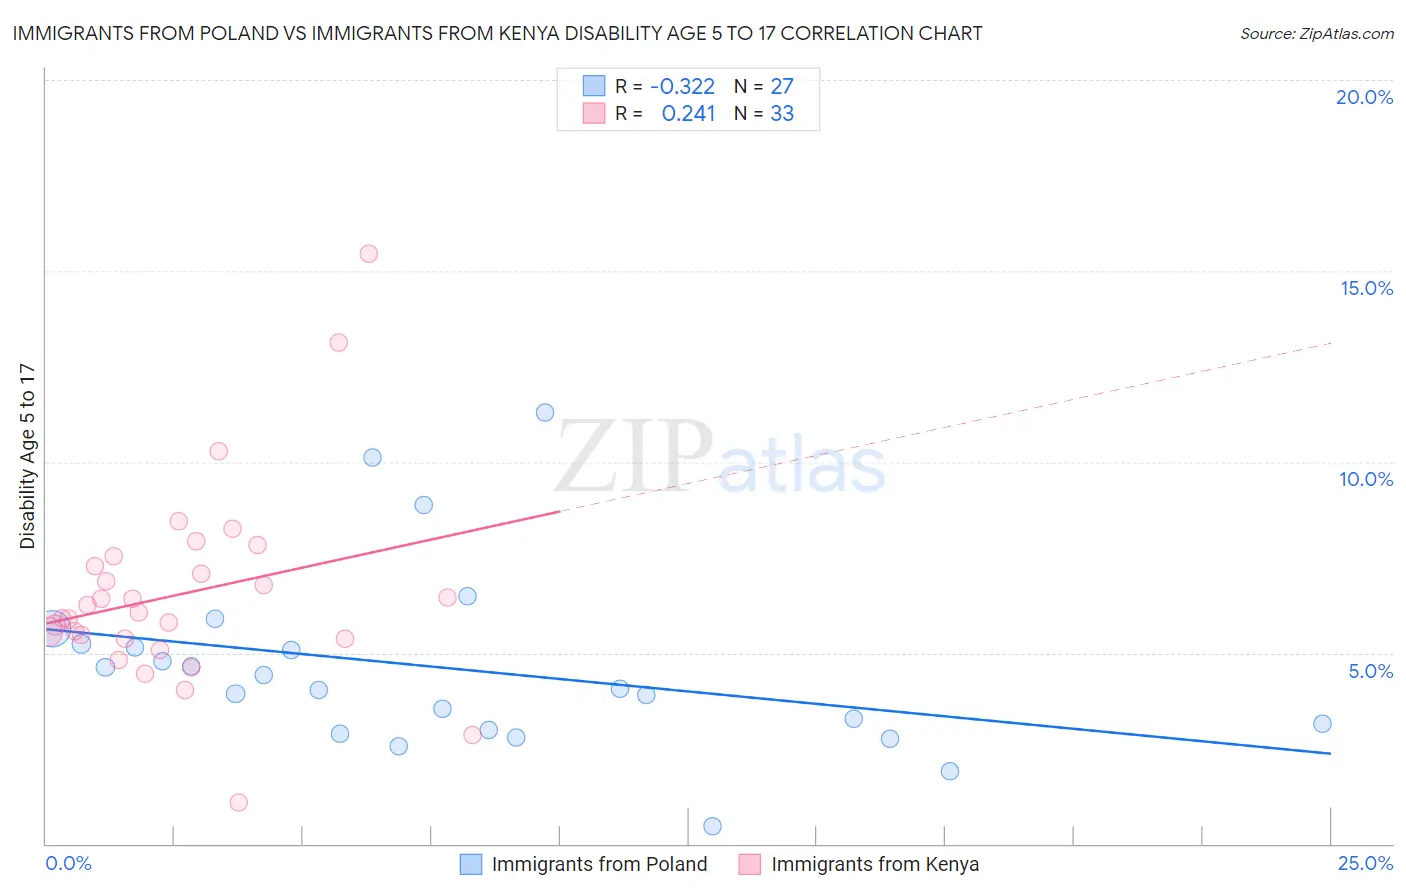
Immigrants from Poland vs Immigrants from Kenya Disability Age 5 to 17 Correlation Chart
The statistical analysis conducted on geographies consisting of 302,444,917 people shows a mild negative correlation between the proportion of Immigrants from Poland and percentage of population with a disability between the ages 5 and 17 in the United States with a correlation coefficient (R) of -0.322 and weighted average of 5.1%. Similarly, the statistical analysis conducted on geographies consisting of 217,149,676 people shows a weak positive correlation between the proportion of Immigrants from Kenya and percentage of population with a disability between the ages 5 and 17 in the United States with a correlation coefficient (R) of 0.241 and weighted average of 5.8%, a difference of 13.9%.
Disability Age 5 to 17 Correlation Summary
| Measurement | Immigrants from Poland | Immigrants from Kenya |
| Minimum | 0.46% | 1.1% |
| Maximum | 11.3% | 15.4% |
| Range | 10.8% | 14.4% |
| Mean | 4.6% | 6.5% |
| Median | 4.1% | 6.0% |
| Interquartile 25% (IQ1) | 3.0% | 5.4% |
| Interquartile 75% (IQ3) | 5.2% | 7.4% |
| Interquartile Range (IQR) | 2.3% | 2.0% |
| Standard Deviation (Sample) | 2.4% | 2.6% |
| Standard Deviation (Population) | 2.3% | 2.6% |
Similar Demographics by Disability Age 5 to 17
Demographics Similar to Immigrants from Poland by Disability Age 5 to 17
In terms of disability age 5 to 17, the demographic groups most similar to Immigrants from Poland are Immigrants from Ukraine (5.1%, a difference of 0.090%), Immigrants from Turkey (5.1%, a difference of 0.14%), Laotian (5.1%, a difference of 0.16%), Paraguayan (5.1%, a difference of 0.20%), and Immigrants from Lithuania (5.1%, a difference of 0.23%).
| Demographics | Rating | Rank | Disability Age 5 to 17 |
| Argentineans | 99.9 /100 | #50 | Exceptional 5.1% |
| Turks | 99.9 /100 | #51 | Exceptional 5.1% |
| Immigrants | Fiji | 99.9 /100 | #52 | Exceptional 5.1% |
| Immigrants | Lithuania | 99.9 /100 | #53 | Exceptional 5.1% |
| Paraguayans | 99.9 /100 | #54 | Exceptional 5.1% |
| Laotians | 99.9 /100 | #55 | Exceptional 5.1% |
| Immigrants | Turkey | 99.9 /100 | #56 | Exceptional 5.1% |
| Immigrants | Poland | 99.9 /100 | #57 | Exceptional 5.1% |
| Immigrants | Ukraine | 99.9 /100 | #58 | Exceptional 5.1% |
| Immigrants | North Macedonia | 99.9 /100 | #59 | Exceptional 5.1% |
| Immigrants | Eastern Europe | 99.9 /100 | #60 | Exceptional 5.1% |
| Immigrants | Switzerland | 99.8 /100 | #61 | Exceptional 5.2% |
| Immigrants | Ireland | 99.8 /100 | #62 | Exceptional 5.2% |
| Immigrants | Bangladesh | 99.8 /100 | #63 | Exceptional 5.2% |
| Immigrants | South Eastern Asia | 99.8 /100 | #64 | Exceptional 5.2% |
Demographics Similar to Immigrants from Kenya by Disability Age 5 to 17
In terms of disability age 5 to 17, the demographic groups most similar to Immigrants from Kenya are Malaysian (5.8%, a difference of 0.010%), Immigrants from West Indies (5.8%, a difference of 0.040%), Immigrants from Brazil (5.8%, a difference of 0.070%), Immigrants from Laos (5.8%, a difference of 0.13%), and Sudanese (5.8%, a difference of 0.22%).
| Demographics | Rating | Rank | Disability Age 5 to 17 |
| Swiss | 5.1 /100 | #227 | Tragic 5.8% |
| Haitians | 4.8 /100 | #228 | Tragic 5.8% |
| Bangladeshis | 4.8 /100 | #229 | Tragic 5.8% |
| Ghanaians | 4.7 /100 | #230 | Tragic 5.8% |
| Europeans | 4.5 /100 | #231 | Tragic 5.8% |
| Immigrants | Laos | 3.8 /100 | #232 | Tragic 5.8% |
| Immigrants | West Indies | 3.5 /100 | #233 | Tragic 5.8% |
| Immigrants | Kenya | 3.4 /100 | #234 | Tragic 5.8% |
| Malaysians | 3.4 /100 | #235 | Tragic 5.8% |
| Immigrants | Brazil | 3.2 /100 | #236 | Tragic 5.8% |
| Sudanese | 2.9 /100 | #237 | Tragic 5.8% |
| Hungarians | 2.6 /100 | #238 | Tragic 5.8% |
| German Russians | 2.4 /100 | #239 | Tragic 5.9% |
| West Indians | 2.4 /100 | #240 | Tragic 5.9% |
| Immigrants | Caribbean | 2.1 /100 | #241 | Tragic 5.9% |