Honduran vs Ugandan Disability Age 5 to 17
COMPARE
Honduran
Ugandan
Disability Age 5 to 17
Disability Age 5 to 17 Comparison
Hondurans
Ugandans
5.9%
DISABILITY AGE 5 TO 17
1.5/ 100
METRIC RATING
252nd/ 347
METRIC RANK
6.2%
DISABILITY AGE 5 TO 17
0.0/ 100
METRIC RATING
283rd/ 347
METRIC RANK
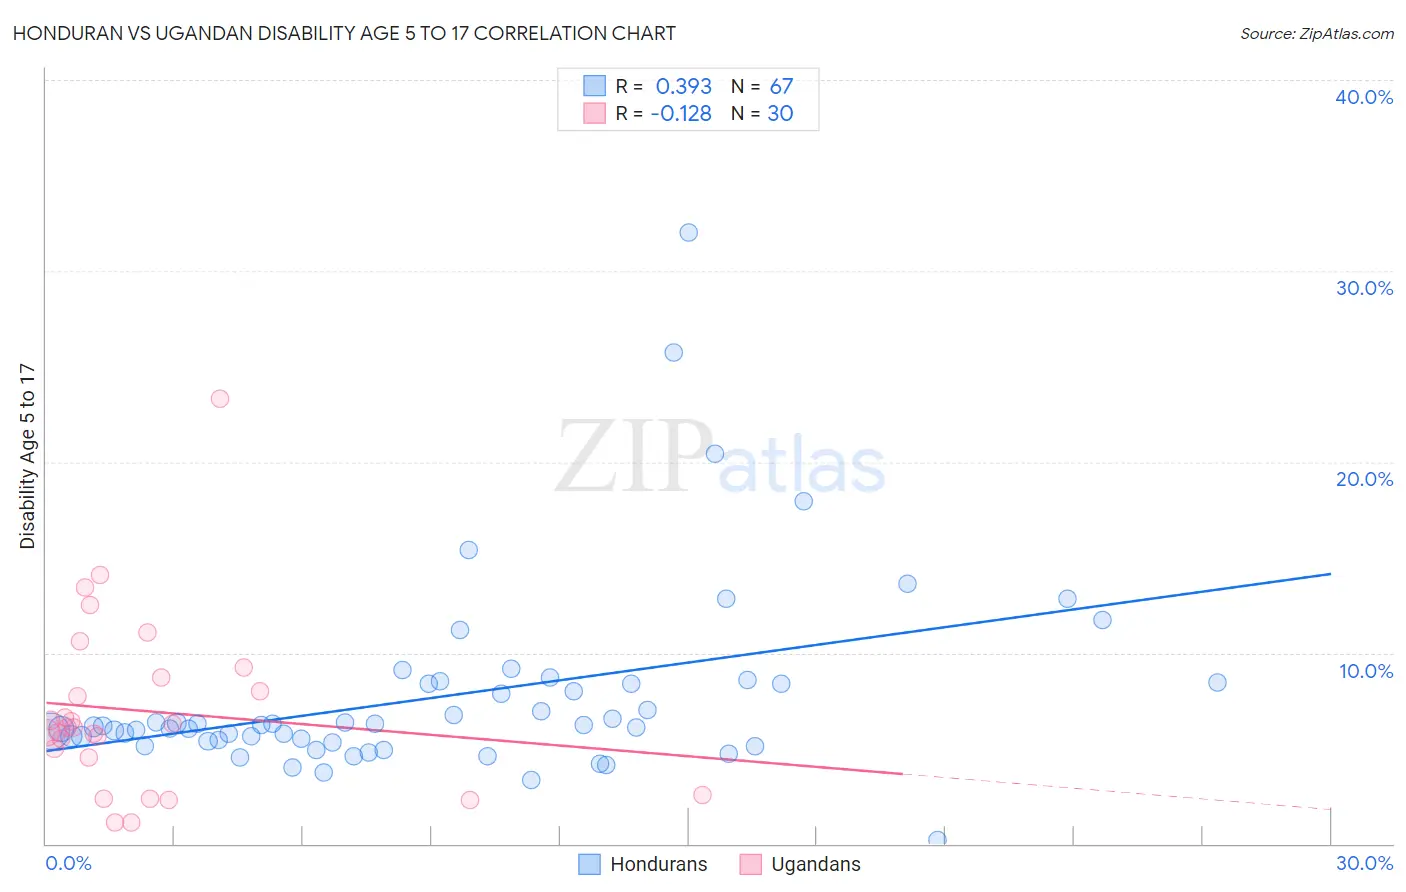
Honduran vs Ugandan Disability Age 5 to 17 Correlation Chart
The statistical analysis conducted on geographies consisting of 355,946,713 people shows a mild positive correlation between the proportion of Hondurans and percentage of population with a disability between the ages 5 and 17 in the United States with a correlation coefficient (R) of 0.393 and weighted average of 5.9%. Similarly, the statistical analysis conducted on geographies consisting of 93,800,816 people shows a poor negative correlation between the proportion of Ugandans and percentage of population with a disability between the ages 5 and 17 in the United States with a correlation coefficient (R) of -0.128 and weighted average of 6.2%, a difference of 4.5%.
Disability Age 5 to 17 Correlation Summary
| Measurement | Honduran | Ugandan |
| Minimum | 0.17% | 1.1% |
| Maximum | 32.0% | 23.3% |
| Range | 31.8% | 22.2% |
| Mean | 7.7% | 7.0% |
| Median | 6.2% | 6.1% |
| Interquartile 25% (IQ1) | 5.4% | 4.5% |
| Interquartile 75% (IQ3) | 8.4% | 8.7% |
| Interquartile Range (IQR) | 3.0% | 4.2% |
| Standard Deviation (Sample) | 5.0% | 4.6% |
| Standard Deviation (Population) | 5.0% | 4.6% |
Similar Demographics by Disability Age 5 to 17
Demographics Similar to Hondurans by Disability Age 5 to 17
In terms of disability age 5 to 17, the demographic groups most similar to Hondurans are Immigrants from Cambodia (5.9%, a difference of 0.020%), Polish (5.9%, a difference of 0.040%), Scandinavian (5.9%, a difference of 0.070%), Immigrants from Ghana (5.9%, a difference of 0.16%), and Barbadian (5.9%, a difference of 0.17%).
| Demographics | Rating | Rank | Disability Age 5 to 17 |
| Immigrants | Micronesia | 1.9 /100 | #245 | Tragic 5.9% |
| Tlingit-Haida | 1.9 /100 | #246 | Tragic 5.9% |
| Immigrants | Honduras | 1.8 /100 | #247 | Tragic 5.9% |
| British | 1.7 /100 | #248 | Tragic 5.9% |
| Immigrants | Ghana | 1.7 /100 | #249 | Tragic 5.9% |
| Poles | 1.5 /100 | #250 | Tragic 5.9% |
| Immigrants | Cambodia | 1.5 /100 | #251 | Tragic 5.9% |
| Hondurans | 1.5 /100 | #252 | Tragic 5.9% |
| Scandinavians | 1.4 /100 | #253 | Tragic 5.9% |
| Barbadians | 1.3 /100 | #254 | Tragic 5.9% |
| Italians | 1.2 /100 | #255 | Tragic 5.9% |
| Hopi | 1.0 /100 | #256 | Tragic 5.9% |
| Hispanics or Latinos | 1.0 /100 | #257 | Tragic 5.9% |
| Brazilians | 0.9 /100 | #258 | Tragic 5.9% |
| Slavs | 0.9 /100 | #259 | Tragic 5.9% |
Demographics Similar to Ugandans by Disability Age 5 to 17
In terms of disability age 5 to 17, the demographic groups most similar to Ugandans are Subsaharan African (6.2%, a difference of 0.030%), English (6.2%, a difference of 0.030%), Colville (6.2%, a difference of 0.070%), German (6.1%, a difference of 0.16%), and Pima (6.2%, a difference of 0.26%).
| Demographics | Rating | Rank | Disability Age 5 to 17 |
| Japanese | 0.1 /100 | #276 | Tragic 6.1% |
| Puget Sound Salish | 0.1 /100 | #277 | Tragic 6.1% |
| Immigrants | Liberia | 0.1 /100 | #278 | Tragic 6.1% |
| Immigrants | Jamaica | 0.1 /100 | #279 | Tragic 6.1% |
| Portuguese | 0.1 /100 | #280 | Tragic 6.1% |
| Scottish | 0.0 /100 | #281 | Tragic 6.1% |
| Germans | 0.0 /100 | #282 | Tragic 6.1% |
| Ugandans | 0.0 /100 | #283 | Tragic 6.2% |
| Sub-Saharan Africans | 0.0 /100 | #284 | Tragic 6.2% |
| English | 0.0 /100 | #285 | Tragic 6.2% |
| Colville | 0.0 /100 | #286 | Tragic 6.2% |
| Pima | 0.0 /100 | #287 | Tragic 6.2% |
| Jamaicans | 0.0 /100 | #288 | Tragic 6.2% |
| Yaqui | 0.0 /100 | #289 | Tragic 6.2% |
| Immigrants | Congo | 0.0 /100 | #290 | Tragic 6.2% |