Honduran vs Immigrants from Nigeria Disability Age 5 to 17
COMPARE
Honduran
Immigrants from Nigeria
Disability Age 5 to 17
Disability Age 5 to 17 Comparison
Hondurans
Immigrants from Nigeria
5.9%
DISABILITY AGE 5 TO 17
1.5/ 100
METRIC RATING
252nd/ 347
METRIC RANK
5.7%
DISABILITY AGE 5 TO 17
23.4/ 100
METRIC RATING
195th/ 347
METRIC RANK
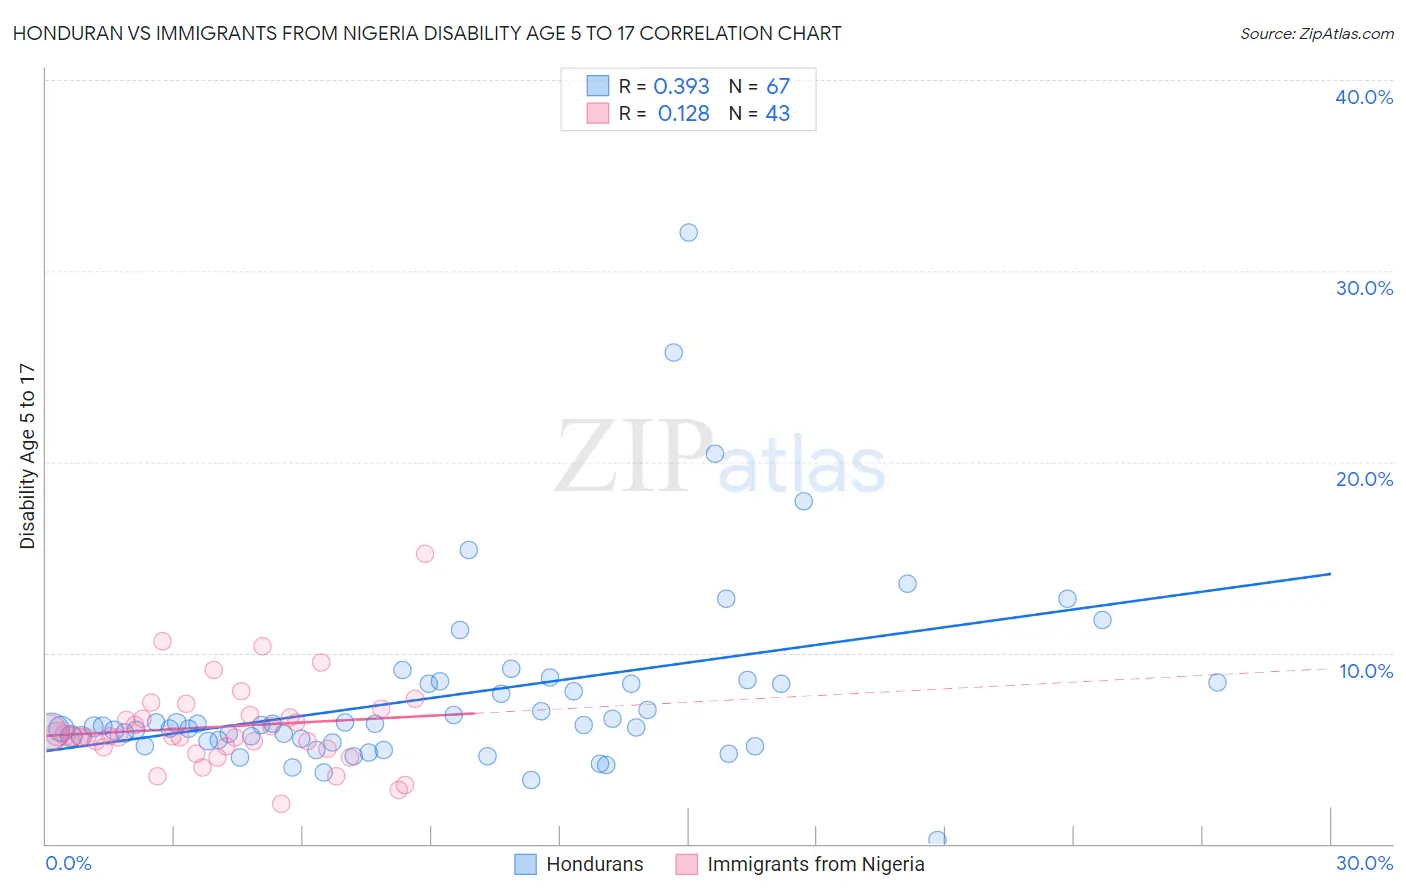
Honduran vs Immigrants from Nigeria Disability Age 5 to 17 Correlation Chart
The statistical analysis conducted on geographies consisting of 355,946,713 people shows a mild positive correlation between the proportion of Hondurans and percentage of population with a disability between the ages 5 and 17 in the United States with a correlation coefficient (R) of 0.393 and weighted average of 5.9%. Similarly, the statistical analysis conducted on geographies consisting of 282,146,479 people shows a poor positive correlation between the proportion of Immigrants from Nigeria and percentage of population with a disability between the ages 5 and 17 in the United States with a correlation coefficient (R) of 0.128 and weighted average of 5.7%, a difference of 3.7%.
Disability Age 5 to 17 Correlation Summary
| Measurement | Honduran | Immigrants from Nigeria |
| Minimum | 0.17% | 2.1% |
| Maximum | 32.0% | 15.2% |
| Range | 31.8% | 13.1% |
| Mean | 7.7% | 6.1% |
| Median | 6.2% | 5.6% |
| Interquartile 25% (IQ1) | 5.4% | 5.0% |
| Interquartile 75% (IQ3) | 8.4% | 6.8% |
| Interquartile Range (IQR) | 3.0% | 1.7% |
| Standard Deviation (Sample) | 5.0% | 2.3% |
| Standard Deviation (Population) | 5.0% | 2.3% |
Similar Demographics by Disability Age 5 to 17
Demographics Similar to Hondurans by Disability Age 5 to 17
In terms of disability age 5 to 17, the demographic groups most similar to Hondurans are Immigrants from Cambodia (5.9%, a difference of 0.020%), Polish (5.9%, a difference of 0.040%), Scandinavian (5.9%, a difference of 0.070%), Immigrants from Ghana (5.9%, a difference of 0.16%), and Barbadian (5.9%, a difference of 0.17%).
| Demographics | Rating | Rank | Disability Age 5 to 17 |
| Immigrants | Micronesia | 1.9 /100 | #245 | Tragic 5.9% |
| Tlingit-Haida | 1.9 /100 | #246 | Tragic 5.9% |
| Immigrants | Honduras | 1.8 /100 | #247 | Tragic 5.9% |
| British | 1.7 /100 | #248 | Tragic 5.9% |
| Immigrants | Ghana | 1.7 /100 | #249 | Tragic 5.9% |
| Poles | 1.5 /100 | #250 | Tragic 5.9% |
| Immigrants | Cambodia | 1.5 /100 | #251 | Tragic 5.9% |
| Hondurans | 1.5 /100 | #252 | Tragic 5.9% |
| Scandinavians | 1.4 /100 | #253 | Tragic 5.9% |
| Barbadians | 1.3 /100 | #254 | Tragic 5.9% |
| Italians | 1.2 /100 | #255 | Tragic 5.9% |
| Hopi | 1.0 /100 | #256 | Tragic 5.9% |
| Hispanics or Latinos | 1.0 /100 | #257 | Tragic 5.9% |
| Brazilians | 0.9 /100 | #258 | Tragic 5.9% |
| Slavs | 0.9 /100 | #259 | Tragic 5.9% |
Demographics Similar to Immigrants from Nigeria by Disability Age 5 to 17
In terms of disability age 5 to 17, the demographic groups most similar to Immigrants from Nigeria are Croatian (5.7%, a difference of 0.010%), Inupiat (5.7%, a difference of 0.010%), Immigrants from North America (5.7%, a difference of 0.020%), Immigrants from Canada (5.7%, a difference of 0.17%), and Norwegian (5.7%, a difference of 0.18%).
| Demographics | Rating | Rank | Disability Age 5 to 17 |
| Marshallese | 28.1 /100 | #188 | Fair 5.7% |
| Pueblo | 27.5 /100 | #189 | Fair 5.7% |
| Immigrants | Eastern Africa | 27.3 /100 | #190 | Fair 5.7% |
| Danes | 26.5 /100 | #191 | Fair 5.7% |
| Immigrants | Bosnia and Herzegovina | 26.3 /100 | #192 | Fair 5.7% |
| Immigrants | Canada | 26.1 /100 | #193 | Fair 5.7% |
| Croatians | 23.6 /100 | #194 | Fair 5.7% |
| Immigrants | Nigeria | 23.4 /100 | #195 | Fair 5.7% |
| Inupiat | 23.3 /100 | #196 | Fair 5.7% |
| Immigrants | North America | 23.1 /100 | #197 | Fair 5.7% |
| Norwegians | 20.9 /100 | #198 | Fair 5.7% |
| Northern Europeans | 15.2 /100 | #199 | Poor 5.7% |
| Icelanders | 14.6 /100 | #200 | Poor 5.7% |
| Basques | 13.7 /100 | #201 | Poor 5.7% |
| Austrians | 13.2 /100 | #202 | Poor 5.7% |