Honduran vs British West Indian Disability Age 5 to 17
COMPARE
Honduran
British West Indian
Disability Age 5 to 17
Disability Age 5 to 17 Comparison
Hondurans
British West Indians
5.9%
DISABILITY AGE 5 TO 17
1.5/ 100
METRIC RATING
252nd/ 347
METRIC RANK
5.8%
DISABILITY AGE 5 TO 17
5.4/ 100
METRIC RATING
226th/ 347
METRIC RANK
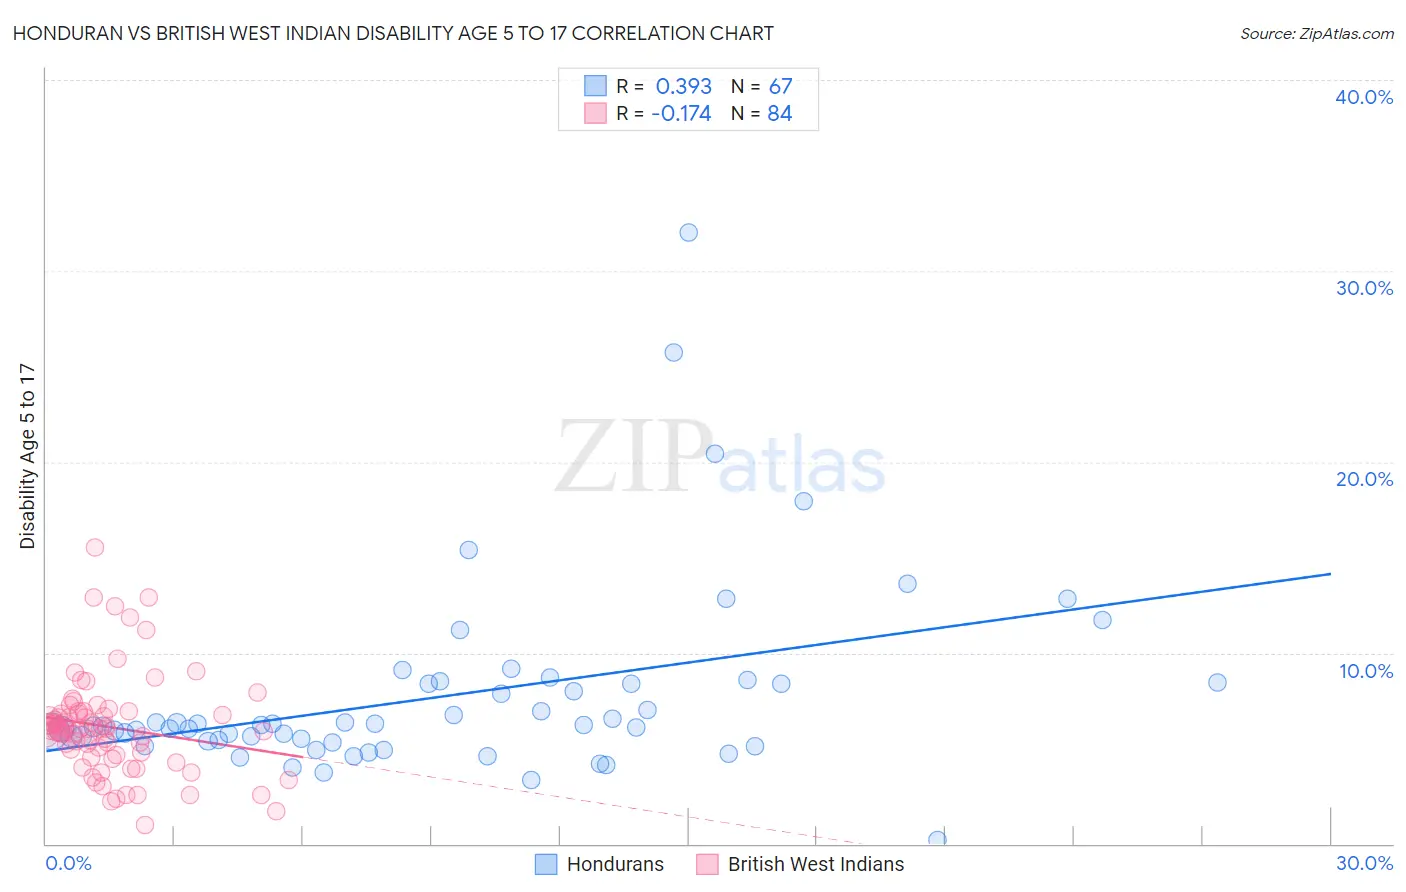
Honduran vs British West Indian Disability Age 5 to 17 Correlation Chart
The statistical analysis conducted on geographies consisting of 355,946,713 people shows a mild positive correlation between the proportion of Hondurans and percentage of population with a disability between the ages 5 and 17 in the United States with a correlation coefficient (R) of 0.393 and weighted average of 5.9%. Similarly, the statistical analysis conducted on geographies consisting of 152,257,483 people shows a poor negative correlation between the proportion of British West Indians and percentage of population with a disability between the ages 5 and 17 in the United States with a correlation coefficient (R) of -0.174 and weighted average of 5.8%, a difference of 1.6%.
Disability Age 5 to 17 Correlation Summary
| Measurement | Honduran | British West Indian |
| Minimum | 0.17% | 1.0% |
| Maximum | 32.0% | 15.5% |
| Range | 31.8% | 14.5% |
| Mean | 7.7% | 6.1% |
| Median | 6.2% | 6.0% |
| Interquartile 25% (IQ1) | 5.4% | 4.7% |
| Interquartile 75% (IQ3) | 8.4% | 6.9% |
| Interquartile Range (IQR) | 3.0% | 2.2% |
| Standard Deviation (Sample) | 5.0% | 2.6% |
| Standard Deviation (Population) | 5.0% | 2.6% |
Similar Demographics by Disability Age 5 to 17
Demographics Similar to Hondurans by Disability Age 5 to 17
In terms of disability age 5 to 17, the demographic groups most similar to Hondurans are Immigrants from Cambodia (5.9%, a difference of 0.020%), Polish (5.9%, a difference of 0.040%), Scandinavian (5.9%, a difference of 0.070%), Immigrants from Ghana (5.9%, a difference of 0.16%), and Barbadian (5.9%, a difference of 0.17%).
| Demographics | Rating | Rank | Disability Age 5 to 17 |
| Immigrants | Micronesia | 1.9 /100 | #245 | Tragic 5.9% |
| Tlingit-Haida | 1.9 /100 | #246 | Tragic 5.9% |
| Immigrants | Honduras | 1.8 /100 | #247 | Tragic 5.9% |
| British | 1.7 /100 | #248 | Tragic 5.9% |
| Immigrants | Ghana | 1.7 /100 | #249 | Tragic 5.9% |
| Poles | 1.5 /100 | #250 | Tragic 5.9% |
| Immigrants | Cambodia | 1.5 /100 | #251 | Tragic 5.9% |
| Hondurans | 1.5 /100 | #252 | Tragic 5.9% |
| Scandinavians | 1.4 /100 | #253 | Tragic 5.9% |
| Barbadians | 1.3 /100 | #254 | Tragic 5.9% |
| Italians | 1.2 /100 | #255 | Tragic 5.9% |
| Hopi | 1.0 /100 | #256 | Tragic 5.9% |
| Hispanics or Latinos | 1.0 /100 | #257 | Tragic 5.9% |
| Brazilians | 0.9 /100 | #258 | Tragic 5.9% |
| Slavs | 0.9 /100 | #259 | Tragic 5.9% |
Demographics Similar to British West Indians by Disability Age 5 to 17
In terms of disability age 5 to 17, the demographic groups most similar to British West Indians are Guamanian/Chamorro (5.8%, a difference of 0.040%), Mexican (5.8%, a difference of 0.060%), Swiss (5.8%, a difference of 0.080%), Alsatian (5.8%, a difference of 0.12%), and Haitian (5.8%, a difference of 0.16%).
| Demographics | Rating | Rank | Disability Age 5 to 17 |
| Sierra Leoneans | 7.0 /100 | #219 | Tragic 5.8% |
| Belgians | 6.9 /100 | #220 | Tragic 5.8% |
| Lithuanians | 6.7 /100 | #221 | Tragic 5.8% |
| Immigrants | Sudan | 6.7 /100 | #222 | Tragic 5.8% |
| Alsatians | 6.0 /100 | #223 | Tragic 5.8% |
| Mexicans | 5.7 /100 | #224 | Tragic 5.8% |
| Guamanians/Chamorros | 5.6 /100 | #225 | Tragic 5.8% |
| British West Indians | 5.4 /100 | #226 | Tragic 5.8% |
| Swiss | 5.1 /100 | #227 | Tragic 5.8% |
| Haitians | 4.8 /100 | #228 | Tragic 5.8% |
| Bangladeshis | 4.8 /100 | #229 | Tragic 5.8% |
| Ghanaians | 4.7 /100 | #230 | Tragic 5.8% |
| Europeans | 4.5 /100 | #231 | Tragic 5.8% |
| Immigrants | Laos | 3.8 /100 | #232 | Tragic 5.8% |
| Immigrants | West Indies | 3.5 /100 | #233 | Tragic 5.8% |